mn food safety and defense task force meeting minutes …
TRANSCRIPT

Page 1 of 3
MN FOOD SAFETY AND DEFENSE TASK FORCE Meeting Minutes
July 17, 2018
Today’s meeting was held in Room 215, U of M Ben Pomeroy Student-Alumni Learning Center, St. Paul. Courtney Bidney called the meeting to order at 1:31 PM. Members present included: Caldoun Abuhakel, Courtney Bidney, Cecilia Coulter, Angie Cyr (for Steven Diaz), Chris Gindorff, Annalisa Hultburg, Lorrene (Lolly) Occhino, Susan Palchick, and Ben Warren. Visitors present included: James Backstrom, Jill Ball, Brett Boswell, Lauri Clements, Alex Cortes, Gwynn Datsko, Kim Janer, Jane Jewett, Joe Jurusik, Rima Kapadia, Jan Kelly, Shaun Kennedy, Penny Norquist, Carrie Rigdon, Julia Selleys, Natalie Vandenburgh, and Myah Walker. 1. Dates and links
The next Food Safety and Defense Task Force (FSDTF) Meeting will be Thursday, September 20, at the Orville Freeman Building, 625 Robert Street North, St. Paul from 1:30-4:30 PM.
Food Defense Training, hosted by the Food Protection and Defense Institute – August 28 and 29, 2018: https://learning.umn.edu/search/publicCourseSearchDetails.do?method=load&courseId=12769562
USDA FSIS Petition 18-05 to change Product of U.S.A. is available for public comment until August 17, 2018: https://www.fsis.usda.gov/wps/portal/fsis/topics/regulations/petitions
South Dakota Food Safety Summit, hosted by SDSU Extension and USDA FSIS – October 11, 2018 in Brookings, SD http://igrow.org/events/2018-south-dakota-food-safety-summit/
2. The minutes from the May 14, 2018 meeting were approved. 3. Member and Visitor Updates:
Courtney Bidney (General Mills): Courtney mentioned working on standards of identity for yogurt products. Jane Jewett (Minnesota Institute for Sustainable Agriculture (MISA)): Jane has been involved in getting the Food Innovation Team off the ground, farmers market aggregation project, and on-farm food service regulations. Alex Cortes (Minnesota Department of Agriculture (MDA)): The Produce Safety Program is rolling out lots of trainings and working on program development.
Page 2 of 3
Lolly Occhino (AURI): AURI serves as a facilitator for peer-to-peer food safety network. Lolly invited participants of the network to attend this task force meeting. Chris Gindorff (Lunds & Byerlys): Chris attended the Food Defense Certification course hosted by the Food Protection and Defense Institute in May and is working on the company’s food defense program. Shaun Kennedy (FSI/U of M): Shaun is part of a new Foundation of Food and Agriculture research grant to create nationwide system to improve disease preparedness, starting with poultry. James Backstrom (Minnesota Department of Health (MDH)): James is a health inspection supervisor in northeast Minnesota, based in Duluth, and his group have been very busy doing inspections at seasonal establishments. Natalie Vandenburgh (The Good Acre): First time at a Task Force meeting. Joe Jurusik (Hennepin County Environmental Health): Joe was invited by Susan Palchick. Angie Cyr (MDH): The new food code is moving forward with effective date of January 1, 2019. Myah Walker (Sparboe Farms): Interested in Shaun Kennedy’s project on poultry recovery. Following the Salmonella Brandenburg outbreak and looking to see what comes out of that.
Jan Kelly (MDA): The manufactured food program is still working on FSMA inspections; now have 2 people fully trained and another 6 in stages of training for those inspections. There are a number of investigations going on right now. We are also wrapping up contract work with FDA for the year. Brett Boswell (MDA): First time attendee. The commercial feed program is in the midst of FSMA applications and getting ready for that. Penny Norquist (Food Protection and Defense Institute (FPDI)): The U of M doing restructuring. FPDI is moving from the Academic Health Center to the Office of Academic Research. FPDI hosted a food defense conference in May along with training. The training class was full and holding another training on Aug 28-29. Lauri Clements (Olmsted County Public Health): Lauri mentioned she is also a member of LFAC. Olmsted County is responding to a water issue.
Rima Kapadia (SuperValu): We are enhancing our supplier management tool and rolled out a new recall process. Ben Warren (Land O’Lakes): We are working with dairies to meet the intentional adulteration rule. There is also a new company initiative to look at robotics and artificial intelligence. On the animal feed side, we are also getting ready for FSMA inspections. Gwen Datsko (USDA FSIS): There is a petition available for public comments to change Product of U.S.A. policy. Deadline for comment is August 17. The Des Moines District is planning a food safety

Page 3 of 3
summit with South Dakota State University on October 11 in Brookings, SD; topics include minimizing STECs, labeling, product recalls, and agency updates. Susan Palchick (Hennepin County Environmental Health): We are in the midst of negotiations with MDA on the delegation agreement.
4. Produce Safety Alex Cortes, MDA, and Annalisa Hultburg, U of M, presented on grower training updates and
water issues associated with the federal Produce Safety Rule.
5. Minnesota Task Force Terms of Reference Carrie Rigdon, MDA, led the discussion on the updates to the terms of reference (ToR). The
decision was made to have task force voting members cast their vote for adoption of the new
ToR though an online survey to take place in the next few weeks after the July meeting.
6. FIT Governance Jane Jewett, U of M, gave an overview of the Food Innovation Team (FIT) concept. The selection of the FIT members had not been finalized by the time of this meeting so additional updates were tabled until the next meeting.
7. Bioengineered Food Overview
Courtney Bidney, General Mills, presented an overview of the National Bioengineered Food
Disclosure Standard.
8. Agenda Items for Next Time
Ben Warren, Land O’Lakes – New company initiative to look at robotics and artificial intelligence
Shaun Kennedy, FSI – Foundation of Food and Agriculture research grant to create nationwide system to improve disease preparedness, starting with poultry

MN FOOD SAFETY AND DEFENSE TASK FORCE Meeting Minutes
July 17, 2018
Attachment 1 Produce Safety Grower Training Updates

Produce Safety - Grower Training Updates
Alexandra Cortes (MDA) & Annalisa Hultberg (UMN Extension)
7/17/18

The Produce Safety Rule – a nutshell
• Part of the Food Safety Modernization Act (FSMA)
• Standards for the growing, packing, harvesting, and/or holding of produce for human consumption
• New standards, new population
• Three ‘buckets’ that produce farmers can fall under:• Excluded
• Qualified Exempt
• Covered
• Depends on $ sales, products, customer(s)

The Produce Safety Rule – who falls under what?
• Excluded: less than $25k in annual produce sales
• Qualified exempt: between $25 - $500k in annual FOOD sales AND
• > 50% of those sales are to qualified end-users• Farm stands, grocery stores, restaurants…
• Same state or Indian reservation or within 275 mile radius of the farm
• Of note:• Rarely consumed raw produce
• Produce destined for a kill-step
• Inflation

Compliance dates

The MDA Produce Safety Program
Education and Outreach
Farm Inventory
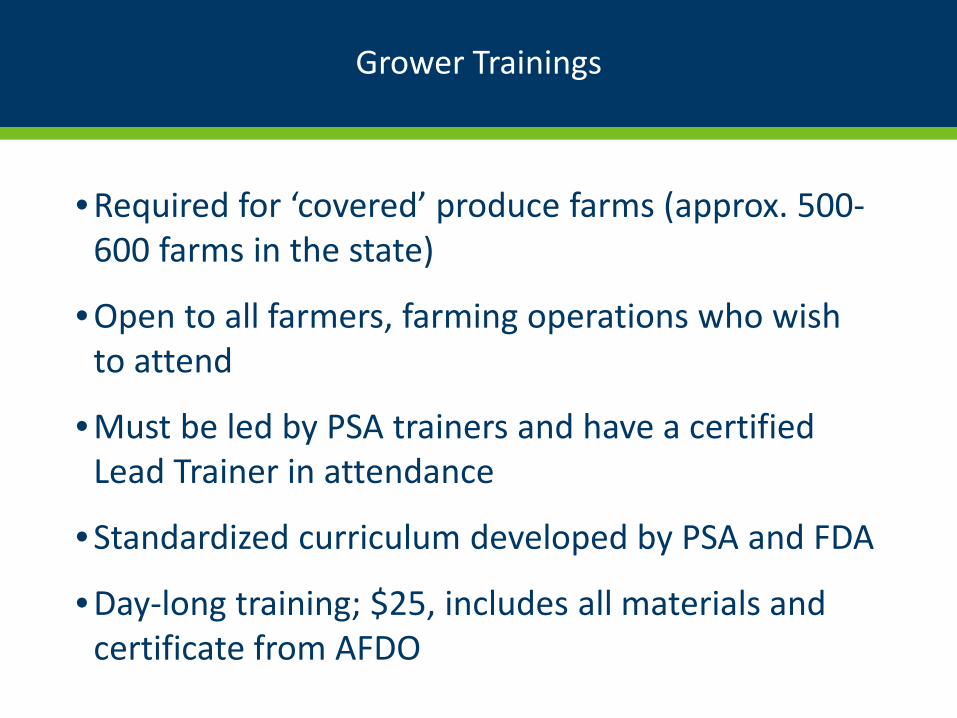
Grower Trainings
• Required for ‘covered’ produce farms (approx. 500-600 farms in the state)
• Open to all farmers, farming operations who wish to attend
• Must be led by PSA trainers and have a certified Lead Trainer in attendance
• Standardized curriculum developed by PSA and FDA
• Day-long training; $25, includes all materials and certificate from AFDO


MN Grower Training Process
• 2-day Produce Safety Alliance Train the Trainer in Nov 2017
• Minnesota Trainer pool: 8 produce farmers, 5 MDA staff, 4 UMN Extension Staff, 9 others (very diverse!)
• Substantial continuing education needed for all trainers –the Rule is new, not-finalized, complex and challenging
• Produce farmer trainers paid training stipend
• Goals: • each trainer specializes in 3-4 modules
• brings material to life and knows regulation and on-farm reality
• These are GOOD trainings!

Highlights from 2018 Grower Trainings
• 5 Grower Trainings from Jan-April 2018 around the state
• 143 farmers in attendance
• ~20% percent were ‘covered’ farms

Grower Trainings

Grower Trainings

Thoughts from Growers
• Common questions from farmers before training:• What is the difference between FSMA PSR and GAP audits?
• I have attended a GAP workshop with you in the past, do I have to come to this training too?
• Am I covered by the Rule?
• Common thoughts during and after training:• Wow, this is complicated!
• This is a lot of information for one day!
• This was a lot better/more interesting/useful than I was expecting!
• Whew, I am not covered by the rule (with our caveats of course)

Grower Training Evaluation Data
• In collaboration with ISU NCR FSMA training center, all attendees complete pre- and post-knowledge test (same evaluation offered nationwide for comparison).
• All attendees complete required PSA evaluation: ranks knowledge gained and quality of trainer in each module
• Eval gathers basic demographic info, covered or not
• We document all data before sending evals back to PSA
• Great source of longitudinal data on grower’s questions, knowledge, and farm status

Training evaluations – 136 forms
• Training well organized• 100% Yes (n = 116)
Avg Module by Module evaluation summary:
• Module increased my knowledge of XYZ • 92% Strongly Agree or Agree (n= 1079)
• Confident that I can implement practices to address XYZ• 92% SA or A (n= 1076)
• Instructor effective at delivering content of XYZ module• 93% SA or A (n= 1067)
• Instructor was able to answer questions re: XYZ module• 95% SA or A (n= 1069)

Evaluations per module
• Module increased my knowledge
• #1 - Postharvest Handling (77% SA; n = 134)
• #2 - Agricultural Water – Production (73% SA; n = 136)
• #8 – Soil Amendments (58% SA; n = 136)• 83% SA or A
• Confident to implement practices
• #1 – Postharvest Handling (66% SA; n = 134)
• #2 – Worker Training (63% SA; n = 136)
• #8 – Soil Amendments (54%; n = 136)• 86% SA or A

On Farm Readiness Review program
• Farm visits from UMN extension and MDA Produce Safety Program staff beginning early fall 2018
• Help determine readiness for inspections, if needed
• Confidential
• Voluntary
• Farm must have attended Grower Training and be covered by the Rule

Everything water
• Changes coming to water portion of rule
• Compliance dates pushed back to 2022
• Most challenging to understand, implement
• Three types of water: municipal, ground water, and surface water
• Type determines testing frequency (surface: 20 samples over 2-4 years, ground: 4 times per year first year and then 1 time annually).
• Water must be testing using 9 approved methods (does not need to be a certified lab)
• Testing for presence of generic E. coli: no detect in postharvest uses, certain allowances for irrigation water
• Support via water lab mapping

Water Laboratories in MN that offer approved methods for testing agricultural water for growers
Final product will be factsheet and map that includes names, contact info, tests offered
Hosting educational meeting for labs in September on water provisions under FSMA Produce Safety Rule

On the horizon
• 14 grower trainings scheduled Nov. - March
• Targeted promotions to covered growers
• Outreach with specific farming communities
• Ex. Hmong, Spanish-speaking, Amish
• Inspections will begin in 2019


MN FOOD SAFETY AND DEFENSE TASK FORCE Meeting Minutes
July 17, 2018
Attachment 2 Bioengineered Food Overview

Overview of the
National Bioengineered Food Disclosure
Standard
May 29, 2018
www.ams.usda.gov/be

Presentation Overview
I. Introduction and Background
II. Applicability
III. Disclosure
IV. Administrative Provisions
V. Regulatory Flexibility Analysis, Regulatory Impact Analysis

Public Law 114-216
The Law amended the Agricultural
Marketing Act of 1946 and was signed on
July 29, 2016.
The Law directs the Secretary to establish
the National Bioengineered Food Disclosure
Standard for disclosing bioengineered food
and food that may be bioengineered.

Applicability
What foods are subject to the NBFDS?
1.Federal Food, Drug, and Cosmetic Act
2.Federal Meat Inspection Act
3.Poultry Products Inspection Act
4.Egg Products Inspection Act

Applicability
Meat, Poultry and Egg Products
? ? ?

Applicability
The term bioengineering, and any similar term,
as determined by the Secretary, with respect to a
food, refers to a food:
(A) that contains genetic material that has
been modified through in vitro recombinant
deoxyribonucleic acid (DNA) techniques; and
(B) for which the modification could not
otherwise be obtained through conventional
breeding or found in nature.

Applicability
Commercially Available BE Foods
Highly AdoptedCanola – 90%
Corn, Field – 92%
Cotton – 93%
Soybean – 94%
Sugar Beet – 100%
Not Highly AdoptedApple, Non-browning cultivars
Corn, Sweet
Papaya
Potato
Squash, Summer varieties

Applicability
Factors and Conditions
Petition/request for determination of factor or condition.
AMS reviews petition/request using standards for consideration
If petition/request satisfies the standards for consideration, AMS would initiate rulemaking

II. Applicability
Factors and Conditions
1.Whether incidental additives present in food
should be considered “bioengineered food”
2.Whether the modified genetic material in a
food may be detected.

Applicability
Exemptions
1.Food served in a restaurant or similar
retail food establishment
2.Very small food manufacturers
3.Threshold
4.Animals fed with bioengineered feed and
their products
5.Food certified under the National Organic
Program

Disclosure
Who would make disclosures?
1. Food manufacturers
2. Importers
3. Retailers who:
a) Package and label foods for retail sale
b) Display and sell bulk food items

Importsand
Mutual Recognition Arrangements
As proposed, by mutual agreement, the
bioengineered food labeling laws of a trading
partner could be recognized as sufficient to
meet NBFDS requirements and vice versa.

Lists of bioengineered foods commercially
available in the United States
• Highly adopted – 85% or more of US plantings of
these crops are bioengineered: Canola, field
corn, cotton, soybean and sugarbeet.
• Non-highly adopted – Less than 85% of US
plantings of these crops are bioengineered: Non-
browning apple cultivars, sweet corn, papaya,
potato, summer squash
Bioengineered foods on either list would be
subject to disclosure.

Disclosure Options
Written Text
“Bioengineered food” or “Contains a bioengineered food ingredient”
(For foods on either list of commercially available bioengineered food)
“May be bioengineered food” or “May contain a bioengineered food ingredient”
(Only for foods on the list of non-highly adopted bioengineered food)

Disclosure Options
Symbols
The proposed rule offers three alternatives for comment
Symbols may be full color or black and white

Disclosure Options
Electronic or Digital Disclosures
• QR codes
• Digital watermarks
• To be accompanied by instructions to “Scan here for
more food information” or “Scan anywhere on package
for more food information”

Electronic Disclosure Study
• Mandated by Congress
• Completed and published September 2017
• Evaluates nationwide consumer access to electronic and digital
disclosures
• Secretary will determine whether it would be appropriate to offer a
fourth disclosure option
• AMS has proposed text messages as a possible fourth option
• Consumer would be able to type in a numeric code and receive food
information in response via text messaging

Additional Disclosure Flexibilities
Small food manufacturers (annual receipts $2.5 to $10 million)
Telephone number to call for food information
Internet website to access for food information
Small food packages = less than 40 square inches surface area
Would be able to use modified standard disclosures
Very small food packages = less than 12 square inches surface area
Would be able to use modified standard disclosures or preexisting phone numbers and
URLs to provide food information

Foods Sold in Bulk Containers
• Retailers would be responsible for disclosure
• Would be able to use any of the standard disclosure options
• Disclosures would be placed on signage or other materials on or
near the bulk food items

Voluntary Disclosure
• Requested by commenters
• Food meets proposed definition of bioengineered food, but would be
exempt from disclosure (For example, a very small food
manufacturer not required to make a disclosure)
• If making a voluntary disclosure is desired, any of the standard
disclosure options may be used
• Voluntary disclosures would be required to comply with requirements
applicable to standard disclosure options

Recordkeeping Requirements
• Everyone subject to mandatory bioengineered food disclosure would
be required to keep sufficient records to establish compliance with
the standard
• Customary and usual records would be generated in the course of
normal business – no new records or forms are proposed
• Individuals would determine which records to maintain provided they
are sufficient to demonstrate compliance
• Records may be in any format (hard copy or electronic)
• Records may be stored at any business location

Types of Records to Maintain
Individuals would be able determine what business records to maintain
provided that they demonstrate compliance with the disclosure
standard.
Examples of possible records to keep include
Invoices
Bills of lading
Inventory records
Supply chain records
Process verifications
Organic certifications
Laboratory test results

How Recordkeeping Applies to Disclosure
• For non-disclosure of foods on either list of commercially available
bioengineered foods, records would need to verify that the food is
not bioengineered
• For positive disclosure of foods on either list, records would simply
identify the food (e.g. “Cornmeal”)
• For “may” claims on foods from the non-highly adopted
bioengineered food list, records would simply identify the food
(e.g. “Papaya”)

More on “May” Claims
• Would be limited to use for foods on the list of commercially available, but
not highly adopted, bioengineered foods
• Would be made using any of the disclosure options (written text, symbol,
electronic, text message, phone number, or website), as appropriate

More on Recordkeeping• Records would be required to be maintained for two years after the
food is offered for retail sale
• Some records, such as process verifications, may be required to be
retained longer, as necessary to demonstrate compliance with
disclosure requirements
• When requested by USDA, records would be required to be
produced within five business days, unless an extension is granted
by USDA
• When on-site access to records is required by USDA, three days’
notice would be provided by USDA, unless an extension is granted

Enforcement• Failure to make a bioengineered food disclosure as required by the
NBFDS is prohibited
• Complaints about possible violations of the NBFDS would be made
to AMS
• AMS would determine whether further investigation is warranted
• AMS would conduct a records audit
• The regulated entity would be notified about the results of the audit
or investigation

Enforcement (continued)
• Regulated entities would be able to appeal the results of
an audit or investigation
• Following an appeals hearing, AMS would notify the
regulated entity of its final determination in the matter
• The results of the audit or investigation would be posted
to AMS’s website

Proposed Effective and Compliance Dates
• The final rule would become effective 60 days after publication in the
Federal Register
• Proposed initial compliance date of January 1, 2020, is intended to
align with proposed extended compliance dates for FDA labeling and
serving size rules
• A delayed compliance date of January 1, 2021, is proposed for small
food manufacturers
• Entities with existing label inventories would be allowed to use them
up or until January 1, 2022, whichever comes first

Impact on Small Businesses
• Description of Businesses Directly and Indirectly Covered by the
Proposal
• Statutory Provisions Related to Mitigating Impact on Small Business
• Evaluating Impact Using Cost to Revenue Ratio

Businesses Covered• Proposal would apply directly to food manufacturers, dietary
supplement manufacturers, and retailers who sell products in bulk
• Number of firms potentially impacted (by size category)
• Approximately 40,000 firms indirectly affected (96 percent of which
are small)
Very Small Small Food
Manufacturer
Small Businesses Large Businesses Total
Food Manufacturers 18,000 3,000 3,000 1,000 25,000
Dietary Supplement
Manufacturers
180 70 120 20 390
Retailers N/A N/A N/A N/A 142,000

Reducing Impact on Small Business
Statute exempts “very small food manufacturers”• Proposal defines food and dietary supplement manufacturers with annual
revenues below $2,500,000 as very small
• Exempts 74 percent of food manufacturers and 45 percent of supplement
manufacturers. Maintains coverage of 96 percent and 98 percent of products
respectively
Statute provides additional year to comply for “small food
manufacturers”
• Proposal defines food and dietary supplement manufacturers with annual
revenues below $10,000,000 as small consistent with FDA labeling standards
• 86 percent of food manufacturers and 64 percent of dietary supplement
manufacturers meet this definition

Potential Impact to Food Manufacturers
Compared upper bound annualized cost to firm
revenues at a seven percent discount rateTable 36: Cost to Revenue Ratios for Food Manufacturers by Revenue Classification
ENTERPRISE RECEIPT SIZE NUMBER
OF FIRMS
ANNUAL
PAYROLL
($1,000)
ESTIMATED
RECEIPTS
($1,000)
Percent of
Firms
Percent of
Receipts
Annualized
Cost
($1,000)
Cost/Revenue Ratio
Total 24,874 59,447,985 787,095,654 100% 100% 410000 0.05%
<100,000 4,962 71,910 49,521 20% 0% 496 1.00%
100,000-499,999 6,143 453,230 1,744,160 25% 0% 3126 0.18%
500,000-999,999 3,425 540,554 2,399,048 14% 0% 3728 0.16%
1,000,000-2,499,999 3,821 1,143,176 5,923,937 15% 1% 7884 0.13%
2,500,000-4,999,999 1,854 1,128,772 6,323,360 7% 1% 7785 0.12%
5,000,000-7,499,999 794 798,934 4,636,029 3% 1% 5510 0.12%
7,500,000-9,999,999 486 645,847 4,025,187 2% 1% 4454 0.11%
10,000,000-14,999,999 669 1,175,626 7,634,675 3% 1% 8108 0.11%
15,000,000-19,999,999 355 770,707 5,734,325 1% 1% 5315 0.09%
20,000,000-24,999,999 283 811,275 5,984,273 1% 1% 5595 0.09%
25,000,000-29,999,999 202 688,622 5,205,359 1% 1% 4749 0.09%
30,000,000-34,999,999 156 597,983 4,664,275 1% 1% 4124 0.09%
35,000,000-39,999,999 122 554,643 4,142,321 0% 1% 3825 0.09%
40,000,000-49,999,999 178 864,342 7,031,428 1% 1% 5961 0.08%
50,000,000-74,999,999 319 1,941,093 17,424,495 1% 2% 13387 0.08%
75,000,000-99,999,999 175 1,513,479 13,428,642 1% 2% 10438 0.08%
100,000,000+ 930 45,747,792 690,744,619 4% 88% 315513 0.05%

Potential Impact to Dietary Supplement
ManufacturersTable 37: Cost to Revenue Ratios Dietary Supplement Manufacturers by Revenue ClassificationENTERPRISE RECEIPT SIZE NUMBER OF FIRMS ANNUAL PAYROLL
($1,000)
ESTIMATED RECEIPTS ($1,000) Percent of Firms Percent of Receipts Annualized Cost ($1,000) Cost/Revenue Ratio
Total 394 2,461,491 13,358,607 100% 100% 31360 0.23%
<100,000 29 426 0 7% 0% 5 No Reported Revenue
100,000-499,999 37 2,407 13,912 9% 0% 31 0.22%
500,000-999,999 37 5,394 29,000 9% 0% 69 0.24%
1,000,000-2,499,999 75 29,696 126,057 19% 1% 378 0.30%
2,500,000-4,999,999 55 42,409 182,218 14% 1% 540 0.30%
5,000,000-7,499,999 12 13,959 70,272 3% 1% 178 0.25%
7,500,000-9,999,999 7 14,304 63,036 2% 0% 182 0.29%
10,000,000-14,999,999 21 45,749 251,402 5% 2% 583 0.23%
15,000,000-19,999,999 14 53,192 231,082 4% 2% 678 0.29%
20,000,000-24,999,999 12 56,803 235,221 3% 2% 724 0.31%
25,000,000-29,999,999 8 31,496 167,216 2% 1% 401 0.24%
30,000,000-34,999,999 6 25,279 137,924 2% 1% 322 0.23%
35,000,000-39,999,999 5 26,429 179,352 1% 1% 337 0.19%
40,000,000-49,999,999 6 0 0 2% 0% 0 No Reported Revenue
50,000,000-74,999,999 18 179,233 975,448 5% 7% 2283 0.23%
75,000,000-99,999,999 1 0 0 0% 0% 0 No Reported Revenue
100,000,000+ 51 1,878,179 10,356,257 13% 78% 23928 0.23%

Potential Impact to RetailersTable 35: Cost to Revenue Ratios for Food and Dietary Supplement Retailers by Revenue Classification
Enterprise Receipt SizeNumber of
Firms
Annual Payroll
($1,000)
Estimated Receipts
($1,000)
Percent of
Firms
Percent of
Receipts
Annualized Cost
($1,000)
Cost/Revenue
Ratio
Total 142,346 89,356,338 874,354,889 100% 100% 21160 0.00%
<100,000 13,249 148,773 707,959 9% 0% 35 0.00%
100,000-499,999 47,884 1,729,902 13,442,071 34% 2% 410 0.00%
500,000-999,999 28,918 2,215,996 20,625,343 20% 2% 525 0.00%
1,000,000-2,499,999 28,060 4,830,013 43,955,174 20% 5% 1144 0.00%
2,500,000-4,999,999 12,901 4,845,133 44,677,197 9% 5% 1147 0.00%
5,000,000-7,499,999 4,422 2,859,141 26,256,212 3% 3% 677 0.00%
7,500,000-9,999,999 1,988 1,829,506 16,513,423 1% 2% 433 0.00%
10,000,000-14,999,999 1,849 2,367,964 20,949,064 1% 3% 561 0.00%
15,000,000-19,999,999 796 1,392,853 12,435,957 1% 2% 330 0.00%
20,000,000-24,999,999 408 877,529 7,878,198 0% 1% 208 0.00%
25,000,000-29,999,999 249 668,356 5,616,010 0% 1% 158 0.00%
30,000,000-34,999,999 187 548,687 4,980,920 0% 1% 130 0.00%
35,000,000-39,999,999 127 375,793 3,386,627 0% 0% 89 0.00%
40,000,000-49,999,999 188 703,781 6,671,626 0% 1% 167 0.00%
50,000,000-74,999,999 218 1,121,868 9,449,270 0% 1% 266 0.00%
75,000,000-99,999,999 123 729,491 6,132,813 0% 1% 173 0.00%
100,000,000+ 779 62,071,005 630,453,005 1% 69% 14699 0.00%
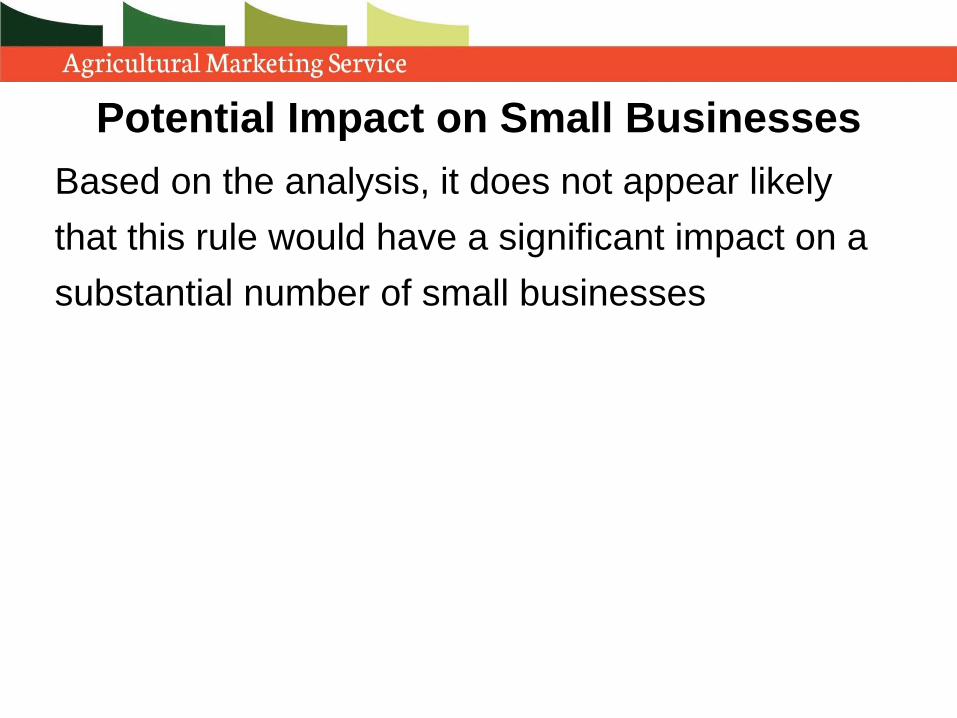
Potential Impact on Small Businesses
Based on the analysis, it does not appear likely
that this rule would have a significant impact on a
substantial number of small businesses

Economic
Impact
Analysis
Table 1: Total CostsScope 1 - No exempted foods*(Very small manufacturer<$2.5 million annual revenue; compliance period includes label use up)
Lower bound($million)
Upper bound($million)
Initial costsAdministrative – Food manufacturers 317 2,509Administrative – Supplement manufacturers 39 303Administrative – Retail 17 138Printing – Food manufacturers 92 260Printing – Supplement manufacturers 48 145Signage – Retail 4 41
BE replacement – Food and supplement manufacturers(administrative plus segregation costs) 213 1,010BE replacement – Retail(administrative plus segregation costs)
11 36Adjustment to administrative, printing and signage costs to account for percentage of market that goes non-BE
-145 -929USDA costs for administering the rule 2 2Total initial costs 598 3,515
Ongoing costsBE replacement – Food and supplement manufacturers(recordkeeping plus segregation costs)
103 210BE replacement – Retail(recordkeeping plus segregation costs)
9 13USDA costs for administering the rule 2 2Total ongoing costs 114 225
Annualizations 20 years
Annualized at 3 percent (3%) 154 461Annualized at 7 percent (7%) 170 557
PerpetuityAnnualized at 3 percent (3%) 132 330Annualized at 7 percent (7%) 156 471

Top 50
Ingredients
Subject to
the NBFDS
Table 5: Top 50 ingredients triggering disclosure for food products under Scope 1 (and the proportion of labels listing the ingredient)
Ingredients 1-25 Ingredients 26-50Sugars (39%) Artificial Flavor (6%)Natural Flavor (25%) Sodium Citrates (4%)Citric Acid (24%) Yeast Extract (4%)Spice (15%) Flavor (4%)Lecithin (soy) (15%) Malt Flour (Barley) (4%)Riboflavin (Vitamin B2) (15%) Soybean (4%)Soy Bean Oil (13%) Molasses (4%)Corn Syrup (12%) Brown Sugar (4%)Enzyme (11%) Distilled Vinegar (4%)Dextrose (11%) Chocolate (3%)Xanthan Gum (10%) Sodium Carboxymethylcellulose (3%)Natural and Artificial Flavor (10%) Cheese (cheddar) (3%)Corn Starch (9%) MSG (3%)Canola Oil (9%) Corn Syrup Solids (3%)Mono and Diglycerides of Fatty Acids (9%) Vanilla (3%)Modified Starch (Corn) (8%) Malic Acid (3%)Maltodextrin (8%) Partially Hydrogenated Soy Oil (3%)High Fructose Corn Syrup (8%) Rice Flour (3%)Vitamin C (7%) Corn (3%)Cheese Culture (7%) Corn Oil (2%)Yeast (6%) Potatoes (2%)Vegetable Oil (6%) Corn Flour (2%)Modified Food Starch (6%) Soy Flour (2%)Vinegar (6%) Potato Starch (2%)Flour (6%) Cheese (parmesean) (2%)
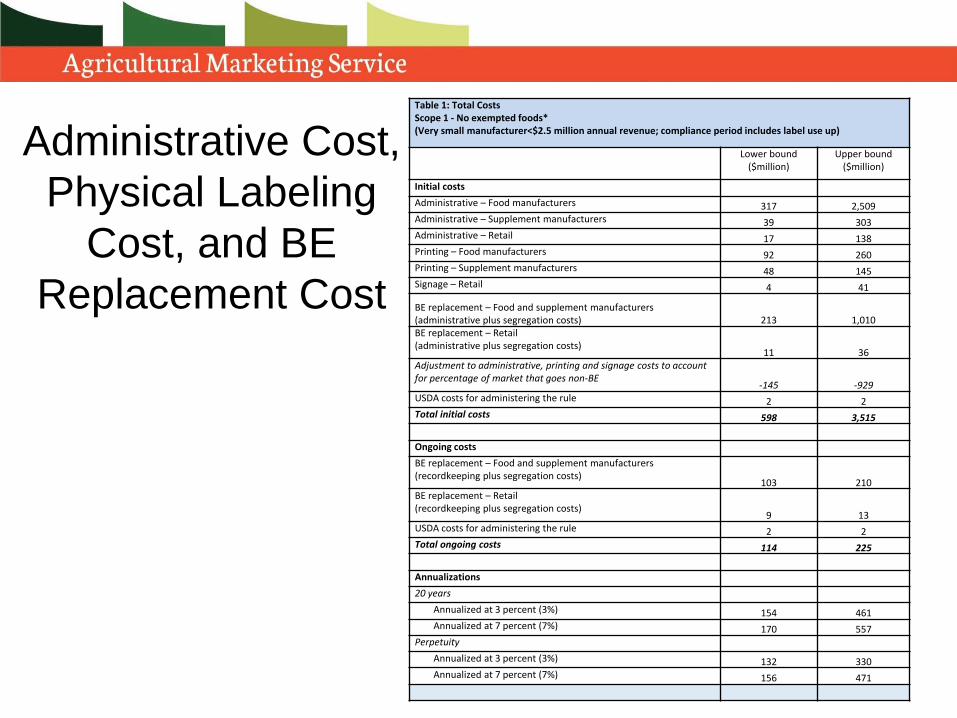
Administrative Cost,
Physical Labeling
Cost, and BE
Replacement Cost
Table 1: Total CostsScope 1 - No exempted foods*(Very small manufacturer<$2.5 million annual revenue; compliance period includes label use up)
Lower bound($million)
Upper bound($million)
Initial costsAdministrative – Food manufacturers 317 2,509Administrative – Supplement manufacturers 39 303Administrative – Retail 17 138Printing – Food manufacturers 92 260Printing – Supplement manufacturers 48 145Signage – Retail 4 41
BE replacement – Food and supplement manufacturers(administrative plus segregation costs) 213 1,010BE replacement – Retail(administrative plus segregation costs)
11 36Adjustment to administrative, printing and signage costs to account for percentage of market that goes non-BE
-145 -929USDA costs for administering the rule 2 2Total initial costs 598 3,515
Ongoing costsBE replacement – Food and supplement manufacturers(recordkeeping plus segregation costs)
103 210BE replacement – Retail(recordkeeping plus segregation costs)
9 13USDA costs for administering the rule 2 2Total ongoing costs 114 225
Annualizations 20 years
Annualized at 3 percent (3%) 154 461Annualized at 7 percent (7%) 170 557
PerpetuityAnnualized at 3 percent (3%) 132 330Annualized at 7 percent (7%) 156 471

Administrative
Costs
Table 8b: Scope 1 Manufacturers’ administrative costs, very small cutoff at less than $2.5 million annual receipts (in 2017 dollars)
Number of UPCs
$Cost/UPC
Total$million
Row Food1 Very small manufacturer exemption
30,0002 Organic or non-BE certified 80,000 0 03 Meat 55,000 341-2,971 19-1634 No BE ingredients 125,000 376-3,084 47-386
Products with disclosure:5 low cost analysis 330,000 376-3,084 124-1,0186 medium cost analysis 110,000 811-6,106 89-6727 high cost analysis 35,000 1,074-7,745 38-2718 Total Food 760,000 N/A 317-2,509
Dietary Supplements9 Very small manufacturer exemption
1,00010 Organic or non-BE certified 3,000 0 011 No BE ingredients 10,000 376-3,084 4-30
Products with disclosure:12 low cost analysis 13,000 376-3,084 5-4013 medium cost analysis 38,000 811-6,106 31-23214 Total Dietary Supplements 64,000 N/A 39-303
Numbers may not sum due to rounding, including rounding of UPC estimates to nearest 5,000 for food and the nearest 1,000 for dietary supplements to account for uncertainty.

Physical Labeling Costs
Table 11: Scope 1 physical printing costs for food manufacturers with and without the label use-up provision (2017 dollars)
Compliance Alternative Very small definition No Label Use Up
($million) Label Use Up ($million)
Receipts less than $500,000 1180-2970 92-260 Receipts less than $2,500,000 1170-2940 92-260 Receipts less than $5,000,000 1160-2930 92-260
Table 11a: Scope 1 physical printing costs for dietary supplement manufacturers with and without the label use-up provision (2017 dollars)
Compliance Alternative Very small definition No Label Use Up
($million) Label Use Up ($million)
Receipts less than $500,000 128-277 49-146 Receipts less than $2,500,000 126-273 48-145 Receipts less than $5,000,000 125-271 48-145

Retail Administrative and Signage Costs
Table 12: Retail administrative and signage costsFirms
44,823Establishments
68,835Total
Administrative Costs($376-$3084/firm)$17 mil -$138 mil N/A $17 mil -$138 mil
Signage Costs N/A ($60-$600/establishment)$4 mil - $41 mil $4 mil - $41 mil
Total $17 mil -$138 mil $4 mil - $41 mil $21 mil-$179 mil

BE
Replacement
Costs
Table 1: Total Costs Scope 1 - No exempted foods* (Very small manufacturer<$2.5 million annual revenue; compliance period includes label use up) Lower bound
($million) Upper bound
($million) Initial costs Administrative – Food manufacturers 317 2,509 Administrative – Supplement manufacturers 39 303 Administrative – Retail 17 138 Printing – Food manufacturers 92 260 Printing – Supplement manufacturers 48 145 Signage – Retail 4 41 BE replacement – Food and supplement manufacturers (administrative plus segregation costs) 213 1,010 BE replacement – Retail (administrative plus segregation costs) 11 36 Adjustment to administrative, printing and signage costs to account for percentage of market that goes non-BE -145 -929 USDA costs for administering the rule 2 2 Total initial costs 598 3,515 Ongoing costs BE replacement – Food and supplement manufacturers (recordkeeping plus segregation costs) 103 210 BE replacement – Retail (recordkeeping plus segregation costs) 9 13 USDA costs for administering the rule 2 2 Total ongoing costs 114 225 Annualizations 20 years Annualized at 3 percent (3%) 154 461 Annualized at 7 percent (7%) 170 557 Perpetuity Annualized at 3 percent (3%) 132 330 Annualized at 7 percent (7%) 156 471

Scenario:
Sugar and
Oil are
Exempted
Table 1: Total Costs Scope 1 - No exempted foods* AND Scope 2 – Sugar and oils exempted (Very small manufacturer<$2.5 million annual revenue; compliance period includes label use up) Lower bound
($million) Upper bound
($million) Initial costs Administrative – Food manufacturers 317 2,509 Administrative – Supplement manufacturers 39 303 Administrative – Retail 17 138 Printing – Food manufacturers 92 260 Printing – Supplement manufacturers 48 145 Signage – Retail 4 41 BE replacement – Food and supplement manufacturers (administrative plus segregation costs) 213 1,010 BE replacement – Retail (administrative plus segregation costs) 11 36 Adjustment to administrative, printing and signage costs to account for percentage of market that goes non-BE -145 -929 USDA costs for administering the rule 2 2 Total initial costs 598 3,515 Ongoing costs BE replacement – Food and supplement manufacturers (recordkeeping plus segregation costs) 103 210 BE replacement – Retail (recordkeeping plus segregation costs) 9 13 USDA costs for administering the rule 2 2 Total ongoing costs 114 225 Annualizations 20 years Annualized at 3 percent (3%) 154 461 Annualized at 7 percent (7%) 170 557 Perpetuity Annualized at 3 percent (3%) 132 330 Annualized at 7 percent (7%) 156 471
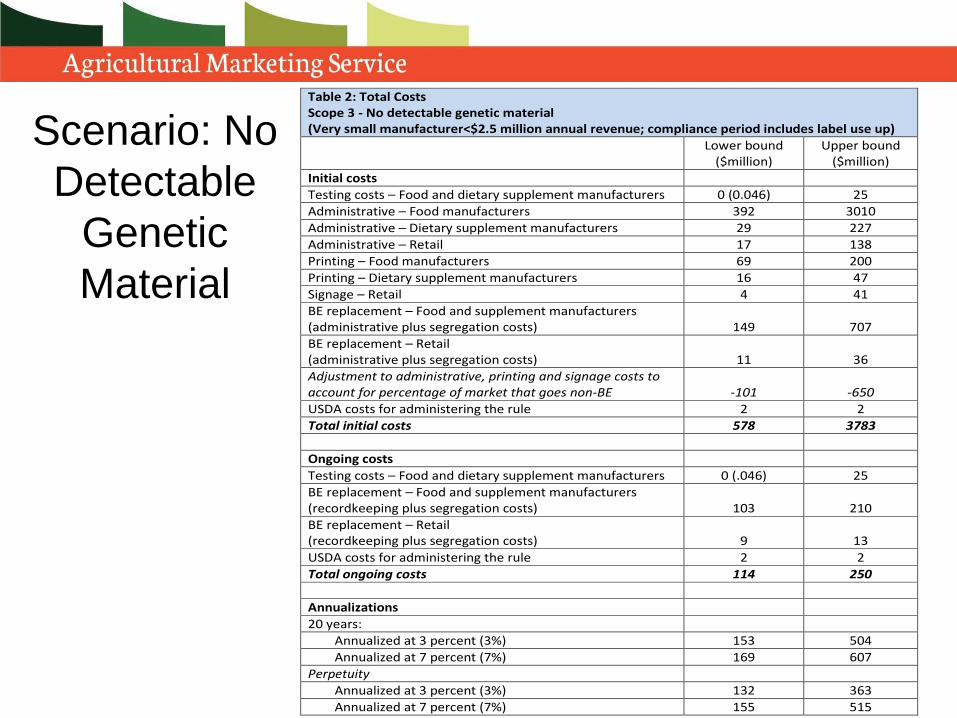
Scenario: No
Detectable
Genetic
Material
Table 2: Total Costs Scope 3 - No detectable genetic material (Very small manufacturer<$2.5 million annual revenue; compliance period includes label use up) Lower bound
($million) Upper bound
($million) Initial costs Testing costs – Food and dietary supplement manufacturers 0 (0.046) 25 Administrative – Food manufacturers 392 3010 Administrative – Dietary supplement manufacturers 29 227 Administrative – Retail 17 138 Printing – Food manufacturers 69 200 Printing – Dietary supplement manufacturers 16 47 Signage – Retail 4 41 BE replacement – Food and supplement manufacturers (administrative plus segregation costs) 149 707 BE replacement – Retail (administrative plus segregation costs) 11 36 Adjustment to administrative, printing and signage costs to account for percentage of market that goes non-BE -101 -650 USDA costs for administering the rule 2 2 Total initial costs 578 3783 Ongoing costs Testing costs – Food and dietary supplement manufacturers 0 (.046) 25 BE replacement – Food and supplement manufacturers (recordkeeping plus segregation costs) 103 210 BE replacement – Retail (recordkeeping plus segregation costs) 9 13 USDA costs for administering the rule 2 2 Total ongoing costs 114 250 Annualizations 20 years: Annualized at 3 percent (3%) 153 504 Annualized at 7 percent (7%) 169 607 Perpetuity Annualized at 3 percent (3%) 132 363 Annualized at 7 percent (7%) 155 515

Vermont Standard BaselineTable 28: Total Costs – Baseline 2b: Vermont standard is applied to products sold in the Northeast (range reflects cost range only; no very small firm exemptions) Lower bound
($million) Upper bound
($million) Initial costs Administrative – Food manufacturers 472 3,230 Printing – Food manufacturers 1,200 2,880 BE replacement – Food and supplement manufacturers (administrative plus segregation costs) 162 771 Adjustment to administrative, printing and signage costs to account for percentage of market that goes non-BE -240 -1,087 Total initial costs 1,594 5,794 Ongoing costs BE replacement – Food and supplement manufacturers (recordkeeping plus segregation costs) 78 159 Total ongoing costs 78 159 Annualizations 20 years Annualized at 3 percent (3%) 185 548 Annualized at 7 percent (7%) 228 706 Perpetuity Annualized at 3 percent (3%) 126 333 Annualized at 7 percent (7%) 190 565

Thank You!
Please submit comments to
www.regulations.gov by July 3, 2018
For additional information,
please visit the AMS webpage at
www.ams.usda.gov/be