mme 2010 metallurgical thermodynamics ii
TRANSCRIPT
MME 2010
METALLURGICAL THERMODYNAMICS II
Chemical Reaction Equilibria

Chemical reactions take place in production of steel from liquid iron
Impurities in liquid iron are subjected to a reaction with gaseous oxygen
Steel production takes place in a blast furnace that is aimed to collect liquid iron, slag and
flue gases formed as a result of reaction with C and CO
The liquid phases iron and slag in the blast furnace consist of solutions of Fe, C, Si, Mn, P
and SiO2, Al2O3, CaO, FeO respectively
Flue gases typically contain CO, CO2 and N2 as main components
Mathematical relationships of extensive thermodynamic properties, particularly G, H and
S need to be considered for each solution in order to estimate the equilibrium condition
parameters for maximum efficiency

Consider a general equilibrium:
𝑎𝐴 + 𝑏𝐵 𝑐𝐶 + 𝑑𝐷
The general criterion for equilibrium under constant T and P is ∆𝐺 = 0
∆𝐺 = 𝐺𝑝𝑟𝑜𝑑𝑢𝑐𝑡𝑠 − 𝐺𝑟𝑒𝑎𝑐𝑡𝑎𝑛𝑡𝑠
= 𝑐𝐺𝐶 + 𝑑𝐺𝐷 − 𝑎𝐺𝐴 − 𝑏𝐺𝐵
Recall that the complete differential of G is
Consider the reaction in a mixture of ideal gases at constant composition and
temperature (𝑑𝑛𝑖 = 𝑑𝑇 =0)
The change in Gibbs free energy of each component as a function of its pressure is given
as
𝜕𝐺𝑖
𝜕𝑃𝑖= 𝑉
𝜕𝐺𝑖 =𝑅𝑇𝑑𝑃𝑖
𝑃𝑖
𝑑 𝑛𝐺 = 𝑛𝑉 𝑑𝑃 − 𝑛𝑆 𝑑𝑇 + 𝜇𝑖 𝑑𝑛𝑖

𝜕𝐺𝑖 = 𝑅𝑇𝑑𝑃𝑖
𝑃𝑖
𝐺𝑖 = 𝐺𝑖𝑜 + 𝑅𝑇 ln
𝑃𝑖
𝑃𝑖𝑜 = 𝐺𝑖
𝑜 + 𝑅𝑇 ln𝑃𝑖 − 0
Since pressure of gases at standard conditions is assigned a value of 1 atm
The change in free energy of the system at constant temperature is
𝑛𝐺 = 𝑛𝑖𝐺𝑖
Since mole number and pressure of ideal gases are proportional, ni /Pi is constant
and since the total pressure of the system is constant, 𝑑𝑃𝑖 = 0
𝑑 𝑛𝐺 = 𝑛𝑖 𝑑𝐺𝑖 + 𝐺𝑖 𝑑𝑛𝑖
∆ 𝑛𝐺 = 𝑅𝑇𝑛𝑖
𝑃𝑖𝑑𝑃𝑖 + 𝐺𝑖 𝑑𝑛𝑖
∆𝐺 = 𝐺𝑖 𝑑𝑛𝑖

In the case of system equilibrium
If the number of molecules of each component in the ideal gas mixture is relatively high,
their coefficients a, b, c, d can be used to represent 𝑑𝑛𝑖:
𝑐𝐺𝐶𝑜 + 𝑑𝐺𝐷
𝑜 − 𝑎𝐺𝐴𝑜 − 𝑏𝐺𝐵
𝑜 + 𝑅𝑇 ln𝑃𝐶𝑐 +𝑅𝑇 ln𝑃𝐷
𝑑 +𝑅𝑇 ln𝑃𝐴−𝑎 +𝑅𝑇 ln𝑃𝐵
−𝑏 = 0
where ∆𝐺𝑜 = 𝑐𝐺𝐶𝑜 + 𝑑𝐺𝐷
𝑜 − 𝑎𝐺𝐴𝑜 − 𝑏𝐺𝐵
𝑜
Absolute Gibbs free energy is computed for condensed phases as:
𝐺𝑖 = 𝐺𝑖𝑜 + 𝑅𝑇 ln 𝑎𝑖
where a can be taken as unity for pure condensed phases
∆𝐺 = 𝐺𝑖𝑜 𝑑𝑛𝑖 + 𝑅𝑇 ln(𝑃𝑖) 𝑑𝑛𝑖 = 0
∆𝐺 = 𝐺𝑖 𝑑𝑛𝑖 = 0
∆𝐺𝑜 + 𝑅𝑇 ln𝑃𝐶
𝑐𝑃𝐷𝑑
𝑃𝐴𝑎𝑃𝐵
𝑏 = 0

The equation can be written for condensed phases as
∆𝐺 = ∆𝐺𝑜 + 𝑅𝑇 ln𝑎𝐶
𝑐𝑎𝐷𝑑
𝑎𝐴𝑎𝑎𝐵
𝑏= ∆𝐺𝑜 + 𝑅𝑇 ln𝑄
Q is called the reaction quotient
Q = K when ∆𝐺 = 0
∆𝐺 = 0 = ∆𝐺𝑜 + 𝑅𝑇 ln𝐾
∆𝐺𝑜 is readily given in literature for most compounds at STP
Since 𝜕𝐺𝑜
𝜕𝑇 𝑃= −𝑆,
∆𝐺𝑜 = ∆𝐻𝑜 + 𝑇𝜕∆𝐺𝑜
𝜕𝑇𝑃
−𝑅𝑇 ln𝐾 = ∆𝐻𝑜 − 𝑇𝜕 𝑅𝑇 ln𝐾
𝜕𝑇𝑃
𝜕 ln𝐾
𝜕𝑇=
∆𝐻𝑜
𝑅𝑇2
𝜕 ln𝐾
𝜕 1 𝑇
= −∆𝐻𝑜
𝑅Van’t Hoff equation
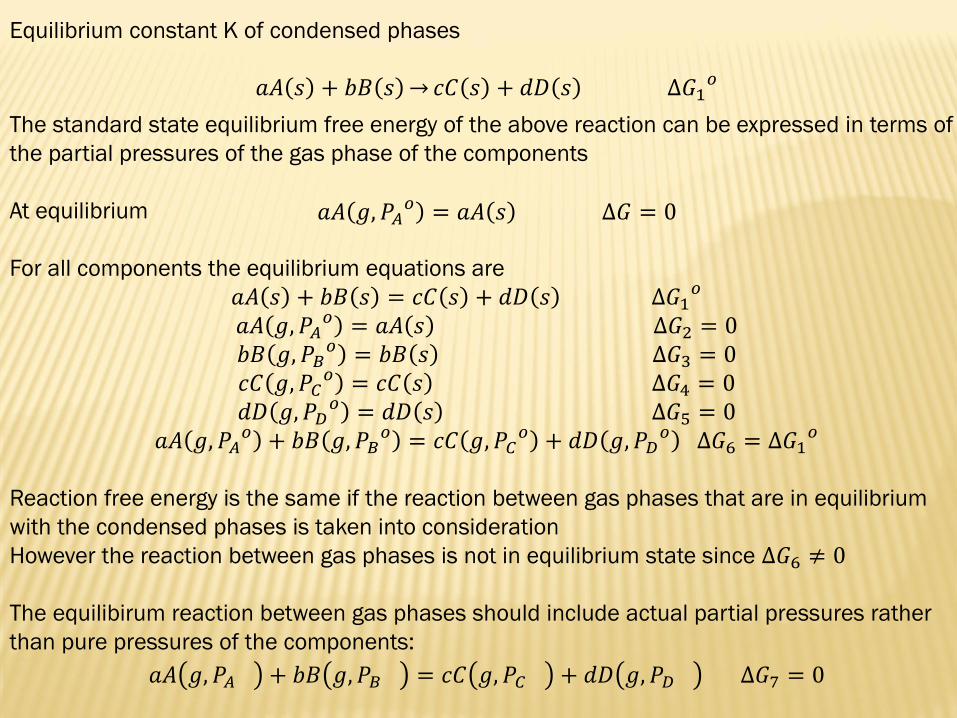
Equilibrium constant K of condensed phases
𝑎𝐴 𝑠 + 𝑏𝐵 𝑠 𝑐𝐶 𝑠 + 𝑑𝐷 𝑠 ∆𝐺1𝑜
The standard state equilibrium free energy of the above reaction can be expressed in terms of
the partial pressures of the gas phase of the components
At equilibrium
For all components the equilibrium equations are
𝑎𝐴 𝑠 + 𝑏𝐵 𝑠 = 𝑐𝐶 𝑠 + 𝑑𝐷 𝑠 ∆𝐺1𝑜
𝑎𝐴 𝑔, 𝑃𝐴𝑜 = 𝑎𝐴 𝑠 ∆𝐺2 = 0
𝑏𝐵 𝑔, 𝑃𝐵𝑜 = 𝑏𝐵 𝑠 ∆𝐺3 = 0
𝑐𝐶 𝑔, 𝑃𝐶𝑜 = 𝑐𝐶 𝑠 ∆𝐺4 = 0
𝑑𝐷 𝑔, 𝑃𝐷𝑜 = 𝑑𝐷 𝑠 ∆𝐺5 = 0
𝑎𝐴 𝑔, 𝑃𝐴𝑜 + 𝑏𝐵 𝑔, 𝑃𝐵
𝑜 = 𝑐𝐶 𝑔, 𝑃𝐶𝑜 + 𝑑𝐷 𝑔, 𝑃𝐷
𝑜 ∆𝐺6 = ∆𝐺1𝑜
Reaction free energy is the same if the reaction between gas phases that are in equilibrium
with the condensed phases is taken into consideration
However the reaction between gas phases is not in equilibrium state since ∆𝐺6 ≠ 0
The equilibirum reaction between gas phases should include actual partial pressures rather
than pure pressures of the components:
𝑎𝐴 𝑔, 𝑃𝐴 + 𝑏𝐵 𝑔, 𝑃𝐵 = 𝑐𝐶 𝑔, 𝑃𝐶 + 𝑑𝐷 𝑔, 𝑃𝐷 ∆𝐺7 = 0
𝑎𝐴 𝑔, 𝑃𝐴𝑜 = 𝑎𝐴 𝑠 ∆𝐺 = 0
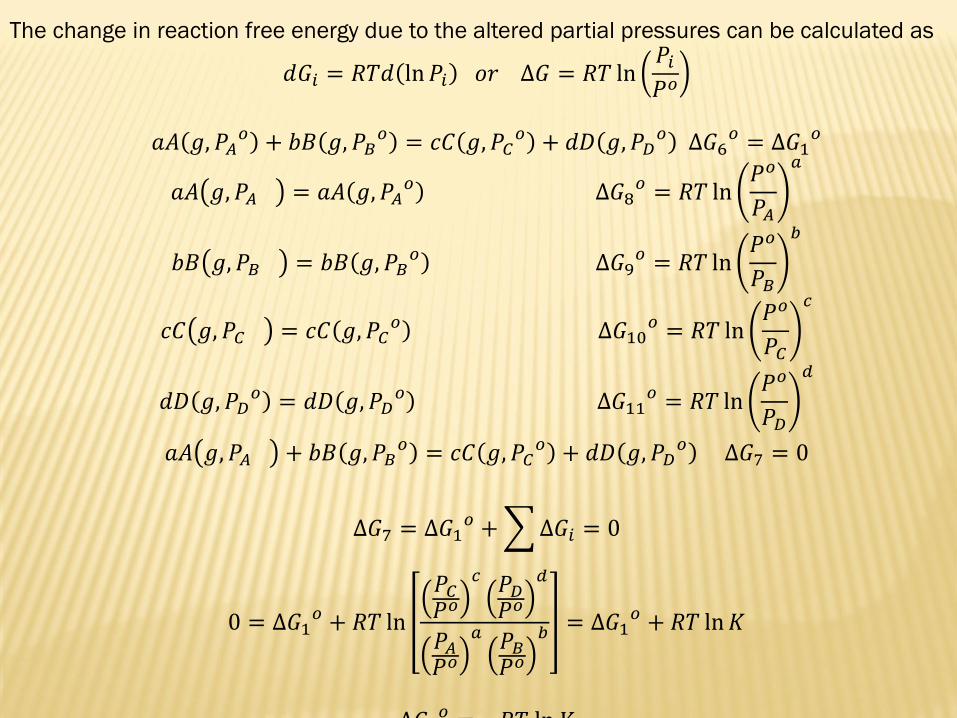
The change in reaction free energy due to the altered partial pressures can be calculated as
𝑑𝐺𝑖 = 𝑅𝑇𝑑 ln𝑃𝑖 𝑜𝑟 ∆𝐺 = 𝑅𝑇 ln𝑃𝑖
𝑃𝑜
𝑎𝐴 𝑔, 𝑃𝐴𝑜 + 𝑏𝐵 𝑔, 𝑃𝐵
𝑜 = 𝑐𝐶 𝑔, 𝑃𝐶𝑜 + 𝑑𝐷 𝑔, 𝑃𝐷
𝑜 ∆𝐺6𝑜 = ∆𝐺1
𝑜
𝑎𝐴 𝑔, 𝑃𝐴 = 𝑎𝐴 𝑔, 𝑃𝐴𝑜 ∆𝐺8
𝑜 = 𝑅𝑇 ln𝑃𝑜
𝑃𝐴
𝑎
𝑏𝐵 𝑔, 𝑃𝐵 = 𝑏𝐵 𝑔, 𝑃𝐵𝑜 ∆𝐺9
𝑜 = 𝑅𝑇 ln𝑃𝑜
𝑃𝐵
𝑏
𝑐𝐶 𝑔, 𝑃𝐶 = 𝑐𝐶 𝑔, 𝑃𝐶𝑜 ∆𝐺10
𝑜 = 𝑅𝑇 ln𝑃𝑜
𝑃𝐶
𝑐
𝑑𝐷 𝑔, 𝑃𝐷𝑜 = 𝑑𝐷 𝑔, 𝑃𝐷
𝑜 ∆𝐺11𝑜 = 𝑅𝑇 ln
𝑃𝑜
𝑃𝐷
𝑑
𝑎𝐴 𝑔, 𝑃𝐴 + 𝑏𝐵 𝑔, 𝑃𝐵𝑜 = 𝑐𝐶 𝑔, 𝑃𝐶
𝑜 + 𝑑𝐷 𝑔, 𝑃𝐷𝑜 ∆𝐺7 = 0
∆𝐺7 = ∆𝐺1𝑜 + ∆𝐺𝑖 = 0
0 = ∆𝐺1𝑜 + 𝑅𝑇 ln
𝑃𝐶𝑃𝑜
𝑐 𝑃𝐷𝑃𝑜
𝑑
𝑃𝐴𝑃𝑜
𝑎 𝑃𝐵𝑃𝑜
𝑏 = ∆𝐺1𝑜 + 𝑅𝑇 ln𝐾
∆𝐺 𝑜 = 𝑅𝑇 ln K
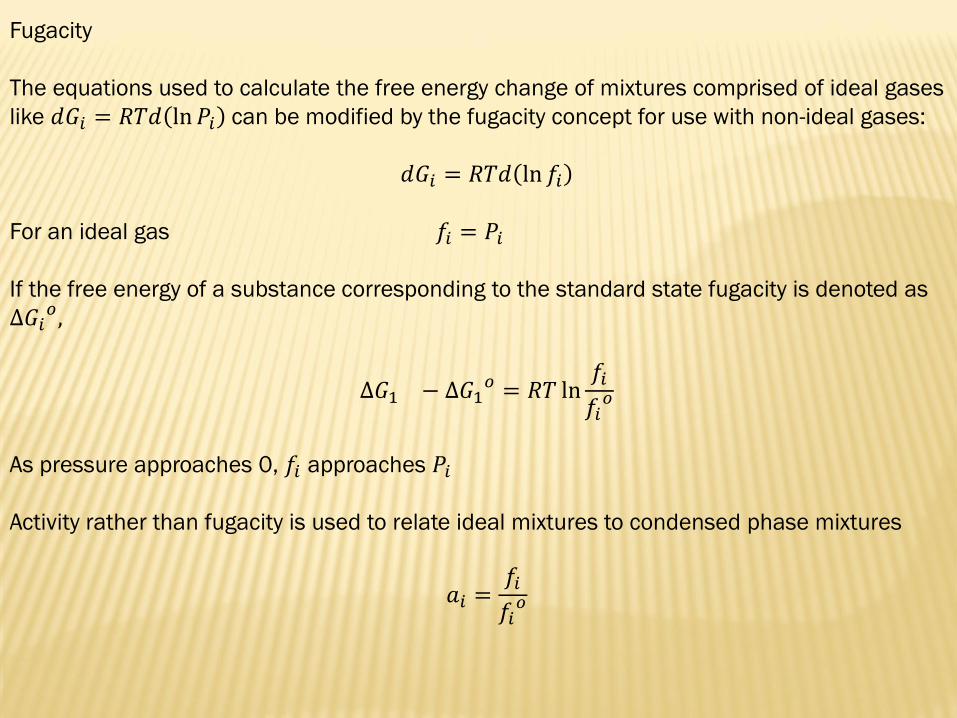
Fugacity
The equations used to calculate the free energy change of mixtures comprised of ideal gases
like 𝑑𝐺𝑖 = 𝑅𝑇𝑑 ln𝑃𝑖 can be modified by the fugacity concept for use with non-ideal gases:
𝑑𝐺𝑖 = 𝑅𝑇𝑑 ln 𝑓𝑖
For an ideal gas 𝑓𝑖 = 𝑃𝑖
If the free energy of a substance corresponding to the standard state fugacity is denoted as
∆𝐺𝑖𝑜,
∆𝐺1 − ∆𝐺1𝑜 = 𝑅𝑇 ln
𝑓𝑖
𝑓𝑖𝑜
As pressure approaches 0, 𝑓𝑖 approaches 𝑃𝑖
Activity rather than fugacity is used to relate ideal mixtures to condensed phase mixtures
𝑎𝑖 =𝑓𝑖
𝑓𝑖𝑜

∆𝐺𝑜 can be calculated for any temperature since ∆𝐺𝑜 = ∆𝐻𝑜 − 𝑇∆𝑆𝑜,
∆𝐺𝑜 = ∆𝐻𝑜298 +
298
𝑇
∆𝐶𝑃𝑑𝑇 − 𝑇 ∆𝑆𝑜298 +
298
𝑇 ∆𝐶𝑃𝑑𝑇
𝑇
where 𝐶𝑃 = 𝑎 + 𝑏𝑇 +𝑐
𝑇2
and ∆𝐶𝑃= ∆𝑎 + ∆𝑏𝑇 +𝑐
𝑇2 where ∆𝑎, 𝑏, 𝑐 = ∆𝑎, 𝑏, 𝑐𝑝𝑟𝑜𝑑𝑢𝑐𝑡𝑠 − ∆𝑎, 𝑏, 𝑐𝑟𝑒𝑎𝑐𝑡𝑎𝑛𝑡𝑠
∆𝐺𝑜 = ∆𝐻𝑜298 +
298
𝑇
∆𝑎 + ∆𝑏𝑇 + ∆𝑐𝑇2 𝑑𝑇 − 𝑇 ∆𝑆𝑜
298 + 298
𝑇 ∆𝑎 + ∆𝑏𝑇 + ∆𝑐𝑇2 𝑑𝑇
𝑇
∆𝐺𝑜 = ∆𝐻𝑜298 + ∆𝑎𝑇 +
∆𝑏𝑇2
2− ∆𝑐
𝑇 − 𝑇 ∆𝑆𝑜298 + ∆𝑎 ln𝑇 + ∆𝑏𝑇 − ∆𝑐
2𝑇2
Replacement of the upper and the lower limits yields
∆𝐺𝑜 = 𝐼𝑜 + 𝐼1𝑇 − ∆𝑎𝑇 ln𝑇 −∆𝑏
2𝑇2 −
∆𝑐
2𝑇
where 𝐼𝑜 = ∆𝐻𝑜298 − ∆𝑎298 +
∆𝑏2982
2− ∆𝑐
298
𝐼1 = ∆𝑎 − ∆𝑆𝑜298 + ∆𝑎 ln 298 + ∆𝑏298 − ∆𝑐
2∗2982
T
298
T
298

Example - One important equilibrium between condensed phases such as metals and
oxides and a gaseous phase such as oxygen is oxidation of metals
Consider the oxidation of copper
4Cu 𝑠 + O2 𝑔 = 2Cu2O(𝑠)
∆𝐻𝑜298 = −334400 J
∆𝑆𝑜298 = −152.07 J/K
∆𝐶𝑃 = 4.18 + 0.01839𝑇 +1.67 ∗ 105
𝑇2 J/K
𝐼𝑜 = −334400 − 1500𝐼1 = 4.18 + 152.07 + 28.35
Using the above thermochemical data
∆𝐺𝑜 = −335900 + 184.59𝑇 − 4.18𝑇 ln𝑇 − 0.0092𝑇2 −0.84 ∗ 105
𝑇J

Alternatively the standard free energy for formation of pure Cu2O from pure Cu and oxygen
is
∆𝐺𝑜 = 𝑅𝑇 ln𝑃𝑂2(𝑒𝑞𝑚)
Experimental variation of ∆𝐺𝑜with T can be calculated from the measured oxygen partial
pressure 𝑃𝑂2(𝑒𝑞𝑚) that is in equilibrium with Cu and Cu2O
When experimental ∆𝐺𝑜 vs T is fit to
∆𝐺𝑜 = 𝐴 + 𝐵𝑇 log𝑇 + 𝐶𝑇∆𝐺𝑜 = −338580 − 32.77𝑇 log𝑇 + 246.62𝑇 J
If a 2-term fit is used
∆𝐺𝑜 = 𝐴 + 𝐵𝑇∆𝐺𝑜 = −328580 + 137.94𝑇 J
The comparison of ∆𝐺𝑜 calculated from the thermochemical data and experimental data is
made, the difference in temperature range 400 to 1200 K is seen between 293 to 794 J
The comparison of ∆𝐺𝑜 calculated from the experimental data and 2-term fit shows that
the difference in the 400 to 1200 K temperature range is even less, between 286 to 788 J
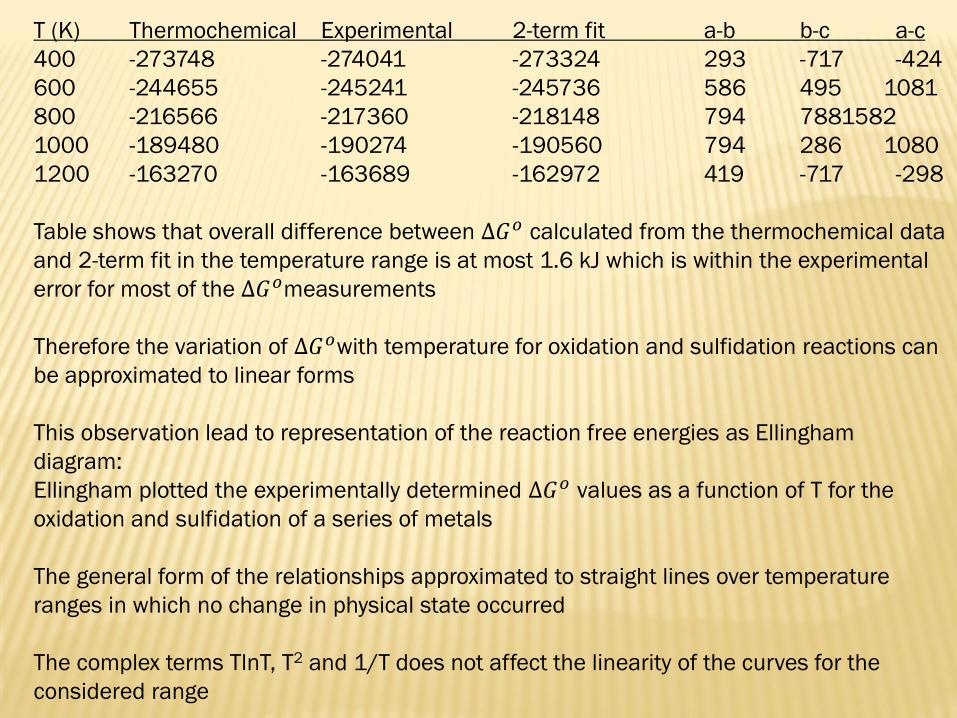
T (K) Thermochemical Experimental 2-term fit a-b b-c a-c
400 -273748 -274041 -273324 293 -717 -424
600 -244655 -245241 -245736 586 495 1081
800 -216566 -217360 -218148 794 7881582
1000 -189480 -190274 -190560 794 286 1080
1200 -163270 -163689 -162972 419 -717 -298
Table shows that overall difference between ∆𝐺𝑜 calculated from the thermochemical data
and 2-term fit in the temperature range is at most 1.6 kJ which is within the experimental
error for most of the ∆𝐺𝑜measurements
Therefore the variation of ∆𝐺𝑜with temperature for oxidation and sulfidation reactions can
be approximated to linear forms
This observation lead to representation of the reaction free energies as Ellingham
diagram:
Ellingham plotted the experimentally determined ∆𝐺𝑜 values as a function of T for the
oxidation and sulfidation of a series of metals
The general form of the relationships approximated to straight lines over temperature
ranges in which no change in physical state occurred
The complex terms TlnT, T2 and 1/T does not affect the linearity of the curves for the
considered range

∆𝐺𝑜 = ∆𝐻𝑜 − 𝑇∆𝑆𝑜
∆𝐺𝑜 = 𝐴 + 𝐵𝑇
A, which is the intercept at 0 K, is the temperature independent ∆𝐻𝑜
B, the slope, −∆𝑆𝑜
These approximations imply that ΔCP≈ 0 for oxidation reactions
Another important characteristic of Ellingham diagram is that; all the lines represent
reactions involving one mole of oxygen:
2𝑥
𝑦M + O2
2
𝑦MxOy
Therefore, the ordinate ∆𝐺𝑜 of all the oxidation reactions become 𝑅𝑇 ln𝑃𝑂2(𝑒𝑞𝑚)
Almost all the ∆𝐺𝑜 lines have positive slopes since ∆𝑆𝑜 < 0:
M(s) + O2(𝑔) MO2(𝑠)
∆𝑆𝑜 = ∆𝑆𝑜𝑀𝑂2 − ∆𝑆𝑜
𝑀 − ∆𝑆𝑜𝑂2
𝑆𝑜𝑂2 is generally dominant in the temperature range where M and MO2 are solid
So ∆𝑆𝑜 ≈ −𝑆𝑜𝑂2
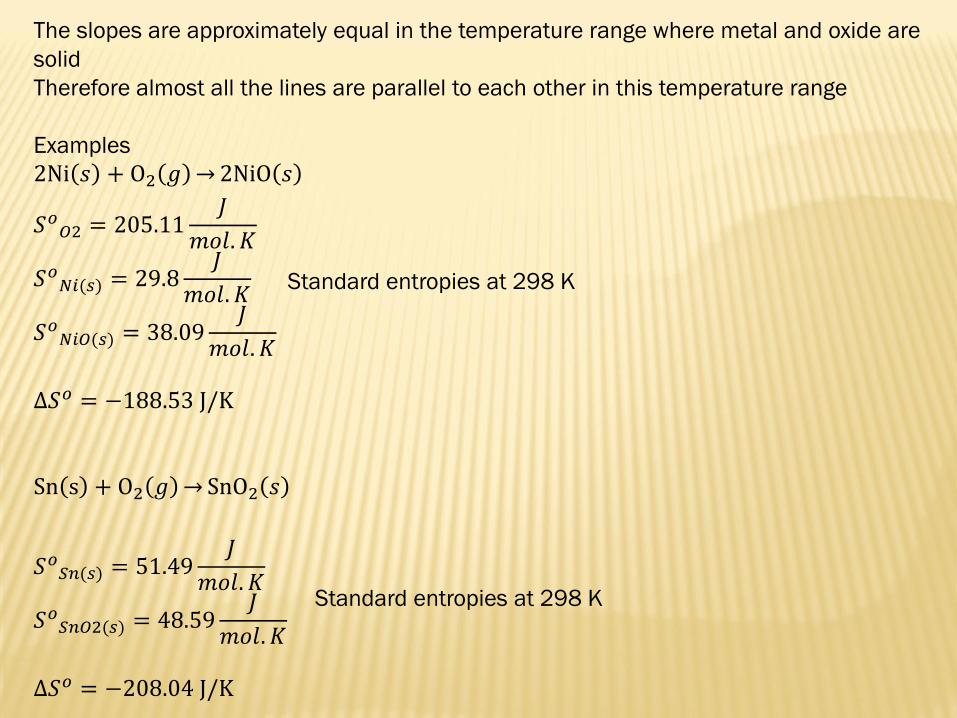
The slopes are approximately equal in the temperature range where metal and oxide are
solid
Therefore almost all the lines are parallel to each other in this temperature range
Examples
2Ni 𝑠 + O2 𝑔 2NiO 𝑠
𝑆𝑜𝑂2 = 205.11
𝐽
𝑚𝑜𝑙. 𝐾
𝑆𝑜𝑁𝑖(𝑠) = 29.8
𝐽
𝑚𝑜𝑙. 𝐾
𝑆𝑜𝑁𝑖𝑂(𝑠) = 38.09
𝐽
𝑚𝑜𝑙. 𝐾
∆𝑆𝑜 = −188.53 J/K
Sn s + O2 𝑔 SnO2 𝑠
𝑆𝑜𝑆𝑛(𝑠) = 51.49
𝐽
𝑚𝑜𝑙. 𝐾
𝑆𝑜𝑆𝑛𝑂2(𝑠) = 48.59
𝐽
𝑚𝑜𝑙. 𝐾
∆𝑆𝑜 = −208.04 J/K
Standard entropies at 298 K
Standard entropies at 298 K

The exceptions to the general trends in oxidation lines are
C 𝑠 + O2 𝑔 CO2 𝑔 ∆𝑆𝑜 ≈ 0
and
2C 𝑠 + O2 𝑔 2CO 𝑔 ∆𝑆𝑜 > 0

Lines on Ellingham diagrams often have sharp breaks in them which are caused by phase
transformations
The straight line representation of ∆𝐺𝑜 vs T relationships are valid if there is no physical
change taking place for any one of the components taking part in the reaction equilibrium
Consider the transformation of M(s) to M(l) at Tm
M 𝑠 + O2 𝑔 MO2 𝑔
M 𝑙 + O2 𝑔 MO2 𝑔 1
2
T
∆𝐻𝑜
Tm
T
∆𝑆𝑜
Tm
∆𝐻𝑜1> ∆𝐻𝑜
2
∆𝑆𝑜1> ∆𝑆𝑜
2

The net effect of phase transformation of a reactant from a low temperature to a high
temperature phase is an increase in slope
T
−𝑇∆𝑆𝑜
Tm
M(s)
M(l)
T
∆𝐺𝑜
Tm
M(s)
M(l)

Consider the transformation of product MO2(s) to MO2(l) at Tm
M 𝑠 + O2 𝑔 MO2 𝑠
M 𝑠 + O2 𝑔 MO2 𝑙
1
2
TTm
T
∆𝑆𝑜
∆𝐻𝑜1< ∆𝐻𝑜
2
∆𝑆𝑜1< ∆𝑆𝑜
2
∆𝐻𝑜
Tm

The net effect of phase transformation of a product from a low temperature to a high
temperature phase is a decrease in slope
T
−𝑇∆𝑆𝑜
Tm
MO2 (s)MO2 (l)
T
∆𝐺𝑜
Tm
M(s)
M(l)
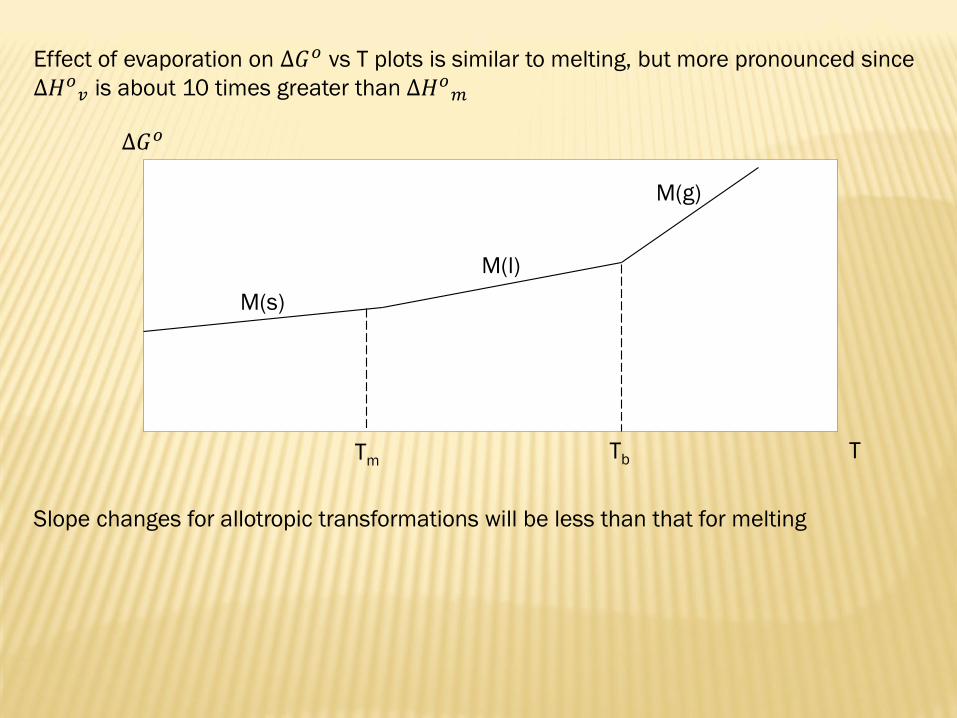
Effect of evaporation on ∆𝐺𝑜 vs T plots is similar to melting, but more pronounced since
∆𝐻𝑜𝑣 is about 10 times greater than ∆𝐻𝑜
𝑚
Slope changes for allotropic transformations will be less than that for melting
T
∆𝐺𝑜
Tm
M(s)
M(l)
M(g)
Tb

The Ellingham line for the M/MO2 equilibrium is shown in the figure
∆𝐺 = 0 all along the line and oxygen partial pressure is PO2(eqm)
Let the partial pressure of oxygen be PO2(actual) when a metal is exposed to an oxidizing
atmosphere
∆𝐺 = ∆𝐺𝑜 + 𝑅𝑇 ln1
𝑃𝑂2(𝑎𝑐𝑡𝑢𝑎𝑙), ∆𝐺 = 𝑅𝑇 ln𝑃𝑂2 𝑒𝑞𝑚 −𝑅𝑇 ln𝑃𝑂2 𝑎𝑐𝑡𝑢𝑎𝑙
At any point above the line, 𝑃𝑂2 𝑎𝑐𝑡𝑢𝑎𝑙 > 𝑃𝑂2 𝑒𝑞𝑚 , then ∆𝐺 < 0This implies that MO2 formation is spontaneous and MO2 is stable above the line
At any point below the line, 𝑃𝑂2 𝑎𝑐𝑡𝑢𝑎𝑙 < 𝑃𝑂2 𝑒𝑞𝑚 , then ∆𝐺 > 0This implies that MO2 formation is impossible and M is stable below the line
T
∆𝐺𝑜
M, O2
MO2, O2

Most of the lines on Ellingham diagram are almost parallel to each other
Consider the Ellingham lines for the M/MO2 and N/NO2 equilibria:
The oxide with the larger region of stability is more stable
It is evident from the figure that NO is relatively more stable than MO
The element with the more stable oxide is more reactive
The element of the less stable oxide is more stable in elemental form, M is more stable
than N
2MO 𝑠 2M 𝑠 + O2(𝑔)
2N 𝑠 + O2 𝑔 2NO(𝑠)
2MO 𝑠 + 2N 𝑠 2M 𝑠 + 2NO 𝑠 Net reaction
T
∆𝐺𝑜
M, NO2
MO2, NO2
M, N

Ellingham lines sometimes intercept each other
Consider the two lines for X/XO and Y/YO equilibria:
Relative stability of oxides changes with temperature in this case
Below the equilibrium temperature, YO2 is more stable, XO2 becomes more stable above TE
All the components X, Y, XO2, YO2 coexist at the equilibrium temperature
There is no stability region for Y and XO2 together below TE, and for X, YO2 together above
TE
If Y and XO2 are brought together at a temperature below TE, Y will be oxidized while XO2
will be reduced
T
∆𝐺𝑜
X, YO2
XO2, YO2
X, Y
XO2, Y
TE

Partial pressure grid lines
Ellingham diagram offers a simple and useful way to estimate equilibrium oxygen
pressures as a function of temperature
For constant 𝑃𝑂2 values, ∆𝐺𝑜 vs T is represented by straight lines with R ln𝑃𝑂2slope and
∆𝐺𝑜 = 0 intercept
Constant oxygen partial pressures can be read from the oxygen partial pressure scale
when these lines are superimposed
The intersections of the constant oxygen partial pressure lines and the X-XO2equilibirum
line give the equilibrium oxygen partial pressures for this reaction at various temperatures
Oxygen partial pressure at 700 °C, in equilibrium with X and XO2 is 10-11atm
Oxide is stable if the oxide lines are under the partial pressure line at a temperature
T
∆𝐺𝑜
XO2, O2
X, O2
700 °C
0PO2
1 atm
10-11 atm
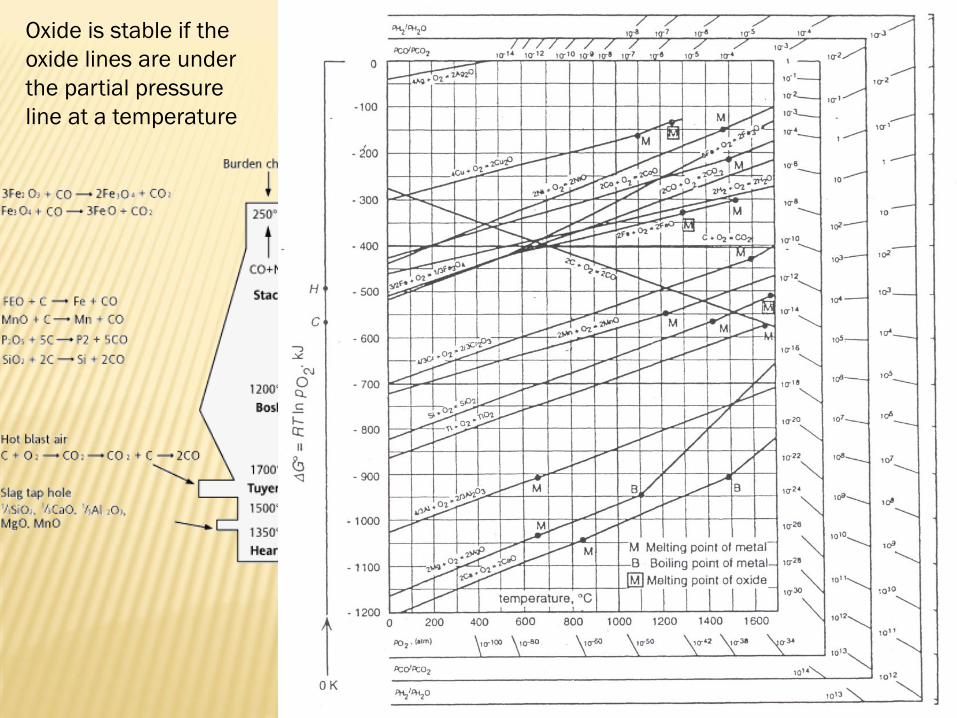
Oxide is stable if the
oxide lines are under
the partial pressure
line at a temperature