mlm: fs181 final budget and mtref 2019-2020
TRANSCRIPT

1
MLM: FS181 FINAL BUDGET AND MTREF 2019-2020
2
Acronyms and abbreviations
CFO Chief Financial Officer
CPI Consumer Price Index
CoGTA Cooperative Governance and Traditional Affairs
CRRF Capital Replacement Reserve Fund
EEDSM Energy Efficiency and Demand Side Management
DoJ Department of Justice
DoRA Division of Revenue Act
DWA Department of Water
EXCO Executive Committee
FBS Free basic services
GVA Gross Value Added
GFS Government Financial Statistics
GRAP General Recognised Accounting Practice
IBT Inclining Block Tariff
IDP Integrated Development Plan
kℓ kilolitre
km kilometre
KPA Key Performance Area
KPI Key Performance Indicator
kWh kilowatt hour
ℓ litre
LED Local Economic Development
MBBR Local Government: Municipal Budget and Reporting Regulations
MEC Member of the Executive Committee
MFMA Municipal Financial Management Act (56 of 2003)
MFMG Municipal Finance Management Grant
MIG Municipal Infrastructure Grant
MLM Masilonyana Local Municipality
MM Municipal Manager
MMC Member of Mayoral Committee
MPRA Municipal Properties Rates Act
MSA Municipal Systems Act
MSIG Municipal Systems Improvement Grant
MTREF Medium-term Revenue and Expenditure Framework
NERSA National Energy Regulator of South Africa
PBO Public Benefit Organisations
PMS Performance Management System
PPE Property Plant and Equipment
PPP Public Private Partnership
RBIG Regional Bulk Infrastructure Grant
SALGA South African Local Government Association
SARS South African Revenue Services
SAPS South African Police Services
SDBIP Service Delivery Budget Implementation Plan
SMMEs Small Macro-Medium Enterprises
VAT Value Added Tax

MLM: FS181 FINAL BUDGET AND MTREF 2019-2020
3
PART 1 – ANNUAL BUDGET..………………………………………………………………………………………………………………………………………….…5
1.1 Mayor’s report ........................................................................................................................................................ 5
1.2 Council Budget Recommendations ......................................................................................................................... 6
1.3 Executive summary ................................................................................................................................................. 8
1.4 Annual Budget Tables ............................................................................................................................................. 9
PART 2 – SUPPORTING DOCUMENTATION…………………………………………………………………………………………………………………....35
2.1 IDP and Service Delivery and Budget Implementation Plan ......................................................................... . . ….35
2.2 Financial Modelling and Key Planning Drivers ...................................................................................................... 36
2.3 Overview of alignment of annual budget with IDP………………………………………………………………………..………………..36
2.5 Measurable performance objectives and indicator……………………………………………………………………………………..….434
2.6 Budget related policies………………………………………………………………………………………………………………..…………………45
2.7 Overview of the budget assumptions…………………………………………………………………………………………………….………46
2.8 Legislation compliance status……………………………………………………………………………………………………………..………...47
2.9 Quality Certificate…………………………………………………………………………………………………………………………………………..48
2.9 Recommendations………………………………………………………………………………………………………………………………………...48
MLM: FS181 FINAL BUDGET AND MTREF 2019-2020
4
LIST OF TABLES
Table 1 Consolidate overview of the 2019/20 MTREF
Table 2 Summary of revenue classified by main revenue source
Table 3 Operating transfers and grant receipt
Table 4 Summary of operating expenditure by item for 2019/20 MTREF
Table 5: Capital Expenditure by vote
Table 6 Capital expenditure by standard classification
Table 7 Capital expenditure per project list
Table 8 MBRR A1 – Consolidated budget summary
Table 9 MBRR table A2- budgeted financial performance (revenue and expenditure by
Standard classification)
Table10 MBRR table A3-budgeted financial performance (revenue and expenditure by
municipal vote)
Table 11 MBRR table A4-budgeted financial performance (revenue and expenditure)
Table 12 MBRR table A5-budgeted capital expenditure by vote, standard classification
and funding source
Table 13 MBRR table A6-budgeted financial position
Table 14 MBRR table A7-budgeted cash flow statement
Table 15 MBRR table A8- cash backed reserves/accumulated surplus reconciliation
Table 16 MBRR table A9- asset management
Table 17 MBRR table A10- basic service delivery measurement
Table 18: Reconciliation of IDP strategic objectives and budget (Revenue)
Table 19: Reconciliation of IDP strategic objectives and budget (Expenditure)
Table 20: Reconciliation of IDP strategic objectives and budget (Capital)
2.1 Schedule of key deadlines for the IDP/ Budget process

MLM: FS181 FINAL BUDGET AND MTREF 2019-2020
5
PART 1 – ANNUAL BUDGET
1.1 Mayor’s report
Budget allocation in terms of the operations and capital budget:
The municipality’s total operating and capital budget is estimated to be R332 million. Operating
expenditure has been projected at R359 million. The Municipality’s capital expenditure amounts to
R45.6 million that the 100% is funded from grants , however should there be funds available there’s
capital expenditure planned to be implemented from that available funds. This is supported with a
revenue base of R 286.6 million from service charges, property rates and operational grants. The
budget has a deficit of R72.5 mil due to non-cash items that constitutes a big chunk of the
expenditure, however these expenses has to be accounted for to ensure that the budget is realistic
and credible. The municipality is also experiencing cash-flow challenges that will have a direct
impact on the budget that is prepared for 2019/2020.
Key priorities for the municipality towards the 2019/20 as per the IDP, SDBIP and its linkage
with the Province and National.
MLM exists within the Free State province which is the non-urban municipality, with a low revenue
generation. In this regards the Municipality has aligned its budget and operations towards National
and the Provincial key performance areas.
Radical economic transformation
MLM will conducts workshops with existing and potential SMMEs and empower them to access the
entrepreneurial opportunities offered by the municipality through its Supply Chain Management
(SCM) processes. These include:
1. Inviting a larger pool of SMMEs to register on the municipal database of service providers.
Invitations will be made through, for example, placement of adverts at local township shops and
halls over and above advertising in the local media; also through the sessions that are called by
the LED office
2. Constant engagement are made for the purpose of information sharing through LED office and
SCM unit
3. Training SMMEs on completion of the bid documents. As support, the municipality also assisted
the local SMMEs to get matters of their tax clearances to be resolved. The municipality provided
transport for our small business enterprises to get assistance. local South African Revenue
Service (SARS) office will be invited at these workshops to empower them on SARS
requirements; and
4. Settle the accounts of the SMMEs within the prescribed thirty (30) days period as they are small
business, where in there challenges in this regard, prompt communication is made to make
arrangements
MLM: FS181 FINAL BUDGET AND MTREF 2019-2020
6
1.2 Council Resolutions
The Council of Masilonyana Local Municipality will on 31 May 2018 have a sitting where the Mayor
will table the Final Budget 2019/20 Budget and Medium Term Revenue and Expenditure Framework
(MTREF) for consideration in terms of section 16(2) of the Municipal Finance Management Act (56
of 2003), subsequently be tabled to council 90 days before start of budget year.
1.2.1 That cognisance be taken of the report of the Mayor regarding the 2019/2020 budget.
1.2.2 That Council of Masilonyana Local Municipality, acting in terms of section 16(2) of the
Municipal Finance Management Act, 2003 (No. 56 of 2003) tabling the Final Budget
1.2.3 that the annual budget of the municipality for the financial year 2019/20 as set out in the
tables below be approved.
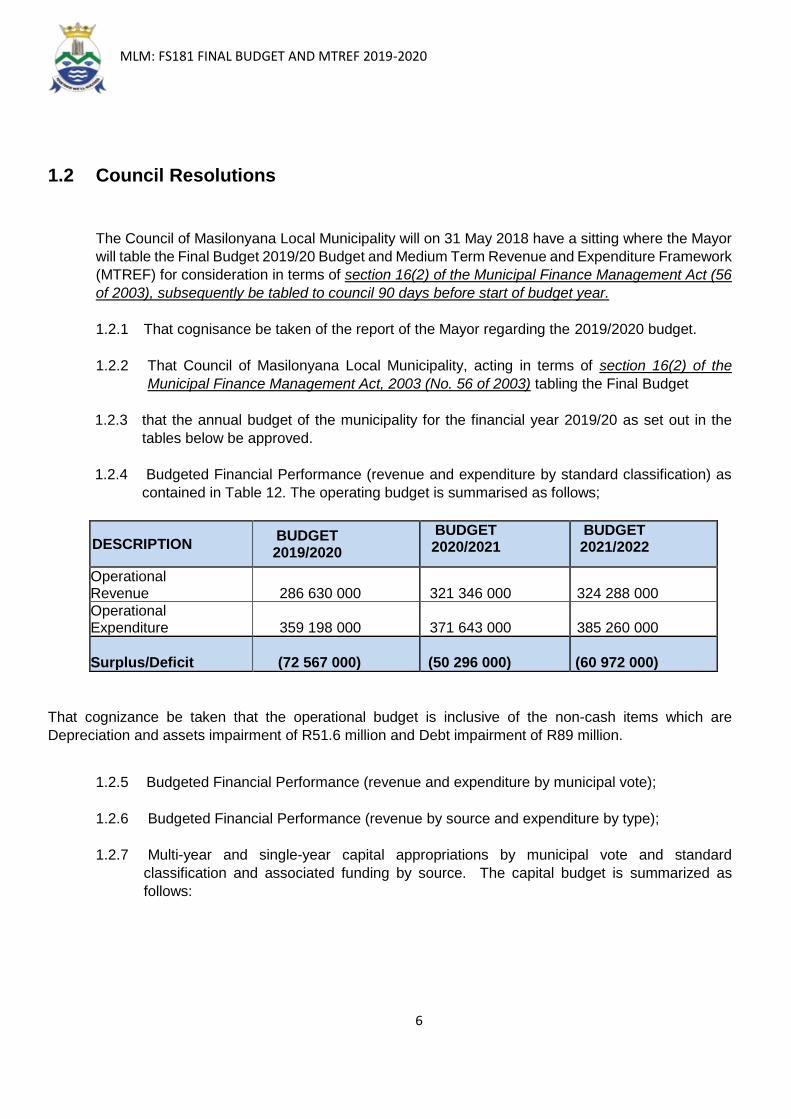
1.2.4 Budgeted Financial Performance (revenue and expenditure by standard classification) as
contained in Table 12. The operating budget is summarised as follows;
DESCRIPTION BUDGET 2019/2020
BUDGET 2020/2021
BUDGET 2021/2022
Operational Revenue 286 630 000
321 346 000
324 288 000
Operational Expenditure 359 198 000
371 643 000
385 260 000
Surplus/Deficit (72 567 000)
(50 296 000)
(60 972 000)
That cognizance be taken that the operational budget is inclusive of the non-cash items which are
Depreciation and assets impairment of R51.6 million and Debt impairment of R89 million.
1.2.5 Budgeted Financial Performance (revenue and expenditure by municipal vote);
1.2.6 Budgeted Financial Performance (revenue by source and expenditure by type);
1.2.7 Multi-year and single-year capital appropriations by municipal vote and standard
classification and associated funding by source. The capital budget is summarized as
follows:

MLM: FS181 FINAL BUDGET AND MTREF 2019-2020
7
FUNDING SOURCE
CAPITAL BUDGET 2019/2020
CAPITAL BUDGET 2020/2021
CAPITAL BUDGET 2021/2022
Municipal Infrastructure Grant
32 421 000 24 533 000 26 133 000
Integrated National Electrification Pogrammes
3 200 000 4 914 000 5 184 000
Water Services Infrastructure Grant
10 000 000 11 000 000 12 000 000
Internal Funding
0 0 0
TOTAL CAPEX
45 621 000 40 447 000 43 317 000
The total amount of MIG above is inclusive of the Project Management Unit funded by the grant.
There is also an amount of R 60 million Gazetted on the DORA for Regional Bulk Infrastructure Grant
transfers and electrification programmes, however these are an in-kind capital grant and not budgeted for
in the Municipal MTREF.
1.2.8 That the Council of Masilonyana Local Municipality, acting in terms of section 75A of the Local
Government: Municipal Systems Act 2000 (No.32 of 2000) approve and adopt with effect from 1 July 2019
the following tariffs and rates:
1.2.8.1 Consolidated Final Tariff book 2019/2020 (per service, per department) - Annexure “1”
1.2.9 That the Council of Masilonyana Local Municipality approves the following 2019/20 revised budget
related policies and tariffs:
1.2.9.1 Municipal Property rates policy (Annexure) 1.2.9.2 Budget policy (Annexure) 1.2.9.3 Tariff policy (Annexure) 1.2.9.4 Indigent policy (Annexure) 1.2.9.5 Fixed Asset management policy (Annexure) 1.2.9.6 Cash management & investment policy (Annexure) 1.2.9.7 Credit control & Debt Collection policy (Annexure) 1.2.9.8 Supply Chain Management policy (Annexure) 1.2.9.9 Unauthorized, Irregular Fruitless and Wasteful policy (Annexure) 1.2.9.10 Bad debt write-off policy (Annexure ) 1.2.9.11 Policy governing payments of creditors, councilors and officials (Annexure) 1.2.9.12 Subsistence and Travel policy (Annexure) 1.2.9.13 Disclosure Related parties’ policies (Annexure) 1.2.9.14 Events after reporting date policy and procedure manual (Annexure) 1.2.9.15 Virements Policy (Annexure)

MLM: FS181 FINAL BUDGET AND MTREF 2019-2020
8
1.2.10 That cash backing is implemented through the utilisation of a portion of the revenue generated from
property rates to ensure that all capital reserves and provisions, unspent long-term loans and unspent
conditional grants are cash backed as required in terms of section 8 of the Municipal Budget and Reporting
Regulations;
1.2.11 that the municipality did not budget to raise long term loans to fund the capital budget, and
1.2.12 that the Accounting Officer adheres to all prescribed requirements in terms of legislation regarding
the submission of the budget document to the various institutions.
.
1.3 Executive summary
The application of sound financial management principles for the compilation of the Masilonyana’ s financial plan is essential and critical to ensure that the municipality remains financially viable and that municipal services are provided sustainably, economically and equitably to all communities.
Masilonyana has committed itself to respond to the people’s legitimate demand for a better life as reflected
in our budget in which the key priorities are water, and related critical infrastructure maintenance. In
a continued effort to create jobs for the inhabitants of MLM and to encourage private sector investment, the
capital budget is being focused on addressing the backlog of the aging infrastructure of the municipality
and also to address the capacity in terms distribution of water at the areas in Winburg through funding from
DWA.
Masilonyana has embarked on implementing a range of revenue collection strategies to optimize the
collection of debt owed by consumers; and to also ensure that the indigent register is up-to-date. The
intervention of the Mayor and Council was requested to communicate this message to the community for
the campaigns of indigents to be a success.
National Treasury’s MFMA Circular No. 93 & 94 were used to guide the compilation of the 2019/20 MTREF
The main challenges experienced during the compilation of the 2019/20 MTREF can be Summarised as follows:
1. The on-going difficulties in the national and local economy; 2. Aging and poor water, electricity and roads infrastructure; 3. Poor water supply in all towns of the Municipality. 4. The need to reprioritise projects and expenditure within the existing resource
envelope given the cash flow realities and declining cash position of the municipality; 5. The increased cost of bulk water and electricity (due to tariff increases from
Department of Water and Sanitation and Eskom), which is placing upward pressure on service tariffs to residents. Continuous high tariff increases are not sustainable – we are fast reaching a point where services are will no longer be affordable; and as a result of this, the debt is growing
6. Wage increases for municipal staff 7. Affordability of capital projects funded internally
MLM: FS181 FINAL BUDGET AND MTREF 2019-2020
9
The following budget principles and guidelines directly informed the compilation of the 2019/20 MTREF: The 2018/19 Original Budget priorities and targets of Masilonyana Local Municipality, as well as the base line allocations, contained in that Budget were adopted as the upper limits for the new baselines for the 2019/20 annual budget; Tariff and property rate increases should be affordable. In addition, tariffs need to remain or move towards being cost reflective, and should take into account the need to address Infrastructure backlogs; and as a results tariffs were increased by 5.2% as per MFMA Circular 94 CPi estimates, however electricity tariffs were increased by 13.07% as per the NERSA guideline as approved by NERSA.
1.4 Charting the Way Forward
In view of the aforementioned, the following table is a consolidated overview of the proposed
2019/2020 Medium-term Revenue and Expenditure Framework:
1.4 ANNUAL BUDGET TABLES
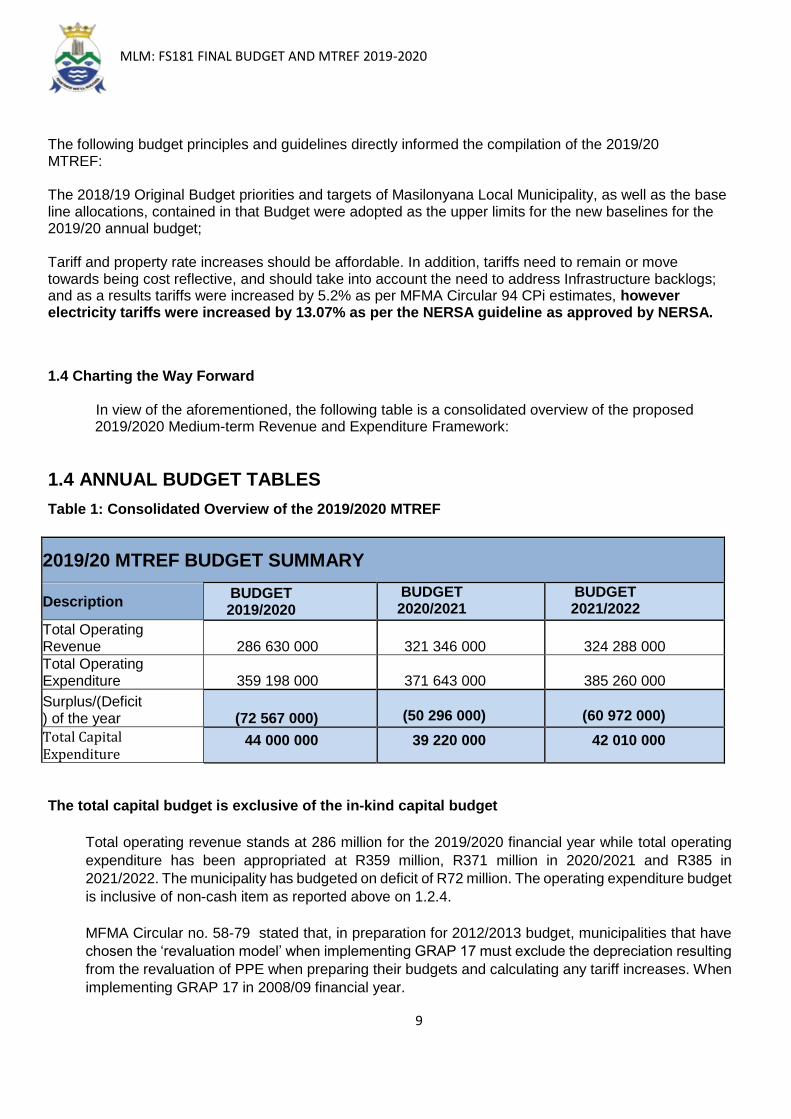
Table 1: Consolidated Overview of the 2019/2020 MTREF
2019/20 MTREF BUDGET SUMMARY
Description BUDGET 2019/2020
BUDGET 2020/2021
BUDGET 2021/2022
Total Operating Revenue 286 630 000
321 346 000
324 288 000
Total Operating Expenditure 359 198 000
371 643 000
385 260 000
Surplus/(Deficit) of the year (72 567 000)
(50 296 000)
(60 972 000)
Total Capital Expenditure
44 000 000 39 220 000 42 010 000
The total capital budget is exclusive of the in-kind capital budget
Total operating revenue stands at 286 million for the 2019/2020 financial year while total operating
expenditure has been appropriated at R359 million, R371 million in 2020/2021 and R385 in
2021/2022. The municipality has budgeted on deficit of R72 million. The operating expenditure budget
is inclusive of non-cash item as reported above on 1.2.4.
MFMA Circular no. 58-79 stated that, in preparation for 2012/2013 budget, municipalities that have
chosen the ‘revaluation model’ when implementing GRAP 17 must exclude the depreciation resulting
from the revaluation of PPE when preparing their budgets and calculating any tariff increases. When
implementing GRAP 17 in 2008/09 financial year.

MLM: FS181 FINAL BUDGET AND MTREF 2019-2020
10
However, there continues to be a focus to reduce the deficit for the municipality in line with National
Treasury circular 72 requirements, to produce a funded surplus budget which is now not the case
due to the high non-cash items and low revenue collection estimates. In line with this requirement
and with implementation of financial turnaround strategy the municipality projects to achieve
moderate surpluses in the years following 2019/2020. This would be achieved through the re-
structuring of tariffs that are cost reflective and improved collection of revenue which is estimated at
73.5% for this budget year.
Masilonyana Local Municipality has had to take a more conservative approach in the manner in which
it approaches the budgeting. This approach includes giving consideration in the budget to the cost
containment measures suggested by National Treasury in Circular 80 and 82 in line with the
Municipality’s revenue enhancement strategy.
These measures will be implemented in an attempt to ensure the future viability of the institution and
to focus on reducing the impact on the residents within our community.
The capital budget of R44 million has been provided for 2019/2020, R39 million 2020/21 and R42
million in 2021/22. There will be no own funded capital projects appropriated in the 2019/2020 MTREF
due financial situation of the Municipalit, however as and when a need arises for a capital project
funded internally and there are funds available, such project will be implemented accordingly.
Table 2: Summary of revenue classified by main revenue source
Services charges forms the largest component of the revenue basket for the municipality which amounts
to R109 million The second largest source is property rates at R48 million when we are not considering
grant and subsidies.
Operational Transfers and subsidies constitutes R 122 million of the operating budget.
FS181 Masilonyana - Table A4 Budgeted Financial Performance (revenue and expenditure)
Description Ref 2015/16 2016/17 2017/18
R thousand 1Audited
Outcome
Audited
Outcome
Audited
Outcome
Original
Budget
Adjusted
Budget
Full Year
Forecast
Pre-audit
outcome
Budget Year
2019/20
Budget Year
+1 2020/21
Budget Year
+2 2021/22
Revenue By Source
Property rates 2 35,062 29,434 42,213 44,450 44,450 44,450 44,450 48,006 50,598 53,330
Service charges - electricity revenue 2 16,933 20,364 31,540 32,182 32,182 32,182 34,630 36,580 55,848 40,637
Service charges - water revenue 2 31,327 30,056 34,563 36,403 36,403 36,403 40,167 38,296 40,364 42,544
Service charges - sanitation revenue 2 15,306 17,722 19,676 20,396 20,396 20,396 23,269 21,456 22,615 23,836
Service charges - refuse revenue 2 7,196 8,709 12,945 12,637 12,637 12,637 15,046 13,294 14,012 14,768
Rental of facilities and equipment 308 339 149 157 157 157 157 165 174 183
Interest earned - external investments 384 63 564 594 594 594 594 625 659 694
Interest earned - outstanding debtors 7,555 28,990 4,757 5,179 5,179 5,179 5,179 5,448 5,742 6,052
Dividends received 5 2 6 8 8 8 8 8 8 8
Fines, penalties and forfeits 260 224 1 500 500 500 500 526 554 584
Licences and permits – – –
Agency services – – –
Transfers and subsidies 93,098 105,315 89,833 110,412 110,412 110,412 110,412 121,876 130,403 141,262
Other revenue 2 1,316 6,603 3,760 – – – – 350 369 389
Gains on disposal of PPE – – – – – – – – – –
Total Revenue (excluding capital transfers and
contributions)
208,750 247,821 240,006 262,917 262,917 262,917 274,411 286,630 321,346 324,288
2019/20 Medium Term Revenue & Expenditure
FrameworkCurrent Year 2018/19

MLM: FS181 FINAL BUDGET AND MTREF 2019-2020
11
Table 3 Operating Transfers and Grant Receipts
Summary of Rates and Service Charge Tariff implications to the 2019/20
MTREF Budget
Tariff-setting is a pivotal and strategic part of the compilation of any budget. When rates, tariffs and other
charges were revised local economic conditions, the wage agreements with unions, other input costs of
services provided by the municipality, the municipality’s indigent policy and the affordability of services were
taken into account to ensure the financial sustainability of the Municipality.
The percentage increases of both Eskom and Water bulk tariffs are beyond the South African Reserve
Bank inflation target. Given that these tariff increases are determined by external agencies, the impact they
have on the municipality are largely outside the control of the municipality. The Eskom price increase of
bulk electricity supplied to municipalities will increase by 15.63 percent on bulk electricity, as approved by
Nersa, which then resulted in the Municipality applying an increase of 13.07% for electricity tariffs, however
still awaiting approval for such increase.
The basket of goods and services utilised for the calculation of the CPIX consist of items such as food,
petrol and medical services, whereas the cost drivers of a municipality are informed by items such as the
cost of remuneration, bulk purchases of electricity and water, petrol, diesel, materials and chemicals.
FS181 Masilonyana - Supporting Table SA18 Transfers and grant receipts
Description Ref 2015/16 2016/17 2017/18
R thousandAudited
Outcome
Audited
Outcome
Audited
Outcome
Original
Budget
Adjusted
Budget
Full Year
Forecast
Budget Year
2019/20
Budget Year
+1 2020/21
Budget Year
+2 2021/22
RECEIPTS: 1, 2
Operating Transfers and Grants
National Government: 92,163 92,334 97,714 110,412 110,412 110,412 121,876 130,403 141,262
Local Government Equitable Share 88,321 79,723 86,054 103,492 103,492 103,492 114,822 123,725 133,653
Finance Management 1,800 1,825 1,900 1,970 1,970 1,970 1,970 2,402 3,131
Municipal Systems Improvement 930
EPWP Incentive 1,112 1,147 1,000 1,000 1,000 1,000 1,000
Energy Efficiency and Demand Management 6,000 5,000 – – –
Councillors support Grant 3,639 3,760 3,950 3,950 3,950 4,084 4,276 4,478
Provincial Government: – – 12,576 – – – – – –
Cogta Financial Relief grant 12,576
Councillors support Grant
District Municipality: – – – – – – – – –
[insert description]
Other grant providers: – – – – – – – – –
[insert description]
Total Operating Transfers and Grants 5 92,163 92,334 110,290 110,412 110,412 110,412 121,876 130,403 141,262
Current Year 2018/192019/20 Medium Term Revenue & Expenditure
Framework

MLM: FS181 FINAL BUDGET AND MTREF 2019-2020
12
The current challenge that will face MLM is managing the gap between cost drivers and tariffs levied, as
any shortfall must be made up by either operational efficiency gains or service level reductions. Within this
framework the municipality has undertaken the tariff setting process relating to service charges as follows:
1.3.2 Operating Expenditure Framework
The Council’s expenditure framework for the 2019/20 budget and MTREF is informed by the
following:
1. repairs and maintenance plan;
2. Funding of the budget over the medium-term as informed by Section 18 and 19 of the MFMA
3. The capital programme the capital budget implementation plan.
4. Operational gains and efficiencies will be directed to funding the capital budget and other core
services; and
5. Strict adherences to the principle of no project plan no budget. If there is no business plan,
procurement plans, no funding allocation can be made.
6. Implementation of Cost Containment MFMA Circulars
The following table is a high level summary of the 2019/2020 budget and MTREF
Figure 2: Expenditure by major type for the 2019/2020 financial year
Expenditure: 2019/2020
The budgeted allocation for employee related costs for the 2019/2020 financial year amounts to R98 million,
which equals 27 percent of the total operating expenditure; Employee related cost overall will increase by
5.1% due to minimal increase on overtime payments, and 5.4 percent for the 20120/21 and 2021/2022
financial year in terms of the MFMA circular 94. Overall the total employee related cost and councillors
remuneration totals to 30 percent of the budget.
FS181 Masilonyana - Table A4 Budgeted Financial Performance (revenue and expenditure)
Description Ref 2015/16 2016/17 2017/18
R thousand 1Audited
Outcome
Audited
Outcome
Audited
Outcome
Original
Budget
Adjusted
Budget
Full Year
Forecast
Pre-audit
outcome
Budget Year
2019/20
Budget Year
+1 2020/21
Budget Year
+2 2021/22
2019/20 Medium Term Revenue & Expenditure
FrameworkCurrent Year 2018/19
Expenditure By Type
Employee related costs 2 86,295 85,165 89,286 94,018 94,018 94,018 94,018 98,372 103,202 108,789
Remuneration of councillors 6,253 6,071 6,893 7,258 7,258 7,258 7,258 7,636 8,048 8,483
Debt impairment 3 69,331 95,590 35,000 51,324 51,324 51,324 51,324 89,423 89,444 94,275
Depreciation & asset impairment 2 56,167 76,017 26,534 27,940 27,940 27,940 27,940 51,761 54,411 57,350
Finance charges 6,847 11,038 1,335 1,406 1,406 1,406 1,406 1,479 1,558 1,643
Bulk purchases 2 33,711 36,293 24,453 42,848 42,848 42,848 42,848 54,172 56,660 59,296
Other materials 8 10,366 12,961 11,059 13,952 13,952 13,952 13,952 7,823 8,264 8,663
Contracted services – – 3,175 3,818 3,818 3,818 3,818 24,607 25,521 23,831
Transfers and subsidies – – – – – – – – – –
Other expenditure 4, 5 40,904 36,738 23,565 30,197 30,197 30,197 30,197 23,926 24,534 22,929
Loss on disposal of PPE 101 324 – – – – – – – –
Total Expenditure 309,974 360,197 221,299 272,761 272,761 272,761 272,761 359,198 371,643 385,260

MLM: FS181 FINAL BUDGET AND MTREF 2019-2020
13
The following are highlights of the components of operating expenditure:
1. As per MFMA circular 86 respectively, overtime is only being provided for emergency services and
other critical functions; this is an item that was growing as management did not have proper
monitoring and control over it, however, the policy that will regulate overtime and procedures has
been develop to address it.
2. The cost associated with the remuneration of councillors is determined by the Minister of Co-
operative Governance and Traditional Affairs in accordance with the Remuneration of Public Office
Bearers Act, 1998 (No. 20 of 1998).
3. The most recent proclamation (Government Gazette no. 35962) in this regard has been taken into
account in compiling the municipality’s budget and an increase of 5.2 percent has factored in as
per the MFMA circular 94 taking into consideration grading number 3 of the municipality;
4. The provision of debt impairment was determined based on an annual collection rate of 50 %, 50
% of the debt has been impaired against the bad debtors and the remainder on revenue foregone
(Exempt property rates, discounts/incentives and interest write offs). For the 2019/2020 financial
year this amount equates to R89 million. While this expenditure is considered to be a non-cash flow
item; it informs the total cost associated with rendering the services of the municipality, as well as
the municipality’s realistically anticipated revenues.
5. Provision for depreciation and asset impairment has been informed by the Municipality’s Asset
Management. Depreciation is widely considered a proxy for the measurement of the rate asset of
consumption of assets. Budget appropriations in this regard total R52 million for the 2019/2020
financial year and equates to 14 percent of the total operating expenditure.
6. Finance charges consist primarily of interest on ESKOM outstanding debt
7. Bulk purchases are directly informed by the purchase of electricity from Eskom and water boards.
The Eskom payment plans has been taken into consideration for this years budgeted. The increases
have been factored into the budget appropriations and directly inform the revenue provisions. With
regards to water, there’s currently no payment plan in place between the Muncipality and San-vet
and that will be factored in as soon as an agreement of plan is in place.
8. The Bulk purchase constitutes 15 percent of the total operating budget. It is therefore imperative
that the municipality prioritise the reduction of the distribution losses to maximum income generation
from this expenditure item. The municipality has been ensuring that the distribution losses are
minimised and calculated on a monthly basis. The Municipality still need to make use of bulk meters
to have control on the distribution of water especially in the wards where there’s non-payments.

MLM: FS181 FINAL BUDGET AND MTREF 2019-2020
14
9. In line with the Masilonyana’s repairs and maintenance plan, this group of expenditure has been
prioritized to ensure sustainability of the infrastructure. For 2019/2020 a provision of R14.6 million
has been secured. The municipality has been granted 5% of the MIG projects to be allocated to the
repairs and maintenance. This is still under the MFMA circular 74 Guideline which stipulates that
the Municipality must budget for at least 8% of the total asset carrying value, which in these case
the Municipality does not comply due to financial constraints.
10. Contracted services takes into consideration the cost of mSCOA implementation support,
government garage, provision for landfill site and R&M (as classified by mSCOA as contracted
services). In the 2019/20 financial year, this expenditure category totals R24.6 million which
constitutes 7% of the operating budget.
11. Other general expenses have been identified as one of the highest cost drivers for the municipality.
In the 2019/2020 financial year, this group of expenditure totals R24 million or 7 percent of the total
operational budget. In this item, there’s security services that the municipality has made provision
for. There’s uniforms to ensure safety of employees , this makes provision for uniforms/protective
clothing for employees under Electrical department to comply with Electricity standards. And the
provision is also made for legal services and training to address litigations and legal matters, and
to capacitate the employees of the Municipality.
1.3.2.2 Free Basic Services: Basic Social Services Package
The social package assists households that are poor or face other circumstances that limit their ability to
pay for services. To receive these free services the households are required to register in terms of the MLM
Indigent Management Policy. The target is to register 6500 or more indigents households during the
2019/2020 over MTREF financial year, a process reviewed annually. The Indigent is an ongoing process
where in anyone can lose their jobs as a result of this they may be declared as indigent , we will however
be adjusting the budget if we reach that target. Detail relating to free services, cost of free basic services,
revenue lost owing to free basic services as well as basic service delivery measurement is contained in
Table 23 MBRR A10 (Basic Service Delivery Measurement).
The cost of the social package of the registered indigent households is largely financed by national
government through the local government equitable share of R119 million receivable in terms of the annual
Division of Revenue Bill.
Table 5: Capital expenditure by vote

MLM: FS181 FINAL BUDGET AND MTREF 2019-2020
15
The following table provides a breakdown of budgeted capital expenditure by vote.
Table 6: Capital expenditure by Standard Classification
Description Ref
R thousand July August Sept. October Nov. Dec. January Feb. March April May JuneBudget Year
2018/19
Budget Year
+1 2019/20
Budget Year
+2 2020/21
Budget Year 2018/19Medium Term Revenue and Expenditure
Framework
FS181 Masilonyana - Supporting Table SA29 Budgeted monthly capital expenditure (functional classification)
Description Ref
R thousand July August Sept. October Nov. Dec. January Feb. March April May JuneBudget Year
2019/20
Budget Year
+1 2020/21
Budget Year
+2 2021/22
Capital Expenditure - Functional 1
Governance and administration – – – – – – – – – – – – – – –
Executive and council – – – –
Finance and administration – – – –
Internal audit – – – –
Community and public safety 126 351 804 1,250 450 465 994 1,323 950 986 750 1,603 10,054 5,752 5,697
Community and social services – – – 3,302
Sport and recreation 126 351 804 1,250 450 465 994 1,323 950 986 750 1,603 10,054 1,099 1,307
Public safety – – 4,653 1,088
Housing – – – –
Health – – – –
Economic and environmental services – – – – – – – – – – – – – – 14,585
Planning and development – – – –
Road transport – – – 14,585
Environmental protection – – – –
Trading services – 331 1,780 726 792 1,695 289 743 730 830 804 25,226 33,946 33,468 21,728
Energy sources 1,200 1,450 860 3,510 4,914 5,184
Water management 11,951 11,951 11,202 12,000
Waste water management 331 580 726 792 245 289 743 730 830 804 12,184 18,254 17,352 4,544
Waste management 231 231 – –
Other – – – –
Total Capital Expenditure - Functional 2 126 681 2,584 1,976 1,242 2,160 1,283 2,066 1,681 1,817 1,554 26,829 44,000 39,220 42,010
Funded by:
National Government 1,952 3,378 4,266 4,294 3,078 1,416 1,674 2,702 2,468 2,693 2,487 13,591 44,000 39,220 42,010
Provincial Government – – – –
District Municipality – – – –
Other transfers and grants – – – –
Transfers recognised - capital 1,952 3,378 4,266 4,294 3,078 1,416 1,674 2,702 2,468 2,693 2,487 13,591 44,000 39,220 42,010
Borrowing – – – –
Internally generated funds – – – –
Total Capital Funding 1,952 3,378 4,266 4,294 3,078 1,416 1,674 2,702 2,468 2,693 2,487 13,591 44,000 39,220 42,010
Budget Year 2019/20Medium Term Revenue and Expenditure
Framework
FS181 Masilonyana - Table A5 Budgeted Capital Expenditure by vote, functional classification and funding
Vote Description Ref 2014/15 2015/16 2016/17
R thousand 1Audited
Outcome
Audited
Outcome
Audited
Outcome
Original
Budget
Adjusted
Budget
Full Year
Forecast
Pre-audit
outcome
Budget Year
2018/19
Budget Year
+1 2019/20
Budget Year
+2 2020/21
2018/19 Medium Term Revenue &
Expenditure FrameworkCurrent Year 2017/18
Capital Expenditure - Functional
Governance and administration 64,000 2,655 2,588 1,221 1,221 1,221 1,221 – – –
Executive and council 64,000 2,655 2,588 1,151 1,151 1,151 1,151 – – –
Finance and administration 70 70 70 70 – – –
Internal audit – – – –
Community and public safety – – 495 4,224 4,224 4,224 4,224 10,054 5,752 5,697
Community and social services 405 3,098 3,098 3,098 3,098 – – 3,302
Sport and recreation 0 1,036 1,036 1,036 1,036 10,054 1,099 1,307
Public safety 90 90 90 90 90 – 4,653 1,088
Housing – – – –
Health – – – – – – – – – –
Economic and environmental services – 13,841 9,091 5,132 5,132 5,132 5,132 – – 14,585
Planning and development 1,000 1,000 1,000 1,000 – – –
Road transport 13,841 9,091 4,132 4,132 4,132 4,132 – – 14,585
Environmental protection – – – –
Trading services – – 22,384 24,602 24,602 24,602 24,602 33,946 33,468 21,728
Energy sources 6,750 1,000 1,000 1,000 1,000 3,510 4,914 5,184
Water management 13,634 14,232 14,232 14,232 14,232 11,951 11,202 12,000
Waste water management – 6,770 6,770 6,770 6,770 18,254 17,352 4,544
Waste management 2,000 2,600 2,600 2,600 2,600 231 – –
Other – – – –
Total Capital Expenditure - Functional 3 64,000 16,496 34,558 35,179 35,179 35,179 35,179 44,000 39,220 42,010
Funded by:
National Government 64,000 13,925 30,913 34,019 34,019 34,019 34,019 44,000 39,220 42,010
Provincial Government – – –
District Municipality – – – – – – – – – –
Other transfers and grants – – – – – – – – – –
Transfers recognised - capital 4 64,000 13,925 30,913 34,019 34,019 34,019 34,019 44,000 39,220 42,010
Borrowing 6 – – – – – – – – – –
Internally generated funds 3,645 1,160 1,160 1,160 1,160 – – –
Total Capital Funding 7 64,000 13,925 34,558 35,179 35,179 35,179 35,179 44,000 39,220 42,010

MLM: FS181 FINAL BUDGET AND MTREF 2019-2020
16
In the 2019/2020 an amount of R34 million has been appropriated for the trading services which
represents 77 percent of the total capital budget followed by the Community and Public safety with
an amount of R23 million which represent 19 percent.
Expenditure in new assets represents 82% of the total capital budget while asset renewal equates
to18%. Further detail relating to asset classes and proposed capital expenditure is contained in
Table SA 34(a) and (b) and A9 (Asset Management) of the MBRR.
In addition to the MBRR Table A9, MBRR Tables SA34a, b, c provides a detailed breakdown of the
capital programme relating to new asset construction, capital asset renewal as well as operational
repairs and maintenance by asset class.
Some of the salient projects to be undertaken over the medium-term includes amongst others:
Table 7: Capital Budget per Infrastructure Type
a. Annual Budget Tables
The following pages present the ten main budget tables as required in terms of section 8 of the
Municipal Budget and Reporting Regulations.
These tables set out the municipality’s 2019/20 budget and MTREF as approved by Council. Each
table is accompanied by explanatory notes on the facing page.
Table8: MBRR A1-Consolidated Budget Summary
FS181 Masilonyana - Supporting Table SA36 Detailed capital budget
R thousand
Function Project Description Project Number Type MTSF Service Outcome IUDF Own Strategic Objectives Asset Class Asset Sub-Class Ward Location GPS Longitude GPS Lattitude
Audited
Outcome
2017/18
Current Year
2018/19
Full Year
Forecast
Budget Year
2019/20
Budget Year
+1 2020/21
Budget Year
+2 2021/22
Parent municipality:
List all capital projects grouped by Function
PMU PMU 1,621 1,227 1,307
MIG/FS/0842/SW/11/11 Brandfort/Majwemasweu: Upgrading of the Waste Disposal Site Landfill Sites 231 –
MIG/FS/0855/W/11/11 Theunissen/Masilo: Installation of 3720 domestic, 2 zonal and 4 bulk water meters Capital Spares 17 –
MIG/FS/0856/W/11/11 Verkeerdevlei/Tshepong: Installation of 505 domestic, 2 zonal and 5 bulk water meters Capital Spares 14 –
MIG/FS/0857/W 11/11 Brandfort/Majwemasweu: Installation of 2719 domestic, 3 zonal and 3 bulk water meters Capital Spares 14 –
MIG/FS/0859/W/11/11 Winburg/Makeleketla: Installation of 3122 domestic and 3 zonal water meters Capital Spares 15 –
MIG/FS1080/CF/15/17 Masilo: Refurbishment of sport facility (MIS:233721) Outdoor Facilities 1,603 1,104 1,307
MIG/FS1081/ST/15/17 Masilo: Construction of 3.5km lined storm water channel (MIS:233705) Storm water Conveyance – 8,567 451
MIG/FS1121/R,ST/16/17 Brandfort/Majwemasweu: Construction of 1km block paving road and storm water (MIS:240012) Reservoirs – –
MIG/FS1130/C/16/17 Brandfort/Majwemasweu: Fencing of community cemetery and construction of ablution facilities (MIS:241660) Roads – 2,903
MIG/FS1153/ST/16/18 Winburg/Makeleketla: Construction of 2km storm water drainage (MIS:240379) Roads 4,754 250
MIG/FS1154/ST/16/18 Verkeerdevlei/Tshepong: Construction of 1.5km storm water drainage (MIS:254881) Cemeteries/Crematoria – 4,501 340
MIG/FS1290/HL/20/20 Masilonyana: Construction of 8 high mast lights in various towns (MIS:317762) Drainage Collection 310
Verkeerdevlei/Tshepong: Construction of a water reticulation network and house connections for 317 erven (MIS:293620) Drainage Collection 2,691 202
Verkeerdevlei/Tshepong: Construction of a sewer reticulation network and house connections for 317 erven (MIS:293609) Cemeteries/Crematoria 2,875 336
Verkeerdevlei/Tshepong: Construction of Oxidation ponds Cemeteries/Crematoria 5,565 4,984 549
Parent Capital expenditure – – 19,710 21,170 6,856
2019/20 Medium Term Revenue & Expenditure
Framework

MLM: FS181 FINAL BUDGET AND MTREF 2019-2020
17
Description 2015/16 2016/17 2017/18
R thousandsAudited
Outcome
Audited
Outcome
Audited
Outcome
Original
Budget
Adjusted
Budget
Full Year
Forecast
Pre-audit
outcome
Budget Year
2019/20
Budget Year
+1 2020/21
Budget Year
+2 2021/22
Financial Performance
Property rates 35,062 29,434 42,213 44,450 44,450 44,450 44,450 48,006 50,598 53,330
Service charges 70,762 76,851 98,724 101,618 101,618 101,618 113,112 109,627 132,839 121,786
Investment revenue 384 63 564 594 594 594 594 625 659 694
Transfers recognised - operational 93,098 105,315 89,833 110,412 110,412 110,412 110,412 121,876 130,403 141,262
Other own revenue 9,444 36,158 8,673 5,843 5,843 5,843 5,843 6,497 6,847 7,216
Total Revenue (excluding capital transfers and
contributions)
208,750 247,821 240,006 262,917 262,917 262,917 274,411 286,630 321,346 324,288
Employee costs 86,295 85,165 89,286 94,018 94,018 94,018 94,018 98,372 103,202 108,789
Remuneration of councillors 6,253 6,071 6,893 7,258 7,258 7,258 7,258 7,636 8,048 8,483
Depreciation & asset impairment 56,167 76,017 26,534 27,940 27,940 27,940 27,940 51,761 54,411 57,350
Finance charges 6,847 11,038 1,335 1,406 1,406 1,406 1,406 1,479 1,558 1,643
Materials and bulk purchases 44,077 49,254 35,511 56,800 56,800 56,800 56,800 61,995 64,924 67,959
Transfers and grants – – – – – – – – – –
Other expenditure 110,336 132,652 61,740 85,339 85,339 85,339 85,339 137,955 139,499 141,035
Total Expenditure 309,974 360,197 221,299 272,761 272,761 272,761 272,761 359,198 371,643 385,260
Surplus/(Deficit) (101,224) (112,377) 18,707 (9,844) (9,844) (9,844) 1,650 (72,567) (50,296) (60,972)
Transfers and subsidies - capital (monetary allocations) (National / Provincial and District)65,579 15,139 30,913 34,019 34,019 34,019 34,019 45,621 40,447 43,317
Contributions recognised - capital & contributed assets – – 3,645 – – – – – – –
Surplus/(Deficit) after capital transfers & contributions
(35,645) (97,238) 53,265 24,175 24,175 24,175 35,669 (26,946) (9,849) (17,655)
Share of surplus/ (deficit) of associate – – – – – – – – – –
Surplus/(Deficit) for the year (35,645) (97,238) 53,265 24,175 24,175 24,175 35,669 (26,946) (9,849) (17,655)
Capital expenditure & funds sources
Capital expenditure 64,000 16,496 34,558 35,179 35,179 35,179 35,179 44,000 39,220 42,010
Transfers recognised - capital 64,000 13,925 30,913 34,019 34,019 34,019 34,019 44,000 39,220 42,010
Borrowing – – – – – – – – – –
Internally generated funds – – 3,645 1,160 1,160 1,160 1,160 – – –
Total sources of capital funds 64,000 13,925 34,558 35,179 35,179 35,179 35,179 44,000 39,220 42,010
Financial position
Total current assets 46,435 51,798 240,882 318,070 318,070 318,070 318,070 1,478,307 735,920 438,817
Total non current assets 797,250 697,177 712,610 712,610 712,610 712,610 712,610 9,090 22,709 7,239
Total current liabilities 142,584 180,589 235,482 142,672 142,672 142,672 142,672 139,927 84,125 82,253
Total non current liabilities 45,291 41,244 33,499 1,015 1,015 1,015 1,015 – – –
Community wealth/Equity 667,971 527,142 684,510 886,992 886,992 886,992 886,992 (124,051) (668,797) 62,596
Cash flows
Net cash from (used) operating (10,631) 14,434 101,919 47,963 47,963 47,963 47,963 36,289 35,038 47,872
Net cash from (used) investing (5,838) (8,871) (33,568) (34,019) (34,019) (34,019) (34,019) (44,000) (39,220) (42,010)
Net cash from (used) financing (228) (553) (752) (783) (783) (783) (783) (779) – –
Cash/cash equivalents at the year end (16,697) 5,010 67,599 13,161 13,161 13,161 13,161 (8,490) (12,672) (6,810)
Cash backing/surplus reconciliation
Cash and investments available 1,001 6,029 (38,193) 985 985 985 985 1,012 1,095 –
Application of cash and investments 128,868 173,749 (51,606) (73,691) (73,691) (73,691) (58,541) (265,921) (263,418) (146,039)
Balance - surplus (shortfall) (127,867) (167,720) 13,413 74,676 74,676 74,676 59,526 266,933 264,513 146,039
Asset management
Asset register summary (WDV) 827,123 713,073 443,732 414,770 414,770 414,770 414,770 697,177 734,825 774,505
Depreciation 56,167 76,017 26,535 27,890 27,890 27,890 27,890 51,624 54,412 57,350
Renewal and Upgrading of Existing Assets – 4,373 – 8,170 8,170 8,170 8,170 1,834 5,203 2,687
Repairs and Maintenance 11,884 12,961 11,059 13,672 13,672 13,672 13,672 14,396 15,174 15,993
Free services
Cost of Free Basic Services provided 8,696 8,696 8,696 11,494 11,494 11,494 12,091 12,091 12,744 13,432
Revenue cost of free services provided 3,581 3,817 4,062 4,277 4,277 4,277 4,500 4,500 4,743 4,999
Households below minimum service level
Water: 0 0 0 0 0 0 0 0 0 0
Sanitation/sewerage: 2 2 2 2 2 2 2 2 2 2
Energy: – – – – – – – – – –
Refuse: – – – – – – – – – –
2019/20 Medium Term Revenue & Expenditure
FrameworkCurrent Year 2018/19
FS181 Masilonyana - Table A1 Budget Summary

MLM: FS181 FINAL BUDGET AND MTREF 2019-2020
18
Explanatory notes to MBRR Table A1 - Budget Summary
1. Table A1 is a budget summary and provides a concise overview of the municipality’s budget from
all of the major financial perspectives (operating, capital expenditure, financial position, cash flow,
and MFMA funding compliance);
2. The table provides an overview of the amounts approved by Council for operating performance,
resources deployed to capital expenditure, financial position, cash and funding compliance, as well
as the municipality’s commitment to eliminating basic service delivery backlogs;
3. Financial management reforms emphasises the importance of the municipal budget being funded.
This requires the simultaneous assessment of the Financial Performance, Financial Position and
Cash Flow Budgets, along with the Capital Budget. The Budget Summary provides the key
information in this regard;
4. After all consultation with the community and the provincial government and Provincial Treasury,
the municipality has budgeted for a balanced budget which will force the municipality to better
manage the cash-flow and also radically implement the cost containment measures from 1 July
2016 over the MTREF;
5. Capital expenditure is balanced by capital funding sources funded by National Government.
6. Internally generated funds will mainly provide for Township establishment infrastructure.
7. The Cash backing/surplus reconciliation shows that in previous financial years the municipality was
not paying much attention to managing this aspect of its finances, and consequently many of its
obligations are not cash-backed. These places the municipality in a very vulnerable financial
position, as the recent slow-down in revenue collections highlighted. Consequently Council has
taken a deliberate decision to ensure adequate cash-backing for all material obligations in
accordance with the recently adopted Funding and Reserves Policy. This cannot be achieved in
one financial year.
8. Even though the Council is placing great emphasis on securing the financial sustainability of the
municipality, this is not being done at the expense of services to the community and the poor. The
section of Free Services shows that the amount spent on Free Basic Services and the revenue cost
of free services provided by the municipality continues to increase. In addition, the municipality
continues to make progress in addressing service delivery backlogs

MLM: FS181 FINAL BUDGET AND MTREF 2019-2020
19
Table 9: MBRR A-2 Consolidated Budget Financial Performance (Revenue and Expenditure by
Standard Classification)
Explanatory notes to MBRR Table A2 - Budgeted Financial Performance (revenue and expenditure
by standard classification)
1. Table A2 is a view of the budgeted financial performance in relation to revenue and expenditure per
standard classification. The modified GFS standard classification divides the municipal services into
15 functional areas. Municipal revenue, operating expenditure and capital expenditure are then
classified in terms if each of these functional areas which enables the National Treasury to compile
„whole of government‟ reports;
FS181 Masilonyana - Table A2 Budgeted Financial Performance (revenue and expenditure by functional classification)
Functional Classification Description Ref 2015/16 2016/17 2017/18
R thousand 1Audited
Outcome
Audited
Outcome
Audited
Outcome
Original
Budget
Adjusted
Budget
Full Year
Forecast
Budget Year
2019/20
Budget Year
+1 2020/21
Budget Year
+2 2021/22
Revenue - Functional
Governance and administration 137,173 83,362 138,779 87,894 87,894 87,894 177,004 188,507 202,502
Executive and council (1,058) 45,656 85,579 29,372 29,372 29,372 – – –
Finance and administration 138,113 37,706 53,200 58,522 58,522 58,522 177,004 188,507 202,502
Internal audit 119 – – – – – – – –
Community and public safety 1,236 141 150 26,441 26,441 26,441 – – –
Community and social services 976 140 149 18,759 18,759 18,759 – – –
Sport and recreation – – – 4,268 4,268 4,268 – – –
Public safety 260 1 1 2,080 2,080 2,080 – – –
Housing – – – 1,334 1,334 1,334 – – –
Health – – – – – – – – –
Economic and environmental services – – 6 24,929 24,929 24,929 – – –
Planning and development – – – – – – – – –
Road transport – – 6 24,929 24,929 24,929 – – –
Environmental protection – – – – – – – – –
Trading services 129,058 165,495 127,418 170,326 170,326 170,326 121,718 145,583 135,218
Energy sources 20,270 46,581 42,888 60,532 60,532 60,532 39,156 58,563 43,499
Water management 77,832 34,758 48,145 63,654 63,654 63,654 42,255 44,537 46,942
Waste water management 20,295 20,769 22,098 28,308 28,308 28,308 24,479 25,801 27,194
Waste management 10,660 63,386 14,288 17,831 17,831 17,831 15,828 16,682 17,583
Other 4 – – – – – – – – –
Total Revenue - Functional 2 267,468 248,997 266,353 309,589 309,589 309,589 298,722 334,090 337,720
Expenditure - Functional
Governance and administration 172,558 208,022 185,204 80,846 80,846 80,846 147,024 147,911 170,707
Executive and council 100,734 6,628 96,179 25,624 25,624 25,624 33,171 36,700 28,552
Finance and administration 63,308 201,394 89,024 31,678 31,678 31,678 112,785 110,085 142,155
Internal audit 8,516 – – 23,543 23,543 23,543 1,068 1,126 –
Community and public safety 13,863 12,526 – 35,750 35,750 35,750 19,185 19,999 15,204
Community and social services 9,362 12,526 – 28,147 28,147 28,147 14,182 14,726 11,209
Sport and recreation 2,164 – – 3,085 3,085 3,085 2,132 2,247 2,368
Public safety 1,148 – – 3,184 3,184 3,184 1,465 1,544 1,627
Housing 1,189 – – 1,334 1,334 1,334 1,406 1,483 –
Health – – – – – – – – –
Economic and environmental services 54,300 3,332 11,059 24,408 24,408 24,408 16,734 19,120 13,585
Planning and development 5,789 – – 5,309 5,309 5,309 6,872 8,575 8,882
Road transport 48,510 3,332 11,059 19,099 19,099 19,099 9,861 10,545 4,703
Environmental protection – – – – – – – – –
Trading services 69,253 136,317 24,453 131,757 131,757 131,757 176,256 184,612 185,764
Energy sources 32,150 39,214 21,613 57,930 57,930 57,930 72,717 85,922 80,001
Water management 8,434 7,873 2,840 30,085 30,085 30,085 74,427 78,450 73,754
Waste water management 7,588 2,088 – 26,749 26,749 26,749 14,006 14,742 15,537
Waste management 21,082 87,142 – 16,993 16,993 16,993 15,106 5,498 16,471
Other 4 – – – – – – – – –
Total Expenditure - Functional 3 309,974 360,197 220,716 272,761 272,761 272,761 359,198 371,642 385,260
Surplus/(Deficit) for the year (42,507) (111,200) 45,637 36,828 36,828 36,828 (60,476) (37,552) (47,540)
Current Year 2018/192019/20 Medium Term Revenue & Expenditure
Framework

MLM: FS181 FINAL BUDGET AND MTREF 2019-2020
20
2. Note that as a general principle the revenues for the Trading Services should exceed their
expenditures. However the expenditure are higher than the revenue as a result of the Debt
impairment and Depreciation and assets impairment which are non-cash items. The table highlights
that this is the case for Electricity, Water and Waste water functions, but not the Waste management
function.
3. Other functions that show a deficit between revenue and expenditure are being financed from rates
revenues and other revenue sources reflected under the Finance and Admin.
Table 10: MBRR A-3 Consolidated Budgeted Financial Performance By Municipal Vote.
Explanatory notes to MBRR Table A3 - Budgeted Financial Performance (revenue and expenditure
by municipal vote)
1. Table A3 is a view of the budgeted financial performance in relation to the revenue and expenditure
per municipal vote. This table facilitates the view of the budgeted operating performance in relation
to the organisational structure of Masilonyana Local Municipality. This means it is possible to
present the operating surplus or deficit of a vote. The following table is an analysis of the surplus or
deficit for the electricity and water trading services.
FS181 Masilonyana - Table A3 Budgeted Financial Performance (revenue and expenditure by municipal vote)
Vote Description Ref 2015/16 2016/17 2017/18
R thousandAudited
Outcome
Audited
Outcome
Audited
Outcome
Original
Budget
Adjusted
Budget
Full Year
Forecast
Budget Year
2019/20
Budget Year
+1 2020/21
Budget Year
+2 2021/22
Revenue by Vote 1
Vote 1 - Finance & Admin 32,404 41,406 65,692 51,498 51,498 51,498 168,895 179,635 195,683
Vote 2 - Executive & Council 12,866 16,761 21,723 35,149 35,149 35,149 – – –
Vote 3 - Community and Social Services 14,644 3,340 149 14,768 14,768 14,768 – – –
Vote 4 - Internal Audit – – – – – – – – –
Vote 5 - Water Management 32,606 31,901 59,436 58,315 58,315 58,315 42,255 44,537 46,942
Vote 6 - Waste Water Management 19,484 22,770 31,978 28,308 28,308 28,308 24,479 25,801 27,194
Vote 7 - Waste Management 11,993 20,145 23,483 17,731 17,731 17,731 15,828 16,682 17,583
Vote 8 - Energy Sources 28,626 41,858 54,364 61,785 61,785 61,785 39,156 58,563 43,499
Vote 9 - Planning and Development 3,229 2,415 – – – – – – –
Vote 10 - Sports & Recreation 8,541 5,305 – 2,443 2,443 2,443 – – –
Vote 11 - Road Transport 48,479 48,540 1,000 1,000 1,000 1,000 – – –
Vote 12 - Health – – – – – – – – –
Vote 13 - Housing. 1,122 1,166 – 1,334 1,334 1,334 – – –
Vote 14 - Public Safety 1,316 1,642 – 2,080 2,080 2,080 – – –
Vote 15 - Finance & Admin 2 – – – – – – 8,109 8,872 6,819
Total Revenue by Vote 2 215,310 237,248 257,824 274,411 274,411 274,411 298,722 334,090 337,720
Expenditure by Vote to be appropriated 1
Vote 1 - Finance & Admin 176,035 33,549 20,532 31,678 31,678 31,678 83,526 80,049 113,170
Vote 2 - Executive & Council 4,786 44,473 37,075 49,168 49,168 49,168 33,171 36,700 28,552
Vote 3 - Community and Social Services 11,705 19,726 29,935 28,147 28,147 28,147 6,044 6,253 2,279
Vote 4 - Internal Audit – – – – – – 1,068 1,126 –
Vote 5 - Water Management 5,360 33,443 27,034 30,085 30,085 30,085 74,427 78,450 73,754
Vote 6 - Waste Water Management 26,739 21,791 20,094 26,749 26,749 26,749 14,006 14,742 15,537
Vote 7 - Waste Management 14,284 17,973 10,394 16,993 16,993 16,993 15,106 5,498 16,471
Vote 8 - Energy Sources 60,958 48,302 32,186 57,930 57,930 57,930 72,717 85,922 80,001
Vote 9 - Planning and Development 2,101 3,241 7,939 5,309 5,309 5,309 6,872 8,575 8,882
Vote 10 - Sports & Recreation 2,718 4,666 2,901 3,085 3,085 3,085 1,942 2,047 2,158
Vote 11 - Road Transport 30,965 32,653 31,633 22,283 22,283 22,283 9,861 10,545 4,703
Vote 12 - Health – 6 – – – – – – –
Vote 13 - Housing. 1,122 1,284 1,667 1,334 1,334 1,334 1,406 1,483 –
Vote 14 - Public Safety – 629 – – – – 8,760 9,129 8,930
Vote 15 - Finance & Admin 2 – – – – – – 28,637 29,379 28,985
Total Expenditure by Vote 2 336,773 261,735 221,389 272,761 272,761 272,761 357,544 369,899 383,422
Surplus/(Deficit) for the year 2 (121,463) (24,487) 36,435 1,650 1,650 1,650 (58,822) (35,809) (45,702)
Current Year 2018/192019/20 Medium Term Revenue & Expenditure
Framework

MLM: FS181 FINAL BUDGET AND MTREF 2019-2020
21
Table 11: MBRR A-4 Consolidated Budgeted Financial Performance (Revenue and Expenditure by
type)
Explanatory notes to Table A4 - Budgeted Financial Performance (revenue and expenditure)
1. Total revenue is R286 million in 2019/2020, R321 million and R324 million in 2020/2021 and
2021/2022 respectively.
2. Revenue to be generated from property rates is R48 million for 2019/2020 which represents 17%
of the operating revenue base of the municipality and therefore remains a significant funding source
for the municipality. It remains relatively constant over the medium-term. Services charges relating
FS181 Masilonyana - Table A4 Budgeted Financial Performance (revenue and expenditure)
Description Ref 2015/16 2016/17 2017/18
R thousand 1Audited
Outcome
Audited
Outcome
Audited
Outcome
Original
Budget
Adjusted
Budget
Full Year
Forecast
Pre-audit
outcome
Budget Year
2019/20
Budget Year
+1 2020/21
Budget Year
+2 2021/22
Revenue By Source
Property rates 2 35,062 29,434 42,213 44,450 44,450 44,450 44,450 48,006 50,598 53,330
Service charges - electricity revenue 2 16,933 20,364 31,540 32,182 32,182 32,182 34,630 36,580 55,848 40,637
Service charges - water revenue 2 31,327 30,056 34,563 36,403 36,403 36,403 40,167 38,296 40,364 42,544
Service charges - sanitation revenue 2 15,306 17,722 19,676 20,396 20,396 20,396 23,269 21,456 22,615 23,836
Service charges - refuse revenue 2 7,196 8,709 12,945 12,637 12,637 12,637 15,046 13,294 14,012 14,768
Rental of facilities and equipment 308 339 149 157 157 157 157 165 174 183
Interest earned - external investments 384 63 564 594 594 594 594 625 659 694
Interest earned - outstanding debtors 7,555 28,990 4,757 5,179 5,179 5,179 5,179 5,448 5,742 6,052
Dividends received 5 2 6 8 8 8 8 8 8 8
Fines, penalties and forfeits 260 224 1 500 500 500 500 526 554 584
Licences and permits – – –
Agency services – – –
Transfers and subsidies 93,098 105,315 89,833 110,412 110,412 110,412 110,412 121,876 130,403 141,262
Other revenue 2 1,316 6,603 3,760 – – – – 350 369 389
Gains on disposal of PPE – – – – – – – – – –
Total Revenue (excluding capital transfers and
contributions)
208,750 247,821 240,006 262,917 262,917 262,917 274,411 286,630 321,346 324,288
Expenditure By Type
Employee related costs 2 86,295 85,165 89,286 94,018 94,018 94,018 94,018 98,372 103,202 108,789
Remuneration of councillors 6,253 6,071 6,893 7,258 7,258 7,258 7,258 7,636 8,048 8,483
Debt impairment 3 69,331 95,590 35,000 51,324 51,324 51,324 51,324 89,423 89,444 94,275
Depreciation & asset impairment 2 56,167 76,017 26,534 27,940 27,940 27,940 27,940 51,761 54,411 57,350
Finance charges 6,847 11,038 1,335 1,406 1,406 1,406 1,406 1,479 1,558 1,643
Bulk purchases 2 33,711 36,293 24,453 42,848 42,848 42,848 42,848 54,172 56,660 59,296
Other materials 8 10,366 12,961 11,059 13,952 13,952 13,952 13,952 7,823 8,264 8,663
Contracted services – – 3,175 3,818 3,818 3,818 3,818 24,607 25,521 23,831
Transfers and subsidies – – – – – – – – – –
Other expenditure 4, 5 40,904 36,738 23,565 30,197 30,197 30,197 30,197 23,926 24,534 22,929
Loss on disposal of PPE 101 324 – – – – – – – –
Total Expenditure 309,974 360,197 221,299 272,761 272,761 272,761 272,761 359,198 371,643 385,260
Surplus/(Deficit) (101,224) (112,377) 18,707 (9,844) (9,844) (9,844) 1,650 (72,567) (50,296) (60,972)
Transfers and subsidies - capital (monetary
allocations) (National / Provincial and District) 65,579 15,139 30,913 34,019 34,019 34,019 34,019 45,621 40,447 43,317
Transfers and subsidies - capital (monetary
allocations) (National / Provincial Departmental
Agencies, Households, Non-profit Institutions, Private
Enterprises, Public Corporatons, Higher Educational
Institutions) 6 – – – – – – – – – –
Transfers and subsidies - capital (in-kind - all) – – 3,645 – – – – – – –
Surplus/(Deficit) after capital transfers &
contributions
(35,645) (97,238) 53,265 24,175 24,175 24,175 35,669 (26,946) (9,849) (17,655)
Taxation – – – – – – – – – –
Surplus/(Deficit) after taxation (35,645) (97,238) 53,265 24,175 24,175 24,175 35,669 (26,946) (9,849) (17,655)
Attributable to minorities – – – – – – – – – –
Surplus/(Deficit) attributable to municipality (35,645) (97,238) 53,265 24,175 24,175 24,175 35,669 (26,946) (9,849) (17,655)
Share of surplus/ (deficit) of associate 7 – – – – – – – – – –
Surplus/(Deficit) for the year (35,645) (97,238) 53,265 24,175 24,175 24,175 35,669 (26,946) (9,849) (17,655)
2019/20 Medium Term Revenue & Expenditure
FrameworkCurrent Year 2018/19
MLM: FS181 FINAL BUDGET AND MTREF 2019-2020
22
to electricity, water, sanitation and refuse removal constitutes the biggest component of the revenue
basket of the municipality totalling R110 million (38%) million for the 2019/2020.
3. Transfers recognised – operating includes the local government equitable share and other operating
grants from national and provincial government and they amount to R122million.
Table 12: MBRR A5 Consolidated Budgeted Capital Expenditure by Vote

MLM: FS181 FINAL BUDGET AND MTREF 2019-2020
23
Vote Description Ref 2015/16 2016/17 2017/18
R thousand 1Audited
Outcome
Audited
Outcome
Audited
Outcome
Original
Budget
Adjusted
Budget
Full Year
Forecast
Pre-audit
outcome
Budget Year
2019/20
Budget Year
+1 2020/21
Budget Year
+2 2021/22
Capital expenditure - Vote
Multi-year expenditure to be appropriated 2
Vote 1 - Finance & Admin – – – – – – – – – –
Vote 2 - Executive & Council – – – 261 261 261 261 – – –
Vote 3 - Community and Social Services – – 4 480 480 480 480 – – –
Vote 4 - Internal Audit – – – – – – – – – –
Vote 5 - Water Management – 3,057 346 – – – – 11,951 11,202 12,000
Vote 6 - Waste Water Management – – – 9,036 9,036 9,036 9,036 18,254 17,352 4,544
Vote 7 - Waste Management – – – 385 385 385 385 231 – –
Vote 8 - Energy Sources – 3,614 – – – – – 3,510 4,914 5,184
Vote 9 - Planning and Development – – – – – – – – – –
Vote 10 - Sports & Recreation – – – 80 80 80 80 10,054 1,099 –
Vote 11 - Road Transport – 4,373 – 558 558 558 558 – 4,653 14,585
Vote 12 - Health – – – – – – – – – –
Vote 13 - Housing. – – – – – – – – – –
Vote 14 - Public Safety – – – – – – – – – –
Vote 15 - Finance & Admin 2 1,042,714 – – 712,610 712,610 712,610 712,610 – – –
Capital multi-year expenditure sub-total 7 1,042,714 11,043 350 723,411 723,411 723,411 723,411 44,000 39,220 36,313
Single-year expenditure to be appropriated 2
Vote 1 - Finance & Admin – – – – – – – – – –
Vote 2 - Executive & Council – – – 261 261 261 261 – – –
Vote 3 - Community and Social Services – – 4 480 480 480 480 – – –
Vote 4 - Internal Audit – – – – – – – – – –
Vote 5 - Water Management – 3,057 346 – – – – 11,951 11,202 12,000
Vote 6 - Waste Water Management – – – 9,036 9,036 9,036 9,036 18,254 17,352 4,544
Vote 7 - Waste Management – – – 385 385 385 385 231 – –
Vote 8 - Energy Sources – 3,614 – – – – – 3,510 4,914 5,184
Vote 9 - Planning and Development – – – – – – – – – –
Vote 10 - Sports & Recreation – – – 80 80 80 80 10,054 1,099 1,307
Vote 11 - Road Transport – 4,373 – 558 558 558 558 – 4,653 15,673
Vote 12 - Health – – – – – – – – – –
Vote 13 - Housing. – – – – – – – – – –
Vote 14 - Public Safety – – – – – – – – – 3,302
Vote 15 - Finance & Admin 2 – – – – – – – – – –
Capital single-year expenditure sub-total – 11,043 350 10,801 10,801 10,801 10,801 44,000 39,220 42,010
Total Capital Expenditure - Vote 1,042,714 22,086 699 734,211 734,211 734,211 734,211 88,000 78,441 78,323
Capital Expenditure - Functional
Governance and administration 64,000 2,655 2,588 1,221 1,221 1,221 1,221 – – –
Executive and council 64,000 2,655 2,588 1,151 1,151 1,151 1,151 – – –
Finance and administration 70 70 70 70 – – –
Internal audit – – – –
Community and public safety – – 495 4,224 4,224 4,224 4,224 10,054 5,752 5,697
Community and social services 405 3,098 3,098 3,098 3,098 – – 3,302
Sport and recreation 0 1,036 1,036 1,036 1,036 10,054 1,099 1,307
Public safety 90 90 90 90 90 – 4,653 1,088
Housing – – – –
Health – – – – – – – – – –
Economic and environmental services – 13,841 9,091 5,132 5,132 5,132 5,132 – – 14,585
Planning and development 1,000 1,000 1,000 1,000 – – –
Road transport 13,841 9,091 4,132 4,132 4,132 4,132 – – 14,585
Environmental protection – – – –
Trading services – – 22,384 24,602 24,602 24,602 24,602 33,946 33,468 21,728
Energy sources 6,750 1,000 1,000 1,000 1,000 3,510 4,914 5,184
Water management 13,634 14,232 14,232 14,232 14,232 11,951 11,202 12,000
Waste water management – 6,770 6,770 6,770 6,770 18,254 17,352 4,544
Waste management 2,000 2,600 2,600 2,600 2,600 231 – –
Other – – – –
Total Capital Expenditure - Functional 3 64,000 16,496 34,558 35,179 35,179 35,179 35,179 44,000 39,220 42,010
Funded by:
National Government 64,000 13,925 30,913 34,019 34,019 34,019 34,019 44,000 39,220 42,010
Provincial Government – – –
District Municipality – – – – – – – – – –
Other transfers and grants – – – – – – – – – –
Transfers recognised - capital 4 64,000 13,925 30,913 34,019 34,019 34,019 34,019 44,000 39,220 42,010
Borrowing 6 – – – – – – – – – –
Internally generated funds 3,645 1,160 1,160 1,160 1,160 – – –
Total Capital Funding 7 64,000 13,925 34,558 35,179 35,179 35,179 35,179 44,000 39,220 42,010
2019/20 Medium Term Revenue & Expenditure
FrameworkCurrent Year 2018/19

MLM: FS181 FINAL BUDGET AND MTREF 2019-2020
24
Explanatory notes to Table A5 - Budgeted Capital Expenditure by vote, standard classification and
funding source
1. Table A5 is a breakdown of the capital programme in relation to capital expenditure by municipal vote
(multi-year and single-year appropriations); capital expenditure by standard classification; and the
funding sources necessary to fund the capital budget, including information on capital transfers from
national and provincial departments.
2. The MFMA provides that a municipality may approve multi-year or single-year capital budget
appropriations. All capital projects falls under the single year capital
3. Unlike multi-year capital appropriations, single-year appropriations relate to expenditure that will be
incurred in the specific budget year such as the procurement of vehicles and specialized tools and
equipment. The budget appropriations for the two outer years are indicative allocations based on the
departmental business plans as informed by the IDP and will be reviewed on an annual basis to assess
the relevance of the expenditure in relation to the strategic objectives and service delivery imperatives
of the municipality. For the purpose of funding assessment of the MTREF, these appropriations have
been included but no commitments will be incurred against single-year appropriations for the two outer-
years.
4. The capital programmes are funded from national capital grants and internally generated funds.
Table 13: MBRR A6 consolidated Budgeted Financial Position

MLM: FS181 FINAL BUDGET AND MTREF 2019-2020
25
Explanatory notes to Table A6 - Budgeted Financial Position
1. Table A6 is consistent with international standards of good financial management practice, and
improves understand ability for councillors and management of the impact of the budget on the
statement of financial position (balance sheet);
2. This format of presenting the statement of financial position is aligned to GRAP1, which is generally
aligned to the international version which presents Assets less Liabilities as “accounting” Community
Wealth. The order of items within each group illustrates items in order of liquidity; i.e. assets readily
converted to cash, or liabilities immediately required to be met from cash, appear first.
3. This is supported by an extensive table of notes (SA3) providing a detailed analysis of the major
components of a number of items, including:
1. Call investments deposits;
2. Consumer debtors;
3. Property, plant and equipment;
4. Trade and other payables;
FS181 Masilonyana - Table A6 Budgeted Financial Position
Description Ref 2015/16 2016/17 2017/18
R thousandAudited
Outcome
Audited
Outcome
Audited
Outcome
Original
Budget
Adjusted
Budget
Full Year
Forecast
Pre-audit
outcome
Budget Year
2019/20
Budget Year
+1 2020/21
Budget Year
+2 2021/22
ASSETS
Current assets
Cash 952 6,029 (40,742) 1,012 1,095 –
Call investment deposits 1 49 – 2,549 985 985 985 985 – – –
Consumer debtors 1 26,248 19,546 200,750 317,085 317,085 317,085 317,085 780,118 734,825 438,817
Other debtors 54 39 78,106 – – – – – –
Current portion of long-term receivables 18,711 25,647 – – – – – –
Inventory 2 421 537 219 – – – 697,177 – –
Total current assets 46,435 51,798 240,882 318,070 318,070 318,070 318,070 1,478,307 735,920 438,817
Non current assets
Long-term receivables – – – – – – – – – –
Investments – – – – – – – – – –
Investment property (4,026) – – – – – – – – –
Investment in Associate – – – – – – – – – –
Property, plant and equipment 3 801,276 697,177 712,610 712,610 712,610 712,610 712,610 9,090 22,709 7,239
Biological – – – – – – – – – –
Intangible – – – – – – – – – –
Other non-current assets – – – – – – – – – –
Total non current assets 797,250 697,177 712,610 712,610 712,610 712,610 712,610 9,090 22,709 7,239
TOTAL ASSETS 843,685 748,975 953,491 1,030,680 1,030,680 1,030,680 1,030,680 1,487,398 758,629 446,056
LIABILITIES
Current liabilities
Bank overdraft 1 – – – – – – – – – –
Borrowing 4 1,001 770 – 1,000 1,000 1,000 1,000 – – –
Consumer deposits (0) (147) (162) – – – – – – –
Trade and other payables 4 141,583 179,966 235,645 141,672 141,672 141,672 141,672 139,927 84,125 82,253
Provisions – – – – – – – – – –
Total current liabilities 142,584 180,589 235,482 142,672 142,672 142,672 142,672 139,927 84,125 82,253
Non current liabilities
Borrowing 1,968 1,300 1,689 1,015 1,015 1,015 1,015 – – –
Provisions 43,323 39,944 31,810 – – – – – – –
Total non current liabilities 45,291 41,244 33,499 1,015 1,015 1,015 1,015 – – –
TOTAL LIABILITIES 187,875 221,833 268,981 143,688 143,688 143,688 143,688 139,927 84,125 82,253
NET ASSETS 5 655,810 527,142 684,510 886,992 886,992 886,992 886,992 1,347,471 674,504 363,803
COMMUNITY WEALTH/EQUITY
Accumulated Surplus/(Deficit) 655,810 527,142 684,510 886,992 886,992 886,992 886,992 1,347,471 674,504 363,803
Reserves 4 12,161 – – – – – – (1,471,522) (1,343,301) (301,206)
TOTAL COMMUNITY WEALTH/EQUITY 5 667,971 527,142 684,510 886,992 886,992 886,992 886,992 (124,051) (668,797) 62,596
2019/20 Medium Term Revenue & Expenditure
FrameworkCurrent Year 2018/19

MLM: FS181 FINAL BUDGET AND MTREF 2019-2020
26
5. Provisions non-current;
6. Changes in net assets; and
7. Reserves
4. The municipal equivalent of equity is Community Wealth/Equity. The justification is that ownership
and the net assets of the municipality belong to the community.
5. Any movement on the Budgeted Financial Performance or the Capital Budget will inevitably impact
on the Budgeted Financial Position. As an example, the collection rate assumption will impact on the
cash position of the municipality and subsequently inform the level of cash and cash equivalents at
year end. Similarly, the collection rate assumption should inform the budget appropriation for debt
impairment which in turn would impact on the provision for bad debt. These budget and planning
assumptions form a critical link in determining the applicability and relevance of the budget as well
as the determination of ratios and financial indicators. In addition the funding compliance assessment
is informed directly by forecasting the statement of financial position.
Table 14: MBRR A7 Consolidated Budgeted Cash Flow
FS181 Masilonyana - Table A7 Budgeted Cash Flows
Description Ref 2015/16 2016/17 2017/18
R thousandAudited
Outcome
Audited
Outcome
Audited
Outcome
Original
Budget
Adjusted
Budget
Full Year
Forecast
Pre-audit
outcome
Budget Year
2019/20
Budget Year
+1 2020/21
Budget Year
+2 2021/22
CASH FLOW FROM OPERATING ACTIVITIES
Receipts
Property rates 42,213 28,893 28,893 28,893 28,893 24,003 25,299 26,665
Service charges 54,845 44,432 107,569 73,523 73,523 73,523 73,523 60,859 64,145 67,609
Other revenue 874 787 4,325 757 757 757 757 521 549 578
Government - operating 1 99,712 116,091 89,833 110,412 110,412 110,412 110,412 121,876 130,403 141,262
Government - capital 1 30,913 24,019 24,019 24,019 24,019 44,000 39,220 42,010
Interest 384 63 4,757 3,850 3,850 3,850 3,850 3,037 3,200 3,373
Dividends 5 2 6 8 8 8 8 8 8 9
Payments
Suppliers and employees (163,244) (139,845) (176,362) (192,092) (192,092) (192,092) (192,092) (216,535) (226,229) (231,992)
Finance charges (3,207) (7,096) (1,335) (1,406) (1,406) (1,406) (1,406) (1,479) (1,558) (1,643)
Transfers and Grants 1 – – – – – – – – –
NET CASH FROM/(USED) OPERATING ACTIVITIES (10,631) 14,434 101,919 47,963 47,963 47,963 47,963 36,289 35,038 47,872
CASH FLOWS FROM INVESTING ACTIVITIES
Receipts
Proceeds on disposal of PPE 52,609 1,240 – – – – – – –
Decrease (Increase) in non-current debtors – – – – – – –
Decrease (increase) other non-current receivables – – – – – – – –
Decrease (increase) in non-current investments – – – – – – – –
Payments
Capital assets (58,447) (8,871) (34,808) (34,019) (34,019) (34,019) (34,019) (44,000) (39,220) (42,010)
NET CASH FROM/(USED) INVESTING ACTIVITIES (5,838) (8,871) (33,568) (34,019) (34,019) (34,019) (34,019) (44,000) (39,220) (42,010)
CASH FLOWS FROM FINANCING ACTIVITIES
Receipts
Short term loans – – – – – – – – – –
Borrowing long term/refinancing – – – – – – – – –
Increase (decrease) in consumer deposits – – – – – – – – – –
Payments
Repayment of borrowing (228) (553) (752) (783) (783) (783) (783) (779) – –
NET CASH FROM/(USED) FINANCING ACTIVITIES (228) (553) (752) (783) (783) (783) (783) (779) – –
NET INCREASE/ (DECREASE) IN CASH HELD (16,697) 5,010 67,599 13,161 13,161 13,161 13,161 (8,490) (4,182) 5,862
Cash/cash equivalents at the year begin: 2 – – – – – – – 650 (7,840) (12,022)
Cash/cash equivalents at the year end: 2 (16,697) 5,010 67,599 13,161 13,161 13,161 13,161 (7,840) (12,022) (6,160)
2019/20 Medium Term Revenue & Expenditure
FrameworkCurrent Year 2018/19

MLM: FS181 FINAL BUDGET AND MTREF 2019-2020
27
Explanatory notes to Table A7 - Budgeted Cash Flow Statement
1. The budgeted cash flow statement is the first measurement in determining if the budget is funded.
2. It shows the expected level of cash in-flow versus cash out-flow that is likely to result from the
implementation of the budget.
3. The 2019/2020 MTREF has been informed by the planning principle of ensuring adequate cash
reserves over the medium-term; and.
4. Cash and cash equivalents totals to a positive R650 thousands as at the end of the 2019/2020
financial year due to the measures that the municipality are going to implement.
Table 15: MBRR A8 Consolidated Cash Backed Accumulated Surplus Reconciliation
Explanatory notes to Table A8 - Cash Backed Reserves/Accumulated Surplus Reconciliation
1. The cash backed reserves/accumulated surplus reconciliation is aligned to the requirements of MFMA
Circular 42 – Funding a Municipal Budget.
2. In essence the table evaluates the funding levels of the budget by firstly forecasting the cash and
investments at year end and secondly reconciling the available funding to the liabilities/commitments
that exist.
3. The outcome of this exercise would either be a surplus or deficit. A deficit would indicate that the
applications exceed the cash and investments available and would be indicative of non-compliance
with the MFMA requirements that the municipality’s budget must be “funded”. In Masilonyana Local
Municipality’s case, there’s positive balance of 253 million for budget year, R264 million for 2020/2021
FS181 Masilonyana - Table A8 Cash backed reserves/accumulated surplus reconciliation
Description Ref 2015/16 2016/17 2017/18
R thousandAudited
Outcome
Audited
Outcome
Audited
Outcome
Original
Budget
Adjusted
Budget
Full Year
Forecast
Pre-audit
outcome
Budget Year
2019/20
Budget Year
+1 2020/21
Budget Year
+2 2021/22
Cash and investments available
Cash/cash equivalents at the year end 1 (16,697) 5,010 67,599 13,161 13,161 13,161 13,161 (7,840) (12,022) (6,160)
Other current investments > 90 days 17,698 1,019 (105,792) (12,176) (12,176) (12,176) (12,176) 8,852 13,117 6,160
Non current assets - Investments 1 – – – – – – – – – –
Cash and investments available: 1,001 6,029 (38,193) 985 985 985 985 1,012 1,095 –
Application of cash and investments
Unspent conditional transfers – – – 7,862 9,586 9,586 9,586 13,632 – –
Unspent borrowing – – – – – – – – –
Statutory requirements 2
Other working capital requirements 3 128,868 173,749 (51,606) (73,691) (73,691) (73,691) (58,541) (265,921) (263,418) (146,039)
Other provisions
Long term investments committed 4 – – – – – – – – – –
Reserves to be backed by cash/investments 5
Total Application of cash and investments: 128,868 173,749 (51,606) (65,829) (64,105) (64,105) (48,955) (252,289) (263,418) (146,039)
Surplus(shortfall) (127,867) (167,720) 13,413 66,814 65,090 65,090 49,940 253,301 264,513 146,039
2019/20 Medium Term Revenue & Expenditure
FrameworkCurrent Year 2018/19

MLM: FS181 FINAL BUDGET AND MTREF 2019-2020
28
and R146 million for 2021/2022 respectively. Therefore this indicates that the municipality’s budget is
funded.
4. Non-compliance with section 18 of the MFMA is assumed because a shortfall would indirectly indicate
that the annual budget is not appropriately funded.
1. Considering the requirements of section 18 of the MFMA, it can be concluded that the adopted
2019/20 MTREF was not funded owing to the significant deficit.
2. As part of the budgeting and planning guidelines that informed the compilation of the 2019/2020
MTREF the end objective of the medium-term framework was to ensure the budget is fully funded
though it is not.
Table 16: MBRR A9 Consolidated Asset Measurement

MLM: FS181 FINAL BUDGET AND MTREF 2019-2020
29
FS181 Masilonyana - Table A9 Asset Management
Description Ref 2015/16 2016/17 2017/18
R thousandAudited
Outcome
Audited
Outcome
Audited
Outcome
Original
Budget
Adjusted
Budget
Full Year
Forecast
Budget Year
2019/20
Budget Year
+1 2020/21
Budget Year
+2 2021/22
CAPITAL EXPENDITURE
Total New Assets 1 714,841 6,670 3,046 717,786 717,786 717,786 42,166 34,017 39,322
Roads Infrastructure – – 2,696 3,822 3,822 3,822 – – 9,837
Storm water Infrastructure – – – – – – 5,599 13,142 5,420
Electrical Infrastructure 29,400 3,614 – 712,610 712,610 712,610 3,510 4,914 5,184
Water Supply Infrastructure 399,899 3,057 346 – – – 11,951 11,202 12,000
Sanitation Infrastructure 168,894 – – – – – 12,655 4,210 480
Solid Waste Infrastructure 30 – – – – – – – –
Rail Infrastructure – – – – – – – – –
Coastal Infrastructure – – – – – – – – –
Information and Communication Infrastructure – – – – – – – – –
Infrastructure 598,222 6,670 3,042 716,432 716,432 716,432 33,715 33,468 32,921
Community Facilities 26,825 – – – – – – – 6,400
Sport and Recreation Facilities 1,208 – – – – – 8,451 549 –
Community Assets 28,032 – – – – – 8,451 549 6,400
Heritage Assets – – – – – – – – –
Revenue Generating – – – – – – – – –
Non-revenue Generating – – – – – – – – –
Investment properties – – – – – – – – –
Operational Buildings – – – – – – – – –
Housing – – – – – – – – –
Other Assets – – – – – – – – –
Biological or Cultivated Assets – – – – – – – – –
Servitudes – – – – – – – – –
Licences and Rights – – – – – – – – –
Intangible Assets – – – – – – – – –
Computer Equipment 3,942 – – 281 281 281 – – –
Furniture and Office Equipment 10,150 – 4 993 993 993 – – –
Machinery and Equipment – – – 80 80 80 – – –
Transport Assets 16,659 – – – – – – – –
Land 57,835 – – – – – – – –
Zoo's, Marine and Non-biological Animals – – – – – – – – –
Total Renewal of Existing Assets 2 – – – – – – 1,603 550 1,307
Roads Infrastructure – – – – – – – – –
Storm water Infrastructure – – – – – – – – –
Electrical Infrastructure – – – – – – – – –
Water Supply Infrastructure – – – – – – – – –
Sanitation Infrastructure – – – – – – – – –
Solid Waste Infrastructure – – – – – – – – –
Rail Infrastructure – – – – – – – – –
Coastal Infrastructure – – – – – – – – –
Information and Communication Infrastructure – – – – – – – – –
Infrastructure – – – – – – – – –
Community Facilities – – – – – – – – –
Sport and Recreation Facilities – – – – – – 1,603 550 1,307
Community Assets – – – – – – 1,603 550 1,307
Heritage Assets – – – – – – – – –
Revenue Generating – – – – – – – – –
Non-revenue Generating – – – – – – – – –
Investment properties – – – – – – – – –
Operational Buildings – – – – – – – – –
Housing – – – – – – – – –
Other Assets – – – – – – – – –
Biological or Cultivated Assets – – – – – – – – –
Servitudes – – – – – – – – –
Licences and Rights – – – – – – – – –
Intangible Assets – – – – – – – – –
Computer Equipment – – – – – – – – –
Furniture and Office Equipment – – – – – – – – –
Machinery and Equipment – – – – – – – – –
Transport Assets – – – – – – – – –
Land – – – – – – – – –
Zoo's, Marine and Non-biological Animals – – – – – – – – –
Current Year 2018/192019/20 Medium Term Revenue & Expenditure
Framework

MLM: FS181 FINAL BUDGET AND MTREF 2019-2020
30
Total Upgrading of Existing Assets 6 – 4,373 – 8,170 8,170 8,170 231 4,653 1,380
Roads Infrastructure – 4,373 – 500 500 500 – – 292
Storm water Infrastructure – – – 3,427 3,427 3,427 – – –
Electrical Infrastructure – – – – – – – – –
Water Supply Infrastructure – – – – – – – – –
Sanitation Infrastructure – – – – – – – – –
Solid Waste Infrastructure – – – – – – 231 – –
Rail Infrastructure – – – – – – – – –
Coastal Infrastructure – – – – – – – – –
Information and Communication Infrastructure – – – – – – – – –
Infrastructure – 4,373 – 3,927 3,927 3,927 231 – 292
Community Facilities – – – 4,243 4,243 4,243 – 4,653 1,088
Sport and Recreation Facilities – – – – – – – – –
Community Assets – – – 4,243 4,243 4,243 – 4,653 1,088
Heritage Assets – – – – – – – – –
Revenue Generating – – – – – – – – –
Non-revenue Generating – – – – – – – – –
Investment properties – – – – – – – – –
Operational Buildings – – – – – – – – –
Housing – – – – – – – – –
Other Assets – – – – – – – – –
Biological or Cultivated Assets – – – – – – – – –
Servitudes – – – – – – – – –
Licences and Rights – – – – – – – – –
Intangible Assets – – – – – – – – –
Computer Equipment – – – – – – – – –
Furniture and Office Equipment – – – – – – – – –
Machinery and Equipment – – – – – – – – –
Transport Assets – – – – – – – – –
Land – – – – – – – – –
Zoo's, Marine and Non-biological Animals – – – – – – – – –
Total Capital Expenditure 4 714,841 11,043 3,046 725,956 725,956 725,956 44,000 39,220 42,009
Roads Infrastructure – 4,373 2,696 4,322 4,322 4,322 – – 10,129
Storm water Infrastructure – – – 3,427 3,427 3,427 5,599 13,142 5,420
Electrical Infrastructure 29,400 3,614 – 712,610 712,610 712,610 3,510 4,914 5,184
Water Supply Infrastructure 399,899 3,057 346 – – – 11,951 11,202 12,000
Sanitation Infrastructure 168,894 – – – – – 12,655 4,210 480
Solid Waste Infrastructure 30 – – – – – 231 – –
Rail Infrastructure – – – – – – – – –
Coastal Infrastructure – – – – – – – – –
Information and Communication Infrastructure – – – – – – – – –
Infrastructure 598,222 11,043 3,042 720,359 720,359 720,359 33,946 33,468 33,213
Community Facilities 26,825 – – 4,243 4,243 4,243 – 4,653 7,489
Sport and Recreation Facilities 1,208 – – – – – 10,054 1,099 1,307
Community Assets 28,032 – – 4,243 4,243 4,243 10,054 5,752 8,795
Heritage Assets – – – – – – – – –
Revenue Generating – – – – – – – – –
Non-revenue Generating – – – – – – – – –
Investment properties – – – – – – – – –
Operational Buildings – – – – – – – – –
Housing – – – – – – – – –
Other Assets – – – – – – – – –
Biological or Cultivated Assets – – – – – – – – –
Servitudes – – – – – – – – –
Licences and Rights – – – – – – – – –
Intangible Assets – – – – – – – – –
Computer Equipment 3,942 – – 281 281 281 – – –
Furniture and Office Equipment 10,150 – 4 993 993 993 – – –
Machinery and Equipment – – – 80 80 80 – – –
Transport Assets 16,659 – – – – – – – –
Land 57,835 – – – – – – – –
Zoo's, Marine and Non-biological Animals – – – – – – – – –
TOTAL CAPITAL EXPENDITURE - Asset class 714,841 11,043 3,046 725,956 725,956 725,956 44,000 39,220 42,009

MLM: FS181 FINAL BUDGET AND MTREF 2019-2020
31
ASSET REGISTER SUMMARY - PPE (WDV) 5 827,123 713,073 443,732 414,770 414,770 414,770 697,177 734,825 774,505
Roads Infrastructure 97,132 92,382 102,301 102,301 102,301 202,368 213,296 224,814
Storm water Infrastructure – –
Electrical Infrastructure 25,218 22,068 26,660 26,660 26,660 56,460 59,508 62,722
Water Supply Infrastructure 169,873 167,502 177,818 177,818 177,818 88,643 93,430 98,475
Sanitation Infrastructure 98,908 98,247 103,454 103,454 103,454 112,597 118,677 125,086
Solid Waste Infrastructure 288,311 597,053 (1,661) 25 25 25 4,205 4,432 4,671
Rail Infrastructure 4,787 5,046 5,318
Coastal Infrastructure
Information and Communication Infrastructure
Infrastructure 679,442 597,053 378,538 410,258 410,258 410,258 469,059 494,389 521,086
Community Assets 105,374 87,358 (7,312) – – – – – –
Heritage Assets 15 15 – – – – – –
Investment properties 25,832 15,869 – – – – – – –
Other Assets – – – – – – 127,994 134,905 142,190
Biological or Cultivated Assets – – – – – – – – –
Intangible Assets
Computer Equipment 2,096 1,440 3,879 4,085 4,085 4,085 1,440 1,518 1,600
Furniture and Office Equipment 3,019 2,188 405 427 427 427 2,188 2,306 2,431
Machinery and Equipment 585 706 706 744 784
Transport Assets 10,759 8,443 68,221 8,433 8,888 9,368
Land 87,358 92,075 97,047
Zoo's, Marine and Non-biological Animals
TOTAL ASSET REGISTER SUMMARY - PPE (WDV) 5 827,123 713,073 443,732 414,770 414,770 414,770 697,177 734,825 774,505
EXPENDITURE OTHER ITEMS 68,051 88,978 37,594 41,562 41,562 41,562 66,020 69,585 73,343
Depreciation 7 56,167 76,017 26,535 27,890 27,890 27,890 51,624 54,412 57,350
Repairs and Maintenance by Asset Class 3 11,884 12,961 11,059 13,672 13,672 13,672 14,396 15,174 15,993
Roads Infrastructure – 3,332 2,130 828 828 828 872 919 969
Storm water Infrastructure – – 1,415 875 875 875 922 971 1,024
Electrical Infrastructure – 1,783 – 3,343 3,343 3,343 3,520 3,710 3,911
Water Supply Infrastructure – 2,191 2,331 2,977 2,977 2,977 3,134 3,304 3,482
Sanitation Infrastructure – 2,088 2,222 – – – – – –
Solid Waste Infrastructure 11,884 – – 1,000 1,000 1,000 1,053 1,110 1,170
Rail Infrastructure – – – – – – – – –
Coastal Infrastructure – – – – – – – – –
Information and Communication Infrastructure – – – – – – – – –
Infrastructure 11,884 9,394 8,098 9,023 9,023 9,023 9,501 10,014 10,555
Community Facilities – 1,000 – 69 69 69 73 77 81
Sport and Recreation Facilities – – – – – – – – –
Community Assets – 1,000 – 69 69 69 73 77 81
Heritage Assets – – – – – – – – –
Revenue Generating – – – – – – – – –
Non-revenue Generating – – – – – – – – –
Investment properties – – – – – – – – –
Operational Buildings – – 1,064 1,095 1,095 1,095 1,153 1,215 1,281
Housing – – – – – – – – –
Other Assets – – 1,064 1,095 1,095 1,095 1,153 1,215 1,281
Biological or Cultivated Assets – – – – – – – – –
Servitudes – – – – – – – – –
Licences and Rights – – – – – – – – –
Intangible Assets – – – – – – – – –
Computer Equipment – – – – – – – – –
Furniture and Office Equipment – 2,567 – 26 26 26 28 29 31
Machinery and Equipment – – – 21 21 21 22 23 25
Transport Assets – – – 1,932 1,932 1,932 2,035 2,145 2,261
Land – – 1,897 1,505 1,505 1,505 1,585 1,670 1,761
Zoo's, Marine and Non-biological Animals – – – – – – – – –
TOTAL EXPENDITURE OTHER ITEMS 68,051 88,978 37,594 41,562 41,562 41,562 66,020 69,585 73,343
Renewal and upgrading of Existing Assets as % of total capex 0.0% 39.6% 0.0% 1.1% 1.1% 1.1% 4.2% 13.3% 6.4%
Renewal and upgrading of Existing Assets as % of deprecn 0.0% 5.8% 0.0% 29.3% 29.3% 29.3% 3.6% 9.6% 4.7%
R&M as a % of PPE 1.5% 1.9% 1.6% 1.9% 1.9% 1.9% 158.4% 66.8% 220.9%
Renewal and upgrading and R&M as a % of PPE 1.0% 2.0% 2.0% 5.0% 5.0% 5.0% 2.0% 3.0% 2.0%

MLM: FS181 FINAL BUDGET AND MTREF 2019-2020
32
Explanatory notes to Table A9 - Asset Management
1. Table A9 provides an overview of municipal capital allocations to building new assets and the
renewal of existing assets, as well as spending on repairs and maintenance by asset class.
2. National Treasury has previously recommended that municipalities should allocate at least 40 per
cent of their capital budget to the renewal of existing assets, and allocations to repairs and
maintenance should be 8 per cent of PPE. However with Masilonyana LM it’s difficult to budget
within those estimates because the infrastructure is aged and needs to be renewed and with R&M
there are no funds to budget within the norms.
Table 17: MBRR consolidated Basic Service Delivery Measurement

MLM: FS181 FINAL BUDGET AND MTREF 2019-2020
33
FS181 Masilonyana - Table A10 Basic service delivery measurement
2015/16 2016/17 2017/18
Outcome Outcome OutcomeOriginal
Budget
Adjusted
Budget
Full Year
Forecast
Budget Year
2019/20
Budget Year
+1 2020/21
Budget Year
+2 2021/22
Household service targets 1
Water:
Piped water inside dwelling 11,297 11,297 11,297 11,297 11,297 11,297 11,297 11,297 11,297
Piped water inside yard (but not in dwelling) 18,829 18,829 18,829 18,829 18,829 18,829 18,829 18,829 18,829
Using public tap (at least min.service level) 2 – – – – – – – – –
Other water supply (at least min.service level) 4 7,532 7,532 7,532 7,532 7,532 7,532 7,532 7,532 7,532
Minimum Service Level and Above sub-total 37,658 37,658 37,658 37,658 37,658 37,658 37,658 37,658 37,658
Using public tap (< min.service level) 3 19 19 19 19 19 19 19 19 19
Other water supply (< min.service level) 4 – – – – – – – – –
No water supply – – – – – – – – –
Below Minimum Service Level sub-total 19 19 19 19 19 19 19 19 19
Total number of households 5 37,677 37,677 37,677 37,677 37,677 37,677 37,677 37,677 37,677
Sanitation/sewerage:
Flush toilet (connected to sewerage) 14,762 14,762 14,762 14,762 14,762 14,762 14,762 14,762 14,762
Flush toilet (with septic tank) 572 572 572 572 572 572 572 572 572
Chemical toilet – – – – – – – – –
Pit toilet (ventilated) – – – – – – – – –
Other toilet provisions (> min.service level) 1,529 1,529 1,529 1,529 1,529 1,529 1,529 1,529 1,529
Minimum Service Level and Above sub-total 16,863 16,863 16,863 16,863 16,863 16,863 16,863 16,863 16,863
Bucket toilet – – – – – – – – –
Other toilet provisions (< min.service level) 1,529 1,529 1,529 1,529 1,529 1,529 1,529 1,529 1,529
No toilet provisions – – – – – – – – –
Below Minimum Service Level sub-total 1,529 1,529 1,529 1,529 1,529 1,529 1,529 1,529 1,529
Total number of households 5 18,392 18,392 18,392 18,392 18,392 18,392 18,392 18,392 18,392
Energy:
Electricity (at least min.service level) 2,918 2,918 2,918 2,918 2,918 2,918 2,918 2,918 2,918
Electricity - prepaid (min.service level) 11,695 11,695 11,695 11,695 11,695 11,695 11,695 11,695 11,695
Minimum Service Level and Above sub-total 14,613 14,613 14,613 14,613 14,613 14,613 14,613 14,613 14,613
Electricity (< min.service level) – – – – – – – – –
Electricity - prepaid (< min. service level) – – – – – – – – –
Other energy sources – – – – – – – – –
Below Minimum Service Level sub-total – – – – – – – – –
Total number of households 5 14,613 14,613 14,613 14,613 14,613 14,613 14,613 14,613 14,613
Refuse:
Removed at least once a week 18,554 18,554 18,554 18,554 18,554 18,554 18,554 18,554 18,554
Minimum Service Level and Above sub-total 18,554 18,554 18,554 18,554 18,554 18,554 18,554 18,554 18,554
Removed less frequently than once a week – – – – – – – – –
Using communal refuse dump – – – – – – – – –
Using own refuse dump – – – – – – – – –
Other rubbish disposal – – – – – – – – –
No rubbish disposal – – – – – – – – –
Below Minimum Service Level sub-total – – – – – – – – –
Total number of households 5 18,554 18,554 18,554 18,554 18,554 18,554 18,554 18,554 18,554
Households receiving Free Basic Service 7
Water (6 kilolitres per household per month) 1,426 1,426 1,426 2,500 2,500 2,500 4,000 4,200 4,500
Sanitation (free minimum level service) 1,426 1,426 1,426 2,500 2,500 2,500 4,000 4,200 4,500
Electricity/other energy (50kwh per household per month) 1,426 1,426 1,426 2,500 2,500 2,500 4,000 4,200 4,500
Refuse (removed at least once a week) 1,426 1,426 1,426 2,500 2,500 2,500 4,000 4,200 4,500
Cost of Free Basic Services provided - Formal Settlements (R'000) 8
Water (6 kilolitres per indigent household per month) 3,582 3,582 3,582 3,764 3,764 3,764 3,959 4,173 4,398
Sanitation (free sanitation service to indigent households) 2,423 2,423 2,423 2,873 2,873 2,873 3,023 3,186 3,358
Electricity/other energy (50kwh per indigent household per month) 1,349 1,349 1,349 2,449 2,449 2,449 2,576 2,715 2,862
Refuse (removed once a week for indigent households) 1,343 1,343 1,343 2,408 2,408 2,408 2,534 2,670 2,815
Cost of Free Basic Services provided - Informal Formal Settlements (R'000) – – – – – – – – –
Total cost of FBS provided 8,696 8,696 8,696 11,494 11,494 11,494 12,091 12,744 13,432
Highest level of free service provided per household
Property rates (R value threshold)
Water (kilolitres per household per month)
Sanitation (kilolitres per household per month)
Sanitation (Rand per household per month)
Electricity (kwh per household per month)
Refuse (average litres per week)
Revenue cost of subsidised services provided (R'000) 9
Property rates (tariff adjustment) ( impermissable values per section 17 of MPRA)
Property rates exemptions, reductions and rebates and impermissable values in excess of
section 17 of MPRA) 3,581 3,817 4,062 4,277 4,277 4,277 4,500 4,743 4,999
Water (in excess of 6 kilolitres per indigent household per month) – – – – – – – – –
Sanitation (in excess of free sanitation service to indigent households) – – – – – – – – –
Electricity/other energy (in excess of 50 kwh per indigent household per month) – – – – – – – – –
Refuse (in excess of one removal a week for indigent households) – – – – – – – – –
Municipal Housing - rental rebates
Housing - top structure subsidies 6
Other
Total revenue cost of subsidised services provided 3,581 3,817 4,062 4,277 4,277 4,277 4,500 4,743 4,999
Current Year 2018/192019/20 Medium Term Revenue & Expenditure
FrameworkDescription Ref

MLM: FS181 FINAL BUDGET AND MTREF 2019-2020
34
Explanatory notes to Table A10 - Basic Service Delivery Measurement
1. Table A10 provides an overview of service delivery levels, including backlogs (below minimum
service level), for each of the main services;
2. The budget provides for 4000 households to be registered as indigent in 2019/2020, and therefore
entitled to receiving Free Basic Services. The number is set to increase/decrease given the indigent
roadshow that ended end of April.
3. It is anticipated that these Free Basic Services will cost the municipality over R 12 million in
2019/2020. This is covered by the municipality’s equitable share allocation from national
government; and
4. In terms of the needs to be seen within the context of the municipality’s overall revenue
management strategy – the more the municipality gives away, the less there is available to fund
other services.

MLM: FS181 FINAL BUDGET AND MTREF 2019-2020
35
PART 2 – SUPPORTING DOCUMENTATION
Section 53 of the Municipal Finance Management Act 2003 (No. 56 of 2003) requires the Executive Mayor
of the municipality to provide general political guidance in the budget process and the setting of priorities
that must guide the preparation of the budget. In addition, Chapter 2 of the Municipal Budget and Reporting
Regulations states that the Executive Mayor of the municipality must establish a Budget Steering
Committee to provide technical assistance to the Mayor in discharging the responsibilities set out in section
53 of the Municipal Finance Management Act; 2003(No. 56 of 2003)
2.1 IDP and Service Delivery and Budget Implementation Plan
The Municipality’s Integrated Development Plan (IDP) is its principal strategic planning instrument
which directly guides and informs its planning, budget, management and development actions. This
framework is rolled out into objectives, key performance indicators and targets for implementation
which directly inform the Service Delivery and Budget Implementation Plan. The Process Plan
applicable to the fourth revision cycle included the following key IDP processes and deliverables:
1. Registration of community needs;
2. Compilation of departmental business plans including key performance indicators and
targets;
3. Financial planning and budgeting process;
4. Public participation process;
5. Compilation of the SDBIP, and
6. The review of the performance management and monitoring processes.
The IDP has been taken into a business and financial planning process leading up to the 2018/2019
MTREF, Mid-year Review and adjustments budget. The business planning process has
subsequently been refined in the light of current economic circumstances and the resulting revenue
projections.
During the compilation of the 2018/2019 MTREF, each department/function had to review the
business planning process, including the setting of priorities and targets after reviewing the mid-
year.
2.1.1 Community Consultation
The 2019/2020 MTREF is planned to be tabled by 31 May 2019 for consideration and adopted by
the 01/07/2019, however the tabling was only done on the 21 May 2019 due to non-sitting of Council.
The BPP was tabled before council in August 2018 where the budget activities of the 2019/2020
were presented. Council must take note although this has been tabled, some activities were late as
a result of non-tabling of the budget 90 days before the new financial year as required by MFMA.
For instance that budget public participation was rescheduled due to late tabling of the 2019/2020
Draft MTREF.

MLM: FS181 FINAL BUDGET AND MTREF 2019-2020
36
All documents in the appropriate format (electronic and printed) will be provided to National
Treasury, and other national and provincial departments in accordance with section 23 of the
Municipal Finance Management Act, as evidence that the budget processes and public participation
indeed took place.
2.2 Financial Modelling and Key Planning Drivers
As part of the compilation of the 2019/2020 MTREF, extensive financial modelling was undertaken
to ensure affordability in the long-term and financial sustainability. The following key factors and
planning strategies have informed the compilation of the 2018/2019 MTREF:
1. The municipality growth;
2. Policy priorities and strategic objectives;
3. Asset maintenance;
4. Economic climate and trends (i.e. inflation, Eskom increases, household debt, migration patterns);
5. Performance trends;
6. The approved 2017/2018 budget and performance against the SDBIP;
7. Cash Flow Management;
8. Debtor payment levels;
9. Investment possibilities;
10. The need for tariff increases versus the ability of the community to pay for services; and as a result
Property Rates and Electricity anticipations were above the estimated CPI (PR at 8% and electricity
at 13.07%, which was influenced by the tariff increase application )
11. Improved and sustainable service delivery
In addition to the above, the strategic guidance given in National Treasury’s Municipal Finance
Management Act Circulars 51, 54, 68, 70 and 72 has been taken into consideration in the planning and
prioritisation process.
2.3 Overview of alignment of annual budget with IDP
The Constitution mandates local government with the responsibility to exercise local developmental
and cooperative governance. The eradication of imbalances in South African society can only be
realized through a credible integrated developmental planning process.
Municipalities in South Africa need to utilize integrated development planning as a method to plan
future development in their areas and so find the best solutions to achieve sound long-term
development goals. A municipal IDP provides a five year strategic programme of action aimed at
setting short, medium and long term strategic and budget priorities to create a development
platform, which correlates with the term of
Office of the political incumbents. The plan aligns the resources and the capacity of a municipality
to its overall development aims and guides the municipal budget.

MLM: FS181 FINAL BUDGET AND MTREF 2019-2020
37
An IDP is therefore a key instrument which municipalities use to provide vision, leadership and
direction to all those that have a role to play in the development of a municipal area. The IDP enables
municipalities to make the best use of scarce resources and speed up service delivery. Integrated
developmental planning in the South African context is amongst others, an approach to planning
aimed at involving the municipality and the community to jointly find the best solutions towards
sustainable development.
Furthermore, integrated development planning provides a strategic environment for managing and
guiding all planning, development and decision making in the municipality.
It is important that the IDP developed by the municipality correlates with National and Provincial
intent. It must aim to co-ordinate the work of local and other spheres of government in a coherent
plan to improve the quality of life for all the people living in that area. Applied to the municipality,
issues of national and provincial importance should be reflected in the IDP of the municipality. A
clear understanding of such intent is therefore imperative to ensure that the municipality’s
strategically complies with the key national and provincial priorities. The aim of this revision cycle
was to develop and coordinate a coherent plan to improve the quality of life for all the people living
in the area, also reflecting issues of national and provincial importance.
One of the key objectives is therefore to ensure that there exists alignment between national and
provincial priorities, policies and strategies and the Municipalities response to these requirements.
The national and provincial priorities, policies and strategies of importance include amongst others:
1. Green Paper on National Strategic Planning of 2009;
2. Government Programme of Action;
3. Development Facilitation Act of 1995;
4. Provincial Growth and Development Strategy (GGDS);
5. National and Provincial spatial development perspectives;
6. Relevant sector plans such as transportation, legislation and policy;
7. National Key Performance Indicators (NKPIs);
8. Accelerated and Shared Growth Initiative (ASGISA);
9. National 2014 Vision;
10. National Spatial Development Perspective (NSDP) and
11. The National Priority Outcomes.
The Constitution requires local government to relate its management, budgeting and planning
functions to its objectives. This gives a clear indication of the intended purposes of municipal
integrated development planning. Legislation stipulates clearly that a municipality must not only give
effect to its IDP, but must also conduct its affairs in a manner which is consistent with its IDP.
The following highlights the IDP‟s five strategic objectives for the 2019/2020 MTREF and further
planning refinements that have directly informed the compilation of the budget;
Build better communities and good governance - Strive to build a united, non-racial, non-
sexiest, competitive and prosperous community.

MLM: FS181 FINAL BUDGET AND MTREF 2019-2020
38
Enhance financial sustainability -Strategies to ensure financial stability by raising revenue
strategies, asset management, and financial management, enhance cost effectiveness and capital
investment programmes.
Accelerate an inclusive growing economy - Encouraging the creation of job opportunities,
SMME's development, provide for proper service to all the resident, and land use management for
all the community of Masilonyana and promote agricultural and tourism development.
Plan for the future
Masilonyana must create an environment conducive for economic growth through investments in
socio economic infrastructure to trigger local economic growth and forge partnership with
stakeholders to invest in the local economy.
Develop a learning organization
Masilonyana Municipality needs to acquire highly competent workforce to successfully implement
its newly developed strategic intent. And has already took its workforce for vast training from
Technical Services, for plant operations courses ABET, Municipal Finance Management
Programme etc.
Establish effective and efficient services - Provide quality and sustainable electrical services,
maintain road networks and storm water drainage system for all the community of Masilonyana
effective on-going water and sanitation services, waste -management services in an effective
manner, and parks and cemetery development in order to protect human health and well-being
environment as aligned to government and national key objectives
Enhance effective, accountable and clean institutional management and corporate, governance.
Accelerated provision of effective, efficient and quality services and encourage cooperative
governance and the involvement of all other stakeholders to provide a better life for all.
In order to ensure integrated and focused service delivery between all spheres of government, it
was important for the Masilonyana Local Municipality to align its budget priorities with that of national
and provincial government. All spheres of government place a high priority on infrastructure
development, economic development and job creation, efficient service delivery, poverty alleviation
and building sound institutional arrangements.
Local priorities were identified as part of the IDP review process which is directly aligned to that of
the national and provincial priorities. The key performance areas can be summarised as follows
against the five strategic objectives:
a) Provision of quality basic services and infrastructure which includes, amongst others:
1. Provide electricity;
2. Provide water;
3. Provide sanitation;
4. Provide waste removal;

MLM: FS181 FINAL BUDGET AND MTREF 2019-2020
39
5. Provide roads and storm water; and
6. Maintaining the infrastructure of the municipality.
b) Economic growth and development that leads to sustainable job creation by:
1. Ensuring there is a clear structural plan, LED strategy for the Municipality;
2. Ensuring planning processes function in accordance with set timeframes; and
3. Facilitating the use of labour intensive approaches in the delivery of services and the
building of infrastructure.
c) Fight poverty and build clean, healthy, safe and sustainable communities through:
1. Effective implementation of the Indigent Policy;
2. Working with the provincial department of health to provide primary health care services;
3. Extending waste removal services and ensuring effective municipal cleansing;
4. Ensuring all waste water treatment works are operating optimally;
5. Working with strategic partners such as SAPS to address crime;6
6. Ensuring save working environments by effective enforcement of building and health
regulations;7
7. Promote viable, sustainable communities through proper zoning; and
8. Promote environmental sustainability by protecting wetlands and key open spaces
The 2019/2020 MTREF has therefore been directly informed by the IDP revision process and the following
tables provide a reconciliation between the IDP strategic objectives and operating revenue, operating
expenditure and capital expenditure.
Table 18: Reconciliation of IDP strategic objectives and budget (Revenue)

MLM: FS181 FINAL BUDGET AND MTREF 2019-2020
40
FS181 Masilonyana - Supporting Table SA4 Reconciliation of IDP strategic objectives and budget (revenue)
Strategic Objective GoalGoal
Code2015/16 2016/17 2017/18
R thousand
Audited
Outcome
Audited
Outcome
Audited
Outcome
Original
Budget
Adjusted
Budget
Full Year
Forecast
Budget Year
2019/20
Budget Year
+1 2020/21
Budget Year
+2 2021/22
To ensure that 100% of
households in all formal
settlement(s) around Masilonyana
have access to clean (basic level)
of water by July 2017
100% of access to basic level of
water for formal settlements
households, water infrastructure
required to enable achievement of
the strategic objective as measured
in terms of performance targets,
The percentage of households
earning R 3 000 per month with
access to free basic service
32,606 31,901 53,483 72,547 72,547 72,547 42,255 44,537 46,942
To ensure that 100% of
households in formal settlements in
Masilonyana area have access to
basic level of sanitation by 2017
100% of households in formal
settlements have access to basic
level of sanitation. Sanitation
infrastructure.
19,484 22,770 38,666 35,078 35,078 35,078 24,479 25,801 27,194
To ensure that identified internal
roads in Masilonyana area are
maintained and / or upgraded to
facilitate economic and social
activity required for the sustainable
development of the municipality;
thus implementing the current
Infrastructure Master Plan
Repairing of tarred roads, Paving
and re-gravelling of roads in
accordance with the targets and
projects indicated in the MTAS.
48,479 48,540 24,041 4,132 4,132 4,132
To create employment
opportunities in Masilonyana
Municipal Area; based on projects
and programmes outlined in the
IDP and Back to Basics document.
To encourage the apporpriate and
effective use of land and
resources.
(Number of) Employment
opportunities created through
targeted IDP projects. No of
employment created through
EPWP. Implement SDF & LUS in
accordance and compliance with
SPLUMA.
2,415 1,000 1,000 1,000
To ensure good waste
management in Masilonyana
Municipality
Total of 5 landfill sites are licensed,
and 4 landfill sites to be upgraded.
100% of households with access
to refuse removal and service is at
acceptable national standards.
100% of households in informal
areas have access to refuse
removal at acceptable national
standards.
11,993 20,145 25,483 20,331 20,331 20,331 15,828 16,682 17,583
To ensure effective management of
graveyards and cemeteries in
Masilonyana Municipal area &
other community facilities
Adequate provision for, safe and
well maintained graveyards and
cemeteries. The fencing of all
cemeteries in Masilonyana
Municipal area. Adequate
provision for new cemeteries
2,765 5,183 17,866 17,866 17,866
To ensure access to well
maintained, quality sporting and
parks & recreational facilities in
Masilonyana Municipal area
Adequate provision for, safe and
well maintained sport and
recreational facilities, as measured
in terms of the targets set for the
programmes and projects in the
MTAS and IDP
5,305 1,685 2,443 2,443 2,443
1,642
Provide appropriate HR support to
directorates, to ensure healthy &
safe working environment for
councillors & employes,ensure
effective system of municipal
governance in line with applicable
legislation,promote fair labour
practices, ensure effective &
effecient fleet manangemnt system,
provide an integrated ICT system
Sustainable and continuous
reports on HR development,
continuous M&evaluation of Health
& Safety committees, effective
muncipal governance, number of
LLF meeting conducted, Effective
fleet manangement,reviewe and
approval of ICT framework and
policies
5,975 3,414 3,414 3,414
Adhere to all budget
regulations,ensure that th
municipality has an effective
revenu collection system consistent
with applicable regulation and
regulations and the debt & credit
Policies
reviewed,monitored,evaluated and
approved by
Council,developed,updated and
approved indigent register,an
updated asset register compliant
137,655 41,548 81,232 36,370 36,370 36,370 177,004 188,507 202,502
5,921
Pimprove community participation
in the affairs of the Muncipality
Number of public participation
conducted on IDP
4,866 22,911 53,624 53,624 53,624
Maintain a legitimate database of
human settlement and erven
waiting list
Creation of world standard towns
and cities by reducing informal
settlements
1,166
Ensure that 100% of households
in MLM area have access to
electricity in 2018
100% of households in formal
areas with access to electricity by
2018
39,133 41,025 30,579 62,785 62,785 62,785 39,156 58,563 43,499
Allocations to other priorities 2
Total Revenue (excluding capital transfers and contributions) 1 289,350 235,982 283,262 309,590 309,590 309,590 298,722 334,090 337,720
Current Year 2018/192019/20 Medium Term Revenue & Expenditure
FrameworkRef

MLM: FS181 FINAL BUDGET AND MTREF 2019-2020
41
Table 19: Reconciliation of IDP strategic objectives and budget (Operating Expenditure)

MLM: FS181 FINAL BUDGET AND MTREF 2019-2020
42
FS181 Masilonyana - Supporting Table SA5 Reconciliation of IDP strategic objectives and budget (operating expenditure)
Strategic Objective GoalGoal
Code2015/16 2016/17 2017/18
R thousand
Audited
Outcome
Audited
Outcome
Audited
Outcome
Original
Budget
Adjusted
Budget
Full Year
Forecast
Budget Year
2019/20
Budget Year
+1 2020/21
Budget Year
+2 2021/22
To ensure that 100% of
households in all formal
settlement(s) around Masilonyana
have access to clean (basic level)
of water by July 2017
100% of access to basic level of
water for formal settlements
households, water infrastructure
required to enable achievement of
the strategic objective as measured
5,360 36,409 27,034 30,085 30,085 30,085 74,427 78,450 73,754
To ensure that 100% of
households in formal settlements in
Masilonyana area have access to
basic level of sanitation by 2017
100% of households in formal
settlements have access to basic
level of sanitation. Sanitation
infrastructure.
14,514 20,094 6,643 6,643 6,643 14,006 14,742 15,537
To ensure that identified internal
roads in Masilonyana area are
maintained and / or upgraded to
facilitate economic and social
activity required for the sustainable
Repairing of tarred roads, Paving
and re-gravelling of roads in
accordance with the targets and
projects indicated in the MTAS.
26,311 34,967 19,099 19,099 19,099 9,861 10,545 4,703
To create employment
opportunities in Masilonyana
Municipal Area; based on projects
and programmes outlined in the
IDP and Back to Basics document.
(Number of) Employment
opportunities created through
targeted IDP projects. No of
employment created through
EPWP. Implement SDF & LUS in
48,230 8,621 18,164 31,678 31,678 31,678
To ensure good waste
management in Masilonyana
Municipality
Total of 5 landfill sites are licensed,
and 4 landfill sites to be upgraded.
100% of households with access
to refuse removal and service is at
acceptable national standards.
14,514 10,394 16,993 16,993 16,993 15,106 5,498 16,471
To ensure effective management of
graveyards and cemeteries in
Masilonyana Municipal area &
other community facilities
Adequate provision for, safe and
well maintained graveyards and
cemeteries. The fencing of all
cemeteries in Masilonyana
Municipal area. Adequate
7,119 24,379 28,147 28,147 28,147
To ensure access to well
maintained, quality sporting and
parks & recreational facilities in
Masilonyana Municipal area
Adequate provision for, safe and
well maintained sport and
recreational facilities, as measured
in terms of the targets set for the
programmes and projects in the
2,124 2,901 3,085 3,085 3,085 2,132 2,247 2,368
2,834
Provide appropriate HR support to
directorates, to ensure healthy &
safe working environment for
councillors & employes,ensure
effective system of municipal
Sustainable and continuous
reports on HR development,
continuous M&evaluation of Health
& Safety committees, effective
muncipal governance, number of
15,529
Adhere to all budget
regulations,ensure that th
municipality has an effective
revenu collection system consistent
with applicable regulation and
Policies
reviewed,monitored,evaluated and
approved by
Council,developed,updated and
approved indigent register,an
176,035 52,245 40,114 49,168 49,168 49,168 170,949 174,239 192,424
To ensure that 100% of
households in formal settlements in
Masilonyana area have access to
basic level of sanitation by 2017
100% of households in formal
settlements have access to basic
level of sanitation. Sanitation
infrastructure.
9,648 9,490 26,749 26,749 26,749
Pimprove community participation
in the affairs of the Muncipality
Number of public participation
conducted on IDP
4,786 17,467
Maintain a legitimate database of
human settlement and erven
waiting list
Creation of world standard towns
and cities by reducing informal
settlements
2,915 1,667 3,184 3,184 3,184
Ensure that 100% of households
in MLM area have access to
electricity in 2018
100% of households in formal
areas with access to electricity by
2018
60,958 50,955 32,186 57,930 57,930 57,930 72,717 85,922 80,001
Allocations to other priorities
Total Expenditure 1 295,369 261,205 221,390 272,761 272,761 272,761 359,198 371,643 385,260
Current Year 2018/192019/20 Medium Term Revenue & Expenditure
FrameworkRef

MLM: FS181 FINAL BUDGET AND MTREF 2019-2020
43
Table 20: Reconciliation of IDP strategic objectives and budget (Capital Expenditure)
FS181 Masilonyana - Supporting Table SA6 Reconciliation of IDP strategic objectives and budget (capital expenditure)
Strategic Objective GoalGoal
Code2015/16 2016/17 2017/18
R thousand
Audited
Outcome
Audited
Outcome
Audited
Outcome
Original
Budget
Adjusted
Budget
Full Year
Forecast
Budget Year
2019/20
Budget Year
+1 2020/21
Budget Year
+2 2021/22
Provide appropriate HR support to
directorates, to ensure healthy &
safe working environment for
councillors & employes,ensure
effective system of municipal
Sustainable and continuous
reports on HR development,
continuous M&evaluation of Health
& Safety committees, effective
muncipal governance, number of
A 5,234 394 400 70 70 70
Public Safety Public Safety B 90 90 90 90
To ensure that identified internal
roads in Masilonyana area are
maintained and / or upgraded to
facilitate economic and social
activity required for the sustainable
Repairing of tarred roads, Paving
and re-gravelling of roads in
accordance with the targets and
projects indicated in the MTAS.
C 390 9,091 4,132 4,132 4,132
To ensure good waste
management in Masilonyana
Municipality
Total of 5 landfill sites are licensed,
and 4 landfill sites to be upgraded.
100% of households with access
to refuse removal and service is at
acceptable national standards.
D 2,000 2,600 2,600 2,600 231
To ensure effective management of
graveyards and cemeteries in
Masilonyana Municipal area
Adequate provision for, safe and
well maintained graveyards and
cemeteries. The fencing of all
cemeteries in Masilonyana
Municipal area. Adequate
E 31,404 15,870 405 3,098 3,098 3,098
To ensure access to well
maintained, quality sporting and
parks & recreational facilities in
Masilonyana Municipal area
Adequate provision for, safe and
well maintained sport and
recreational facilities, as measured
in terms of the targets set for the
programmes and projects in the
F 1,309 1,036 1,036 1,036 10,054 5,752 5,697
To ensure that 100% of
households in Masilonyana
Municipal area have access to
electricity by 2018
100% of households in formal
areas with access to electricity by
2018
G 1,342 1,726 6,750 1,000 1,000 1,000 3,510 4,914 5,184
Good Governance and Public
Participation
PMU H 5,062 2,300 2,188 1,151 1,151 1,151
To ensure that 100% of
households in all formal
settlement(s) around Masilonyana
have access to clean (basic level)
of water by July 2017
100% of access to basic level of
water for formal settlements
households, water infrastructure
required to enable achievement of
the strategic objective as measured
I 1,847 13,634 14,232 14,232 14,232 11,951 11,202 12,000
LED and Planning SPLUMA implementation and LED
capacity
J 2,700 1,125 1,000 1,000 1,000
To ensure that 100% of
households in formal settlements in
Masilonyana area have access to
basic level of sanitation by 2017
100% of households in formal
settlements have access to basic
level of sanitation. Sanitation
infrastructure.
K 6,770 6,770 6,770 18,254 17,352 4,544
L
M
N
O
P
Allocations to other priorities 3
Total Capital Expenditure 1 47,979 22,724 34,558 35,179 35,179 35,179 44,000 39,220 27,426
Current Year 2018/192019/20 Medium Term Revenue & Expenditure
FrameworkRef

MLM: FS181 FINAL BUDGET AND MTREF 2019-2020
44
2.4 Measurable performance objectives and indicators
Performance Management is a system intended to manage and monitor service delivery progress
against the identified strategic objectives and priorities. In accordance with legislative requirements
and good business practices as informed by the National Framework for Managing Programme
Performance Information, the municipality has developed and implemented a performance
management system of which system is constantly refined as the integrated planning process
unfolds.
The Municipality targets, monitors, assess and reviews organizational performance which in turn is
directly linked to individual employee’s performance.
At any given time within government, information from multiple years is being considered; plans and
budgets for next year; implementation for the current year; and reporting on last year's performance.
Although performance information is reported publicly during the last stage, the performance
information process begins when policies are being developed, and continues through each of the
planning, budgeting, implementation and reporting stages. The planning, budgeting and reporting
cycle can be graphically illustrated as follows:
The performance
of the municipality relates directly to the extent to which it has achieved success in realising its goals
and objectives, complied with legislative requirements and meeting stakeholder expectations. The
municipality therefore has adopted one integrated performance management system which
encompasses:

MLM: FS181 FINAL BUDGET AND MTREF 2019-2020
45
1. Planning (setting goals, objectives, targets and benchmarks);
2. Monitoring (regular monitoring and checking on the progress against plan);
3. Measurement (indicators of success);
4. Review (identifying areas requiring change and improvement);
5. Reporting (what information, to whom, from whom, how often and for what purpose); and
6. Improvement (making changes where necessary).
The performance information concepts used by the municipality in its integrated performance
management system are aligned to the Framework of Managing Programme Performance
Information issued by the National Treasury which is depicted below:
2.5 Budget related policies
Masilonyana Local Municipality’s budgeting process is guided and governed by relevant legislation,
frameworks, strategies and related policies. The following policies have been reviewed and tabled
to Council with the budget:
- Municipal Property rates policy
- Budget policy
- Tariff policy
- Indigent policy
MLM: FS181 FINAL BUDGET AND MTREF 2019-2020
46
- Fixed Asset management policy
- Cash management & investment policy
- Credit control & Debt Collection policy
- Supply Chain Management policy
- Unauthorized, Irregular Fruitless and Wasteful policy
- Bad debt write-off policy
- Policy governing payments of creditors, councilors and officials
- Subsistence and Travel policy
- Disclosure Related parties’ policies
- Events after reporting date policy and procedure manual
- Virements Policy
The 2019/20 MTREF has been prepared on the basis of achieving an average debtors’ collection
rate 50 percent on current billings, considering that the collection rate is currently estimated at 25%
on average. In addition, the collection of debt in excess of 90 days has been prioritised as a
pertinent strategy in increasing the municipality’s cash levels. Finally, debt owed by Councillors and
municipal staff has been prioritised for speedy recovery and where there’s such debt, deductions
are made against councillors and officials of the municipality. The credit control and debt collection
policy has prioritised this area to show an example of the debt collection initiatives by the
Municipality.
2.6 Overview of the budget assumptions
2.6.1 General inflation outlook and its impact on the municipal activities
There are five key factors that have been taken into consideration in the compilation of the
2019/2020 MTREF, namely:
1. National Government macro-economic targets;
2. The general inflationary outlook and the impact on the residents and businesses;
3. The impact of municipal cost drivers;
4. The increase in prices for bulk electricity and water; and
5. The increase in the cost of remuneration. Employee related costs comprise 27% of the
total operating expenditure in the 2019/2020.
2.6.2 Interest Rates on borrowing and Investment of Funds
The MFMA stipulates that borrowing can only utilized to fund capital or refinancing of
borrowing in certain condition. Masilonyana municipality will still be servicing the long term
borrowing with the DBSA 12.5%.
2.6.3 Collection rate for revenue services
The base assumption is that tariff and rates will increase at a rate slightly higher that CPI
over the long term. It is also assumed that current economic conditions, and relatively
controlled inflationary conditions, will continue for the forecasted term. The rate of revenue
MLM: FS181 FINAL BUDGET AND MTREF 2019-2020
47
collection is currently expressed as a percentage +-25 percent of annual billings. Cash flow
is assumed to be 50 percent of billings, excluding an increased collection of arrear debt from
the revised collection and credit control policy. The performance of arrear collections will
however only be considered a source of additional cash in-flow once the performance has
been carefully monitored. The municipality is aiming at increasing it collection rate by 60
percent each financial of additional cash in-flow once the performance has been carefully
monitored.
2.6.4 Growth or decline in tax base of the municipality
Debtor’s revenue is assumed to increase at a rate that is influenced by the consumer
debtor’s collection rate, tariff/rate pricing, and real growth of the municipality, household
formation growth rate and the poor household change rate.
2.7 Legislation compliance status
Compliance with the MFMA implementation requirements have been substantially adhered to through the
following activities:
2.7.1. In year reporting
Reporting to National Treasury in electronic format will fully be complied with on a monthly basis. Section
71 reporting to the Executive Mayor (within 10 working days) is fully complied with.
2.7.2 Internship programme
Currently the Municipality have 8 interns who resumed duties in July and September 2018, and they are
on a 2 year contract.
2.7.3. Audit Committee
There’s currently no audit committee in place, however the Municipality has outsourced the service to the
District Municipality Audit Committee.
2.7.4. Service Delivery and Implementation Plan
A detailed SDBIP document is in place and it is directly aligned and informed by the 2018/2019 MTREF
budget and Integrated Development Plan. The 2019/20 SDBIP will also be drafted and aligned to the
2019/2020 MTREF. This document will be approved by the Mayor 28 days after the budget is approval by
council.

MLM: FS181 FINAL BUDGET AND MTREF 2019-2020
48
2.8 QUALITY CERTIFICATE
QUALITY CERTIFICATE
I, Pule Tsekedi, the Municipal Manager of Masilonyana Local Municipality, hereby certify that:
2019/2020 MTREF Budget has been prepared in accordance with Section 21 & 53 of the Municipal Finance Management Act 56 of 2003 and the relevant regulations. Name : Pule Tsekedi Signature : ____________ Date : ____________
RECOMMENDATIONS:
1. That council takes note and adopts the following:
- the 2019/2020 MTREF Budget,
- 2019/2020 reviewed budget and non-budget related policies
- Final tariff book for 2019/2020