mixing in thermally stratified energy stores · cline poses a moving temperature boundary condition...
TRANSCRIPT

Mixing in thermally stratified energy stores
Citation for published version (APA):Berkel, van, J. (1996). Mixing in thermally stratified energy stores. Solar Energy, 58(4-6), 203-211.https://doi.org/10.1016/S0038-092X(96)00081-3
DOI:10.1016/S0038-092X(96)00081-3
Document status and date:Published: 01/01/1996
Document Version:Publisher’s PDF, also known as Version of Record (includes final page, issue and volume numbers)
Please check the document version of this publication:
• A submitted manuscript is the version of the article upon submission and before peer-review. There can beimportant differences between the submitted version and the official published version of record. Peopleinterested in the research are advised to contact the author for the final version of the publication, or visit theDOI to the publisher's website.• The final author version and the galley proof are versions of the publication after peer review.• The final published version features the final layout of the paper including the volume, issue and pagenumbers.Link to publication
General rightsCopyright and moral rights for the publications made accessible in the public portal are retained by the authors and/or other copyright ownersand it is a condition of accessing publications that users recognise and abide by the legal requirements associated with these rights.
• Users may download and print one copy of any publication from the public portal for the purpose of private study or research. • You may not further distribute the material or use it for any profit-making activity or commercial gain • You may freely distribute the URL identifying the publication in the public portal.
If the publication is distributed under the terms of Article 25fa of the Dutch Copyright Act, indicated by the “Taverne” license above, pleasefollow below link for the End User Agreement:www.tue.nl/taverne
Take down policyIf you believe that this document breaches copyright please contact us at:[email protected] details and we will investigate your claim.
Download date: 15. May. 2020

Pergamon Solar Energy Vol. 58, No. 4-6, pp. 203-211,1996
PII: SOO38-092X(96)00081-3 Copyright 0 1996 Elsevier Science Ltd
Printed in Great Britain. All rights reserved 0038-092X/96 515.00+0.00
MIXING IN THERMALLY STRATIFIED ENERGY STORES
J. VAN BERKEL Eindhoven University of Technology, Faculty of Mechanical Engineering, WOC/WET,
P.O. Box 513,560O MB Eindhoven, The Netherlands
(Communicated by Eric Hahne)
Abstract-Two important aspects of short-term thermally stratified energy storage, thermocline mixing and thermocline thickness, are studied analytically, experimentally and numerically. The storage detrimen- tal aspects are investigated for a simplified configuration, i.e. an adiabatic box containing a quasi-stationary thermocline. Numerical finite difference/volume simulations agree well with experiments. The dissipation- free 1D analytical model shows a large discrepancy. It appears that mixing inside thermally stratified stores is a two-stage process. First fluid is withdrawn from the thermocline by viscous drag. Subse- auent mixing takes place bv stretching and folding of fluid particles, thereby enabling diffusion to become active. Copitight 0 1996 Elsevier S&nce Ltd. -
1. INTRODUCTION
Hot and cold water can be stored simulta- neously inside a single containment due to their difference in density. Thermally stratified stor- age saves space and material. As the stable stratification inhibits mixing and entropy pro- duction, the system performance increases in comparison with a non-stratified storage. The application ranges from small O( 10m2) m3 close-in boilers for residential usage, to large 0( 104) m3 cogeneration and/or district heat storage.
Notwithstanding the present-day application of thermally stratified energy storage, little is known about the mixing phenomena that occur in such a storage. This applies especially to situations in which stratification is hard to achieve: short cycle times, low temperatures and small temperature differences. In these cases stratification is weak and easily distorted by high inflow inertia forces. Due to insufficient theoretical insight, design guidelines for short- term thermally stratified stores are still mostly empirically based.
The current research concerns a two-layer store in its simplest form, a rectangular-shaped tank, charged and discharged directly by means of top and bottom linear slot inlet and outlet diffusers. The general evolution of such a store from fully charged to fully discharged (or vice versa) is treated in van Berkel(1994). However, in actual practice a store is rarely operated in a full charge-full discharge cycle. In order to avoid strongly varying discharge temperatures, the storage mode is reversed before the thermo- cline reaches an outlet port. In this control
strategy, two important phenomena affect the storage performance negatively (short-term stor- age heat loss is not considered).
The first one is ineffective usage of storage volume. As a result of the finite height of the thermocline (the steep temperature gradient zone separating the bulk water bodies) and the inlet and outlet ports (which cannot be swept by the thermocline), the storage volume cannot be fully exploited (see Fig. l(a)). The total ineffective storage volume may amount to up to 25% (Hoogendoorn et al., 1985).
The other loss is due to entrainment of the thermocline. Preliminary laboratory tests showed that the global flow pattern resembles a jet-like inflow colliding with the thermocline (see Fig. l(b) and Hussain and Wildin (1991)). At the point of collision with the thermocline, less buoyant fluid is removed (entrained into the inlet side bulk fluid), thereby preserving the gradient zone. Entrainment causes the thermo- cline to proceed faster through the storage than on the basis of the storage throughput. The associated mixing means that the fluid cannot be withdrawn from a store at the same temper- ature as it was injected.
The aim of the current research is to develop models within which the thermocline thickness and entrainment rate can accurately be pre- dicted. In the future these models will serve as design tools to study the effect of storage geome- try (aspect ratio, inlet/outlet area) on storage performance, finaliy leading to an optimized storage configuration.
In the past, much research has been done on turbulent entrainment in oceans, lakes and large solar ponds (Turner, 1973; Christodoulou,
203

204 J. van Berkel
Fig. 1. (a) Effective storage volume schematic. (b) Large-scale flow pattern.
1986). It is shown that for very small density differences the effect of stratification is negligible and, as in the non-stratified case, entrainment is caused by the “engulfment mechanism”. On the interface, large eddies develop which engulf fluid and advect into the bulk fluid. When stratification becomes stronger, turbulent motions are suppressed and the interface may exhibit only wave-like perturbations, occasion- ally forming cusps which may be detached by eddies present in the turbulent bulk layer. At very strong stratification, advection from the fluid interface is blocked entirely. For practical conditions, diffusion of heat does not affect the rate at which entrainment takes place (Turner, 1973).
Despite this increased insight, the current theory is not directly applicable to the entrain- ment process in stores, as in this case the entrainment source is localized.
For easy observation and analysis of entrain- ment, the two-layer thermally stratified storage has been abstracted to a conceptual, numerical and material model, in which the thermocline advances due to entrainment only (see Fig. 2).
The model consists of an adiabatic box enclosing two fluid layers of different temper- ature. Water is injected through a slot in the bottom plate and is withdrawn through the permeable bottom plate exactly at the same rate.
As a research spin-off this investigation is directly applicable to related topics: jet mixing
Thermal insulation
Fig. 2. Short-term thermally stratified storage abstraction.
in chemical reactors and jet ventilation in oil tanks, lakes or rooms.
2. SIMPLE APPROXIMATE MODEL
A rough estimate of the entrainment rate can be derived by application of the potential energy concept to the stratified box contents (Cardoso and Woods, 1993). If an interfacial slice of fluid is mixed with the lower layer, its mass density deficit (AdhAp) must be replenished from the lower layer. Hence the potential energy of the box contents increases by:
dE,,, = AdhApg ; (1)
where Epot is the potential energy (J), A is the plan area (m’), h is the inlet layer height (m), Ap is the density difference between the two layers (kg/m3) and g is acceleration due to gravity (m/s2).
Neglecting the kinetic energy of the outflow and viscous dissipation of mechanical energy, the change rate of potential energy must equal the single supply of mechanical energy: the jet kinetic energy, i.e.
dE dt -p,o, = Au,Apg 2 =Pkin = $ pAin&
(2) where Pkin is the kinetic energy flux of the jet (W), Ai, is inlet area (m2) and nin is inlet velocity (m/s). Equation (2) yields the entrainment rate E =u&,,, where U, is the entrainment velocity dhjdt:
ue AinP k ui?, Ain P& -= =--
%n A&g ; A Am+
= $I Ritl
(3)
where Ri,, is the overall Richardson number,

Thermally stratified energy stores 205
the ratio of potential energy (buoyant work) to specific kinetic energy:
Rio= F, PUin
Equation (3) fits the general expression E =aRi;” to which many data are fitted (Christodoulou, 1986). Though it seems that Ri, is the main governing parameter, the Reynolds number also has some effect (Shy, 1995).
In a storage tank, the thermocline velocity uth is a superposition of the entrainment veloc- ity u, and the fluid displacement velocity (uinAi,/A):
Ain Uth = U, + Uin - f
A
When u, << u,h, combination of equations (3) and (5) yields:
4 - =Rii’. _. (6) %h
This equation can be used to determine roughly the range in which an efficient store must be operated. If it is demanded that the entrainment velocity of the thermocline must be less than 5% of the fluid displacement velocity, the Richardson range is limited by Ri> 20. Of course, equation (6) provides a maximum entrainment rate. In actual practice the entrain- ment rate will be less due to viscous dissipation of the jet kinetic energy.
The thermocline thickness can be estimated by considering that the upward-moving thermo- cline poses a moving temperature boundary condition to the stagnant upper layer (Fig. 8).
On the interface the advection of thermal energy equals the diffusion rate:
Au,pC AT= IA F th
(7)
where ATis temperature difference between the two layers (K), /z is coefficient of heat conduction (W/m K), C is specific heat capacity (J/kg K) and 8th is thermocline thickness (m).
Equation (7) simply results in:
at,,= ’ 4
where a is the coefficient of thermal diffusivity (m2/s). Equation (8) is equivalent to stating that Pea =&&h/a = 1. It implies that the thermocline
thickness is inversely proportional to the entrainment velocity. Though being approxi- mate, the previous analysis can be used to find an optimum between loss of useful energy due to entrainment and loss of space due to the thermocline thickness.
3. EXPERIMENTS
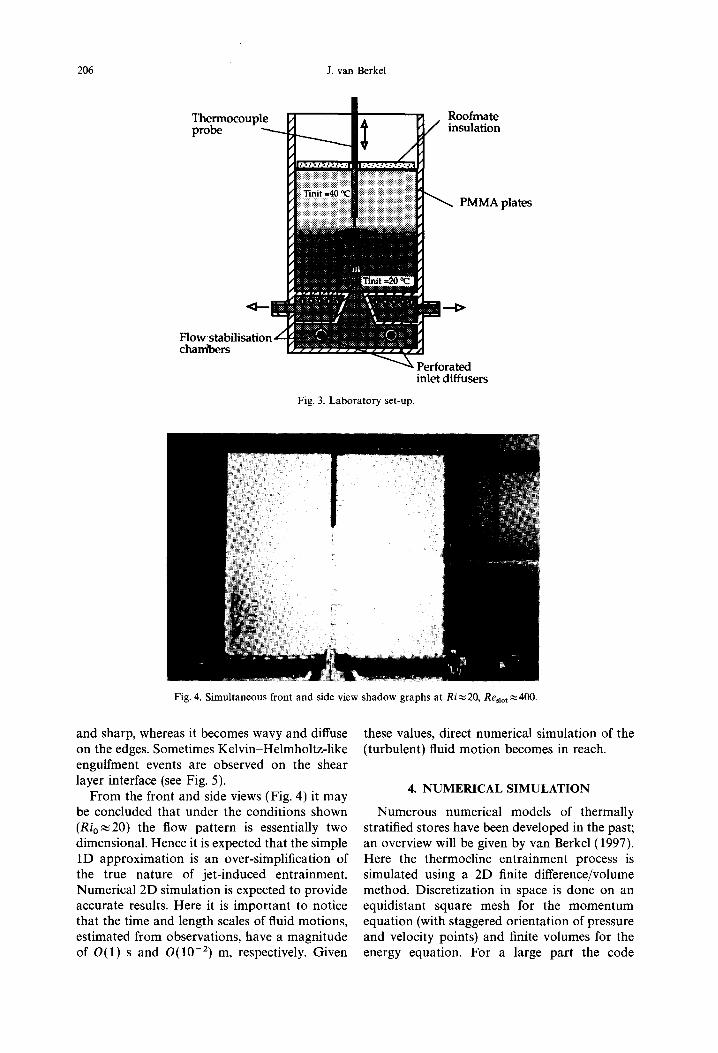
Figure 3 shows the experimental set-up. The domain of interest is sized 44.5 x 44.5 x 24 cm (width x height x depth). The centrally placed, well-rounded slot has a width of 1.5 cm. Withdrawal takes place through 8 x 12 uni- formly distributed, l-mm diameter holes on either side of the slot. Flow stabilization cham- bers ensure uniform withdrawal and injection. Water is circulated through the tank and a flow measurement device by a variable speed centrif- ugal pump. Two-layer stratification is attained by means of an immersed electrical heater which heats up the top layer nearly uniformly to a temperature of 40°C. During testing an insula- tion plate floating on top of the free surface prevents excessive heat loss. The lower layer has a temperature equal to the ambient temperature of about 20°C.
Flow visualization is done by fluid colouring and the shadow graph technique. Temperatures are measured using Qr 0.5 mm type K thermo- couples, having a response time of less than 0.1 s. The centre-line temperature is recorded using a vertical linearly traversing probe comprising a ceramic tube with a co-axial, protruding ther- mocouple. The tube is suspended by a cord and a manually operated winch, of which the electri- cally recorded angular position provides the position of the probe.
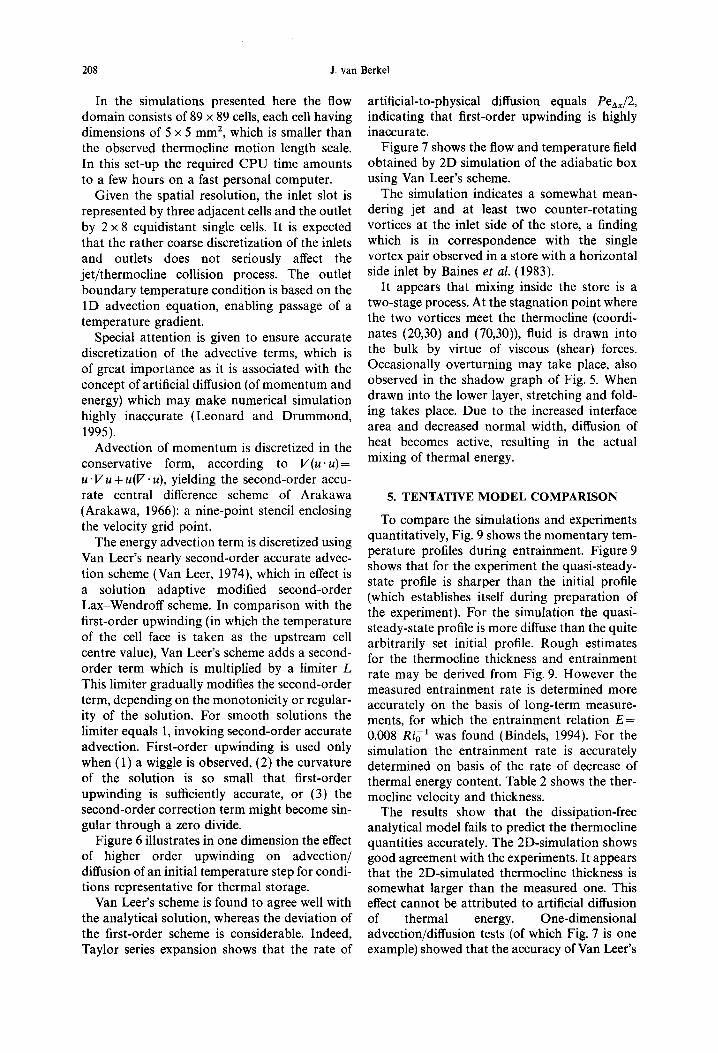
After preparation of the two-layer stratifica- tion, the circulation pump is switched on and the entrainment process starts. After about 10 min (depending on the set-up) the process has stabilized. Figure 4 shows a simultaneous front and side view shadow graph. The light source is positioned right behind the box. The side view is obtained by using two mirrors to direct light from the source, sidewards through the box, to the camera in front of the box.
The shadow graph resembles a symmetric, mushroom-shaped submerged fountain, collid- ing on the thermocline, as sketched in Fig. 2. In the collision region, the thermocline is smooth
206 J. van Berkel
Flow-stabilisatio
Roofinate insulation
\ PMMA plates
y Perforated inlet diffusers
Fig. 3. Laboratory set-up.
Fig. 4. Simultaneous front and side view shadow graphs at Ri z 20, Reslot x 400
and sharp, whereas it becomes wavy and diffuse these values, direct numerical simulation of the on the edges. Sometimes Kelvin-Helmholtz-like (turbulent) fluid motion becomes in reach. engulfment events are observed on the shear layer interface (see Fig. 5).
4. NUMERICAL SIMULATION From the front and side views (Fig. 4) it may
be concluded that under the conditions shown (Rio ~20) the flow pattern is essentially two dimensional. Hence it is expected that the simple 1D approximation is an over-simplification of the true nature of jet-induced entrainment. Numerical 2D simulation is expected to provide accurate results. Here it is important to notice that the time and length scales of fluid motions, estimated from observations, have a magnitude of O(1) s and 0(10e2) m, respectively. Given
Numerous numerical models of thermally stratified stores have been developed in the past; an overview will be given by van Berkel ( 1997). Here the thermocline entrainment process is simulated using a 2D finite difference/volume method. Discretization in space is done on an equidistant square mesh for the momentum equation (with staggered orientation of pressure and velocity points) and finite volumes for the energy equation. For a large part the code

Thermally stratified energy stores 207
Fig. 5. Engulfment event occasionally occurring for Ri, N 20.
comprises the Marker-and-Cell (MAC) formula- tion developed by Harlow and Welch (1965). The numerical code is an adapted version of the code originally written by Nieuwstadt and modified by Bastiaans et al. (1994). The code has been selected for its simplicity, accuracy, computational efficiency and extension facilities to 3D. The lack of geometrical flexibility, posed by the Cartesian spatial discretization, is not felt as a very serious drawback since the thermocline/jet collision process under consider- ation is assumed to be marginally affected by boundary geometry. The core of the method is the Poisson equation for pressure, obtained by taking the divergence of the Navier-Stokes equation:
aui aii a axi
+” :,+ [ ( > ~ h-2 8Xj 1
+Pg(T,v, - L)di21n-l 1 where rc is the kinematic, reduced pressure (J/kg), u is the velocity field (m/s), x is the space coordinate system, At is the time step (s), n, n- 1 are the time levels, /I is the coefficient of thermal expansion (K-l), T,, the temperature at a vertical velocity point (K) and 6 is the Kronecker delta function. Continuity is accounted for by eliminating the second term
1 ahIn - - of equation (9). 2At ax,
After implementation of the boundary condi- tions the pressure is solved directly using a five- point finite difference approximation on a stag- gered grid (Schumann and Sweet, 1976). The pressure is substituted into the Navier-Stokes equation to provide the non-stationary velocity term, at time level n- 1, with which the velocity at the future time step n is computed using the time-central second-order accurate leap-frog scheme. To suppress time splitting, a time filter is applied to couple odd and even time levels. Sequentially to the combined Navier-Stokes and continuity equations, the non-stationary energy equation is evaluated:
aT a&T) a2(T) -=dx+or- at axjaxj J
(10)
to provide the temperature field of the future time level.
Common assumptions are made for the solu- tion process: Boussinesq fluid properties, no viscous dissipation, no radiative heat transfer.
Boundary conditions are implemented using a shell of virtual cells enclosing the flow domain. Table 1 provides the boundary conditions.
The initial conditions are T=40”C for the upper layer and T = 20°C for the lower layer. A pre-established thermocline (6,,, = 2.5 cm) is set by an error function profile.
Table 1. Boundary conditions
Everywhere Walls Inlet Outlets
an/an=0 u, w=o
u=o, w=win 4” u=o,w=w. _
‘” A,,,
a?yan=o T=O
dT dT - = -W,,t - at a2
208 J. van Berkel
In the simulations presented here the flow domain consists of 89 x 89 cells, each cell having dimensions of 5 x 5 mm’, which is smaller than the observed thermocline motion length scale. In this set-up the required CPU time amounts to a few hours on a fast personal computer.
Given the spatial resolution, the inlet slot is represented by three adjacent cells and the outlet by 2 x 8 equidistant single cells. It is expected that the rather coarse discretization of the inlets and outlets does not seriously affect the jet/thermocline collision process. The outlet boundary temperature condition is based on the 1D advection equation, enabling passage of a temperature gradient.
Special attention is given to ensure accurate discretization of the advective terms, which is of great importance as it is associated with the concept of artificial diffusion (of momentum and energy) which may make numerical simulation highly inaccurate (Leonard and Drummond, 1995).
Advection of momentum is discretized in the conservative form, according to lz(u. u) = u. Vu + u(V . u), yielding the second-order accu- rate central difference scheme of Arakawa (Arakawa, 1966): a nine-point stencil enclosing the velocity grid point.
The energy advection term is discretized using Van Leer’s nearly second-order accurate advec- tion scheme (Van Leer, 1974), which in effect is a solution adaptive modified second-order Lax-Wendroff scheme. In comparison with the first-order upwinding (in which the temperature of the cell face is taken as the upstream cell centre value), Van Leer’s scheme adds a second- order term which is multiplied by a limiter L This limiter gradually modifies the second-order term, depending on the monotonicity or regular- ity of the solution. For smooth solutions the limiter equals 1, invoking second-order accurate advection. First-order upwinding is used only when (1) a wiggle is observed, (2) the curvature of the solution is so small that first-order upwinding is sufficiently accurate, or (3) the second-order correction term might become sin- gular through a zero divide.
Figure 6 illustrates in one dimension the effect of higher order upwinding on advection/ diffusion of an initial temperature step for condi- tions representative for thermal storage.
Van Leer’s scheme is found to agree well with the analytical solution, whereas the deviation of the first-order scheme is considerable. Indeed, Taylor series expansion shows that the rate of
artificial-to-physical diffusion equals Pe,,/2, indicating that first-order upwinding is highly inaccurate.
Figure 7 shows the flow and temperature field obtained by 2D simulation of the adiabatic box using Van Leer’s scheme.
The simulation indicates a somewhat mean- dering jet and at least two counter-rotating vortices at the inlet side of the store, a finding which is in correspondence with the single vortex pair observed in a store with a horizontal side inlet by Baines et al. (1983).
It appears that mixing inside the store is a two-stage process. At the stagnation point where the two vortices meet the thermocline (coordi- nates (20,30) and (70,30)), fluid is drawn into the bulk by virtue of viscous (shear) forces. Occasionally overturning may take place, also observed in the shadow graph of Fig. 5. When drawn into the lower layer, stretching and fold- ing takes place. Due to the increased interface area and decreased normal width, diffusion of heat becomes active, resulting in the actual mixing of thermal energy.
5. TENTATIVE MODEL COMPARISON
To compare the simulations and experiments quantitatively, Fig. 9 shows the momentary tem- perature profiles during entrainment. Figure 9 shows that for the experiment the quasi-steady- state profile is sharper than the initial profile (which establishes itself during preparation of the experiment). For the simulation the quasi- steady-state profile is more diffuse than the quite arbitrarily set initial profile. Rough estimates for the thermocline thickness and entrainment rate may be derived from Fig. 9. However the measured entrainment rate is determined more accurately on the basis of long-term measure- ments, for which the entrainment relation E= 0.008 RioI was found (Bindels, 1994). For the simulation the entrainment rate is accurately determined on basis of the rate of decrease of thermal energy content. Table 2 shows the ther- mocline velocity and thickness.
The results show that the dissipation-free analytical model fails to predict the thermocline quantities accurately. The 2D-simulation shows good agreement with the experiments. It appears that the 2D-simulated thermocline thickness is somewhat larger than the measured one. This effect cannot be attributed to artificial diffusion of thermal energy. One-dimensional advection/diffusion tests (of which Fig. 7 is one example) showed that the accuracy of Van Leer’s

Thermally stratified energy stores 209
1st order upwinding
0 10 20 30 40 50 60 70 80 90 loo Node number (-)
Fig. 6. Advection/diffusion of a temperature step. 100 elements, Ax = 1 cm, u =0.2 mm/s, At = 25 s, Courant number c = u At/Ax = 0.5, 140 time steps (tend = 3500 s). PeA, = 13.3. The analytical solution for the devel-
oping temperature profile is the error function.
60 80
g60 2 160 Z
=
140
=
Z !4O
.- 8 5
.-
’ 5
20 > 20
20 40 60 80 20 40 60 80 Horizontal cell number Horizontal cell number
Fig. 7. Left: isotherms (“C); and right: streamlines (x 10’ m’/s), 3000 s after flow initiation. The isotherm intervals are more densely distributed at lower temperatures, giving more insight in the sub-thermocline temperature field. The streamline contours are uniformly distributed. Top layer temperature 4O”C, lower layer temperature 2o”C, inlet velocity 0.025 m/s, Ri,=22.5, Re,,,,x400 (At=0.005 s, 89’ cells,
Ax=5 x lo-’ m).
Stagnant upper layer
turbulent lower layer
Tese
Fig. 8. Simplified representation of temperature distribution.
advection scheme does not deteriorate for time steps as small as encountered in the 2D simula- tion (van Berkel, 1997). The slightly higher entrainment rate might be caused by a 3D effect. Due to the absence of front and back walls in the simulation, the dissipation rate of mechan- ical energy is less, leaving more jet kinetic energy for conversion into potential energy. This might also explain the more oscillating behaviour of
the simulated thermocline. Figure 10 shows the spectral power density of the temperature sig- nals during thermocline passage.
The spectra indeed show that the time scale z of fluid motion is larger than 1 s. Figure 10 also shows a larger signal/noise ratio for the simulation. Furthermore, it may indeed be noticed that for the simulation slightly more wave power is present at lower wave numbers (< 0.1 Hz). The overall spectrum however shows a good agreement, indicating that the simulation accurately represents the thermocline dynamics. The comparison shows that, after validation, the 2D numerical model may serve as a valuable design tool for future optimization of thermally stratified energy stores.
6. CONCLUSIONS
(1) Application of higher order advection schemes are of vital importance for accurate

210 J. van Berkel
0.15 1 20 30
0.1 (d4i. 50 :
Temperature C) Temperature (deg. C) 1
Fig. 9. Centreline temperature profiles at (bottom to top) 3000, 3600, 4200, 4800, 5400, and 6000 s after flow initiation. Left, simulation; right, experiment. Note that the initial profiles differ with respect to temperature range, thickness and location, yielding different Ri, numbers: 22.5 (simulation) and 18.1
(measurement).
Table 2. Results overview for Rio = 20, on the basis of the measurement and simulation, corrected for R&-deviation
assuming linear dependencies equations (6) and (7)
6,s (cm) u, (pm/s)
Experiment
2-3 9.9
2D 1D analytical simulation approx.
3-4 0.4 10.3 41.0
.: 3 ?, -:i : ‘a
i. :
: :
1.: I ;_.
.:
.:.i
:‘::’
. .
: -iF Y.
: : . i
..1
..:: :. 10-l
f+ww (Hz)
Fig. 10. Spectral power density of the simulated (solid line) and measured (dashed line) temperature signal during ther- mocline passage, using the Welch method (Press et al., 1992).
simulation of short-term thermally stratified energy storage.
(2) Tentative model comparison shows that the 2D numerical model predicts the thermocline-entrainment rate and thickness fairly well. It also shows that the dissipation- free analytical model fails,
(3) The observed time and length scales enable direct numerical simulation.
(4) Entrainment is caused by viscous shear
exerted on the thermocline by vortices. Subsequent mixing takes place by stretching and folding of fluid particles at the inlet side bulk fluid.
Future work will comprise 2D particle-track- ing velocity measurement, investigation of simu- lation program convergence, application of the program to real stores and finally optimization of storage geometry with respect to thermocline entrainment and thermocline thickness.
REFERENCES
Arakawa A. (1966) Computational design for long-term numerical integration of the equations of fluid motion: two-dimensional incompressible flow. Part I. J. Comput. Phys. 1, 119-143.
Baines W. D., Martin W. W. and Smith D. M. (1983) Development of stratification in a rectangular tank by horizontal inflow. .I. Fluids Eng. Trans. ASME 105, 59-64.
Bastiaans R. J. M., Van Steenhoven A. A., Rindt C. C. M. and Nieuwstadt F. T. M. (1994) Direct and large-eddy simulation of transient buoyant plumes: a comparison with an experiment. In Direct and Large-eddy Simulation 1. Selected papers from the jrst ERCOFTAC Workshop on Direct and Large-eddy Simulation, Voke, P. R. and Chollet J. P. (Eds). Kluwer Academic, Dordrecht, pp. 399-410.
Bindels M. J. M. (1994) On entrainment in thermally stra- tified energy storages. MSc. Thesis, Eindhoven Univer- sity of Technology, WOC-WET 94.028, The Netherlands.
Cardoso S. S. S. and Woods A. W. (1993) Mixing by a turbulent plume in a confined stratified region. J. Fluid Mech. 250,277-305.
Christodoulou G. C. (1986) Interfacial mixing in stratified flows. .I. Hydraulic Res. 24 (2), 17-92.
Harlow F. H. and Welch J. E. (1965) Numerical calculation of time-dependent viscous incompressible flow of fluid with free surface. Phys. Fluids 8, 2182-2189.
Hoogendoorn C. J., Bakker R. G., Herweijer E. J. J. and Plokker W. (1985) Thermal stratification in water vessels for energy storage. In INTERSOL 85: Proc. 9th Biennial Congress Int. Solar Energy Sot., Montreal, Canada, pp. 829-833.

Thermally stratified energy stores 211
Hussain M. A. and Wildin M. W. (1991) Studies on mixing on the inletside of the thermochne in diurnal stratified storage. In Therrnastock ‘91, Proc. 5th Int. Conf. Thermal Energy Storage, Snijders A. L. (Ed), 13-16 May, Scheve- ningen, The Netherlands, pp. 8.5-l-8.5-7.
Shy S. S. (1995) Mixing dynamics of jet interaction with a sharp density interface. Exp. Thermal Fluid Sci. 10, 355-369.
Leonard B. P. and Drummond J. E. (1995) Why you should not use “hybrid”, “power law” or related exponential schemes for convective modelling-there are much better alternatives. ht. J. Numer. Meth. Fluids 20, 421442.
Press W. H., Teukolsky S. A., Veherling W. T. and Flannery B. P. (1992) Numerical Recipes in Pascal, The Art of Scientific Computing. Cambridge University Press, Cambridge.
Turner J. S. (1973) Buoyancy Eficts in Fkds, Cambridge University Press, Cambridge.
van Berkel J. (1994) Numerical simulation of short term thermally stratified energy storage. In Calorstock ‘94, Proc. 6th Int. Co& Thermal Energy Storage, Kangas M. T. and Lund P. D. (Eds), 22-25 August, Espoo, Finland. Cosmoprint Oy, Helsinki, pp. 179-186.
van Berkel J. (1997) Thermocline entrainment in thermal energy stores. Ph.D. Thesis, Eindhoven University of Technology (in preparation).
Schumann U. and Sweet R. (1976) A direct method for the Van Leer B. (1974) Towards the ultimate conservative solution of Poisson’s equation with Neumann boundary difference scheme II. Monotonicity and conservation conditions on a staggered grid of arbitrary size. combined in a second order scheme. J. Comput. Phys. J. Comput. Phys. 20, 171-182. 14, 361-370.