mitre...operational. considering the above-mentioned findings, mitre recommended that a thorough...
TRANSCRIPT

r>
June 2017
Grupo Aeroportuario de la Ciudad de México f'
r: r>
Prepared for
Nuevo Aeropuerto Internacional de la Ciudad de México
Runway Visual Range Data Analysis Preliminary Findings
,-"--. 1
Center for Advanced A viation System Development
MITRE
Enclosure 1 (Ref. in Technical Letter F500-Ll 7-070) r=.
r> Í''
Page 2of15
r:
r=
TERPS u.s. /'
sm
METAR MITRE MOR
NAICM RVR SENEAM
AICM ATS AWOS
BL CAT FAA
ft
GACM ICAO
ILS kt
r> /'
r:
Aeropuerto Internacional de la Ciudad de México
Air Traffic Services
Automated Weather Observing System
Background Luminance
Category
(United States) Federal A viation Administration
foot (feet)
Grupo Aeroportuario de la Ciudad de México
International Civil A viation Organization
Instrument Landing System
Knot(s)
Square meter( s)
Meteorological Aerodrome Report (aviation weather report format)
The MITRE Corporation
Meteorological Optical Range
Nuevo Aeropuerto Internacional de la Ciudad de México
Runway Visual Range
Servicios a la Navegación en el Espacio Aéreo Mexicano
Statute mile(s)
(United States) Standard for Terminal Instrument Procedures
United States
m2
Principal Acronyms and Abbreviations
Enclosure 1 Ref. F500-Ll 7-070
28 June 2017
MITRE

Page 3of15
The MITRE Corporation (MITRE) is assisting, through Grupo Aeroportuario de la Ciudad de México (GACM), the aviation authorities ofMexico in the development of a new airport for Mexico City. This airport is referred to in this document as Nuevo Aeropuerto Internacional de la Ciudad de México (NAICM), and is intended to replace the current Aeropuerto Internacional de la Ciudad de México (AICM). The proposed runway layout of NAICM will allow for dual- and triple-independent arrival and departure operations.
In January 2015, MITRE submitted to the Mexican aviation authorities and GACM, the results of its analysis of meteorological conditions at the NAICM site at Texcoco. That analysis was based on more than five years of detailed data obtained from an Automated W eather Observing System (A WOS) located near the site (i.e., just south of El Caracol). In its analysis, MITRE considered the overall weather characteristics (i.e., visibility/ceiling and wind), the variability of the weather patterns by time of day, and weather seasonality by months. See Enclosure 1 to MITRE Technical Letter F500-L15-007, dated 12 January 2015, for the results of the analysis.
The findings contained in the above-mentioned January 2015 document answered many questions about the possible impact ofweather on operations at NAICM, such as runway availability dueto winds, frequency of low-visibility conditions, etc. The A WOS ceiling and visibility data suggested that Instrument Landing System (ILS) Category (CAT) II or CAT III weather conditions were rare. However (and importantly), although AWOS data summarizes weather sufficiently well for most purposes, it <loes not provide the precision and accuracy needed for identifying periods of very low visibility, such as CAT II and CA T III, with a high level of confidence. Therefore, the analysis concluded that the greater capabilities ofRunway Visual Range (RVR) sensing devices was necessary to provide a more accurate assessment ofthe need ofthe airport to operate under low-visibility conditions. Note that an RVR system is what would be used to report visibility information to controllers and pilots at NAICM once it is operational.
Considering the above-mentioned findings, MITRE recommended that a thorough review including more detailed and accurate visibility data be conducted, to assist authorities in determining ifCAT II and CAT III approach procedures are required. Thus, an RVR device was installed near the AWOS site by Servicios a la Navegación en el Espacio Aéreo Mexicano (SENEAM) in late 2015. After a series of malfunctions, MITRE started receiving detailed RVR data on 1 January 2016 more or less continuously. In August 2016, MITRE conducted an initial analysis ofthe RVR data covering a period from January 2016 through March 2016. See MITRE document F500-L16-041, dated 12 August 2016.
Since the initial RVR-related results were based on only three months of data, MITRE recommended that additional data be analyzed, including essential winter months, to obtain more robust results.
Introduction l.
Enclosure 1 Ref. F500-Ll 7-070
28 June 2017
MITRE
- r
r>
, ....

Page 4of15
2 Note that this document follows the common practice of using the term "RVR" to refer to the RVR equipage as well as the measurement values produced by it, depending on the context in which it is used,
1 MITRE was informed that the R VR data from 14 through 31 March 2017 was lost due to equipment memory limitations, and therefore could not be analyzed.
The Intemational Civil A viation Organization (ICAO) Annex 3 - Meteorological Service far International Air Navigation, Chapter 1 defines RVR as "The range over which the pilot of an aircraft on the centre line of a runway can see the runway surface markings or the lights delineating the runway or identifying its centre line." ICAO Document 9328 -Manual of Runway Visual Range Observing and Reporting Practices, states: "The main purpose ofRVR is to provide pilots, air traffic services (ATS) units and other aeronautical users with information on runway visibility conditions during periods of low visibility, whether due to fog, the most frequent cause of low visibility in man y places, or due to other causes such as rain, snow or sandstorms. RVR is required to assess whether conditions are above or below the specified operating mínima for take-off and landing. It is to be noted that for this purpose RVR values supersede the reported visibility and that in the case of precision approaches it is normally not permissible to start an approach ifthe applicable RVR value(s) is below the required mínimum."
ICAO Annex 3 also requires that RVR " ... be assessed on all runways intended for Category II and III instrument approach and landing operations." Note that ICAO also recommends that RVR be assessed on precision approach runways intended for CAT I approaches. See Chapter 4, Section 4.6.3.1 of Annex 3.
Like ICAO, the United States (U.S.) Federal Aviation Administration (FAA) also requires RVR for all CAT II and CAT III operations at U.S. airports. Although RVR is not required for CA T I approaches, the RVR data is controlling when installed and operational. 2 See F AA Order
Background 2.
The objective ofthis document is to provide a summary ofvisibility conditions at the NAICM site based on RVR data from 1January2016 through 13 March 2017.1 In particular, MITRE estimated the frequency of ILS CA T II or CA T III visibility occurrences, as well as the time ofthe day those approaches would likely be required. For example, the visibility data analysis can determine that poor visibility conditions tend to occur more frequently during key operational hours, thus indicating the extent ofthe necessity ofhaving CAT II/III ILS approach capabilities at the airport. Additionally, wind conditions using the A WOS data were examined to determine the wind environment (and its operational implications) during low visibility conditions.
This document is organized as follows. Section 2 provides sorne general background information; Section 3 describes the RVR data provided to MITRE; Section 4 describes the assumed visibility category classifications; Section 5 presents the results of the analysis; and Section 6 summarizes findings and recommendations.
Enclosure 1 Ref. F500-Ll 7-070
28 June 2017
MITRE
r: r:
r: r>
r (
r=,
/
r>
r>
r:

Page 5of15
1. Power supply outage ora breakdown resulted in the RVR sensor (ailing to collect data. In such circumstances, SENEAM specialists consulted the visibility data from the nearby AICM weather sensors. If they believed there were no cases of reduced visibility (i.e., visibility less than 6000 feet [ft]), the missing NAICM RVR data were complemented as clear visibility (i.e., more than 6000 ft). Note that in cases where reduced visibility was observed at AICM while the NAICM RVR was malfunctioning, the RVR data were not complemented by SENEAM. This inevitably results in sorne bias in the reported values, since clear visibility conditions could be over-reported relative to lower visibility.
2. Low-visibility occurred during certain times o( the day. When RVR values were lower than 6000 ft and the Background Luminance (BL) for that datum was equal to or lower than 16.75 candelas/meter (m)2, typically at night, SENEAM specialists edited the RVR values using the actual Meteorological Optical Range (MOR) and the runway light intensity value settings within the RVR system, but applying a new BL value equal to 2 candelas/m2• According to SENEAM, this was necessary because of observed discrepancies in the results generated by the SENEAM-developed BL sensor. The BL sensor matter, however, was resolved in mid-2016, and no edits to visibility data were required starting 1July2016.
Upon receipt ofRVR data, MITRE assesses their completeness and, where appropriate, provides feedback to SENEAM on sensor malfunctions or other issues.
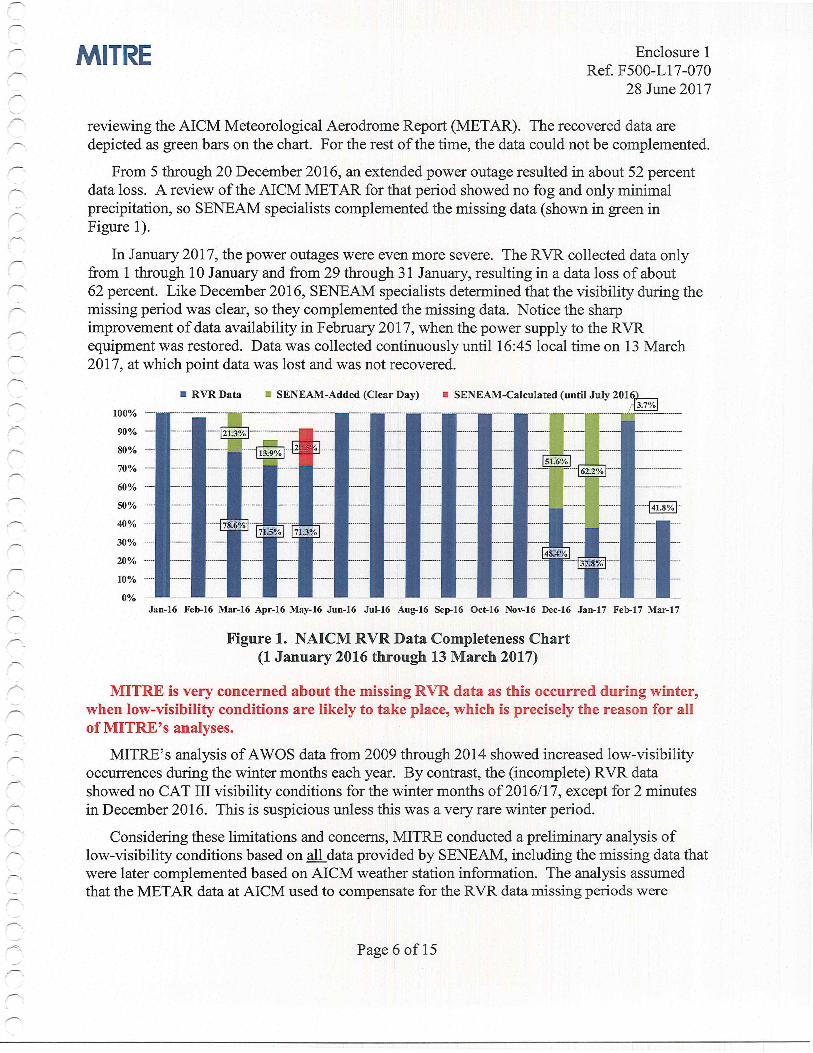
Figure 1 summarizes the RVR data availability. The bars in the chart show the percentage of time in each month the visibility data were collected, complemented, and/or calculated by SENEAM, with 100 percent indicating no loss of data. The blue bar represents the RVR data without SENEAM corrections. The green bar indicates the percentage of the data added by SENEAM when the visibility was believed to be clear. The red bar represents the percentage of the data re-calculated by SENEAM when the visibility was below 6000 ft at certain BL conditions (prior to July 2016).
Overall, the data were available about 84 percent of the time, and, with the SENEAM complements, about 94 percent of the time. Figure 1 depicts a significant data loss in December 2016, January 2017, and March 2017; and moderate data loss in March 2016, April 2016, and May 2016. For sorne ofthose months, SENEAM complemented the data after
The NAICM RVR records visibility data in one-minute intervals. Each month, SENEAM downloads and reviews the RVR data, and, after adjustments where necessary, forwards the data to MITRE. According to SENEAM, adjustments to the data have been made under two situations:
NAICM RVR Data 3.
6750.24E (Instrument Landing System and Ancillary Electronic Component Configuration and Performance Requirements) and Order 8260.3C (United States Standardfor Terminal Instrument Procedures [TERPS]) for more details.
Enclosure 1 Ref. F500-Ll 7-070
28 June 2017
MITRE
»<
f'
r-
" 1
Page 6of15
f',
r>.
'- .r--'
MITRE is very concerned about the missing RVR data as this occurred during winter, when low-visibility conditions are likely to take place, which is precisely the reason for ali of MITRE's analyses.
MITRE's analysis of AWOS data from 2009 through 2014 showed increased low-visibility occurrences during the winter months each year. By contrast, the (incomplete) RVR data showed no CAT III visibility conditions for the winter months of2016/17, except for 2 minutes in December 2016. This is suspicious unless this was a very rare winter period.
Considering these limitations and concems, MITRE conducted a preliminary analysis of low-visibility conditions based on all data provided by SENEAM, including the missing data that were later complemented based on AICM weather station information. The analysis assumed that the METAR data at AICM used to compensate for the RVR data missing periods were
Figure l. NAICM RVR Data Completeness Chart (1January2016 through 13 March 2017)
(-..
,,-... r -
Jan-16 Fel>-16 Mar-16 Apr-16 May-16 Juu-16 Jul-16 Aug-16 Sep-16 Oct-16 Nov-16 Dec-16 Jan-17 Fel>-17 Mar-17
----141.so;.I· .......... ,1 _ -------- --
-------- ----·
-------·- ---··-
- -
······121§~%·1·····················-
0%
10% .
20% ..... 30% ·-··
40% -··· ,..---.
80%
• RVR Data • SENEAM-Added (Clear Day) 11 SENEAM-Calculated (until July 201~ 3.7%
--- --------------------------- . ., ------------------------------------------- -------- ---------- - - -- --------- --- --------- . --------- - ---------- .,,. .... ---------- ""---------- ~· ---------------------- 100%
90%
,,,-.,.
reviewing the AICM Meteorological Aerodrome Report (METAR). The recovered data are depicted as green bars on the chart. For the rest of the time, the data could not be complemented.
From 5 through 20 December 2016, an extended power outage resulted in about 52 percent data loss. A review of the AICM METAR for that period showed no fog and only minimal precipitation, so SENEAM specialists complemented the missing data (shown in green in Figure 1).
In January 2017, the power outages were even more severe. The RVR collected data only from 1 through 1 O J anuary and from 29 through 31 J anuary, resulting in a data loss of about 62 percent. Like December 2016, SENEAM specialists determined that the visibility during the missing period was clear, so they complemented the missing data. Notice the sharp improvement of data availability in February 2017, when the power supply to the RVR equipment was restored. Data was collected continuously until 16:45 local time on 13 March 2017, at which point data was lost and was not recovered.
Enclosure 1 Ref. F500-Ll 7-070
28 June 2017
MITRE

Page 7of15
--· />.
Intentionally Left Blank
f'
4. Visibility Category Classification MITRE used U.S. FAA criteria to classify visibility conditions. Table 1 details the four
visibility categories applied in this analysis, as well as the corresponding types of procedures typically required to land during those conditions. Note that analyzing CAT 1 or better visibility conditions is outside the scope of this study, since it was addressed in the AWOS data analysis of January 2015. Therefore, for this study, MITRE refers to CAT 1 or better visibility as "good" weather.
representative ofthe actual visibility conditions at the NAICM site. However, MITRE strongly recommends that all power supply and other issues that have been causing problems in collecting RVR (and AWOS) data are addressed as soon as possible to ensure the reliability and completeness of the data in the months to come. The RVR should be constantly checked during the upcoming winter period.
r> r>
r:
Enclosure 1 Ref. F500-Ll 7-070
28 June 2017
MITRE

Page 8of15
3 Note that for the purposes ofthis analysis, ceiling (cloud height) requirements are not specified or discussed. However, for non-precision approaches, as well as ILS CAT I approaches (where RVR is not available), the ceiling requirements are an important consideration.
This section describes the results ofthe NAICM RVR data from 1January2016 through 13 March 2017. In its analysis, MITRE considered the overall RVR visibility conditions, the variability of the visibility by time of the day, and seasonality by months. The analysis emphasizes the periods where visibility conditions are more likely to affect operations at NAICM. All times in this document are local.
NAICM RVR Data Analysis 5.
As mentioned above, F AA and ICAO require RVR measurements to operate during CAT II and CAT III visibility conditions; and, since RVR systems are to be installed at NAICM, RVR will also be controlling for CAT I weather.
Visibility "Category" RVRin ft Notes
This category includes three possible scenarios:
1. Conditions during which visual approach procedures would likely be conducted-
CA T I or better 2: 1800 2. Conditions during which instrument procedures may be conducted during the first portion of the approach and visual approach procedures during the final portion
3. Conditions during which the use of a CA T I ILS approach procedure is required Conditions that may require the use of a CA T II
CATII < 1800 and 2: 1200 approach procedure. Specialized aircraft and ground equipment, as well as pilot training, are required. Conditions that may require the use of a CA T III
CAT III < 1200 and 2: 700 ILS approach procedure. Specialized aircraft and ground equipment, as well as pilot training, are required.
Runway Closed <700 Runway closed for approaches
Table l. Visibility Categories Used in this Analysis
Enclosure 1 Ref. F500-Ll 7-070
28 June 2017
MITRE
r-
r>
r>
¡,,--...,
r>
,r.

Page 9of15
Occurrence Occurrence Visibility Condition (minutes) (percent)
CA T 1 or better 618,736 99.908 CATII 474 0.077 CATIII 89 0.014 Runway Closed 5 0.001
Table 2. NAICM RVR Data: Overall Visibility Conditions (1 January 2016 through 13 March 2017)
The overall visibility conditions at the NAICM site from 1January2016 through 13 March 2017 are listed in Table 2. The data suggest that more than 99.9 percent of the time, the visibility conditions were equivalent to CAT I or better. The RVR recorded only five minutes (0.001 percent) of very bad visibility conditions that would require runway closure. Visibility conditions equivalent to CA T II and CA T III were also observed at the site, occurring for 89 minutes (0.014 percent) and 474 minutes (0.077 percent), respectively.
NAICM Visibility Conditions 5.1
RVR values vary with the intensity of the runway lighting system. SENEAM provided RVR data for two light intensity settings: CAT I and CAT III. To simplify the results, MITRE' s analysis is based on using the minimum RVR value produced by the two settings. This approach provides an operationally meaningful estimate of the percentage of the time that the airport would be subject to visibility conditions in various approach categories, and the airport's availability for aircraft operations during low-visibility periods. Note that a single RVR equipment device provides a representative data oflikely typical conditions at the airport in general, but in operational use the actual visibility classification depends on one or more RVR readings from the specific runway in use.
Given the reliability problems of the NAICM RVR (and AWOS) system, the results presented here should only be considered a best estímate of the actual availability of the runway dueto low-visibility conditions. For example, in sorne cases power outages occurred during potentially low-visibility conditions. In other cases, data were complemented using weather data from the AICM station (a total of about 1 O percent), which may not be representative of the visibility conditions at NAICM. As a result, in over 14 months, the overall data availability from the RVR system was about 94 percent (including the SENEAM adjustments ), leaving about six percent of weather conditions as unknown. Based on the methodology used by SENEAM to complement the data, these six percent could potentially have consisted of visibility conditions worse than CAT l. Again, adjustments may produce biases. Finally, the most likely period of low visibility is the one with most issues due to malfunctions.
Enclosure 1 Ref. F500-Ll 7-070
28 June 2017
MITRE
r>, 1
- I
,,--... )
r-
Page 10of15
(-
f'
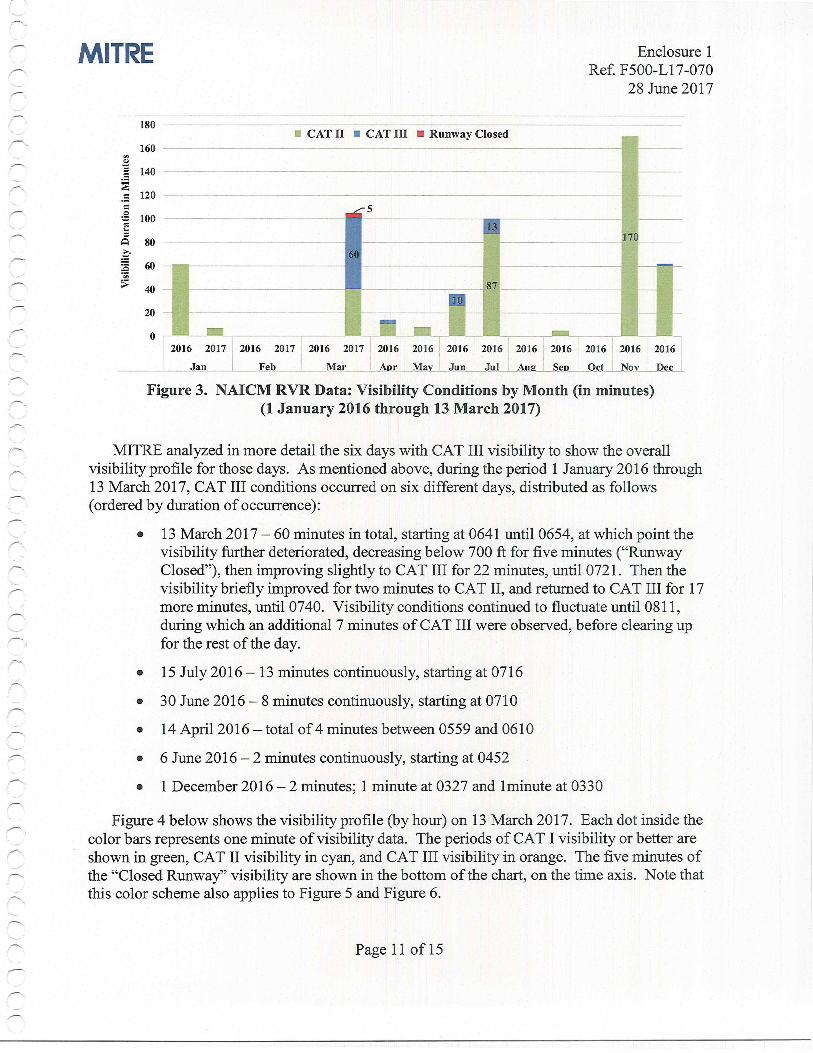
Figure 3 shows the visibility category occurrences (in minutes) by month. Since RVR data are available for just over 14 months, it is difficult to assess any seasonality in weather pattems yet. As more data are provided to MITRE, a better understanding of the seasonality of the visibility data can be reached.
The figure shows that most ofthe CAT III visibility conditions (blue bars) occurred in three different months: March, June, and July. In particular, 60 out of 89 minutes of CAT III visibility conditions occurred on 13 March 2017, 13 minutes on 15 July 2016, and eight (8) minutes on 30 June 2016. Four (4) minutes of CAT III was observed on 14 April 2016, and two (2) minutes both on 6 June 2016 and 1December2016.
On the other hand, the highest occurrence of CA T II weather (green bars) was observed in November 2016 and July 2016, for 170 and 87 minutes, respectively. The longest period of CAT II weather in one day was observed on 17 November, stretching from 0116 to 0448 for an aggregate duration of 141 minutes.
Note, that these numbers represent only a small fraction of all the data. For example, the 170 minutes of CAT II weather in November 2016 represents less than 0.4 percent ofthe total time for that month.
' ,
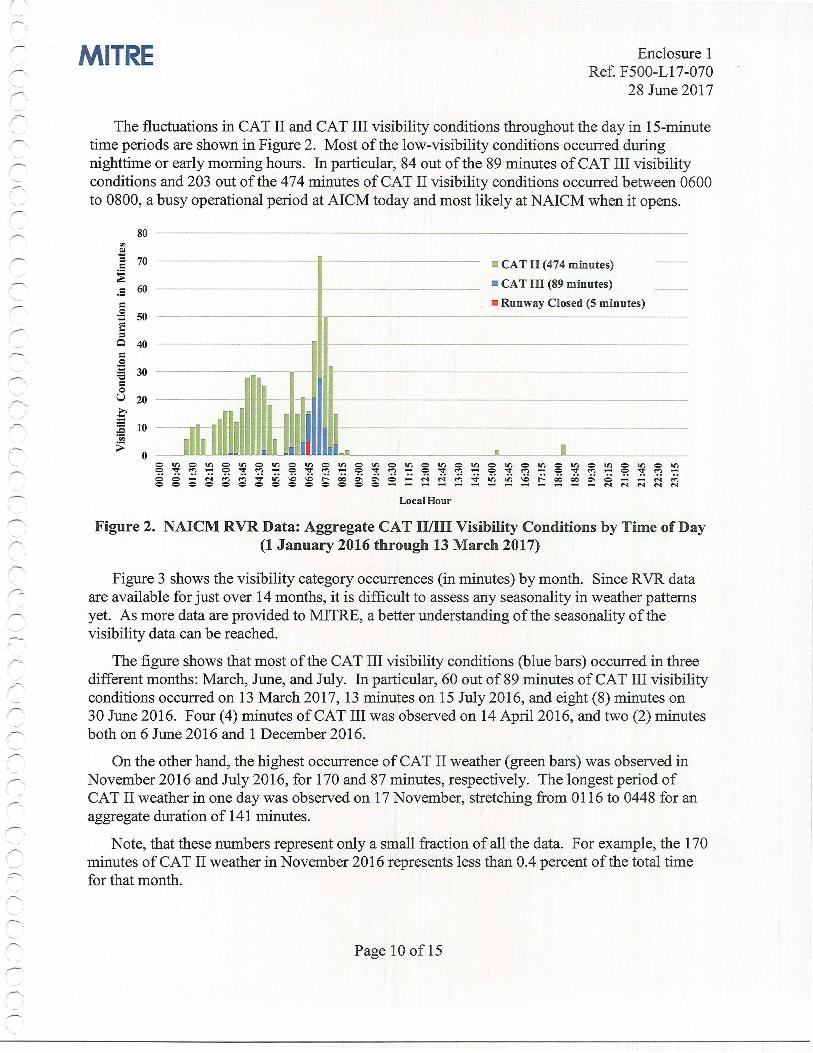
Figure 2. NAICM RVR Data: Aggregate CAT 11/111 Visibility Conditions by Time of Day (1January2016 through 13 March 2017)
o ti) o ti) o ti) o ti) o ti) o :!l o ti) o ti) o ti) o ti) o ti) o :!l o ti) o ti) o ti) o ti) '?. ;r; <;¡ - '?. ;r; <;¡ ...... o ;r; <;¡ '?. ;r; <;¡ - '?. ;r; <;¡ - '?. ;r; "' '?. ;r; <;¡ - '?. ;r; <;¡ - o o - N "' "' .... ti) ~ \O r-. 00 "' "' ::: - N N "' .... :!l ti) ~ r- e 00 "' o - - N "' o o o o o o o o o o o o o o - - - - - - - - - - N N N N N
LocaJHour
r
"' ~ E 70 ------------------ CAT 11 (474 minutes) ~ .S 60 ------------------ •CATIIl(89minutes) e 11 Runway Closed (5 minutes) ~so-------------------------------~ E = o 40 e :§ :s 30 e o u 20
~ :e 10 ·¡;; > o
f'
The fluctuations in CA T II and CA T III visibility conditions throughout the day in 15-minute time periods are shown in Figure 2. Most ofthe low-visibility conditions occurred during nighttime or early moming hours. In particular, 84 out of the 89 minutes of CAT III visibility conditions and 203 out ofthe 474 minutes of CAT II visibility conditions occurred between 0600 to 0800, a busy operational period at AICM today and most likely at NAICM when it opens.
('
Enclosure 1 Ref. F500-Ll 7-070
28 June 2017
MITRE
Page 11of15
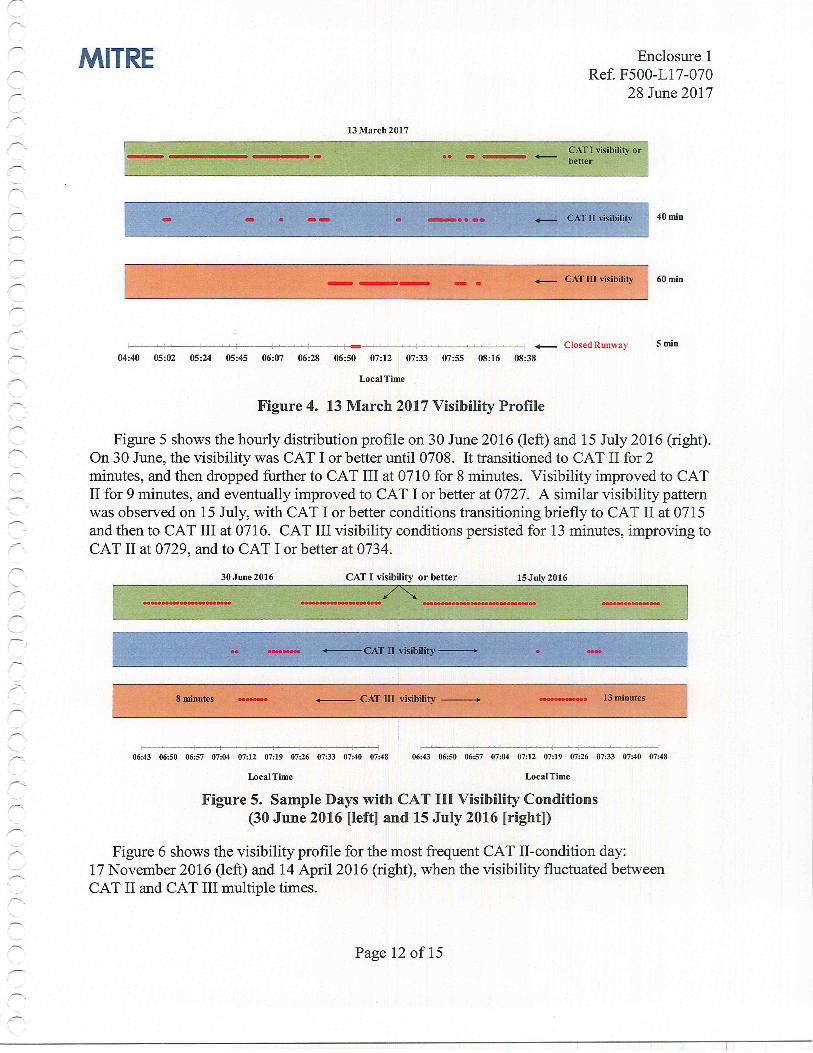
Figure 4 below shows the visibility profile (by hour) on 13 March 2017. Each dot inside the color bars represents one minute of visibility data. The periods of CA T I visibility or better are shown in green, CA T II visibility in cyan, and CAT III visibility in orange. The five minutes of the "Closed Runway" visibility are shown in the bottom ofthe chart, on the time axis. Note that this color scheme also applies to Figure 5 and Figure 6.
,.--.__
,-. J
Figure 3. NAICM RVR Data: Visibility Conditions by Month (in minutes) (1 January 2016 through 13 March 2017) , __
MITRE analyzed in more detail the six days with CAT III visibility to show the overall visibilityprofile for those days. As mentioned above, during the period 1January2016 through 13 March 2017, CAT III conditions occurred on six different days, distributed as follows (ordered by duration of occurrence):
• 13 March 2017 - 60 minutes in total, starting at 0641 until 0654, at which point the visibility further deteriorated, decreasing below 700 ft for five minutes ("Runway Closed"), then improving slightly to CA T III for 22 minutes, until 0721. Then the visibility briefly improved for two minutes to CAT II, and retumed to CAT III for 17 more minutes, until 0740. Visibility conditions continued to fluctuate until 0811, during which an additional 7 minutes of CA T III were observed, before clearing up for the rest of the day.
• 15 July 2016- 13 minutes continuously, starting at 0716
• 30 June 2016- 8 minutes continuously, starting at 0710
• 14 April 2016- total of 4 minutes between 0559 and 0610
• 6 June 2016 -2 minutes continuously, starting at 0452
• 1December2016 - 2 minutes; 1 minute at 0327 and lminute at 0330
o - _111111 - ---- - -
1
, 2016 20171 2016 2017 ¡ 2016 20171 20161 20161 2016 1 20161· 2016 i 2016 1 2016 i 2016 2016 --~-~J~an E_~b 1 Mar A,p_r_Ma_y_l_J.1J!L.[_J).tl __ -'-A_u_2j___s_eJ!_l_Qc_t~o_v_L]!e_c_
5
f!il CAT 11 • CAT 111 Runway Closed
----- 180 160
"' ~ e 140 ~ 120 -~ 100 ~ = Q 80 ~-
60 :e ·o; ;;:
20
Enclosure 1 Ref. F500-Ll 7-070
28 June 2017
MITRE
Page 12of15
Figure 6 shows the visibility pro file for the most frequent CA T II-condition day: 17 November 2016 (left) and 14 April 2016 (right), when the visibility fluctuated between CA T II and CA T III multiple times.
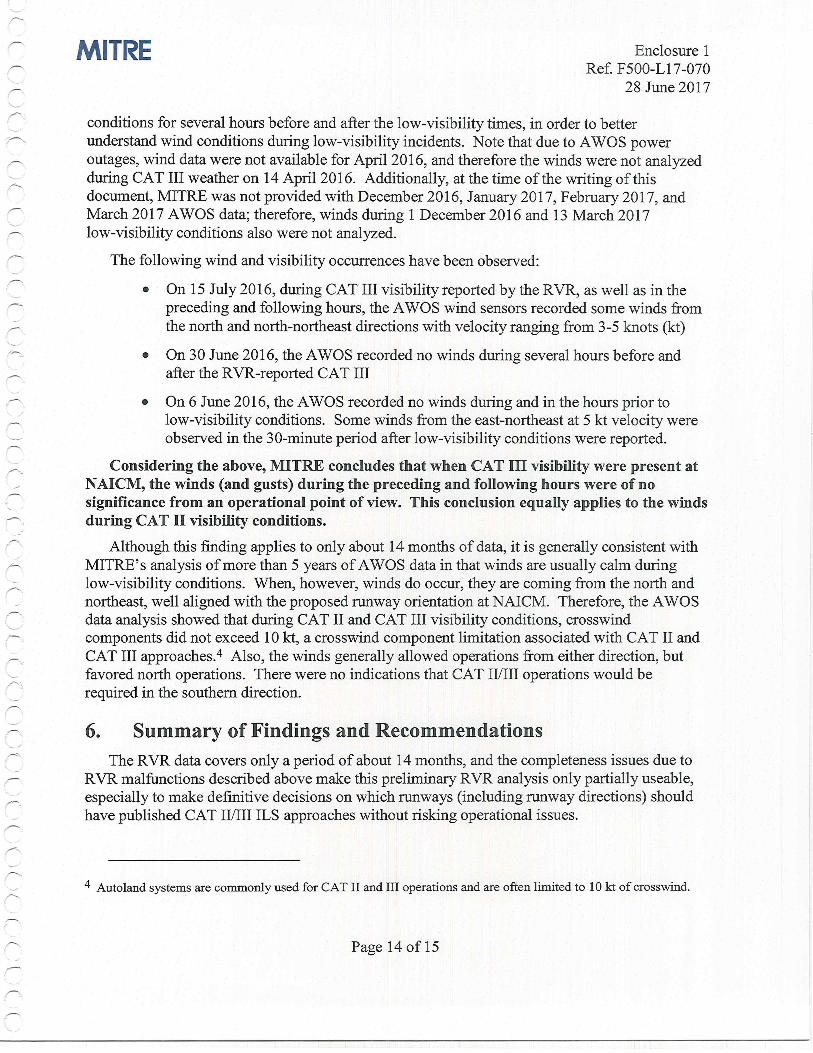
Figure 5. Sarnple Days with CAT 111 Visibility Conditions (30 June 2016 [left] and 15 July 2016 [right])
Local Time Local Time
06:43 06:50 06:57 07:04 07:12 07:19 07:26 07:33 07:40 07:48 06:43 06:50 06:57 07:04 07:12 07:19 07:26 07:33 07:40 07:48
13 minutes +-- CAT m visibility - 8 minutes r'.
·-- +--CAT 11 Yisibility- ,-- )
15July 2016 CAT 1 visibility o r better 30June 2016
Figure 5 shows the hourly distribution profile on 30 June 2016 (left) and 15 July 2016 (right). On 30 June, the visibility was CAT I or better until 0708. It transitioned to CAT II for 2 minutes, and then dropped further to CAT III at 071 O for 8 minutes. Visibility improved to CAT II for 9 minutes, and eventually improved to CAT I or better at 0727. A similar visibility pattem was cibserved on 15 July, with CA T I or better conditions transitioning briefly to CA T II at 0715 and then to CAT III at 0716. CAT III visibility conditions persisted for 13 minutes, improving to CAT II at 0729, and to CA T I or better at 0734. - r>,
Figure 4. 13 March 2017 Visibility Profíle
Local Time
5min - ClosedRunway 04:40 05:02 05:24 05:45 06:07 06:28 06:50 07:12 07:33 07:55 08:16 08:38 r>.
- CAT TU visibility 60 mio --- ...
40min - CAT n visibility -···· -- -
CAT 1 visibility or 1 better .. - ... _. - 13 Marcb 2017
Enclosure 1 Ref. F500-Ll 7-070
28 June 2017
MITRE

Page 13of15
5.2 NAICM Winds During CAT 11 and CAT 111 Conditions MITRE also analyzed wind (and gust) direction and velocity for the NAICM site based on
the A WOS data during CAT II and CAT III visibility. Because the A WOS collects wind data in 30-minute intervals while the RVR records data in 1-minute intervals, sorne matching is required of the corresponding intervals.
Unfortunately, a direct comparison between the RVR and the AWOS was not possible, likely dueto different time stamps from the two sensors. For example, on 15 July 2016, the RVR recorded CAT III visibility starting 0716, while the AWOS recorded the lowest visibility (equivalent to that of CAT III) at 0835. On 6 June 2016, the RVR recorded CAT III visibility at 0452, while the AWOS reported its lowest visibility, Yi sm, 3.5 hours later. Therefore, it is recommended that the reporting times for both the A WOS and RVR sensors be compared and calibrated to ensure better time synchronization of the data. It is important that this be completed before 1August2017.
Despite of the time-recording differences, MITRE attempted to match the wind conditions during and around the lowest AWOS visibility periods during and around the CAT II and CAT III conditions reported by the RVR. In other words, MITRE reviewed wind and visibility
- ('
Figure 6. Days with Frequent CAT 11, and Fluctuating CAT 111 Conditions (17 November 2016 [left] and 14 April 2016 [right])
Local Time Local Time
03:36 04:04 04:33 05:02 05:31 06:00 06:28 06:57 07:26 07:55 08:24 00:12 00:56 01:39 02:22 03:05 03:48 04:32 05:15
r>,
4 minutes +- CAT m visibility - Not observed
_,......__
JO minutes 14.J minutes • -- - • -- - CATO visibilit:v -+
____ /7""'4 _ ----- -··· - .. CAT 1 visibility or better 14 April 2016 17November2016
On 17 November 2016, visibility conditions deteriorated to CAT II at 0117 and persisted on and off until 0451, for a total of 141 minutes. The visibility on this day never deteriorated to CA T III. The reason that visibility appears to alternate between CAT I or better and CA T II is that many of the RVR readings were between 1600 ft and 2000 ft, sometimes falling below 1800 ft and other times staying above. By contrast, on 14 April 2016, visibility deteriorated to CAT II at 0557 and fluctuated between CAT II and CAT III until 0613. A total of four (4) minutes of CAT III and 1 O minutes of CAT II were recorded during this period (note that visibility was between 1100 ft and 1500 ft for part of the time, providing the appearance on the graph that it was fluctuating significantly).
r=
Enclosure 1 Ref. F500-Ll 7-070
28 June 2017
MITRE
Page 14of15
4 Autoland systems are commonly used for CAT 11 and ill operations and are often limited to 10 kt of crosswind.
r>
The RVR data covers only a period of about 14 months, and the completeness issues due to RVR malfunctions described above make this preliminary RVR analysis only partially useable, especially to make definitive decisions on which runways (including runway directions) should have published CAT II/III ILS approaches without risking operational issues.
./"-.
Summary of Findings and Recommendations 6. (·
r>
conditions for several hours before and after the low-visibility times, in order to better understand wind conditions during low-visibility incidents. Note that dueto A WOS power outages, wind data were not available for April 2016, and therefore the winds were not analyzed during CAT III weather on 14 April 2016. Additionally, at the time ofthe writing ofthis document, MITRE was not provided with December 2016, January 2017, February 2017, and March 201 7 A WOS data; therefore, winds during 1 December 2016 and 13 March 2017 low-visibility conditions also were not analyzed.
The following wind and visibility occurrences have been observed:
• On 15 July 2016, during CAT III visibility reported by the RVR, as well as in the preceding and following hours, the AWOS wind sensors recorded sorne winds from the north and north-northeast directions with velocity ranging from 3-5 knots (kt)
• On 30 June 2016, the AWOS recorded no winds during several hours before and after the RVR-reported CAT III
• On 6 June 2016, the AWOS recorded no winds during and in the hours prior to low-visibility conditions. Sorne winds from the east-northeast at 5 kt velocity were observed in the 30-minute period after low-visibility conditions were reported.
Considering the above, MITRE concludes that when CAT 111 visibility were present at NAICM, the winds (and gusts) during the preceding and following hours were ofno significance from an operational point of view. This conclusion equally applies to the winds during CA T 11 visibility conditions.
Although this finding applies to only about 14 months of data, it is generally consistent with MITRE's analysis of more than 5 years of AWOS data in that winds are usually calm during low-visibility conditions. When, however, winds do occur, they are coming from the north and northeast, well aligned with the proposed runway orientation at NAICM. Therefore, the A WOS data analysis showed that during CAT II and CAT III visibility conditions, crosswind components did not exceed 1 O kt, a crosswind component limitation associated with CA T II and CAT III approaches." Also, the winds generally allowed operations from either direction, but favored north operations. There were no indications that CAT !VIII operations would be required in the southern direction.
'-- r>.
Enclosure 1 Ref. F500-Ll 7-070
28 June 2017
MITRE

Page 15of15
MITRE has been unofficially informed that even though six CAT Il/llI ILSs are going to be acquired (for the three initial runways in both directions), only two runways in north flow are being planned for published CAT Il/Ill ILS approaches at NAICM. It is important to point out that this could cause disruptions during triple independent operations. Having only two CAT Il/llI-capable runways (i.e., being limited to only two arrival streams instead of three and only in one direction) could result in many aircraft being delayed or diverted to other airports.
This is a major concern that authorities and other stakeholders need to carefully consider in their decision-making process. MITRE recommends, at a minimum, to wait for a new analysis by MITRE at the end of the winter of 2017 /18. In order to do this in an effective manner, it is important that a major effort be mounted immediately to avoid additional RVR power and data storage malfunctions. Also, maintenance to the A WOS and RVR modules should take place constantly.
MITRE proposes to conduct another analysis ofRVR data in the spring of 2018, so that more robust results can be provided to further assist authorities in their decision-making process.
The visibility data suggest that good visibility conditions (i.e., for the purposes of this study - those equivalent to CAT I and better) occur more than 99.9 percent ofthe time. During this period, only five minutes of very poor visibility requiring runway closures (i.e., conditions below CAT III) were observed. A total of 89 minutes of CAT III visibility were recorded on six different days, occurring mostly in the early moming hours. A total of 474 minutes of CAT II visibility were recorded on 22 different days, mostly in moming hours.
The cross-comparison ofthe RVR and the AWOS data suggested that during the periods of poor visibility, and during the preceding and following hours, the winds were generally calm, and aligned with the proposed NAICM runway orientation.
Although the frequency of CAT II and CAT III visibility occurrences was low, the important conclusion ofthis analysis is that low visibility does occur at NAICM for extended periods of time. In one instance, on 13 March 2017, CAT III visibility occurred for 60 minutes during potentially peak morning hours. In another instance, on 17 November 2016, a total of 141 minutes of CA T II visibility occurred during nighttime hours.
Considering the importance ofhigh traffic-volume atan intemational commercial airport such as NAICM needing to be open "at all times", and the fact that poor visibility conditions do occur during typically busy morning hours, any individual runway at NAICM without CAT II/III ILS approach capability could likely be closed, thereby reducing airport capacity when it is needed the most. At NAICM, during times of high demand, any significant reduction in arrival capacity for even a short amount of time, may result in major delays and cause operational disruptions. On a day like 13 March 2017, for example, any runway closure for 60 minutes would result in significant disruptions not only at NAICM, but also to other airports both within and outside ofMexico.
Enclosure 1 Ref. F500-Ll 7-070
28 June 2017
MITRE
1 r
r: r=
r:
1 r:
r=. 1
r: r=
r>
..,,,.,__,,,.
r-