mitochondrial phylogeny of trematomid fishes (nototheniidae, perciformes) and the evolution of...
TRANSCRIPT
MOLECULAR PHYLOGENETICS AND EVOLUTION
Vol. 5, No. 2, April, pp. 383–390, 1996ARTICLE NO. 0033
Mitochondrial Phylogeny of Trematomid Fishes (Nototheniidae,Perciformes) and the Evolution of Antarctic Fish
PETER A. RITCHIE,†,*,1,2 LUCA BARGELLONI,*,‡ AXEL MEYER,*,§ JOHN A. TAYLOR,† JOHN A. MACDONALD,†AND DAVID M. LAMBERT†,2
†School of Biological Sciences, University of Auckland, Private Bag 92019, Auckland, New Zealand; *Department of Ecology andEvolution and §Program in Genetics, State University of New York, Stony Brook, New York 11794-5245;
and ‡Dipartimento di Biologia, Universita di Padova, Via Trieste 75, 35121 Padua, Italy
Received November 22, 1994; revised June 2, 1995
there is evidence that this may have occurred aboutThe subfamily of fishes Trematominae is endemic to 12–14 million years ago (MYA) (Eastman, 1993;
the subzero waters of Antarctica and is part of the Bargelloni et al., 1994).larger notothenioid radiation. Partial mitochondrial There may have been a suite of factors which allowedsequences from the 12S and 16S ribosomal RNA (rRNA) the notothenioids, in particular, to evolve to such domi-genes and a phylogeny for 10 trematomid species are nance in the Southern Oceans. Several authors havepresented. As has been previously suggested, two taxa, suggested that speciation within the group could haveTrematomus scotti and T. newnesi, do not appear to be been the result of large-scale disruptions in the Antarc-part of the main trematomid radiation. The genus Pa- tic ecosystem during the Miocene (Clarke, 1983). Thegothenia is nested within the genus Trematomus and isostatic pressure from the accumulation of ice duringhas evolved a unique cyropelagic existence, an associ- the early Miocene (25–15 MYA) left the continentalation with pack ice. Using a mitochondrial rRNA mo- shelf unusually small, deep, and lacking extensive to-lecular clock rate of 0.14% transversion changes per
pography (Andersen, 1991). It is likely that the pres-million years, the average age of the trematomids is es-ence of ice, which destroyed high coastal habitats andtimated at 3.4 million years (MY). If the age of the tre-caused the depression of the continental shelf, resultedmatomids is approximately 3.4 MY, this group couldin the extinction of many other species. In addition, be-have speciated during a period of deglaciation in Ant-cause the ice is anchored to the continent, riverine, es-arctica 2.5–4.8 million years ago. This era was markedtuarine, and intertidal zones were completely lost.by significant changes on the Antarctic shores, such asHence, any species that did not live in the deeper wa-the opening of fjords, which might have provided aters may not have survived these periods of extensivestimulus for speciation. 1996 Academic Press, Inc.
glaciation. The ecological void, freezing water tempera-tures, a circumpolar current impeding immigration,and dramatic seasonal oscillation in productivity actingINTRODUCTIONin concert may have decreased competition by other
Many fishes of the Perciform suborder Nototheni- fishes and hence have allowed notothenioids to diver-oidei are endemic to the waters surrounding Antarctica sify (see Clarke, 1983; Clarke and Crame, 1989; East-(Andriashev, 1965, 1987). The notothenioids have radi- man and Grande, 1989). There is evidence that theated and possess a variety of unique characters distin- notothenioids, which lack a swim bladder, evolvedguishing them from most other teleost fishes, such as from a benthic ancestor (Andersen, 1984; Balushkin,antifreeze glycopeptides and the loss of hemoglobin in 1984).some species (Kock, 1992; Eastman, 1993; Miller, In the complete absence of a fossil record this specia-1993). It has long been hypothesized that the Antarctic tion scenario is difficult to test. Harwood (1991) sug-fauna evolved in situ as the continent cooled and froze gested that a partial deglaciation around 2.5–4.8 MYA,(Regan, 1914; DeWitt, 1971; Anderson, 1990), and and the resultant opening of shallow water habitats
(including fjords), promoted diversification of variousAntarctic biotas. The trematomids are high Antarcticfishes and might have radiated during the period of de-
1 To whom correspondence should be addressed. E-mail: p.rit glaciation 2.5–4.8 MYA in the mid-Pliocene. The [email protected] and diverse biota resulting from this climate2 Present address: Department of Ecology, Massey University Pri-
vate Bag 11-222, Palmerston North, New Zealand. warming could have promoted speciation events.
3831055-7903/96 $18.00Copyright 1996 by Academic Press, Inc.All rights of reproduction in any form reserved.

384 RITCHIE ET AL.
TABLE 1
The Subfamily Trematominae and the OutgroupsUsed in this Study (Following DeWitt et al., 1990)a
Suborder NotothenioideiFamily Nototheniidae
Subfamily EleginopinaeDissostichus mawsoni Pelagic
Subfamily NototheniinaeNotothenia coriiceps BenthicGobionotothen gibberifrons Benthic
Subfamily TrematominaePagothenia borchgrevinki CryopelagicP. brachysomab CryopelagicTrematomus bernacchii BenthicT. eulepidotus EpibenthicT. hansoni BenthicT. lepidorhinus EpibenthicT. loennbergi EpibenthicT. newnesi SemipelagicT. nicolai BenthicT. pennellii BenthicT. scotti BenthicT. tokarevib —T. vicariusb —
a The second column is the habitat type for each species (from East-man, 1993).
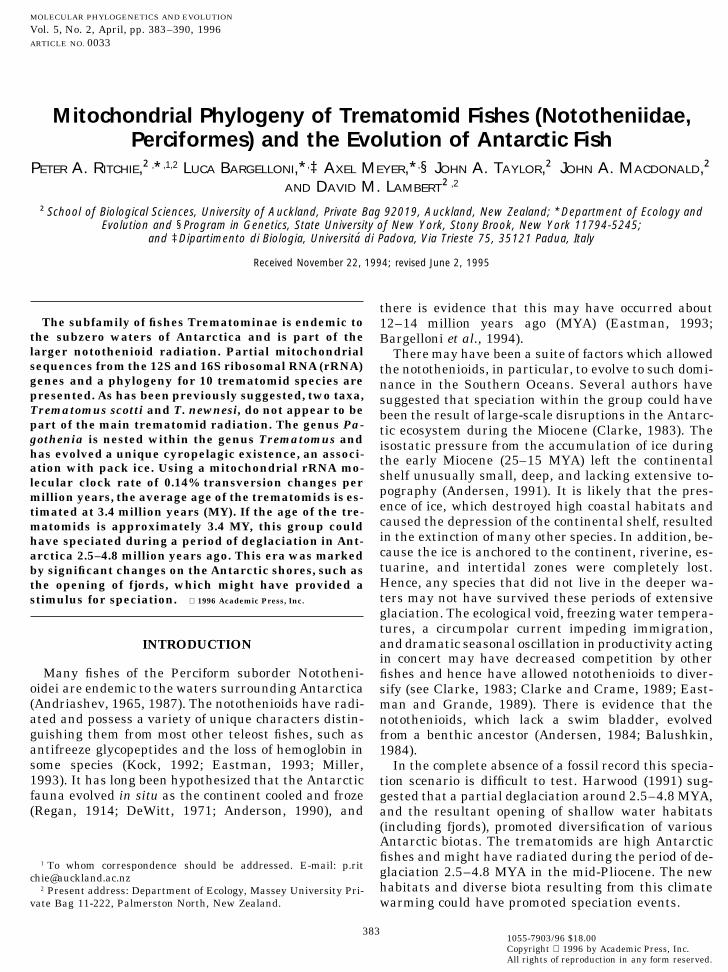
b Taxa not represented in this study. FIG. 1. Map of Antarctica, also showing the Antarctic Conver-gence, which delineates the Southern Ocean (redrawn from Macdon-ald et al., 1987). The gray areas indicate the permanent ice shelvesin the Ross Sea and the Weddell Sea. Samples for this study werecollected in McMurdo Sound and off the coast of the Antarctic Penin-MATERIALS AND METHODSsula.
The trematomids comprise two genera, Trematomus(with 11 species) and Pagothenia (with 2 species), based
was pelleted in a microfuge, dried, and resuspended inon the classification in DeWitt et al. (1990) (Table 1).200 µl of distilled H2O. The polymerase chain reactionMtDNA sequences from the 12S and 16S ribosomal(PCR) (Saiki et al., 1988) was used to amplify two seg-RNA (rRNA) genes were determined for 10 taxa fromments from the 12S and 16S rRNA genes using univer-the subfamily Trematominae (Table 1). Three trema-sal PCR primers: 12SA, 5′-AAAAAGCTTCAAACTGGGtomid taxa were not represented in this study: Pago-ATTAGATACCCCACTAT-3′; 12SB, 5′-TGACTGCAGAthenia brachysoma, Trematomus tokarevi, and T. vi-GGGTGACGGGGCGGTGTGT-3′; 16SA, 5′-CGCCTGTcarius. MtDNA sequences for taxa from the family No-TTATCAAAACAT-3′; 16SB, 5′-CCGGTCTGAACTCAGtotheniidae, Notothenia coriiceps, Gobionotothen gib-ATCACGT-3′ (Kocher et al., 1989; Palumbi et al., 1991).berifrons, and Dissostichus mawsoni, have been pub-Double-stranded amplifications were performed in 50-lished previously (Bargelloni et al., 1994) and wereµl volumes containing 10 mM Tris (pH 8.3), 100 mMincluded in this study as outgroups. Specimens wereKCl, 2.5 mM MgCl2, 1 mM of each dNTP, 1 µM of eachcollected from McMurdo Sound, Terra Nova Bay, andprimer, 10–1000 ng of genomic DNA, and 1 unit of Taqnear the Antarctic Peninsula (Fig. 1) and either frozenpolymerase (Cetus Corp.). PCR was carried out in ain liquid nitrogen at 220°C or preserved in 70% eth-Teche thermal cycler at 92°C/40 s, 52°C/40 s, and 72°C/anol.90 s for 35 cycles. Double-stranded PCR products were
DNA Methods electrophoresed in 2% agarose (in 0.045 M Tris–borate,0.001 M EDTA buffer), excised, and purified in spin col-Total genomic DNA was extracted from white muscle
or liver tissue following Sambrook et al. (1989). Each umns (Costar: Spin-X), followed by phenol extractionand ethanol precipitation. Sequencing reactions weretissue was dissolved in 500 µl of extraction buffer (0.01
M Tris–HCl, pH 8.0, 0.05 M NaCl, 0.01 M EDTA, 2% carried out in 20-µl volumes using a DyeDeoxy termi-nator sequencing kit (Applied Biosystems). Cycle se-SDS) containing proteinase K and incubated at 55°C
overnight. The digested tissue was purified by standard quencing reactions were carried out in a Perkin–Elmerthermal cycler at 96°C/30 s, 50°C/15 s, and 65°C/4 minmethods of phenol–chloroform extraction. Nucleic
acids were then precipitated with 2.5 vol of 100% etha- for 25 cycles. Removal of excess DyeDeoxy terminatorsfrom the reaction mix was achieved by two phenol–nol followed by a 70% ethanol wash. The precipatant

MITOCHONDRIAL PHYLOGENY OF TREMATOMID FISHES 385
chloroform extractions and an ethanol/NaOAc precipi- of Bargelloni et al. (1994) in GenBank under AccessionNos. Z32702–Z32739 and Z32747–Z32748. Of the totaltation followed by a 80% ethanol wash. The precipitate
was dried down in a concentrator (Savant Speedivac) 918 sites included in the analysis, 121 (13.2%) are vari-able and 47 (5.1%) are phylogenetically informativeand resuspended in 5 µl of formamide/50 mM EDTA
(pH 8.0). Samples were denatured at 90°C, transferred (Fig. 2). Across both the 12S and 16S data sets, no nu-cleotide composition bias was seen. On average (includ-to ice, immediately loaded on an Applied Biosystems
373A automated sequencer, and run following the in- ing outgroup taxa) the base composition was A, 28.3%;T, 23.3%; C, 24.4%; and G, 24.1%. More variation wasstructions of the manufacturer. All templates were se-
quenced completely in both directions; 374 bp of the observed in the 16S data set (76 of the 544 bp werevariable, 13.97%) than in the 12S data set (41 of the12S gene and 544 bp of the 16S gene were determined.
The orthologous DNA sequences were aligned with the 374 bp were variable, 10.96%) and only one indel wasfound (position 376–378 in the 16S data set). Overall,Genetics Computer Group Sequence Analysis Software
Package (version 7.3.1-UNIX, Wisconsin, 1993) on a the level of variation was low; in no case do any speciesshare haplotypes. The matrix of observed differences isSilicon Graphics 4D/30 workstation.shown in Table 2. The differences among members ofPhylogenetic Analysesthe ingroup, when both transitions and transversions
In this study parsimony, maximum-likelihood, and were considered, ranged from 5 to 36 (0.5%–3.9%).neighbor-joining methods were employed in the phylo- When only transversions were considered, the substi-genetic analysis; these have all been shown to be simi- tutional differences ranged from as low as 0 to 18 (0–lar in accuracy (Hillis et al., 1994). Phylogenetic analy- 2.0%). There is approximately 4.4% sequence diver-ses were performed using maximum parsimony (MP) gence from the outgroup taxa N. coriiceps, G. gibberi-implemented in PAUP (Swofford, 1993), using the heu- frons, and D. mawsoni to the trematomids. The trema-ristic search procedure, with 100 random replicates. tomids differed by as much as 15.2% sequenceThe robustness of the phylogeny was assessed with divergence from the most basal of the notothenioids,bootstrap analyses of 500 replicates (Felsenstein, the bovichtids, Bovichthus variegatus (Bargelloni et al.,1985). Several different character weighting schemes 1994). Figure 3 shows the plot of transitions (ts) versuswere introduced since weighted parsimony can perform transversions (tv) for within the ingroup and betweenbetter (Hillis et al., 1994). Analyses were done consider- the ingroup and outgroup, with a best-fit line. The over-ing: (1) transitions and transversions equally; (2) a pri- all ratio of ts to tv, the slope of the best-fit line, is 1.72ori weighting of transversions and transitions (tv:ts) (i.e., 1.72 transitions to every 1 transversion). Transi-2:1 according to the observed ratio between the ingroup tions have not reached saturation, either within the in-and outgroup and within the ingroup (ratio 5 1.72, Fig. group or between the ingroup and the outgroup (Fig.3); (3) additional tv: ts ratios of 3:1, 5:1 and 10 :1; 3).(4) transversions only. Also a successive-approximation The sequences from this study were aligned with theapproach to weighting of characters was performed ac- complete sequences of the 12S rRNA of the cow (Gutellcording to their ‘‘cladistic reliability’’ (Farris, 1969; Wil- et al., 1985) and 16S rRNA of Xenopus (Gutell and Fox,liams and Fitch, 1989). Reweighting was based on both 1988), for which the secondary structure of these genesthe mean rescaled and the consistency index of the is known. These reference sequences were used as mod-most parsimonious tree found in parsimony analyses els for the folding structure of the rRNAs and putativeand a base weight of 1000. Neighbor-joining analyses loops and stems were identified for the nototheniids.(NJ) (Saitou and Nei, 1987) were performed with More variation, in terms of both substitutions and in-MEGA (Kumar et al., 1993) and 500 bootstrap repli- dels, is often observed in loops. A slight increase in vari-cates were used to assess the confidence in the phyloge- ation is observed within the putative loops comparednetic estimate. Different methods that accounted for with the stem regions of the nototheniids (including themultiple substitutions were used to estimate evolution- only recorded indel, position 376–378 in the 16S dataary distances: Jukes–Cantor (Jukes and Cantor, 1969), set).Kimura’s two-parameter model (Kimura, 1980), and
Phylogenetic AnalysisTamura–Nei’s method (Tamura, 1992). In addition, amaximum-likelihood (ML) analysis was conducted us- Both maximum parsimony (Fig. 4) and maximum-ing PHYLIP: DNAML version 3.4.1. (Felsenstein, 1991) likelihood (Fig. 5) methods recovered trees with similarusing default parameters (tv:ts ratio of 2). topologies, although the MP tree had two polytomies.
Neighbor-joining (Fig. 6) showed agreement with theseRESULTS topologies apart from the phylogenetic position of T.
newnesi, which was placed not as a sister group to theSequence Analysis other trematomids (as in MP and ML) but as a deep
clade within them. Both T. bernacchii and T. newnesiDNA sequences from this study are deposited in Gen-Bank under Accession Nos. U27520–U27529 and those have longer branch lengths than any other ingroup

386 RITCHIE ET AL.
FIG. 2. The variable sites of the 12S and 16S mitochondrial rRNA sequences in this study. Positions in the complete sequences are givenbelow.
TABLE 2
Distance Matrix for the Two Partial 12S and 16S rRNA Sequences
1 2 3 4 5 6 7 8 9 10 11 12 13
1 T. hansoni — 1.2 1.3 1.5 1.5 1.5 1.2 3.0 2.6 1.9 4.8 5.0 6.12 T. eulepidotus 11/1 — 0.5 1.2 0.5 0.5 2.4 2.4 1.6 1.3 4.2 4.6 5.93 T. nicolai 12/1 5/0 — 1.1 0.7 0.7 2.5 2.3 1.8 1.2 4.3 4.5 5.84 T. pennellii 14/3 11/4 10/4 — 1.3 1.3 2.7 2.7 2.4 1.6 4.6 5.1 6.25 T. lepidorhinus 14/1 5/0 6/0 12/4 — 0.7 2.7 2.5 2.0 1.4 4.7 4.9 6.26 T. loennbergi 14/4 5/3 6/3 12/7 6/3 — 2.5 2.5 2.0 1.4 4.7 4.9 6.27 T. bernacchii 11/6 22/7 23/7 25/9 25/7 12/8 — 3.9 3.7 3.1 5.9 6.2 7.38 T. newnesi 27/12 22/11 21/11 25/15 23/11 23/14 36/18 — 3.3 2.8 5.9 6.1 7.39 T. scotti 24/8 15/7 16/7 22/11 18/7 18/10 34/14 30/15 — 2.5 4.3 4.7 5.8
10 P. borchgrevinki 17/5 12/4 11/4 15/8 13/4 13/7 28/11 26/15 23/11 — 4.4 4.7 5.711 N. coriiceps 44/14 38/13 39/13 42/17 43/13 43/16 54/20 54/22 39/14 40/15 — 2.5 3.712 G. gibberifrons 46/11 42/10 41/10 47/14 45/10 45/13 57/17 56/19 43/15 43/14 23/11 — 3.213 D. mawsoni 56/14 54/13 53/13 57/17 57/13 57/16 67/20 67/22 53/14 52/17 34/10 29/7 —
Note. Above the diagonal is the uncorrected percentage sequence difference between all pairs of taxa; below the diagonal is the numberof substitutions between all pairs of taxa and the number of substitutions when considering transversions only.
taxon. Different weighting schemes employed in theMP analysis recovered essentially the same topolo-gies, apart from the analysis using transversionsonly, which had many polytomies. Furthermore, thesuccessive-approximation approach to the weighting ofcharacters recovered a tree of the same topology as thatof the unweighted MP tree in Fig. 4.
A measure of the phylogenetic signal within thesedata can be estimated by the skewness of tree-lengthdistributions, when generating 1000 random trees(Hillis and Huelsenbeck, 1992). This data set had a g1
5 21.822 (P , 0.01), a highly significant skew, or devi-ation, from what would be expected from random phylo-genetic noise (Fig. 7).
DISCUSSIONFIG. 3. A pairwise comparison of transitions versus transver-
sions for the 12S and 16S rRNA sequences, encompassing the 10 A phylogeny of the trematomids is useful for taxo-trematomids and the 3 outgroup taxa. The open circles represent dif- nomic purposes as well the investigation of evolu-ferences between ingroups and outgroup taxa and the closed circles tionary patterns and processes in the notothenioidrepresent differences within the ingroup taxa. The slope of the line
radiation. Unfortunately, the morphological and karyo-is 1.72, which was used to weight transversions more than transi-tions ( y 5 1.72x 1 2.14; r2 5 0.558). logical characters of this group have not proved to be

MITOCHONDRIAL PHYLOGENY OF TREMATOMID FISHES 387
fully reliable in resolving their interspecific relation-ships (Ekua, 1990; Morescalchi et al., 1992; Ritchie,1993; Eastman, 1993; Klingenberg and Ekua, 1996). Inaddition, there is disagreement among several authorsover the composition and taxonomic arrangement ofthe trematomids (Andersen and Hureau, 1979; Balush-kin, 1982, 1984, 1992; Andersen, 1984; and Dewitt etal., 1990). MtDNA data can, in most cases, be ex-tremely powerful for resolving species-level phyloge-nies (Meyer, 1993; Avise, 1994).
These mtDNA sequence data provide evidence thatthe trematomids are a recent radiation; there are lowamounts of variation, particularly in the loops of therRNA secondary structure. Bootstrap values varied be-tween 100 and 41%; the low values can be attributed tothe small number of phylogenetically informative sites.Consequently, the number of transversions is small inseveral species and an analysis based only on transver-sions did not resolve every clade. The most conservativephylogeny for the trematomids is that found in Fig. 4,which is essentially the same as the ML tree (Fig. 5).The ML and NJ trees differ on the placement of P.borchgrevinki, whereas the MP tree (Fig. 4) presentsthis taxon as an unresolved tricotomy. The followingFIG. 4. The consensus parsimony tree with bootstrap values;
based on unweighted analysis (100 replicates as implemented in discussion will focus on Fig. 4, the MP tree.PAUP 3.1.1., Swofford, 1993). A single MP tree has a length of 144steps (consistency index (CI) 5 0.896, rescaled CI 5 0.754). The num- The Classification of Trematomid Fishesbers on the branches indicate the percentage of trees in the bootstrap
The genus Pagothenia was originally erected byanalysis that shared that topology. These fishes have been redrawnNichols and Lamonte (1936) and contained a single spe-from DeWitt et al. (1990).cies P. brachysoma (a synonym to Notothenia antarc-tica). DeWitt (1962) suggested that T. borchgrevinkishould also be moved into the genus Pagothenia andreported that T. bernacchii and T. hansoni showed cer-tain similarities to Pagothenia. However, it was Andri-ashev and Jakubowski (1971) who eventually classifiedT. borchgrevinki in the genus Pagothenia. The genusPagothenia, consisting of the two cyropelagic species(P. brachysoma and P. borchgrevinki), has been gener-ally accepted (Andersen and Hureau, 1979; Andersen,1984; Balushkin, 1984; DeWitt et al., 1990). The moveof T. hansoni, T. bernacchii, and T. tokarevi to Pago-thenia by Andersen (1984) was controversial. The MPtree recovered from the two ribosomal genes surveyedhere does not support Andersen’s arrangement of thetrematomids, as mentioned above. On the MP tree T.bernacchii, T. hansoni, and T. pennellii are closely re-lated, forming a monophyletic group, and P. borchgre-vinki is a separate clade. Furthermore, T. hansoni andT. bernacchii differ by a large amount of sequence di-vergence, 1.9 and 3.1%, respectively, from P. borchgre-vinki.
Based on these mtDNA data, P. borchgrevinki issurely part of the trematomid radiation but has evolveda unique cyropelagic existence. Many of the differencesbetween Trematomus species and P. borchgrevinkiFIG. 5. Maximum-likelihood tree (as implemented in PHYLIPhave been documented in Eastman and DeVries (1985).version 3.4.1., Felsenstein, 1991) using the default setting
transversions/transition ratio of 1 :2. Further evidence for the close relationship of P. borch-

388 RITCHIE ET AL.
FIG. 6. Neighbor-joining tree based on distance measures that were corrected for multiple substitutions based on the Kimura two-parameter model. The scale shown indicates 1% sequence distance. The numbers on the branches indicate the percentage of trees in thebootstrap analysis (500 replicates) that shared that topology.
for newnesi, the type specimen of the genus. This ge-neric isolation of T. newnesi was based on the degreeof ossification of the primary pectoral girdle, the sizeand position of the scapular foramen, the shape of thelower edge of the coracoid, and the degree of develop-ment of the postcoracoidial. Further evidence for theuniqueness of T. newnesi can be found in hemoglobincomponents. T. newnesi is the only notothenioid thatpossesses a second major hemoglobin type, Hb C (diPrisco et al., 1991). Based on the position of T. newnesiin the present phylogeny, Balushkin’s (1992) genericisolation of this species seems supported. However, aphylogenetic analysis of morphological data does notshow T. newnesi as a sister taxon to the other trema-tomids but rather as a part of the radiation itself
FIG. 7. The distribution of 1000 random trees from the 12S and (Klingenberg and Ekua, 1996; Ritchie, 1993).16S rRNA sequences (g 1 5 21.822, P , 0.01).
The Origin and Diversification of theTrematomid Radiationgrevinki to other Trematomus species is the small
genetic distance between these genera (based on 30 Various environmental conditions are supposed to beresponsible for speciation events within lineages. Ma-protein-coding loci, Roger’s D 5 0.483), which falls
within the range of the intrageneric distances (D 5 jor climatic changes separated by several million yearscould account for many speciation events (Vrba, 1993).0.266–0.508) of the surveyed trematomids (McDonald
et al., 1992). This molecular phylogeny would suggest Because habitat limitations could have been importantin the evolution of notothenioids, the opening of adiscarding the genus Pagothenia; this is beyond the
scope of a single molecular data set especially in view of coastal environment due to a period of deglaciationcould have been the appropriate condition for specia-the morphological basis of this genus (Andriashev and
Jakubowski, 1971). tion in high Antarctic fishes, such as the trematomids.Further, evidence of a speciation pulse in the trema-T. scotti does not appear as part of the main trema-
tomid radiation (Figs. 4–6). This is a trematomid spe- tomids at approximately the same time as the deglacia-tion should be expected. This information can be ob-cies with unusual opercular bones and a distinctive
sexual dimorphism, which is unique among the noto- tained from divergence dates if an accurate calibrationof the notothenioid clock is available.thenioids (DeWitt et al., 1990) and could be given sepa-
rate generic status. Even though T. scotti is most basal Since there is no fossil record for notothenioids, anabsolute calibration of divergence times for molecularon these phylogenies, in terms of percentage sequence
divergence T. scotti is not as distant as T. new- data is elusive. Recently studies contend that thermalhabit, generation time, and metobolic rates are amongnesi from all other trematomids (Table 2).
Balushkin (1982) moved Trematomus taxa into a the different factors influencing mutation rates in themitochondrial genome (Martin and Palumbi, 1993;new genus, Pseudotrematomus, reserving Trematomus

MITOCHONDRIAL PHYLOGENY OF TREMATOMID FISHES 389
ported as part of the New Zealand Antarctic Research Programme, byRand, 1994). As noted in Bargelloni et al. (1994), thegrants to D.M.L. and J.A.M. from the Auckland University Researchrate of the molecular clock may be significantly slowerCommittee, by grants (BSR-9119867 and BSR-9107838) from thein the notothenioids than in other vertebrates since the U.S. National Science Foundation to A.M., and from the Programma
body temperature of many notothenioids is below the Nazionale di Richerhe in Antartide to L.B.freezing point. A further complication is that nototheni-oids may exhibit metabolic cold adaptation (MCA), al-
REFERENCESthough evidence for this is controversial (Macdonaldet al., 1987). MCA is the elevation of metabolic rate to
Andersen, J. B. (1991). The Antarctic continental shelf: Results froma higher level than predicted when extrapolated from marine geological and geophysical investigations. In ‘‘The Geologytemperate fish at subzero temperatures. As more phys- of Antarctica’’ (R. J. Tingey, Ed.), pp. 285–334, Oxford Univ. Press,
Oxford.iological and molecular data accumulate for the trema-tomids a more accurate estimate of the rate of molecu- Andersen, N. C. (1984). Genera and subfamilies of the family Noto-
theniidae (Pisces, Perciformes) from the Antarctic and Subantarc-lar evolution can be obtained.tic. Steenstrupia 10: 1–34.The estimated rates of change for transversions
Andersen, N. C., and Hureau, J.-C. (1979). Proposition pour une nou-(0.14%/MY) in rRNA genes were found to be identicalvelle classification des Nototheniinae (Pisces, Perciforms, Noto-in endotherms (Kraus and Miyamoto, 1991) and ecto- theniidae). Cybium 3(6): 47–53.
therms (Caconne et al., 1994). Since the average per- Anderson, M. E. (1990). The origin and evolution of the Antarcticcentage sequence divergence (using transversions only) ichthyofauna. In ‘‘Fishes of the Southern Ocean’’ (O. Gon and P. C.within the trematomid radiation is 0.482% (excluding Heemstra, Eds.), pp. 28–33, J. L. B. Smith Institute of Ichthyology,
Grahamstown, South Africa.T. newnesi and T. scotti) the average age of the radia-Andriashev, A. P. (1965). A general review of the Antarctic fish fauna.tion would be approximately 3.4 MY. This estimate cor-
In ‘‘Biogeography and Ecology in Antarctica’’ (P. van Oye andrelates with the period of partial deglaciation betweenJ. van Mieghem, Eds.), pp. 491–550, Monogr. Biol., Vol. XV. Junk,2.5 and 4.8 MYA, postulated by Harwood (1991) as a The Hague, Netherlands.
stimulus for speciation on the coasts of Antarctica. Al- Andriashev, A. P. (1987). A general review of the Antarctic bottomthough this calibration is putative, further studies of fish fauna. In ‘‘Fifth Congress of European Ichthyologist Proceed-the rate of molecular change of the trematomid mito- ings, Stockholm, 1985’’ (S. O. Kullander and B. Fernholm, Eds.),
pp. 357–372.chondrial genome are necessary.Andriashev, A. P., and Jakubowski, M. (1971). MorphologicalThe trematomids occupy a variety of ecological
grounds for generic separation of the Antarctic broadhead fishesniches in Antarctica, supposedly all having originated(Trematomus bochgrevinki Boulenger and T. brachysoma Pappen-from a benthic form. Table 1 shows the ecological type heim) and a new species of the genus Pagothenia Nichols et La-
assigned to each trematomid species (based on East- Monte (Nototheniidae). Zool. Zh. 50: 1041–1055 (in Russian).man, 1993). The distributions of the benthic forms on Avise, J. (1994). ‘‘Molecular Markers, Natural History and Evolu-the phylogeny, in particular two outgroup species and tion,’’ Chapman and Hall, New York.the most basal ingroup T. scotti, provide further evi- Balushkin, A. V. (1982). Classification of trematominae fishes of the
Antarctic. In ‘‘Biology of Shelf Zones of the World’s Oceans,’’ pp.dence that this is the primitive condition. The cyropela-9–10, 2. DVNTs SSSR, Vladivostok (in Russian).gic existence of P. borchgrevinki and pelagic habits of T.
Balushkin, A. V. (1984). ‘‘Morphological bases of the systematics andnewnesi are unique on the phylogeny. More interesting,phylogeny of the nototheniid fishes,’’ Acad. Sci. USSR, Zool. Inst.the benthic forms, T. bernacchii, T. hansoni, and T. Leningrad.
pennellii, are monophyletic, as are the epibenthic formsBalushkin, A. V. (1992). Classification, phylogenetic relationships,
T. loennbergi, T. lepidorhinus, and T. eulepidotus. and the origins of the families of the Suborder Notothenioidei (Per-There are limited amounts of ecological diversification ciformes). J. Ichthyol. 32(3): 90–110.among closely related species. During the period of de- Bargelloni, L., Ritchie, P. A., Patarnello, T., Battaglia, B., Lambert,
D. M., and Meyer, A. (1994). Molecular evolution at subzero tem-glaciation (2.5–4.8 MYA) there could have been muchperatures: Mitochondrial and nuclear phylogenies of fishes frommore ecological diversity. The fact that these benthicAntarctica (suborder Notothenioidei), and the evolution of anti-and epibenthic species are indeed monophyletic andfreeze glycopeptides. Mol. Biol. Evol. 11: 854–863.
share many characters means either a recent radiationCaconne, A., Milinkovitch, M. C., Sborboni, V., and Powell, J. R.or a slow-evolving species rather than sets of conver- (1994). Molecular biogeography: Using the Corsica–Sardinia mi-
gent taxa. croplate disjunction to calibrate mitochondrial rDNA evolutionaryrates in mountain newts (Euproctus). J. Evol. Biol. 7: 227–245.
Clarke, A. (1983). Life in cold water: The physiological ecology of po-ACKNOWLEDGMENTSlar marine ectotherms. Oceanogr. Mar. Biol. Ann. Rev. 21: 341–453.
Thanks to A. L. DeVries, K.-H. Kock, C. Zimmermann, and G. diClarke, A., and Crame, J. A. (1989). The origins of the SouthernPrisco for assistance with specimens for this study. J.A.M. and P.A.R.
Oceans marine fauna. In ‘‘Origins and Evolution of the Antarcticappreciate the continued support and hospitality of all those at ScottBiota’’ (J. A. Crame, Ed.), pp. 253–268, The Geological Society,Base (New Zealand), Terra Nova Station (Italy), and McMurdo Sta-London.tion (United States). Thanks to Kristine Boxer and Vivian Ward for
their technical assistance and also to Alexa Bely and the four anony- DeWitt, H. H. (1962). A new Antarctic nototheniid fishes with noteson two recently described nototheniiforms. Copeia 4: 819–833.mous reviewers for comments on the manuscript. This work was sup-

390 RITCHIE ET AL.
DeWitt, H. H. (1971). Coastal and deep-water benthic fishes of the Kraus, F., and Miyamoto, M. M. (1991). Rapid cladogenesis amongthe pecoran ruminants: Evidence from mitochondrial DNA se-Antarctic. Antarct. Map Folio Series 15: 1–10.quences. Syst. Zool. 40(2): 117–130.DeWitt, H. H., Heemstra, P. C., and Gon, O. (1990). Nototheniidae.
In ‘‘Fishes of the Southern Ocean’’ (O. Gon and P. C. Heemstra, Kumar, S., Tamura, K., and Nei, M. (1993). ‘‘Molecular EvolutionaryGenetics Analysis MEGA,’’ ver. 1.0, The Pennsylvania State Uni-Eds.), pp. 279–331, J. L. B. Smith Institute of Ichthyology, Gra-
hamstown, South Africa. versity, University Park, PA.Macdonald, J. A., Montgomery, J. C., and Wells, R. M. G. (1987).di Prisco, G., D’Avino, R., Caruso, C., Tamburini, M., Camardella, L.,
Rutigliano, B., Carratore, V., and Romano, M. (1991). The biochem- Comparative physiology of Antarctic fishes. Adv. Mar. Biol. 24:321–341.istry of oxygen transport in red-blooded Antarctic fish. In ‘‘Biology
of Antarctic Fish’’ (G. di Prisco, B. Maresca, and B. Tota, Eds.), pp. Martin, A. P., and Palumbi, S. R. (1993). Body size, metabolic rate,262–281, Springer-Verlag, Berlin. generation time, and the molecular clock. Proc. Natl. Acad. Sci.
USA 90: 4087–4091.Eastman, J. T. (1993). ‘‘Antarctic Fish Biology,’’ Academic Press, SanDiego. McDonald, M. A., Smith, M. H., Smith, M. W., Novak, J. M., Johns,
P. E., and DeVries, A. L. (1992). Biochemical systematics of noto-Eastman, J. T., and DeVries, A. L. (1985). Adaptations for cryopelagiclife in the Antarctic notothenioid fish Pagothenia borchgrevinki. thenioid fishes from Antarctica. Biochem. Syst. Ecol. 20: 233–241.Polar Biol. 4: 45–52. Meyer, A. (1993). Evolution of mitochondrial DNA in fishes. In ‘‘Bio-
chemistry and Molecular Biology of Fishes’’ (P. W. Mochachka andEastman, J. T., and Grande, L. (1989). Evolution of the Antarctic fishfauna with emphasis on the recent nototheniids. In ‘‘Origins and T. P. Mommsen, Eds.), Vol. 2, pp. 1–38, Elsevier, Amsterdam/New
York.Evolution of the Antarctic Biota’’ (J. A. Crame, Ed.), pp. 241–252,Geogr. Soc. Special Publ. No. 47. Miller, R. G. (1993). ‘‘A History and Atlas of the Fishes of the Antarc-
tic Oceans,’’ Foresta Institute, Nevada.Ekua, W. (1990). Demersal fish fauna of the Weddell Sea, Antarctica.Antarct. Sci. 2: 129–137. Morescalchi, A., Pisano, E., Stanyon, R., and Morescalchi, M. A.
(1992). Cytotaxonomy of Antarctic teleosts of the Pagothenia/Farris, J. S. (1969). A successive approximations approach to charac-ter weighting. Syst. Zool. 18: 374–385. Trematomus complex (Nototheniidae, Perciformes). Polar Biol. 12:
553–558.Felsenstein, J. (1985). Confidence limits on phylogenies: An approachusing the bootstrap. Evolution 39: 783–791. Nichols, J. T., and Lamont, F. R. (1936). Pagothenia, a new Antarctic
fish. Am. Mus. Nov. 839: 1–4.Felsenstein, J. (1991). PHYLIP version 3.4.1., University of Washing-ton, Seattle. Palumbi, S. R., Martin, A., Romano, S., McMillan, W. O., Stice, L.,
and Grabowski, G. (1991). ‘‘The Simple Fool’s Guide to PCR,’’ Univ.Gutell, R. R., and Fox, G. E. (1988). A compilation of large subunitof Hawaii Press, Honolulu.RNA sequences presented in a structural format. Nucleic Acids
Res. 16(suppl.): r175–r269. Rand, D. M. (1994). Thermal habit, metabolic rate, and evolution ofmitochondrial DNA. Trends Ecol. Evol. 9(4): 125–131.Gutell, R. R., Weiser, R., Woese, C. R., and Noller, H. F. (1985). Com-
parative anatomy of S-like ribosomal RNA. Prog. Nucleic Acid Res. Regan, C. T. (1914). ‘‘Fishes of the British Antarctic ExpeditionsMol. Biol. 32: 155–216. (Terra Nova) Zoology Reports 1910,’’ Vertebrata Vol 1, pp. 1–54,
British Museum of Natural History, London.Harwood, D. M. (1991). Cenozoic diatom biogeography in the south-ern high latitudes: Inferred biogeography barriers and progressive Ritchie, P. (1993). ‘‘Molecular and Morphological Phylogenetics ofendemism. In ‘‘Geological Evolution in Antarctica’’ (M. R. A. Antarctic Fishes,’’ M. Sc. thesis, University of Auckland, NewThompson, J. A. Crame, and J. W. Thompson, Eds.), pp. 667–673, Zealand.Cambridge Univ. Press, Cambridge. Saiki, R. K., Gelfand, D. H., Stoffel, S., Scharf, S., Higuchi, R., Horn,
Hillis, D. M., and Huelsenbeck, J. P. (1992). Signal, noise, and reli- R., Mullis, K. B., and Erlich, H. A. (1988). Primer-directed enzy-ability in molecular phylogenetic analyses. J. Hered. 83: 189–195. matic amplification of DNA with a thermostable DNA-polymerase.
Science 239: 487–491.Hillis, D. M., Huelsenbeck, J. P., and Cunningham, C. W. (1994). Ap-plication and accuracy of molecular phylogenies. Science 264: 671– Saitou, H., and Nei, M. (1987). The neighbor-joining method: A new677. method for reconstructing phylogenetic trees. Mol. Biol. Evol. 4:
406–425.Jukes, T. H., and Cantor, C. R. (1969). Evolution of protein molecules.In ‘‘Mammalian Protein Metabolism’’ (H. N. Munro, Ed.), pp. 21– Sambrook, J., Fritsch, E. F., and Maniatis, T. (1989). ‘‘Molecular132. Academic Press, New York. Cloning: A Laboratory Manual,’’ Cold Spring Harbor Lab. Press,
NY.Kimura, M. (1980). A simple method for estimating evolutionary rateof base substitutions through comparative studies of nucleotide se- Swofford, D. L. (1993). ‘‘Phylogenetic Analysis Using Parsimonyquences. J. Mol. Evol. 16: 111–120. (PAUP),’’ version 3.1.1., Illinois Natural History Survey, Cham-
paign.Klingenberg, C. P., and Ekua, W. (1996). A combined morphometricand phylogenetic analysis of an ecomorphological trend: Pelagiza- Tamura, K. (1992). Estimation of the number of nucleotide substitu-tion in Antarctic fishes (Perciformes: Nototheniidae), Biol. J. Linn. tions when there are strong transition–transversion and G1C-Soc. (in press). content biases. Mol. Biol. Evol. 9: 678–687.
Kocher, T. D., Thomas, W. K., Meyer, A., Edwards, S. V., Paabo, S., Vrba, E. S. (1993). Mammal evolution in the African Neogene and aVillablanca, F. X., and Wilson, A. C. (1989). Dynamics of mitochon- new look at the great American interchange. In ‘‘Biological Rela-drial DNA evolution in animals: Amplification and sequencing tionships between Africa and South America’’ (P. Goldblatt, Ed.),with conserved primers. Proc. Natl. Acad. Sci. USA 86: 6196– pp. 393–432, Yale University.6200. Williams, P. L., and Fitch, W. M. (1989). Finding the minimal change
Kock, K.-H. (1992). ‘‘Antarctic Fish and Fisheries,’’ Cambridge Univ. in a given tree. In ‘‘The Hierarchy of Life’’ (B. Fernholm, K. Bremer,Press, Cambridge. and H. Jornfall, Eds.), pp. 453–470, Elsevier, Amsterdam.