mitochondrial genome analysis reveals historical lineages in ... · research article mitochondrial...
TRANSCRIPT
RESEARCH ARTICLE
Mitochondrial Genome Analysis Reveals
Historical Lineages in Yellowstone Bison
David Forgacs1, Rick L. Wallen2, Lauren K. Dobson1, James N. Derr1*
1 Department of Veterinary Pathobiology, Texas A&M University, College Station, Texas, United States of
America, 2 National Park Service, Yellowstone National Park, Mammoth Hot Springs, Wyoming, United
States of America
Abstract
Yellowstone National Park is home to one of the only plains bison populations that have con-
tinuously existed on their present landscape since prehistoric times without evidence of
domestic cattle introgression. Previous studies characterized the relatively high levels of
nuclear genetic diversity in these bison, but little is known about their mitochondrial haplo-
type diversity. This study assessed mitochondrial genomes from 25 randomly selected Yel-
lowstone bison and found 10 different mitochondrial haplotypes with a haplotype diversity of
0.78 (± 0.06). Spatial analysis of these mitochondrial DNA (mtDNA) haplotypes did not
detect geographic population subdivision (FST = -0.06, p = 0.76). However, we identified two
independent and historically important lineages in Yellowstone bison by combining data
from 65 bison (defined by 120 polymorphic sites) from across North America representing a
total of 30 different mitochondrial DNA haplotypes. Mitochondrial DNA haplotypes from one
of the Yellowstone lineages represent descendants of the 22 indigenous bison remaining in
central Yellowstone in 1902. The other mitochondrial DNA lineage represents descendants
of the 18 females introduced from northern Montana in 1902 to supplement the indigenous
bison population and develop a new breeding herd in the northern region of the park. Com-
paring modern and historical mitochondrial DNA diversity in Yellowstone bison helps
uncover a historical context of park restoration efforts during the early 1900s, provides evi-
dence against a hypothesized mitochondrial disease in bison, and reveals the signature of
recent hybridization between American plains bison (Bison bison bison) and Canadian
wood bison (B. b. athabascae). Our study demonstrates how mitochondrial DNA can be
applied to delineate the history of wildlife species and inform future conservation actions.
Introduction
One of the most iconic species living in Yellowstone National Park (NP) is the American plains
bison (Bison bison bison). American bison survived multiple historic and recent population
bottlenecks due to habitat reduction, commercial hunting, and diseases from imported domes-
tic livestock [1]. Populations undergoing major reductions in size with constrained areas of
distribution are vulnerable to the effects of inbreeding and the loss of genetic diversity through
genetic drift [2,3].
PLOS ONE | DOI:10.1371/journal.pone.0166081 November 23, 2016 1 / 15
a11111
OPENACCESS
Citation: Forgacs D, Wallen RL, Dobson LK, Derr
JN (2016) Mitochondrial Genome Analysis Reveals
Historical Lineages in Yellowstone Bison. PLoS
ONE 11(11): e0166081. doi:10.1371/journal.
pone.0166081
Editor: Yidong Bai, University of Texas Health
Science Center at San Antonio, UNITED STATES
Received: August 19, 2016
Accepted: October 21, 2016
Published: November 23, 2016
Copyright: This is an open access article, free of all
copyright, and may be freely reproduced,
distributed, transmitted, modified, built upon, or
otherwise used by anyone for any lawful purpose.
The work is made available under the Creative
Commons CC0 public domain dedication.
Data Availability Statement: Data can be found in
the paper and the supporting information files. S3
Table lists all the NCBI accession numbers
introduced in this study.
Funding: The grant that enabled this study was
P12AC71337 (formerly P12AT51121) awarded by
the Department of the Interior, National Park
Service [https://www.nps.gov/index.htm]. The
funding agency had a role in the design and data
collection of the study by picking and handling the
animals, and also helped with the preparation of
the manuscript.

Yellowstone bison have existed on the same landscape for hundreds of years and there is no
evidence of domestic cattle introgression [4,5,6]. The population reached its nadir in 1902,
with as few as 22 indigenous animals remaining in the central area of the NP. As a result, man-
agers reintroduced bison to the Lamar Valley in the northern region of the NP, including 18
females from the Pablo-Allard herd in northern Montana, three bison bulls from the Good-
night herd in Texas, and three calves from the indigenous bison in central Yellowstone [5,7].
The indigenous and introduced herds began commingling in 1915 and have intermixed sea-
sonally to some extent ever since [5].
Today, the Yellowstone bison population occupies approximately 1 million acres of suitable
habitat near the headwaters of the Yellowstone and Madison River watersheds [8]. The core
habitat available to Yellowstone bison is protected by the management boundaries and conser-
vation policies of the National Park Service. Additional suitable habitat for bison extends out-
side the park into Montana, but only constitutes less than 10% of the total conservation area
[9]. Bison coexist with a full suite of native ungulates and predators, exposing them to competi-
tion for food, predation, and survival under substantial environmental extremes. Thus, Yel-
lowstone bison have likely retained adaptive capabilities that may be diminished in other bison
populations across North America that are managed like livestock [10].
Halbert et al. [11] evaluated 46 nuclear microsatellite loci from Yellowstone bison and found
evidence of a moderately high level genetic diversity (0.626) and gene patterns indicating the
existence of at least two subpopulations (the northern and the central herds) with limited gene
flow between them. However, not much work has been conducted to describe genetic diversity
based on the mitochondrial genome. Mitochondrial DNA (mtDNA) analyses provide insight
into how historical events shaped and influenced population genetic diversity without the com-
plicating issues of diploidy and recombination, inherent with the nuclear genome. Mitochondrial
haplotype diversity is a valuable indicator of population health because mtDNA codes for genes
that play a crucial part in ribosomal activity, cellular respiration, and energy production. The
mitochondrial genome contains 13 protein-coding genes, as well as genes that code for the small
and large rRNA subunits (12S and 16S respectively), and tRNAs. The mitochondrial genome is
haploid and inherited only through the maternal lineage, making it easier to track populations
without having to account for heterozygotes. In addition, mtDNA is more sensitive to inbreed-
ing, loss of diversity, and genetic drift because only one parent plays a role in its transmission.
Ward et al. [12] analyzed 53 bison from across North America that had no evidence of cattle
mtDNA and described eight unique bison haplotypes based on partial D-loop sequences from
the mitochondrial genome. Analyzing DNA sequences from this highly variable 600 base pair
region, the authors reported two haplotypes (which they named haplotypes 6 and 8) from the
five Yellowstone bison analyzed. Gardipee [13] collected DNA samples from 153 Yellowstone
bison and developed a method to distinguish between the two haplotypes previously described
by Ward et al. [12] by sequencing a 470 base pair section of the D-loop control region.
Analyzing the complete mitochondrial genome, Douglas et al. [14] found 17 unique
mtDNA haplotypes during a broad survey of plains bison (B. b. bison) and wood bison (B. b.
athabascae). Wood bison are phenotypically distinct from plains bison and historically limited
to Canada and the State of Alaska. Most of the 17 haplotypes came from animals in private
herds, which have largely undocumented histories and cannot be traced back to a particular
lineage. Notable exceptions are bHap2 which includes a bison at the National Bison Range in
Montana, bHap10 includes a Fort Niobrara National Wildlife Refuge bison from Nebraska,
bHap17 is from a Yellowstone NP bison, bHap13 and 16 from the Caprock Canyon State Park
in Texas, and wHap14 and 15 from wood bison at Elk Island NP in Canada.
Based on the published sequences from Douglas et al. [14], Pringle [15] proposed that two
non-synonymous point mutations in bison mitochondrial DNA cause significant impairment of
Mitochondrial Haplotype Diversity in Yellowstone Bison
PLOS ONE | DOI:10.1371/journal.pone.0166081 November 23, 2016 2 / 15
Competing Interests: The authors have declared
that no competing interests exist.

mitochondrial oxidative phosphorylation (IMOP). One of these mutations causes an isoleucine
to asparagine amino acid change in the ATP6 gene while the other is a valine to alanine change
in the cytochrome b gene (S1 Table). His conclusions were deduced solely from comparative insilico analysis of homologous sequences in other mammals such as dogs and humans where simi-
lar mutations are known to cause a mitochondrial disease [16]. To our knowledge, no phenotype
has ever been described to substantiate the detrimental effect of the IMOP mutations in bison.
The objective of our research was to better characterize and understand haplotype frequen-
cies in Yellowstone bison. Previous attempts to delineate mitochondrial haplotype diversity in
bison took a much broader approach, analyzing only a few bison for a single location across
the United States, which likely resulted in significant local diversity going undetected. We eval-
uated the amount of genetic diversity in mtDNA in Yellowstone bison and developed a molec-
ular method to test for differentiation between the two primary breeding herds (the northern
and central herds). In addition, we assessed the overall genetic health of Yellowstone bison and
analyzed the allegedly detrimental IMOP mutations to identify potential selective differences
between bison that express IMOP mutations and bison that are wild type.
Results
Ten different haplotypes were found in the 25 modern samples from Yellowstone bison
(Table 1, Fig 1). Seven bison belonged in YNPHap1 and ten to YNPHap2. The rest of the hap-
lotypes were unique to only a single animal sequenced in this study.
Haplotype diversity among all 25 modern Yellowstone bison was calculated as 0.7800 (+/-
0.0649) with a mean difference between the haplotypes of 0.00103. The AMOVA test for popu-
lation subdivision between the northern and central herds yielded an FST value of -0.06
(p = 0.76). Arlequin is known to produce slightly negative FST values in cases where variation
within the population is larger than variation between the groups that comprise the population
[17]. In such cases, FST should be treated as zero [18,19,20]. Three of the 25 Yellowstone bison
(Templeton, 5885, 5899) were sampled after they were removed from the population at the
northern boundary of the NP, but they were not part of the telemetry study and were, there-
fore, excluded from the population subdivision analysis. bHap17 was sampled from the west
boundary capture operation which is a migration path used only by the central herd.
Table 1. Mitochondrial haplotype distribution in 25 bison associated with the northern or central
herds in Yellowstone NP.
Haplotype Northern Herd Central Herd Unknown
YNPHap1 4 3
YNPHap2 4 4 2
YNPHap3 0 1
YNPHap4 1 0
YNPHap5 1 0
YNPHap6 0 1
YNPHap7 1 0
YNPHap8 0 1
bHap17 0 1
Templeton 0 0 1
Total 11 11 3
Three samples were collected from bison near the north boundary at a capture facility, but their movement
histories are unknown.
doi:10.1371/journal.pone.0166081.t001
Mitochondrial Haplotype Diversity in Yellowstone Bison
PLOS ONE | DOI:10.1371/journal.pone.0166081 November 23, 2016 3 / 15

Fig 1. Mitochondrial haplotype distribution in Yellowstone National Park. The sampling location and haplotype identity of each
Yellowstone bison in this study based on their association with either the northern or central herds. Three additional samples (Templeton, and
two YNPHap2 bison) were collected from bison near the north boundary at a capture facility, but their movement histories are unknown, and
they were omitted from this figure.
doi:10.1371/journal.pone.0166081.g001
Mitochondrial Haplotype Diversity in Yellowstone Bison
PLOS ONE | DOI:10.1371/journal.pone.0166081 November 23, 2016 4 / 15

While bison from the northern breeding group tend to remain in the northern area for
their entire lives, bison born in central Yellowstone NP will either be year-round residents of
the central range or migrate to the northern range to spend the winter. Observations over
recent years indicate many bison from the central herd have emigrated to become residents in
northern Yellowstone NP year-round [10,21] (Table 2).
The analyses of all 65 plains and wood bison from across North America based on the com-
bined data from Douglas et al. [14] and this study revealed 30 different haplotypes with a total
of 120 polymorphic sites. Forty-six of these sites were synonymous, 37 were non-synonymous,
and 37 were polymorphic sites in tRNA- and rRNA-coding regions. The only genes with no
nucleotide differences between the 65 bison were the ND4L protein-coding gene, and the
tRNA-Val, tRNA-Gln, tRNA-Met, tRNA-Tyr, tRNA-His, tRNA-Ser, tRNA-Glu, and the
tRNA-Pro genes. The Templeton-Crandall-Singh (TCS) network tree (Fig 2 and Fig 3) identi-
fied two distinct clades of haplotypes separated by 10 polymorphisms unique to every member
of each clade. Due to the large constraint on the mitochondrial genome, non-synonymous
mutations in protein-coding genes that cause a change in the amino acid sequence are deemed
especially important. In an attempt to reduce the noise in the tree in Fig 2, and to see if the
clear divide between the two clades is still supported, a second tree only considering the 37
non-synonymous mutations was created (Fig 3). This tree disregards all nucleotide differences
in tRNA and rRNA genes, as well as all synonymous changes in the 13 protein-coding genes in
the mitochondrial genome.
Some bison that formerly represented unique haplotypes collapsed into clusters that are
compilations of haplotypes that were unique when all polymorphisms were taken into consid-
eration, but lack any non-synonymous mutations to differentiate between them. Cluster 1
includes haplotypes CCSP1, bHap13, bHap16, and wHap15; Cluster 2 includes YNPHap1,
YNPHap4, and EINP1; Cluster 3 includes EINP2, and wHap14; and Cluster 4 includes
YNPHap2, bHap2, bHap10, bHap11, and bHap17. This TCS network further supports that the
separation between the two clades is not just an artifact in the dataset (Fig 3).
Thirteen of the 25 Yellowstone bison belonging to YNPHap2, YNPHap5, YNPHap6, and
bHap17 exhibited both alleged detrimental IMOP mutations, while the other 12 bison belong-
ing to YNPHap1, YNPHap3, YNPHap4, YNPHap7, YNPHap8, and Templeton did not have
the mutations. All animals exhibited either both or neither point mutations. Clades I and II
align in such a way that all animals in Clade I that includes the indigenous Yellowstone bison
are wild type, while all animals in Clade II that include the bison introduced in 1902 have both
IMOP mutations (Fig 2).
Table 2. Mitochondrial haplotypes based on different life history strategies. Only the migration status of the 20 animals in the radio telemetry study
were known and included.
Haplotypes Year-round in central
Yellowstone NP
Winter migrant to northern from
central Yellowstone NP
Year-round in northern
Yellowstone NP
Emigrant from central to
northern Yellowstone NP
Total
YNPHap1 1 2 4 0 7
YNPHap2 3 1 1 3 8
YNPHap3 1 0 0 0 1
YNPHap4 0 0 0 1 1
YNPHap5 0 0 0 1 1
YNPHap6 0 1 0 0 1
YNPHap7 0 0 1 0 1
Total 5 4 6 5 20
doi:10.1371/journal.pone.0166081.t002
Mitochondrial Haplotype Diversity in Yellowstone Bison
PLOS ONE | DOI:10.1371/journal.pone.0166081 November 23, 2016 5 / 15

Fig 2. TCS network tree of North American bison, based on all polymorphic sites. Each dash represents one
single nucleotide difference between two neighboring haplotypes. The numbers in the parentheses after the name
of each haplotype denote the number of bison belonging to each haplotype. Roman numerals I and II represent the
two clades in this analysis. Animals with a wHap and EINP prefix denote wood bison haplotypes, while YNPHap,
Templeton, and bHap17 denote Yellowstone bison. S6 and S9 are two historic bison sampled in or near the modern
day Yellowstone National Park.
doi:10.1371/journal.pone.0166081.g002
Mitochondrial Haplotype Diversity in Yellowstone Bison
PLOS ONE | DOI:10.1371/journal.pone.0166081 November 23, 2016 6 / 15

Mitochondrial Haplotype Diversity in Yellowstone Bison
PLOS ONE | DOI:10.1371/journal.pone.0166081 November 23, 2016 7 / 15
Discussion
The analysis of the mitochondrial genome of 25 Yellowstone bison yielded ten unique haplo-
types, demonstrating high haplotype diversity in this population 0.78 (± 0.06). These haplo-
types had little differentiation between them with the overall mean difference of 0.00103,
which demonstrates the historic bottleneck and the subsequent process of increasing diversity
due to the population boom and good management practices. High diversity is associated with
greater population health and higher fitness in animals [22,23]. Similar results were found in a
woodrat population in Texas where haplotype diversity was high (0.974 overall) but nucleotide
diversity was low (0.008), suggestive of a period of low effective population size followed by
rapid expansion [24].
Using the 22 Yellowstone bison sampled for this study where sampling locations were well
documented, population subdivision was tested on a geographic scale, using the northern and
central herds as the two hypothetical populations. This study did not find any evidence of pop-
ulation subdivision between the two herds based on mitochondrial DNA. Halbert et al. [11]
found evidence for population subdivision and the existence of at least two breeding herds
within the Yellowstone bison population based on STRUCTURE analysis [25] using 43 nuclear
microsatellites, but reported similar FST values to ours (0.0321). The reason for the difference
in the findings could be due to differences in the structure and function of the genomic regions
analyzed, the differences in mutation rates, and the sensitivities of the statistical tests used.
When the 10 Yellowstone haplotypes were compared with the 20 other bison haplotypes
from across the United States and Canada, there was a clear division between Clade I and II.
The comparatively large genetic distance between the two clades– 10 single nucleotide poly-
morphisms in contrast to the smaller distance between internal nodes within each clade–
shows the signature of a major historic event that explains the separation between the two.
Clade I contains haplotypes that are more similar to the two historic bison (S6 and S9) that
lived in or near modern day Yellowstone National Park, while Clade II consists of bison that
are genetically more dissimilar to those. Clade II also includes animals that are known to have
originated from the Pablo-Allard herd, such as the samples from the National Bison Range,
Fort Niobrara National Wildlife Refuge, as well as the bison introduced to northern Yellow-
stone NP in 1902. Thus, we conclude that Clade I contains haplotypes that are more closely
associated with the indigenous bison that lived in the area for hundreds of years while Clade II
has haplotypes that resemble the bison introduced to the park from northern Montana in
1902.
Our findings indicate that no bison in Clade I have the mutations implicated in IMOPs,
while both mutations were present in all bison in Clade II. Therefore, all the introduced bison
from the Pablo-Allard herd and their descendants have these mutations. Comparing the fre-
quency of IMOPs in 1902 with current frequencies enables a comparison of Yellowstone bison
mtDNA haplotype frequencies over a span of 110 years. If these mutations truly cause a detri-
mental phenotype, as hypothesized by Pringle [15], a substantial reduction in the frequency of
haplotypes with IMOPs would be expected due to strong negative selection. In 1902, there
were a total of 10 indigenous females and 18 introduced females, while the 25 modern-day
bison sampled are split with 13 animals with IMOPs and 12 that are wild type (Table 3).
Because the descendants of the indigenous bison lacked the IMOP mutations (Clade I), and
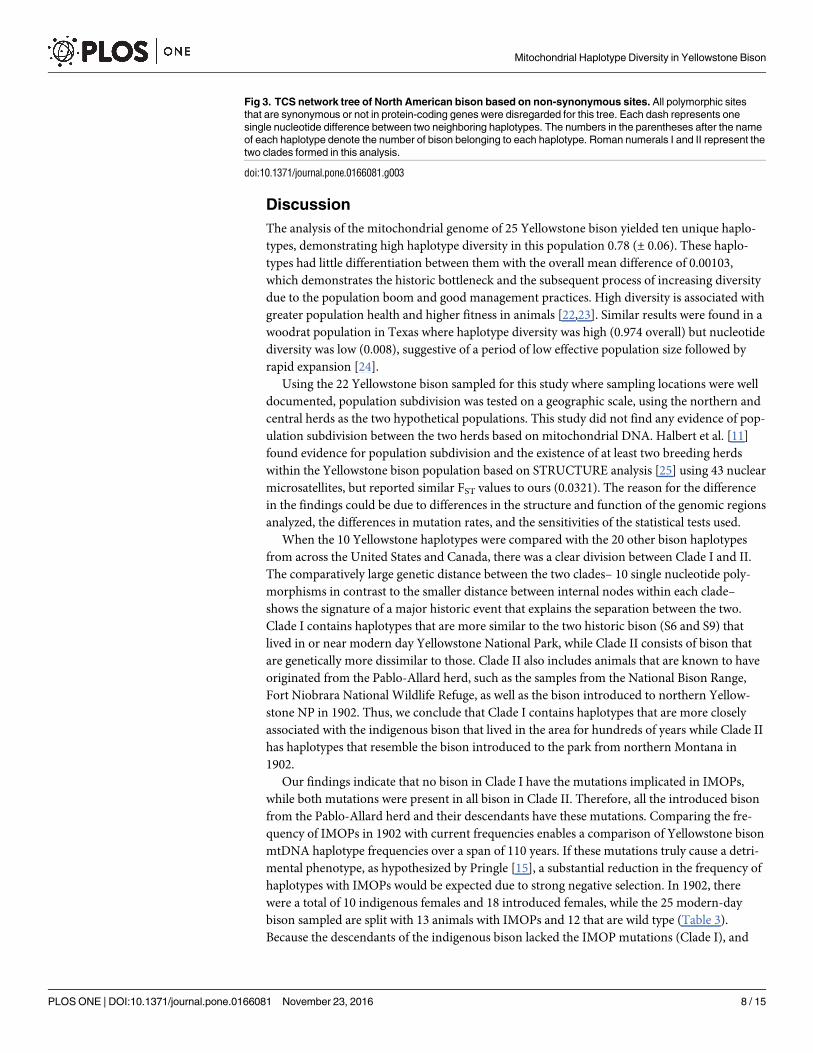
Fig 3. TCS network tree of North American bison based on non-synonymous sites. All polymorphic sites
that are synonymous or not in protein-coding genes were disregarded for this tree. Each dash represents one
single nucleotide difference between two neighboring haplotypes. The numbers in the parentheses after the name
of each haplotype denote the number of bison belonging to each haplotype. Roman numerals I and II represent the
two clades formed in this analysis.
doi:10.1371/journal.pone.0166081.g003
Mitochondrial Haplotype Diversity in Yellowstone Bison
PLOS ONE | DOI:10.1371/journal.pone.0166081 November 23, 2016 8 / 15
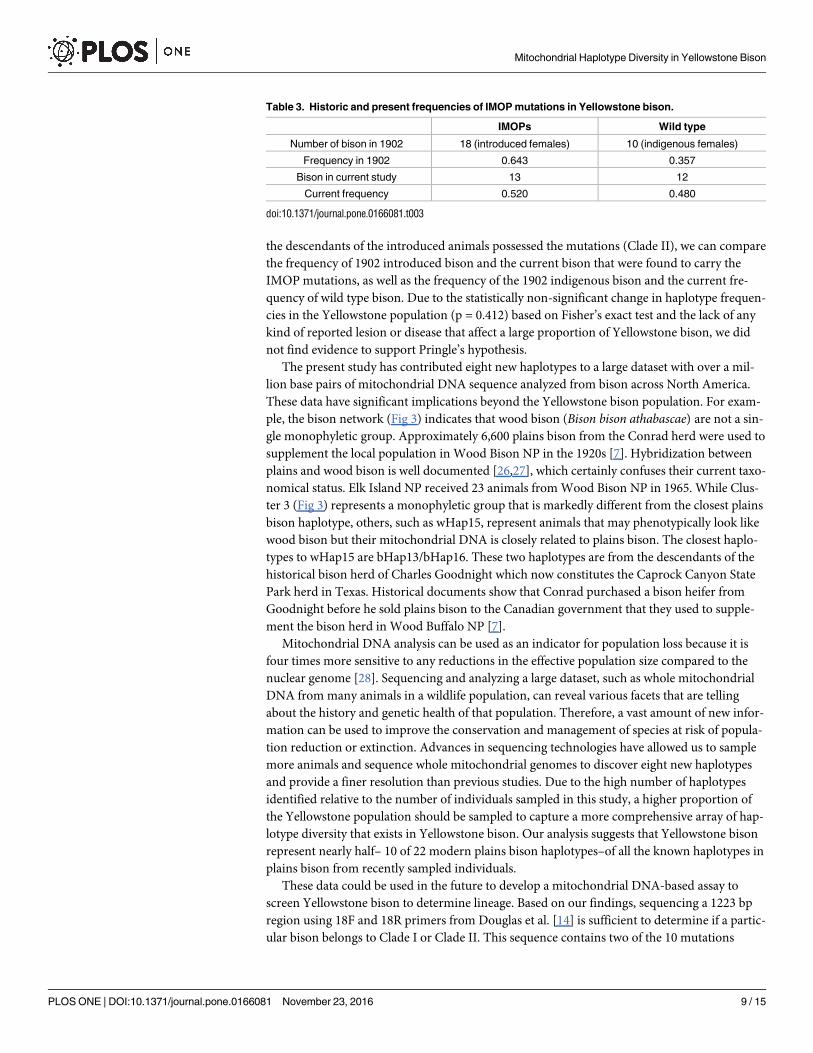
the descendants of the introduced animals possessed the mutations (Clade II), we can compare
the frequency of 1902 introduced bison and the current bison that were found to carry the
IMOP mutations, as well as the frequency of the 1902 indigenous bison and the current fre-
quency of wild type bison. Due to the statistically non-significant change in haplotype frequen-
cies in the Yellowstone population (p = 0.412) based on Fisher’s exact test and the lack of any
kind of reported lesion or disease that affect a large proportion of Yellowstone bison, we did
not find evidence to support Pringle’s hypothesis.
The present study has contributed eight new haplotypes to a large dataset with over a mil-
lion base pairs of mitochondrial DNA sequence analyzed from bison across North America.
These data have significant implications beyond the Yellowstone bison population. For exam-
ple, the bison network (Fig 3) indicates that wood bison (Bison bison athabascae) are not a sin-
gle monophyletic group. Approximately 6,600 plains bison from the Conrad herd were used to
supplement the local population in Wood Bison NP in the 1920s [7]. Hybridization between
plains and wood bison is well documented [26,27], which certainly confuses their current taxo-
nomical status. Elk Island NP received 23 animals from Wood Bison NP in 1965. While Clus-
ter 3 (Fig 3) represents a monophyletic group that is markedly different from the closest plains
bison haplotype, others, such as wHap15, represent animals that may phenotypically look like
wood bison but their mitochondrial DNA is closely related to plains bison. The closest haplo-
types to wHap15 are bHap13/bHap16. These two haplotypes are from the descendants of the
historical bison herd of Charles Goodnight which now constitutes the Caprock Canyon State
Park herd in Texas. Historical documents show that Conrad purchased a bison heifer from
Goodnight before he sold plains bison to the Canadian government that they used to supple-
ment the bison herd in Wood Buffalo NP [7].
Mitochondrial DNA analysis can be used as an indicator for population loss because it is
four times more sensitive to any reductions in the effective population size compared to the
nuclear genome [28]. Sequencing and analyzing a large dataset, such as whole mitochondrial
DNA from many animals in a wildlife population, can reveal various facets that are telling
about the history and genetic health of that population. Therefore, a vast amount of new infor-
mation can be used to improve the conservation and management of species at risk of popula-
tion reduction or extinction. Advances in sequencing technologies have allowed us to sample
more animals and sequence whole mitochondrial genomes to discover eight new haplotypes
and provide a finer resolution than previous studies. Due to the high number of haplotypes
identified relative to the number of individuals sampled in this study, a higher proportion of
the Yellowstone population should be sampled to capture a more comprehensive array of hap-
lotype diversity that exists in Yellowstone bison. Our analysis suggests that Yellowstone bison
represent nearly half– 10 of 22 modern plains bison haplotypes–of all the known haplotypes in
plains bison from recently sampled individuals.
These data could be used in the future to develop a mitochondrial DNA-based assay to
screen Yellowstone bison to determine lineage. Based on our findings, sequencing a 1223 bp
region using 18F and 18R primers from Douglas et al. [14] is sufficient to determine if a partic-
ular bison belongs to Clade I or Clade II. This sequence contains two of the 10 mutations
Table 3. Historic and present frequencies of IMOP mutations in Yellowstone bison.
IMOPs Wild type
Number of bison in 1902 18 (introduced females) 10 (indigenous females)
Frequency in 1902 0.643 0.357
Bison in current study 13 12
Current frequency 0.520 0.480
doi:10.1371/journal.pone.0166081.t003
Mitochondrial Haplotype Diversity in Yellowstone Bison
PLOS ONE | DOI:10.1371/journal.pone.0166081 November 23, 2016 9 / 15
separating the two clades which is enough to delineate whether the bison is a descendant of the
indigenous or the introduced herd. We plan on sequencing more Yellowstone bison to develop
a SNP-based assay to gain a more accurate picture of the genetic differentiation and migration
patterns.
The status of the Yellowstone bison population based on our findings of high haplotype
diversity and lack of population subdivision appears to be genetically healthy, especially for a
population with a history of intensive management that included periods of extreme reduc-
tions in size. In recent years, as the number of bison has grown exponentially and more bison
leave the park during the winter, culling of animals to control their abundance and distribu-
tion has become necessary. Our finding that there is no subdivision based on mtDNA support
that Yellowstone bison can be managed–for mitochondrial haplotype diversity–as a single
population with multiple breeding segments. Before new management standards and policies
are defined for the Yellowstone bison population, additional studies involving population
structure and genetic diversity based on both mtDNA and nuclear genetic diversity assess-
ments need to be conducted.
Methods
The U.S. National Park Service Institutional Animal Care and Use Committee has overseen
and approved the use of bison in this study.
Approximately 30 adult female bison are fitted with radio telemetry collars each year in Yel-
lowstone NP to obtain demographic and movement information [21,29]. During November
2011 to January 2012, tail hairs and blood was collected from 20 of these bison. The bison were
chemically immobilized with Carfentanil and Xylazine following standard capture procedures
periodically revised, reviewed, and endorsed by supervising veterinarians within the National
Park Service and approved by park management. The National Park Service conducts reviews
by an agency endorsed Institutional Animal Care and Use Committee which has reviewed
anesthesia procedures conducted by the Yellowstone Bison Ecology and Management Pro-
gram and has approved it as a monitoring and surveillance project. The IACUC reviews cap-
ture procedures every 3 years with the latest review completed in October of 2015. The blood
samples were spotted on Whatman FTA cards and stored at room temperature. Bison were
selected to represent four distinct survival strategies and movement patterns (Table 2), includ-
ing year-round residents in northern Yellowstone NP (n = 6), year-round residents in central
Yellowstone NP (n = 5), bison that emigrated from central to northern Yellowstone NP and
remained for breeding (n = 5), and bison that migrated from central to northern Yellowstone
NP during winter, but returned to central Yellowstone NP for breeding (n = 4).
This study focuses only on the protein-coding, tRNA and rRNA genes of the mitochondrial
genome and excludes most of the D-loop control region due to difficulties in sequencing long
mononucleotide runs and lack of known adaptive evolutionary function. mtDNA was
extracted from these Yellowstone samples (haplotype ID: YNPHap n = 20) and sequenced
with a 3130 Genetic Analyzer (Life Technologies). The mitochondrial genomes were amplified
based on the PCR protocol described in Douglas et al. [14], and assembled using NCBI Refer-
ence Sequence NC_012346.1 [30]. The sequences were compared to previously published full
mitochondrial haplotypes from Douglas et al. [14] (haplotype IDs: bHap for plains bison and
wHap for wood bison, n = 31), with the exception of bPub1 which is a zoo animal of unknown
lineage that was excluded from further analysis.
Illumina whole genome sequencing was conducted for 14 additional bison. Four of these
animals were from Caprock Canyon State Park in Texas (CCSP, 5x coverage); four were wood
bison from Elk Island NP in Canada (EINP, 5x coverage); four were additional Yellowstone
Mitochondrial Haplotype Diversity in Yellowstone Bison
PLOS ONE | DOI:10.1371/journal.pone.0166081 November 23, 2016 10 / 15

animals that were collected from bison during winter removal operations (YNP1861,
YNP5885, YNP5899, 10x coverage, and Templeton, 75x coverage); and two were historic
museum specimens (S9 and S6, 10x coverage). The coverage values represent the average
depth across the entire genome, mitochondrial reads are much more abundant due to the pres-
ence of hundreds of copies of the mitochondrial genome for each cell [31]. For modern sam-
ples used in this study, the mitochondrial coverage ranges from 86x-603x. S9 was collected
from the Lamar Valley in northern Wyoming in 1856, and S6 was collected from southern
Montana in 1886, near the northern boundary of Yellowstone NP [32] and the mitochondrial
coverage for these historical samples was approximately 58x. There is limited information
about the breeding ranges or movements of these 14 additional bison. Sequences were
trimmed using FASTQ-MCF requiring a nucleotide quality score of more than 20 for each
base and retaining only those reads that had a sequence length of more than 70 bases [33].
These filtered paired-end sequences were aligned to a previously published complete mito-
chondrial genome of a bison (YNP1586, GenBank ID: GU947004.1) using the default settings
in the Burrows-Wheeler Alignment 0.6.2 software package (BWA-MEM) [34]. The resulting
alignment files were sorted and indexed using SAMtools 0.1.18 [35]. Read group information
was added using the AddOrRelpaceReadGroups option of PicardTools 1.7.1 (https://github.
com/broadinstitute/picard/releases/tag/1.128). The Genome Analysis Toolkit 3.1.1 (GATK)
[36] option RealignerTargetCreator was used to realign the mapped reads to account for
INDEL shifted coordinates. Genetic variants, SNVs, and INDELs were identified against the
mitochondrial bison sequence for each aligned sample and were filtered according to the
GATK Best Practices recommendations [37,38]. These variants were placed into variant call
formatted (VCF) files in order to make a consensus sequence for each sample using VCFtools
package [39].
The older historic bison, S9 from the year 1856, shows increased frequency of C to T nucle-
otide substitutions, potentially due to de-amination well documented in historic samples [40]
(S1 Table). However, all of these were unique to S9 only, meaning they only affect the length
terminal node and not where the branch is located. Thus, these potentially de-aminated sites
were presented in Fig 2 as they were sequenced, the only effect being the likely over-estimated
genetic difference between S9 and the basal haplotype YNPHap1.
The notion that the sequences analyzed in this study were truly mitochondrial in origin and
not NUMTs–inactive copies of pieces of mtDNA copied into the nuclear genome–is supported
by the lack of frameshift and nonsense mutations [41] and a minimum coverage of 4x for any
given base, without any sign of heteroplasmy. The mean length of numts are 100–300 bp [41],
therefore primer sets amplifying 573–1223 bp fragments were used to avoid amplifying short
nuclear copies during Sanger sequencing. Parts of mitochondrial sequences that had several
SNPs close together in one, or a small subset of bison, have been checked using BLAST and
yielded no suspicious nuclear sequences with a high identity score [42].
All the data from the 65 animals were compiled and aligned using ClustalW in MEGA ver-
sion 6.0 [43]. The alignments were trimmed to the same length, 15,548 bp. Each polymorphic
site was characterized based on whether it represented a synonymous or non-synonymous
mutation or was in a non-coding region for further analysis (S1 Table).
Primers 18F (CTTTACCGCCATRGAACTAATCTT) and 18R (GTTCCTAAGACCAAC
GGATRA) were implemented from Douglas et al. [14] to amplify a region of the mitochon-
drial genome containing two SNPs that separate Clade I and Clade II. The two SNPs are both
G/A transitions that cause non-synonymous changes in the ND4 gene, Ile10678Met and
Ala11108Thr. Sequencing the 1223 bp region flanked by these primers can serve as a diagnos-
tic test to determine clade identity in lieu of sequencing the entire mitochondrial genome.
Mitochondrial Haplotype Diversity in Yellowstone Bison
PLOS ONE | DOI:10.1371/journal.pone.0166081 November 23, 2016 11 / 15

Haplotype diversity was calculated for the Yellowstone bison as H e ¼n
n� 1ð1 �
Xn
i¼1
pi2Þ,
where n is the number of bison and p is the frequency of each haplotype. Overall mean differ-
ence was determined by averaging the number of base substitutions per site over all sequences
using the Maximum Composite Likelihood model in MEGA version 6.0 [44]. Population sub-
division was calculated using Arlequin’s AMOVA feature to acquire the FST values based on
the presence or absence of panmixia between the northern and central breeding herds. Phylo-
genetic networks were created using alignments imported in PopART v. 1.7 (http://popart.
otago.ac.nz) and drawn as a TCS network using statistical parsimony (Fig 2 and Fig 3) [45,46].
A maximum likelihood tree with 500 bootstraps, under the model of gamma-distributed rate
heterogeneity amongst sites and a proportion of invariant sites (G+I) was also created using
MEGA version 6.0, using water buffalo (Bubalus bubalis) (GenBank ID: AY488491.1), yak (Bosgrunniens) (AY684273.2), domestic cattle (Bos taurus) (GU947021.1), and European bison
(Bison bonasus) (HQ223450.1), as the outgroups (S1 Fig).
Supporting Information
S1 Fig. Maximum likelihood tree showing all 30 bison mitochondrial haplotypes. The
branch lengths depicted are not proportional to the actual genetic distance due to the high sim-
ilarity of some neighboring haplotypes.
(TIF)
S1 Table. Polymorphic sites in the bison mitochondrial genome. A breakdown of the most
common variant of each of the 120 polymorphic sites in bison and the list of haplotypes that
differ from it. Non-synonymous mutations are in red, synonymous mutations in green and
non-coding tRNA or rRNA regions in black. The two hypothesized IMOP mutations are
highlighted in yellow.
(XLSX)
S2 Table. Sample origins and demographic information. Sample IDs and relating haplotypes
for 25 modern Yellowstone NP bison from the study.
(XLSX)
S3 Table. GenBank accession numbers for all previously unpublished haplotypes.
(XLSX)
Acknowledgments
The authors acknowledge Texas A&M Institute for Genome Sciences and Society (TIGSS) for
providing computational resources and systems administration support for the TIGSS HPC
Cluster, and the National Park Service for providing samples. A special thank you to Jennie
Lamb at Creative Technologies (Texas A&M University, College of Veterinary Medicine) for
her dedicated work on the figures, and the Yellowstone Spatial Analysis Center for providing
the map of Yellowstone National Park. The careful reviews of P.J. White, Terje Raudsepp,
Natalie Halbert, Victor Mason, Wesley Brashear, Caitlin Curry, and Courtney Caster greatly
improved this publication.
Author Contributions
Conceptualization: DF RLW LKD JND.
Data curation: DF LKD.
Mitochondrial Haplotype Diversity in Yellowstone Bison
PLOS ONE | DOI:10.1371/journal.pone.0166081 November 23, 2016 12 / 15

Formal analysis: DF LKD.
Funding acquisition: RLW JND.
Investigation: DF RLW LKD.
Methodology: DF RLW LKD JND.
Project administration: RLW JND.
Resources: RLW JND.
Software: LKD.
Supervision: RLW JND.
Validation: DF LKD JND.
Visualization: DF RLW.
Writing – original draft: DF.
Writing – review & editing: DF RLW LKD JND.
References1. Isenberg AC. The destruction of the bison: An environmental history, 1750–1920. Cambridge, (UK):
Cambridge University Press; 2000.
2. Hitchings SP, Beebee TJ. Loss of genetic diversity and fitness in common toad (Bufo bufo) populations
isolated by inimical habitat. J Evol Biol. 1998 May; 11(3):269–83.
3. Furlan E, Stoklosa J, Weeks A, Griffiths J, Gust N, Ellis R, et al. A small population size and extremely
low levels of genetic diversity in island populations of the platypus, Ornithorhynchus anatinus. Ecol
Evol. 2012 Apr; 2(4):844–57. doi: 10.1002/ece3.195 PMID: 22837830
4. Cahalane VH. Restoration of wild bison. Transactions of the North American Wildlife Conference. 1944;
9:135–143.
5. Meagher MM. The bison of Yellowstone National Park. Washington DC: Scientific Monograph Series,
National Park Service; 1973.
6. Halbert ND, Derr JN. A comprehensive evaluation of cattle introgression into US federal bison herds. J
Hered. 2007 Jan-Feb; 98(1):1–12. doi: 10.1093/jhered/esl051 PMID: 17172633
7. Coder GD. The national movement to preserve the American buffalo in the United States and Canada
between 1880 and 1920. Ph.D. Dissertation, Columbus (OH): The Ohio State University; 1975.
8. Plumb GE, White PJ, Coughenour MB, Wallen RL. Carrying capacity, migration, and dispersal in Yel-
lowstone bison. Biol Cons. 2009 Nov; 142(11):2377–87.
9. Blanton DW, White PJ, Wallen RL, Auttelet KL, Stewart AJ, Bramblett AM. The population–attributes,
behavior, distribution, resource use, and trends. In: White PJ, Wallen RL, Hallac DE. Yellowstone
bison–conserving an American icon. Yellowstone National Park: The Yellowstone Association;
2015; pp. 1–17.
10. White PJ, Wallen RL. Yellowstone bison–should we preserve artificial population substructure or rely on
ecological processes? J Hered. 2012 Sep-Oct; 103(5):751–3. doi: 10.1093/jhered/ess050 PMID:
22918900
11. Halbert ND, Gogan PJ, Hedrick PW, Wahl JM, Derr JN. Genetic population substructure in bison at Yel-
lowstone National Park. J Hered. 2012 May-June; 103(3):360–70. doi: 10.1093/jhered/esr140 PMID:
22319098
12. Ward TJ, Bielawski JP, Davis SK, Templeton JW, Derr JN. Identification of domestic cattle hybrids in
wild cattle and bison species: a general approach using mtDNA markers and the parametric bootstrap.
Anim Cons. 1999 Feb; 2(1):51–7.
13. Gardipee FM. Development of fecal DNA sampling methods to assess genetic population structure of
Greater Yellowstone bison. M.Sc. Thesis, Missoula (MT): University of Montana; 2007.
14. Douglas KC, Halbert ND, Kolenda C, Childer C, Hunter DL, Derr JN. Complete mitochondrial DNA
sequence analysis of Bison bison and bison-cattle hybrids: function and phylogeny. Mitochondrion.
2011 Jan; 11(1):166–75. doi: 10.1016/j.mito.2010.09.005 PMID: 20870040
Mitochondrial Haplotype Diversity in Yellowstone Bison
PLOS ONE | DOI:10.1371/journal.pone.0166081 November 23, 2016 13 / 15
15. Pringle TH. Widespread mitochondrial disease in North American bison. Nature Precedings. 2011 Feb;
hdl:10101/npre.2011.5645.1.
16. Li FY, Cuddon PA, Song J, Wood SL, Patterson JS, Shelton GD, et al. Canine spongiform leukoence-
phalomyelopathy is associated with a missense mutation in cytochrome b. Neurobiol Dis. 2006 Jan; 21
(1):35–42. doi: 10.1016/j.nbd.2005.06.009 PMID: 16026996
17. Excoffier L, Lischer HE. Arlequin suite ver 3.5: A new series of programs to performpopulation genetics
analyses under Linux and Windows. Mol Ecol. 2010 May; 10(3):564–7.
18. Emelianov I, Marec F, Mallet J. Genomic evidence for divergence with gene flow in host races of the
larch budmoth. Proc Biol Sci. 2004 Jan 7; 271(1534):97–105. doi: 10.1098/rspb.2003.2574 PMID:
15002777
19. Elshibli S, Korpelainen H. Microsatellite markers reveal high genetic diversity in date palm (Phoenix
dactylifera L.) gerplasm from Sudan. Genetica. 2008 Oct; 134(2):251–60. doi: 10.1007/s10709-007-
9232-8 PMID: 18046509
20. Yuan M, Wei D, Zhang K, Gao Y, Liu Y, Wang B, et al. Genetic diversity and population substructure of
Panonychus citri (Acari: Tetranychidae) in China based on mitochondrial COI gene sequences. J Econ
Entomol. 2010 Dec; 103(6):2204–13. PMID: 21309245
21. Geremia C, White PJ, Hoeting JA, Wallen RL, Watson FG, Blanton D, et al. Integrating population- and
individual-level information in a movement model of Yellowstone bison. Ecol Appl. 2014 Mar; 24
(2):346–62. PMID: 24689146
22. Lacy RC. Loss of genetic diversity from managed populations: interacting effects of drift, mutation,
immigration, selection, and population subdivision. Cons Biol. 1987 Aug; 1(2):143–58.
23. Mattila HR, Rios D, Walker-Sperling VE, Roeselers G, Newton ILG. Characterization of the active
microbiotas associated with honey bees reveals healthier and broader communities when colonies are
genetically diverse. PLoS ONE. 2012 Mar 12; 7(3): e32962. doi: 10.1371/journal.pone.0032962 PMID:
22427917
24. Mendez-Harclerode FM, Strauss RE, Fulhorst CF, Milazzo ML, Ruthven DC, Bradley RD. Molecular
evidence for high levels of intrapopulation genetic diversity in woodrats (Neotoma micropus). J Mam-
mal. 2007 Apr 1; 88(2):360–70. doi: 10.1644/05-MAMM-A-377R1.1 PMID: 19890482
25. Pritchard JK, Stephens M, Donnelly P. Inference of population structure using multilocus genotype
data. Genetics. 2000 Jun; 155(2):945–59. PMID: 10835412
26. Peden DG, Kraay GJ. Comparison of blood characteristics in plains bison, wood bison, and their
hybrids. Can J Zool. 1979 Sep; 57(9):1778–84. PMID: 120224
27. Wilson GA, Strobeck C. Genetic variation within and relatedness among wood and plains bison popula-
tions. Genome. 1999 Jun; 42(3):483–96. PMID: 10382295
28. Bolfıkova B, Hulva P. Microevolution of sympatry: landscape genetics of hedgehogs Erinaceus euro-
paeus and E. roumanicus in Central Europe. Heredity. 2012 Mar; 108(3):248–55. doi: 10.1038/hdy.
2011.67 PMID: 21863052
29. Hobbs NT, Geremia C, Treanor J, Wallen RL, White PJ, Hooten MB, et al. State-space modeling to sup-
port management of brucellosis in the Yellowstone bison population. Ecol Monogr. 2015 Nov; 85
(4):525–56.
30. Achilli A, Olivieri A, Pellecchia M, Uboldi C, Colli L, Al-Zahery N, et al. Mitochondrial genome of extinct
Aurochs survive in domestic cattle. Curr Biol. 2008 Feb 26; 18(4):R157–8. doi: 10.1016/j.cub.2008.01.
019 PMID: 18302915
31. Botero-Castro F, Tilak M, Justy F, Catzeflis F, Delsuc F, Douzery EJP. Next-generation sequencing
and phylogenetic signal of complete mitochondrial genomes for resolving the evolutionary history of
leaf-nosed bats (Phyllostomidae). Mol Phylogenet Evol. 2013 Dec; 69(3):728–39. doi: 10.1016/j.
ympev.2013.07.003 PMID: 23850499
32. Dobson LK. Sequencing the genome of the North American bison. [sequence alignment]. College Sta-
tion (TX): Texas A&M University; 2015.
33. Aronesty E. ea-utils: Command-line tools for processing biological sequencing data. Durham, NC:
Expression Analysis. 2011.
34. Li H. Aligning sequence reads, clone sequences and assembly contigs with BWA-MEM. arXiv preprint
arXiv: 2013 May 26;1303.3997.
35. Li H, Handsaker B, Wysoker A, Fennell T, Ruan J, Homer N, et al. The sequence alignment/map format
and SAMtools. Bioinformatics. 2009 Aug 15; 25(16):2078–9. doi: 10.1093/bioinformatics/btp352 PMID:
19505943
36. McKenna A, Hanna M, Banks E, Sivachenko A, Cibulskis K, Kernytsky A, et al. The Genome Analysis
Toolkit: a MapReduce framework for analyzing next-generation DNA sequencing data. Genome Res.
2010 Sep; 20(9):1297–303. doi: 10.1101/gr.107524.110 PMID: 20644199
Mitochondrial Haplotype Diversity in Yellowstone Bison
PLOS ONE | DOI:10.1371/journal.pone.0166081 November 23, 2016 14 / 15

37. DePristo MA, Banks E, Poplin R, Garimella KV, Maguire JR, Hartl C, et al. A framework for variation dis-
covery and genotyping using next-generation DNA sequencing data. Nat Genet. 2011 May; 43(5):491–
8. doi: 10.1038/ng.806 PMID: 21478889
38. Van der Auwera GA, Carneiro MO, Hartl C, Poplin R, del Angel G, Levy-Moonshine A, et al. From
FastQ data to high-confidence variant calls: the Genome Analysis Toolkit best practices pipeline. Curr
Protoc Bioinformatics. 2013 Oct 13; 11:11.10:11.10.1–11.10.33.
39. Danecek P, Auton A, Abecasis G, Albers CA, Banks E, DePristo MA, et al. The variant call formar and
VCFtools. Bioinformatics. 2011 Aug 1; 27(15):2156–8. doi: 10.1093/bioinformatics/btr330 PMID:
21653522
40. Hofreiter M, Jaenicke V, Serre D, von Haeseler A, Paabo S. DNA sequences from multiple amplifica-
tions reveal artifacts induced by cytosine deamination in ancient DNA. Nucleic Acids Res. 2001 Dec 1;
29(23)4793–9. PMID: 11726688
41. Calvignac S, Konecny L, Malard F, Douady CJ. Preventing the pollution of mitochondrial datasets with
nuclear mitochondrial paralogs (numts). Mitochondrion. 2011 Mar; 11(2):246–54. doi: 10.1016/j.mito.
2010.10.004 PMID: 21047564
42. Yao YG, Kong QP, Salas A, Bandelt HJ. Pseudomitochondrial genome haunts disease studies. J Med
Genet. 2008 Dec; 45(12):769–72. doi: 10.1136/jmg.2008.059782 PMID: 18611982
43. Tamura K, Stecher G, Peterson D, Filipski A, Kumar S. MEGA6: Molecular evolutionary genetics analy-
sis version 6.0. Mol Biol Evol. 2013 Dec; 30(12):2725–9. doi: 10.1093/molbev/mst197 PMID: 24132122
44. Tamura K, Nei M, Kumar S. Prospects for inferring very large phylogenies by using the neighbor-joining
method. Proc Natl Acad Sci USA. 2004 Jul 27; 101:11030–35. doi: 10.1073/pnas.0404206101 PMID:
15258291
45. Templeton AR, Crandall KA, Sing CF. A cladistic analysis of phenotypic associations with haplotypes
inferred from restriction endonuclease mapping and DNA sequence data. III. Cladogram estimation.
Genetics. 1992 Oct; 132(2):619–33. PMID: 1385266
46. Clement M, Posada D, Crandall KA. TCS: a computer program to estimate gene genealogies. Mol Ecol.
2000 Oct; 9(10)1657–9. PMID: 11050560
Mitochondrial Haplotype Diversity in Yellowstone Bison
PLOS ONE | DOI:10.1371/journal.pone.0166081 November 23, 2016 15 / 15