mitigating frequency fluctuations in power grids...
TRANSCRIPT

Ajinatswen Agbu Dawuda, Tsutomu Oyama and Takao Tsuji
Department of Electrical and Computer Engineering
Yokohama National University
Japan
Mitigating Frequency Fluctuations in
Power Grids with High Photovoltaic
Penetration: AGC 30 Model Case Study
7th Solar Integration Workshop
Berlin, Germany
25th October 2017
Oyama Laboratory 1
Outline Introduction
1. Introduction
2. Automatic Generation Control (AGC)
3. Delta Power Control (DPC)
4. Simulation Results
5. Conclusion
Oyama Laboratory 2

• Frequency is a function ofpower demand and supplybalance
• Stable frequency is one ofthe features of good powerquality
• Power output of renewableenergy sources such asPhotovoltaic systems (PV)are intermittent and theycause frequencyfluctuations
• Consequently, there is theneed to control thefrequencies of a PowerGrid that has highpenetration of PV
• There are differentstrategies of achieving astable or near stablefrequency in a powersystem
Introduction
Automatic Generation Control (AGC)
Delta Power Control (DPC)
Simulation Results
Conclusion
Oyama Laboratory 3
1. Introduction
This research is considering a strategy known as delta
power control

Introduction
Automatic Generation Control (AGC)
Delta Power Control (DPC)
Simulation Results
Conclusion
Oyama Laboratory 4
2. Automatic Generation Control (AGC)
AGC in an electric power system refers to a control strategy wherein all generators contribute to
regulate frequency by adjusting their respective power outputs in order to respond to changes in
load thereby overcoming power imbalance.
Demand fluctuation and frequency Control
• GFC detects frequency deviation on
site and controls within few cycles.
• LFC follows from seconds to about 20
minutes
• Larger scale of operation will utilize
EDC in order to minimize total
operating costs in an area

Introduction
Automatic Generation Control (AGC)
Delta Power Control (DPC)
Simulation Results
Conclusion
Oyama Laboratory 5
2. Automatic Generation Control (AGC)
General frequency analysis model for an interconnected power system

AGC 30
Introduction
Automatic Generation Control (AGC)
Delta Power Control (DPC)
Simulation Results
Conclusion
Oyama Laboratory 6
2. Automatic Generation
Control (AGC)
AGC 30 model is a standard analysis model of supply and demand frequency
simulation proposed by the electricity supply and demand analysis model
standardization investigation expert committee in Japan.
Diagram of AGC 30 model

DPC
Introduction
Automatic Generation Control (AGC)
Delta Power Control (DPC)
Simulation Results
Conclusion
Oyama Laboratory 7
3. Delta Power Control
(DPC)
Delta control curtails active power from PV. The concept of the DPC strategy is that the output
active power from PV systems is reduced to a certain level in case of frequency deviations. This
provides support for the grid and could also serve as power reserve. Delta power constraint can
be summarized as:
Ppv =Pavail - ∆P
∆P is the amount of active PV power curtailed during operation
PV Control Block
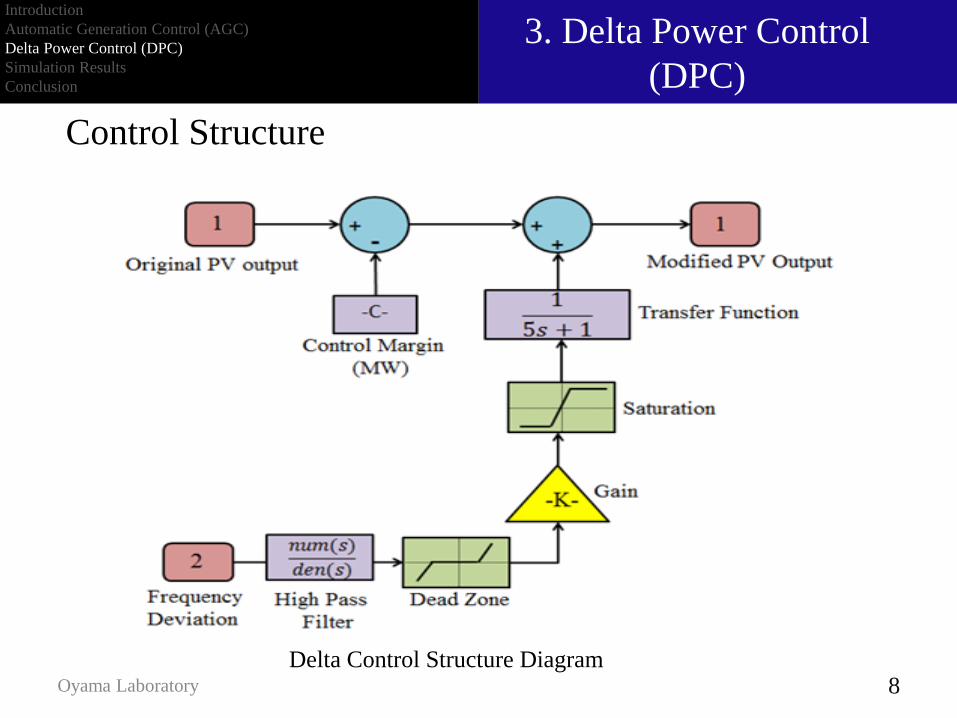
Control Structure
Introduction
Automatic Generation Control (AGC)
Delta Power Control (DPC)
Simulation Results
Conclusion
Oyama Laboratory 8
3. Delta Power Control
(DPC)
Delta Control Structure Diagram

Reference Power System
Introduction
Automatic Generation Control (AGC)
Delta Power Control (DPC)
Simulation Results
Conclusion
Oyama Laboratory 9
4. Simulation Results
Reference power system frequency fluctuations
Without PV, purely conventional generating sources: four coal-driven generators; three Liquefied
Natural Gas (LNG); and eight Combined Cycle generators.
The maximum frequency deviation of this system was 0.133 Hz on the positive side and
0.1448Hz on the negative, with an average deviation of 0.0834 Hz
Worst frequency:
Max. 0.1330
Min. -0.1448
Ave. 0.0834

Study Model
Introduction
Automatic Generation Control (AGC)
Delta Power Control (DPC)
Simulation Results
Conclusion
Oyama Laboratory10
4. Simulation Results
The system used for this study had it’s conventional generators (LNG)
capacity reduced to 2 and 3.3GW PV was introduced to the system. The
system consists of Coal generators (3.392GW), LNG generators (1.4
GW), Wind Turbines (2.3GW) and GTCC (2GW). Therefore, the total
installed capacity of this power system is 12.392GW and PV represents
26.63% of the capacity.
The simulation was done using a range of control parameters. The
control margin (Delta) was varied from 25MW to 32MW with a
combination of different gains and dead zone values.

Study Model
Introduction
Automatic Generation Control (AGC)
Delta Power Control (DPC)
Simulation Results
Conclusion
Oyama Laboratory11
4. Simulation Results
Without Control
Worst frequency:
Max. 0.13627
Min. -0.16898
Ave. 0.000489
Fre
quen
cy (
Hz)
Time (s)
Study power system frequency fluctuations (without control)

Controlled System Results
Introduction
Automatic Generation Control (AGC)
Delta Power Control (DPC)
Simulation Results
Conclusion
Oyama Laboratory 12
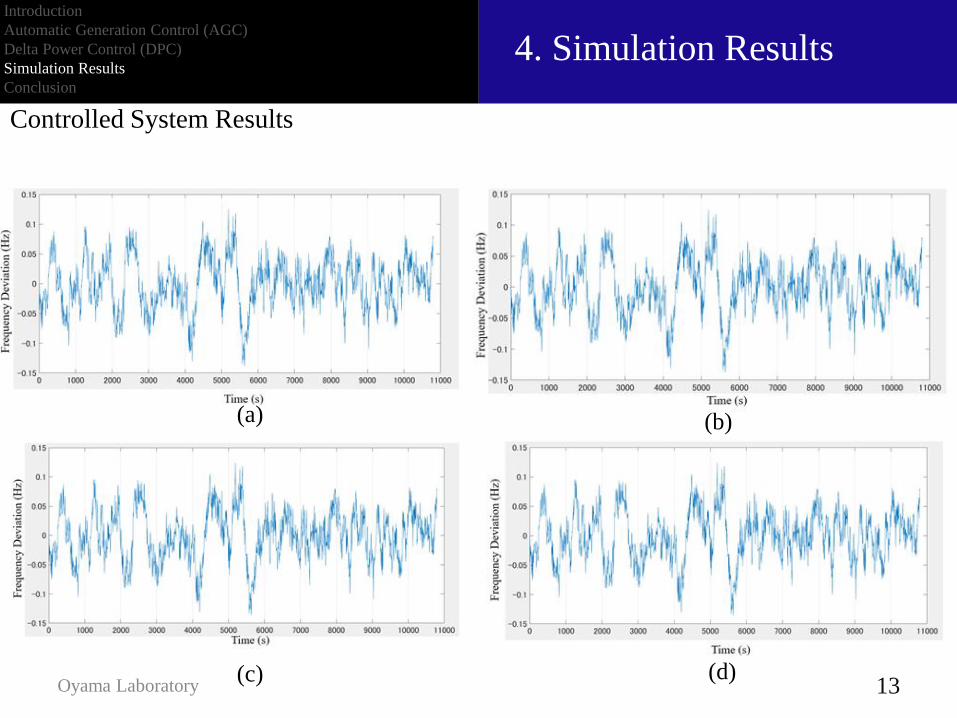
4. Simulation Results
Delta
(MW)
∆f_max
(Hz)
∆f_min
(Hz)
∆f_ave (Hz) Discarded
Energy (%)
25 0.124783 -0.13871 0.00294 2.64
26 0.124437 -0.13746 0.00295 2.78
27 0.124256 -0.13688 0.00297 2.86
28 0.124101 -0.13634 0.00300 2.95
29 0.124046 -0.13586 0.00302 3.08
30 0.124014 -0.13539 0.00303 3.19
31 0.123979 -0.13489 0.00305 3.40
32 0.123925 -0.13441 0.00308 3.40
Controlled System Results
Introduction
Automatic Generation Control (AGC)
Delta Power Control (DPC)
Simulation Results
Conclusion
Oyama Laboratory 13
4. Simulation Results
(a) (b)
(c) (d)

Controlled System Results
Introduction
Automatic Generation Control (AGC)
Delta Power Control (DPC)
Simulation Results
Conclusion
Oyama Laboratory 14
4. Simulation Results
(e) (f)
(g) (h)

Controlled System Results
Introduction
Automatic Generation Control (AGC)
Delta Power Control (DPC)
Simulation Results
Conclusion
Oyama Laboratory15
4. Simulation Results
Relationship between delta and worst frequency

Controlled System Results
Introduction
Automatic Generation Control (AGC)
Delta Power Control (DPC)
Simulation Results
Conclusion
Oyama Laboratory16
4. Simulation Results
Trade-off Relationship between delta and discarded energy

Introduction
Automatic Generation Control (AGC)
Delta Power Control (DPC)
Simulation Results
Conclusion
Oyama Laboratory 17
5. Conclusion
This paper shows a frequency control strategy utilizing delta power control which curtails active
power output from PV source in order to achieve power balance in a grid that has high
penetration of PV. AGC30 model was used for this analysis and from the results obtained, it was
demonstrated that Delta Power Control margin ranging between 25MW and 32MW can be used
to effectively mitigate the effects of frequency fluctuations in the power system that has 3.3GW
PV capacity (26.63% of the installed capacity). It is still work in progress as we seek to obtain
better values regarding frequency deviation minimization.
System ∆f_max (Hz) ∆f_min (Hz)
Reference 0.133 -0.145
Study Model Without
Control
0.136 -0.145
Study Model with
Control
0.124 -0.134

Introduction
Automatic Generation Control (AGC)
Delta Power Control (DPC)
Simulation Results
Conclusion
Oyama Laboratory 18
5. Conclusion
Thank you very much!
Danke!