miti in the news weekly bulletin/miti_weekly... · miti in the news fitch outlook ... banking...
TRANSCRIPT

MITI Weekly Bulletin / www.miti.gov.my
“DRIVING Transformation, POWERING Growth”
MITI in the NEWSFITCH Outlook Upgrade Clears Up Lingering
Misperceptions Among InvestorsThe decision by Fitch to upgrade the outlook for Malaysia from “Negative” to “Stable” is a strong endorsement of the country’s economic fundamentals and the Government’s management of the economy, Dato’ Sri Mustapa Mohamed said.
The Minister of International Trade and Industry continues, “This is also an affirmation of the Government’s prudent, proactive and pragmatic policies under the Economic Transformation Programme to re-structure and diversify the economy.”
Dato’ Sri Mustapa said Fitch’s decision was particularly welcome in helping clear up lingering misperceptions among investors and could further enhance Malaysia’s attractiveness as a preferred investment destination. “This is especially relevant at a time of uncertainty in the global economy and the on going turbulence in geopolitics,” he said.
He pointed out that even before the revised rating, Malaysia was experiencing annual double-digit growth in realised investments. Private investments in 2013 grew by 13.1% and 11% from 2013 to 2014,” he said.
Approved investments in the first quarter of 2015 stood at RM 57.4 billion. “We are striving very hard to maintain the momentum of the past two years, although the world political and economic environment will present additional challenges this year” Dato’ Sri Mustapa said. “All the investments, those approved and implemented as well as those approved but awaiting implementation represent employment opportunities for talented and hard-working Malaysians,” he said.
Dato’ Sri Mustapa stressed that Fitch’s rating comes on the heels of several other reports by independent international organisations that have seen Malaysia continue doing well as the preferred place to do business. These include rankings by IMD, World Bank and World Economic Forum.
“Investors are cognisant of these credible and influential reports. The latest Fitch rating is likely to give an added boost to our efforts in attracting the high-quality and high-value-added investments that are crucial towards achieving our aim of attaining the status of a high-income economy by 2020,” he said.
Dato’ Sri Mustapa also emphasised that Fitch’s decision and the positive reports by other international entities should not lead to any complacency, given the rising competitiveness globally. “Quite the opposite, actually. They should spur us to fix any shortcomings and enhance our efforts to promote Malaysia as a preferred place for doing business,” he said.
Source : Ministry of International Trade and Industry, 2 July 2015

MITI Weekly Bulletin / www.miti.gov.my
“DRIVING Transformation, POWERING Growth”
Government Retains AP Policy for Used CarsThe Government still retains the approved permit (AP) policy for the import of used cars, International Trade and Industry Minister Datuk Seri Mustapa Mohamed said. He said the abolishment of the policy was still being studied as it was a rather complex exercise.
“At the moment, the policy still applies. We have yet to resolve a few things,” he told reporters after the breaking of fast with students hosted by the International Trade and Industry and Ministry here yesterday.
Meanwhile, Mustapa said the Government had identified the export of vehicle components as a potential sector that could contribute to the growth of the country’s automotive industry, instead of exporting vehicles.
“As the Malaysian market is relatively mature, it is quite difficult for us to achieve a 10% growth. “We feel that there is greater potential in exporting automotive components as several Malaysian companies had already succeeded in doing that,” he said.
Two deputy international trade and industry ministers, namely Senator Datuk Lee Chee Leong and Datuk Hamim Samuri were present. At the event, Mustapa presented Aidilfitri gifts to 30 students from quran memorisation schools, Maahad Tahfiz Darul Muhibbin and Maahad Tahfiz Sains Fatimah Al Zahrah.
Source: Bernama, 6 July 2015
Monetary and Financial DevelopmentsMay 2014
Price ConditionsHeadline inflation, as measured by the annual percentage change in the Consumer Price Index (CPI), increased to 2.1% in May (April: 1.8%). However, on a month-to-month basis, the increase of 0.4% was lower than the 0.9% increase in April. During the month, the increase in the CPI also reflected high food prices due to reduced supply of fresh food items amidst the rainy season.
Monetary ConditionsInterbank rates were stable in May. In terms of retail lending rates, the average base rate (BR) of commercial banks was steady at 3.88%. Retail deposit rates were unchanged during the month. Net financing to the private sector grew by 8.3% in May, driven by higher growth of both outstanding banking system loans and net outstanding issuances of private debt securities (PDS). Outstanding business loans registered a higher annual growth rate, with a larger volume of loans disbursed mainly to the finance, insurance and business services; agriculture; real estate; and electricity, gas and water supply sectors during the month. The annual growth in outstanding household loans continued to moderate. Overall loan demand was relatively stable with sustained loan applications from both the business and household sectors. On an annual basis, broad money (M3) growth moderated to 5.7% in May. The expansion in M3 was driven mainly by the extension of credit to the private sector by the banking system. The expansion, however, was partially offset by a decline in net foreign assets following net capital outflows during the month.
Banking SystemBanking system remained well capitalised with the Common Equity Tier 1 Capital Ratio, Tier 1 Capital Ratio and Total Capital Ratio at 12.3%, 13.1% and 15.1% respectively. The level of net impaired loans was sustained at 1.2% of net loans while loan loss coverage ratio remained above 100%.
Exchange Rates and International ReservesIn May, the ringgit depreciated against the currencies of most of Malaysia’s major trade partners, driven by both external and domestic factors. During the month, most major and regional currencies also depreciated against the US dollar. This was due to a shift in expectations on the timing of US interest rate normalisation. The international reserves of Bank Negara Malaysia amounted to RM390.2 billion (equivalent to USD105.3 billion) as at 15 June 2015, sufficient to finance 8.1 months of retained imports and were 1.1 times the short-term external debt .
Source : Bank Negara Malaysia,30 June 2015

MITI Weekly Bulletin / www.miti.gov.my
“DRIVING Transformation, POWERING Growth”
MALAYSIA
May 2015 - RM60.5 billion-6.7% y-o-y growth
Jan-May 2015 - RM304.2 billion-4.7% y-o-y growth
RM54.9 billion - May 2015-7.2% y-o-y growthRM270.4 billion - Jan-May 2015
-2.8% y-o-y growth
RM5.5 billion-2.3% y-o-y growth
(May 2015)
RM33.7 billion-17.2% y-o-y growth
(Jan-May 2015)
Trade Balance
Major Exports Contributors:
E&E 35.0% (RM106.3b)
LNG7.3% (RM22.3b)
Chemical & Chemical 7.1% (RM21.7b)
Major Imports Contributors:
E&E 29.0% (RM78.3b)
Chemical & Chemical 9.6% (RM25.9b)
Petroleum 8.7% (RM23.6b)
Major Trading Partners(Jan-May 2015)
(Jan-May 2015)(Jan-May 2015)
SingaporeRM74.0b
PRCRM85.8b
JapanRM53.7b
Trade Performance64
.0
58.9
65.0
66.2
64.8
61.2
61.1
63.9
64.5
65.1
63.7
67.7
63.6
53.2
66.5
60.4
60.5
57.6
48.5
55.4
57.5
59.2
57.1
57.5
60.0
55.2
63.9
52.6
58.5
54.6
48.6
58.6
53.5
54.9
121.6
107.4
120.4 123.7 124.0118.3 118.6
123.9119.7
129.0
116.3
126.2118.3
101.8
125.1
113.9 115.4
0
20
40
60
80
100
120
140
Jan Feb Mar Apr May Jun Jul Aug Sep Oct Nov Dec Jan Feb Mar Apr May
2014 2015
RM billion
Exports Imports Total Trade
Trade Performance, January 2014 - May 2015
Source : Department of Statistics, Malaysia

MITI Weekly Bulletin / www.miti.gov.my
“DRIVING Transformation, POWERING Growth”
Trade by Region Top Five Export Destinations, January-May 2015
Top Five Import Sources,
January-May 2015
SingaporeRM42.3b, 13.9% share, -4.8% growth
PRCRM36.7b, 12.1% share, -6.1% growth
JapanRM31.8b, 10.5% share, -12.1% growth
USARM28.2b, 9.3% share, 9.1% growth
ThailandRM17.6b, 5.8% share, 5.9% growth
PRCRM49.1b, 18.2% share, 10.5% growth
SingaporeRM31.7b, 11.7% share, -12.7% growth
JapanRM21.9b, 8.1% share, -5.3% growth
USARM21.2b, 7.9% share, -0.5% growth
ThailandRM16.1b, 6.0% share, -1.7% growth
Export to these countries collectively constituted 51.5% of total Malaysia’s export
Import from these countries collectively constituted 51.8% of total Malaysia’s import
Source : Department of Statistics, Malaysia
AsiaRM424.0b
71%
EuropeRM67.5b
11%
North AmericaRM49.7b
8%
Oceania RM27.6b
5%
Latin AmericaRM13.9b
2%
AfricaRM12.2b
2%
OthersRM2.2b
1%
January-May 2014
AsiaRM407.5b
71%
EuropeRM66.8b
12%
North AmericaRM51.9b
9%
OceaniaRM23.1b
4%
AfricaRM11.8b
2%
Latin AmericaRM11.5b
2%
OthersRM1.9b
0%
January-May 2015
RM597.1 billion
RM574.4 billion
ASEANRM156.0b
(38% of Asia)
ASEANRM161.8.0b
(38% of Asia)

MITI Weekly Bulletin / www.miti.gov.my
“DRIVING Transformation, POWERING Growth”
Malaysia Oil and Gas Industry, 2013
Source : Malaysia Petroleum Resources Corporation

MITI Weekly Bulletin / www.miti.gov.my
“DRIVING Transformation, POWERING Growth”
and You’ ’ MITI’s ASEAN Portal can be accessed via http://aec2015.miti.gov.my/
Inflation RateMalaysia Singapore
Thailand
Philippines
Viet Nam
0
1
2
3
4
Jan Feb Mar Apr May Jun Jul Aug Sep Oct Nov Dec Jan Feb Mar Apr May
2014 2015
Inflation Rate (%)
-2
-1
0
1
2
Jan Feb Mar Apr May Jun Jul Aug Sep Oct Nov Dec Jan Feb Mar Apr May
2014 2015
Inflation Rate (%)
-1
0
1
2
3
4
5
6
7
Jan Feb Mar Apr May Jun Jul Aug Sep Oct Nov Dec Jan Feb Mar Apr May
2014 2015
Inflation Rate (%)
3
4
5
6
7
8
Jan Feb Mar Apr May Jun Jul Aug Sep Oct Nov Dec Jan Feb
2014 2015
Inflation Rate (%)
3
4
5
6
7
8
9
Jan Feb Mar Apr May Jun Jul Aug Sep Oct Nov Dec Jan Feb Mar Apr May
2014 2015
Inflation Rate (%)
-1
0
1
2
3
Jan Feb Mar Apr May Jun Jul Aug Sep Oct Nov Dec Jan Feb Mar Apr May
2014 2015
Inflation Rate (%)
0
1
2
3
4
5
6
Jan Feb Mar Apr May Jun Jul Aug Sep Oct Nov Dec Jan Feb Mar
2014 2015
Inflation Rate (%)
0
1
2
3
4
5
6
Jan Feb Mar Apr May Jun Jul Aug Sep Oct Nov Dec Jan Feb Mar Apr May
2014 2015
Inflation Rate (%)
1
2
3
4
5
6
Jan Feb Mar Apr May Jun Jul Aug Sep Oct Nov Dec Jan Feb Mar Apr May
2014 2015
Inflation Rate (%)
-2
-1
0
1
2
3
Jan Feb Mar Apr May Jun Jul Aug Sep Oct Nov Dec Jan Feb Mar Apr May
2014 2015
Inflation Rate (%)Indonesia
Myanmar
Lao PDR
Brunei Cambodia
Source: Tradingeconomics.com, Department of Economic Planning and Development Brunei, National Institute of Statistics Cambodia, Statistics Indonesia, Bank of The Lao PDR, Department of Statistics Malaysia, Central Statistics Organization Myanmar, National Statistics Office of Philippines, Statistics Singapore, Bureau of Trade and Economic Indices of Ministry of Finance Thailand, General Statistics Office of Viet Nam

MITI Weekly Bulletin / www.miti.gov.my
“DRIVING Transformation, POWERING Growth”
International Repor tINDIA
-30,000.0
-20,000.0
-10,000.0
0.0
10,000.0
20,000.0
30,000.0
40,000.0
50,000.0
2000 2001 2002 2003 2004 2005 2006 2007 2008 2009 2010 2011 2012 2013 2014 2015
India's Trade for January 2000 to March 2015
ExportImportTrade Balance
US$ million
0.0
20,000.0
40,000.0
60,000.0
80,000.0
100,000.0
120,000.0
140,000.0
160,000.0
2000 2001 2002 2003 2004 2005 2006 2007 2008 2009 2010 2011 2012 2013 2014
India's Trade of Crude Petroleum OilUS$ million
HS: 2709
0.0
10,000.0
20,000.0
30,000.0
40,000.0
50,000.0
60,000.0
70,000.0
80,000.0
2000 2001 2002 2003 2004 2005 2006 2007 2008 2009 2010 2011 2012 2013 2014
India's Trade of Petroleum Oil (Not Crude)US$ million
HS: 27100.0
10,000.0
20,000.0
30,000.0
40,000.0
50,000.0
60,000.0
70,000.0
2000 2001 2002 2003 2004 2005 2006 2007 2008 2009 2010 2011 2012 2013 2014
India's Trade of DiamondsUS$ million
HS: 7102
Source: World Trade Atlas

MITI Weekly Bulletin / www.miti.gov.my
“DRIVING Transformation, POWERING Growth”
Area9,104 km2
E c o n o m i c I n d i c a t o r s
Labour Force1.138 million (May-July 2015)
Unemployment Rate13.0% (May-July 2015)
Inflation Rate-0.2% (April-July 2015)
External Trade(April-July 2015)
Exports US$57.7bImports US$36.0bTrade Balance US$21.7b
Population3.548 million (2014e)
GDP Growth-0.9% (2014)
56.2
31.3
87.4
0
20
40
60
80
100
120
140
160
180
2005 2006 2007 2008 2009 2010 2011 2012 2013 2014
RM million Malaysia's Trade with Puerto Rico, 2005 to 2014
EXPORTS IMPORTS TOTAL TRADE
Source : Tradingeconomics, Wikipedia and Puerto Rico Economic Indicators
Source : Department of Statistics, Malaysia
PUERTO RICO

MITI Weekly Bulletin / www.miti.gov.my
“DRIVING Transformation, POWERING Growth”
Foreign Direct Investment (FDI) Ranking, 2014
RANKING2014 20131234567891011121314151617181920
2319674815142112101918751852211148
USA HONG KONGCHINA
UK
AUSTRALIA
RUSSIA
CANADA
FRANCE
NETHERLANDS
SINGAPORE
INDONESIA
SPAIN
BRAZIL
COLUMBIA
SWITZERLAND
MEXICO
FINLAND
CHILE
POLAND
INDIA
FDI INFLOW
USA HONG KONGCHINAJAPANGERMANYRUSSIA CANADA FRANCENETHERLANDSSINGAPOREIRELAND SPAINROKITALYNORWAY SWITZERLANDMALAYSIAKUWAITCHILE TAIWAN
RANKING2014 20131234567891011121314151617181920
15321047156121614139172522192921
FDI OUTFLOW
Source : Global Investment Trends, UNCTAD

MITI Weekly Bulletin / www.miti.gov.my
“DRIVING Transformation, POWERING Growth”
Source: Ministry of International Trade and Industry, Malaysia
Notes: The preference giving countries under the GSP scheme are Switzerland, the Russian Federation, Norway and Cambodia.
AJCEP: ASEAN-Japan Comprehensive Economic Partnership (Implemented since 1 February 2009) ACFTA: ASEAN-China Free Trade Agreement (Implemented since 1 July 2003) AKFTA: ASEAN-Korea Free Trade Agreement (Implemented since 1 July 2006)
AANZFTA: ASEAN-Australia-New Zealand Free Trade Agreement(Implemented since 1 January 2010)
AIFTA: ASEAN-India Free Trade Agreement (Implemented since 1 January 2010)
ATIGA: ASEAN Trade in Goods Agreement (Implemented since 1 May 2010)
MICECA: Malaysia-India Comprehensive Economic Cooperation Agreement (Implemented since 1 July 2011)
MNZFTA: Malaysia-New Zealand Free Trade Agreement (Implemented since 1 August 2010)MCFTA: Malaysia-Chile Free Trade Agreement (Implemented since 25 February 2012)MAFTA: Malaysia-Australia Free Trade Agreement (Implemented since 1 January 2013)
MPCEPA: Malaysia-Pakistan Closer Economic Partnership Agreement (Implemented since 1 January 2008)
MJEPA: Malaysia-Japan Economic Partnership Agreement (Implemented since 13 July 2006)
10 May 17 May 24 May 31 May 7 Jun 14 Jun 21 Jun 28 JunAANZFTA 66 78 85 86 78 77 87 85AIFTA 149 167 130 154 128 89 236 157AJCEP 97 54 81 78 58 56 76 96
0
50
100
150
200
250
RM
mill
ion
10 May 17 May 24 May 31 May 7 Jun 14 Jun 21 Jun 28 JunATIGA 793 1,004 811 1,453 918 942 802 880ACFTA 635 634 774 542 632 762 726 827AKFTA 210 1,955 431 2,433 305 91 125 149
0
500
1,000
1,500
2,000
2,500
3,000
RM
mill
ion
10 May 17 May 24 May 31 May 7 Jun 14 Jun 21 Jun 28 JunMICECA 40.91 68.16 63.69 46.88 58.06 43.12 58.12 33.25MNZFTA 0.06 0.28 0.32 0.05 0.14 0.16 0.19 0.10MCFTA 24.68 38.86 22.92 5.09 24.81 20.97 16.39 15.89MAFTA 26.38 38.37 29.92 51.69 37.80 34.62 45.01 34.61
0
10
20
30
40
50
60
70
80
RM m
illio
n
10 May 2015 17 May 2015 24 May 2015 31 May 2015 7 Jun 2015 14 Jun 2015 21 Jun 2015 28 Jun 2015
AANZFTA 689 826 978 774 841 799 836 924AIFTA 649 636 609 599 605 527 597 662AJCEP 191 210 236 187 170 196 179 169ATIGA 4,009 4,872 4,573 4,126 4,390 4,548 4,532 4,202ACFTA 1,355 1,571 1,659 1,461 1,653 1,319 1,535 1,351AKFTA 704 934 769 1,173 816 670 851 822MICECA 335 383 337 289 362 279 328 302MNZFTA 4 11 15 6 8 2 14 6MCFTA 51 63 55 43 71 75 55 48MAFTA 343 410 349 352 494 438 291 435MJEPA 797 849 930 802 844 687 839 867MPCEPA 149 115 176 207 138 137 177 167GSP 110 140 132 131 188 97 105 116
10 May 17 May 24 May 31 May 7 Jun 14 Jun 21 Jun 28 JunMJEPA 128 141 177 146 220 133 523 118MPCEPA 20 14 58 88 21 27 73 33GSP 34 25 20 19 22 16 16 15
0
100
200
300
400
500
600
RM
mill
ion
Value of Preferential Certificates of Origin
Number and Value of Preferential Certificates of Origin (PCOs)Number of Certificates (Provisional data)

MITI Weekly Bulletin / www.miti.gov.my
“DRIVING Transformation, POWERING Growth”
3.603.703.803.904.004.104.204.304.404.504.60
2.802.903.003.103.203.303.403.503.603.703.80
Jan Feb Mar Apr May Jun Jul Aug Sep Oct Nov Dec Jan Feb Mar Apr May Jun
2014 2015
1 USD = RM 1 EUR = RM
1 EUR = RM 4.19
1 USD = RM 3.74
Source : http://www.gold.org/investments/statistics/gold_price_chart/
Source : http://www.hardassetsalliance.com/charts/silver-price/usd/oz
Malaysian Ringgit Exchange Rate with US Dollar and Euro
Gold Prices, 27 February - 3 July 2015
Silver Prices, 27 February - 3 July 2015
Source : Bank Negara, Malaysia
39.0
37.6
35.5
36.0
36.5
37.0
37.5
38.0
38.5
39.0
39.5
27 F
eb
6 M
ar
13 M
ar
20 M
ar
27 M
ar
3 Ap
r
10 A
pr
17 A
pr
24 A
pr
29 A
pr
8 M
ay
15 M
ay
22 M
ay
29 M
ay
5 Ju
n
12 Ju
n
19 Ju
n
26 Ju
n
3 Ju
l
US$/Gram Gold
16.6
15.7
14.5
15.0
15.5
16.0
16.5
17.0
17.5
18.0
27 F
eb
6 M
ar
13 M
ar
20 M
ar
27 M
ar
3 Ap
r
10 A
pr
17 A
pr
24 A
pr
29 A
pr
8 M
ay
15 M
ay
22 M
ay
29 M
ay
5 Ju
n
12 Ju
n
19 Ju
n
26 Ju
n
3 Ju
l
US$/Oz Silver

MITI Weekly Bulletin / www.miti.gov.my
“DRIVING Transformation, POWERING Growth”
CommodityCrude
Petroleum (per bbl)
Crude Palm Oil (per MT)
Raw Sugar
(per MT)
Rubber SMR 20(per MT)
Cocoa SMC 2
(per MT)
Coal(per MT)
Scrap Iron HMS
(per MT)3 July 2015
(US$) 56.9 661.5 263.3 1,499.0 2,207.6 44.9 270 (high)250 (low)
% change* 4.6 0.5 3.3 3.3 1.9 0.9 3.63.8
2014i 54.6 - 107.6 823.3 352.3 1,718.3 2,615.8 59.8 370.0
2013i 88.1 - 108.6 805.5 361.6 2,390.8 1,933.1 .. 485.6
Commodity Prices
Notes: All figures have been rounded to the nearest decimal point * Refer to % change from the previous week’s price i Average price in the year except otherwise indicated n.a Not availble
Sources: Ministry of International Trade and Industry Malaysia, Malaysian Palm Oil Board, Malaysian Rubber Board, Malaysian Cocoa Board, Malaysian Iron and Steel Industry Federation, Bloomberg and Czarnikow Group.
Highest and Lowest Prices, 2014/2015
Lowest (US$ per bbl)
Highest(US$ per bbl)
Crude Petroleum (3 July 2015)
US$56.9 per bbl
201413 June 2014: 107.6
201426 Dec 2014: 54.6
201529 May 2015: 60.3
201513 Mar 2015: 44.8
Lowest (US$ per MT)
Highest(US$ per MT)
Crude Palm Oil (3 July 2015)
US$661.5 per MT
201414 Mar 2014: 982.5
201426 Dec 2014: 664.0
201516 Jan 2015: 701.0
20156 Feb 2015: 621.0
Steel Bars(per MT)
RM1,650 - RM1,750
Average Domestic Prices, 3 July 2015
Billets(per MT)
RM1,380 - RM1,430

MITI Weekly Bulletin / www.miti.gov.my
“DRIVING Transformation, POWERING Growth”
Sources: Ministry of International Trade and Industry Malaysia, Malaysian Palm Oil Board, Malaysian Rubber Board, Malaysian Cocoa Board, Malaysian Pepper Board, Malaysian Iron and Steel Industry Federation, Bloomberg and Czarnikow Group, World Bank.
Commodity Price Trends
651.5
659.5
656.5
647.0
654.0655.0
648.8
660.0
672.0
663.5
658.5
661.5
630
635
640
645
650
655
660
665
670
675
17 Apr 24 Apr 29 Apr 8 May 15 May 22 May 29 May 5 Jun 12 Jun 19 Jun 26 Jun 3 Jul
US$
/mt
Crude Palm Oil
2,042.1
2,067.5
2,045.4
2,143.9
2,109.6
2,260.7
2,186.5
2,213.8
2,143.0
2,173.62,188.9
2,250.9
2,207.6
1,900
1,950
2,000
2,050
2,100
2,150
2,200
2,250
2,300
10 Apr 17 Apr 24 Apr 29 Apr 8 May 15 May22 May29 May 5 Jun 12 Jun 19 Jun 26 Jun 3 Jul
US$
/mt
Cocoa
283.6
291.8
287.0288.8 287.5
278.3
262.3 263.4
254.3
249.8
254.8
263.3
220
230
240
250
260
270
280
290
300
17 Apr 24 Apr 29 Apr 8 May 15 May 22 May 29 May 5 Jun 12 Jun 19 Jun 26 Jun 3 Jul
US$
/mt
Raw Sugar
1,390.0
1,405.0
1,435.0
1,502.01,510.0
1,523.5
1,629.01,615.5
1,584.01,570.5
1,550.0
1,499.0
1,350
1,400
1,450
1,500
1,550
1,600
1,650
17 Apr 24 Apr 29 Apr 8 May 15 May 22 May 29 May 5 Jun 12 Jun 19 Jun 26 Jun 3 Jul
US$
/mt
Rubber SMR 20
5,740
5,779 5,843
6,245
6,469
6,515
6,864
7,822
7,707
7,967
7,894 7,806
7,507
7,286 7,267
7,853
7,148 7,063
7,383
5,000
5,500
6,000
6,500
7,000
7,500
8,000
8,500
Jan Feb Mar Apr May Jun Jul Aug Sep Oct Nov Dec Jan Feb Mar Apr May Jun Jul
2014 2015
USD
/ to
nne
Black Pepper
* until 3 July 2015
55.757.2
58.659.4 59.7 59.7
60.359.1
60.0 59.6 59.7
56.9
63.5
65.364.6
65.466.8
65.4 65.6
63.3 63.963.0 63.3
60.3
40
45
50
55
60
65
70
17 Apr 24 Apr 29 Apr 8 May 15 May 22 May 29 May 5 Jun 12 Jun 19 Jun 26 Jun 3 Jul
US$
/bbl
Crude Petroleum
Crude Petroleum (WTI)/bbl Crude Petroleum (Brent)/bbl

MITI Weekly Bulletin / www.miti.gov.my
“DRIVING Transformation, POWERING Growth”
Sources: Ministry of International Trade and Industry Malaysia, Malaysian Palm Oil Board, Malaysian Rubber Board, Malaysian Cocoa Board, Malaysian Pepper Board, Malaysian Iron and Steel Industry Federation, Bloomberg and Czarnikow Group, World Bank.
Commodity Price Trends
1,727
1,695 1,705
1,811
1,751
1,839
1,948
2,030
1,990
1,946
2,056
1,909
1,815
1,818
1,774
1,819
1,804
1,688
1,500
1,600
1,700
1,800
1,900
2,000
2,100
Jan Feb Mar Apr May Jun Jul Aug Sep Oct Nov Dec Jan Feb Mar Apr May Jun
2014 2015
US$
/ to
nne
Aluminium
14,101 14,204
15,678
17,374
19,401
18,629
19,118
18,600 18,035
15,812 15,807
15,962
14,849 14,574
13,756
12,831
13,511
12,825
12,000
13,000
14,000
15,000
16,000
17,000
18,000
19,000
20,000
Jan Feb Mar Apr May Jun Jul Aug Sep Oct Nov Dec Jan Feb Mar Apr May Jun
2014 2015
US$
/ to
nne
Nickel
270.0 270.0 270.0 270.0 270.0 270.0 270.0 270.0
280.0 280.0 280.0
270.0
250.0 250.0 250.0 250.0 250.0 250.0 250.0 250.0
260.0 260.0 260.0
250.0
200
220
240
260
280
300
320
340
20 Mar 27 Mar 3 Apr 10 Apr 17 Apr 24 Apr 8 May 15 May 29 May 5 Jun 19 Jun 3 Jul
US$
/mt
Scrap Iron
Scrap Iron/MT (High)
Scrap Iron/MT(Low)
7,291
7,149
6,650 6,674
6,891
6,821
7,113
7,002
6,872
6,737
6,713
6,446
5,831
5,729
5,940 6,042
6,295
5,833
5,500
5,700
5,900
6,100
6,300
6,500
6,700
6,900
7,100
7,300
7,500
Jan Feb Mar Apr May Jun Jul Aug Sep Oct Nov Dec Jan Feb Mar Apr May Jun
2014 2015
US$
/ to
nne
Copper
55.254.4
53.3
52.0 51.8 51.6
50.3
49.1 48.8
46.2
45.344.9
40.0
42.0
44.0
46.0
48.0
50.0
52.0
54.0
56.0
17 Apr 24 Apr 29 Apr 8 May 15 May 22 May 29 May 5 Jun 12 Jun 19 Jun 26 Jun 3 Jul
US$
/mt
Coal
128.1
121.4
111.8
114.6
100.6
92.7
96.192.6
82.4
81.0
74.0
68.0
68.063.0
58.0
52.0
60.063.0
40.0
50.0
60.0
70.0
80.0
90.0
100.0
110.0
120.0
130.0
140.0
Jan Feb Mar Apr May Jun Jul Aug Sep Oct Nov Dec Jan Feb Mar Apr May Jun
2014 2015
US$
/dm
tu
Iron Ore

MITI Weekly Bulletin / www.miti.gov.my
“DRIVING Transformation, POWERING Growth”
AIM-Global Engineering Sdn Bhd was incorporated on 12th October 2002 and is based in Kuala Terengganu. We own operate and charter vessels to provide support for exploration, development and production activities for the offshore oil & gas industry.
A I M S - G O L B A L E N G I N E E R I N G S D N B H D
Contact US: AIMS-GLOBAL ENGINEERING SDN. BHD. (595546-H)No 20 & 21, Blok B, Bestari Centre, Jalan Hiliran, 20300 Kuala Terengganu, Terengganu, Malaysia.Telephone: +609 – 622 8848, Fax : +609 – 623 8848Website: www.aimsglobal.com.myEmail: [email protected]
St o r y ucceSS
Clients: • Sapurakencana Allied Marine Sdn. Bhd• Petronas Carigali Sdn. Bhd.
Projects Name & Work Scope Summary:• Provision of supply vessel for PCSB
Clients: • Allied Marine Equipment Sdn. Bhd.• Petronas Carigali Sdn. Bhd.
Projects Name & Work Scope Summary:• Provision of supply vessel for SKO KASS
SAPL
Clients: • Ace Marine Services Sdn. Bhd.• Hess Exploration & Production Malaysia
B.V
Projects Name & Work Scope Summary:• Provision of two(2) utility vessel as a chase
boat for PGS APOLLO
Clients: • Malaysia Engineering & Oilfield Services
Sdn. Bhd.• Petronas Carigali Sdn. Bhd.
Projects Name & Work Scope Summary:• Provision of accomodation vessel as
replacement Duyong 1
Clients: • Dayang Enterprise Sdn. Bhd.• Petronas Carigali Sdn. Bhd.
Projects Name & Work Scope Summary:• Provision of hook-up & commissioning
of topside for tangga barat cluster development phase I
Key Clients & Projects:

MITI Weekly Bulletin / www.miti.gov.my
“DRIVING Transformation, POWERING Growth”
MITI ProgrammeMajlis Berbuka Puasa Bersama YB Menteri, 6 Julai 2015
MITI Weekly Bulletin / www.miti.gov.my
“DRIVING Transformation, POWERING Growth”
Announcement
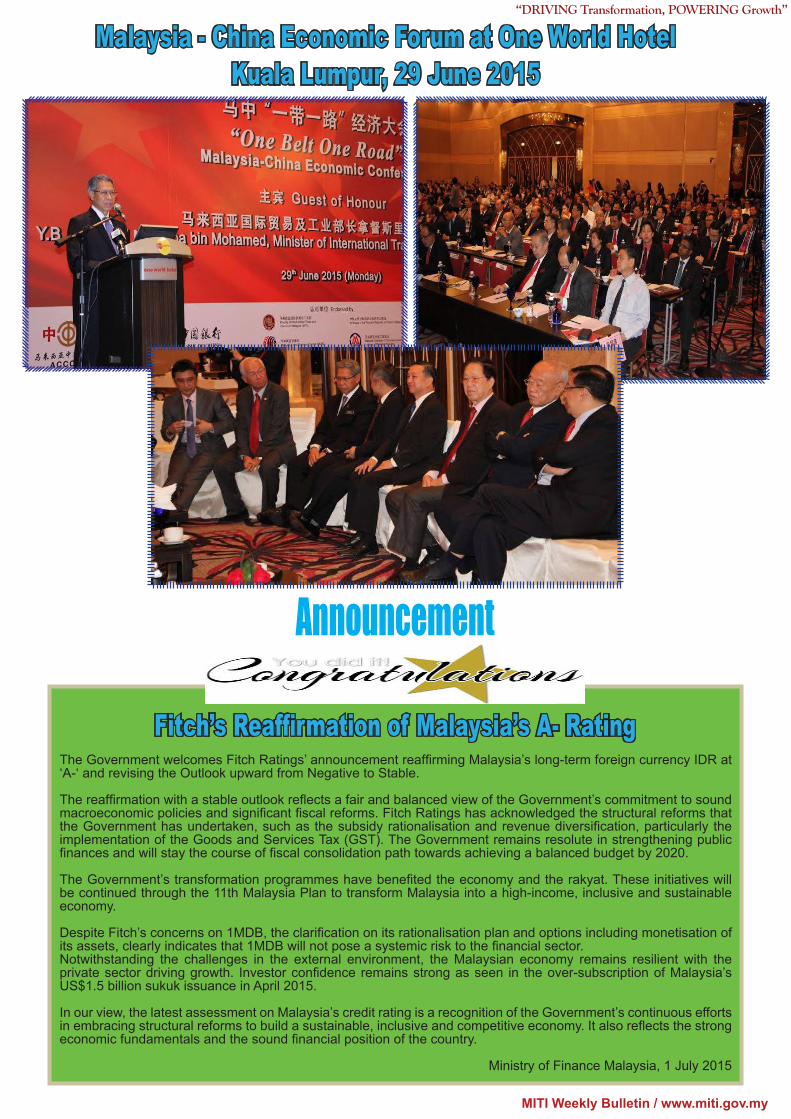
The Government welcomes Fitch Ratings’ announcement reaffirming Malaysia’s long-term foreign currency IDR at ‘A-‘ and revising the Outlook upward from Negative to Stable.
The reaffirmation with a stable outlook reflects a fair and balanced view of the Government’s commitment to sound macroeconomic policies and significant fiscal reforms. Fitch Ratings has acknowledged the structural reforms that the Government has undertaken, such as the subsidy rationalisation and revenue diversification, particularly the implementation of the Goods and Services Tax (GST). The Government remains resolute in strengthening public finances and will stay the course of fiscal consolidation path towards achieving a balanced budget by 2020.
The Government’s transformation programmes have benefited the economy and the rakyat. These initiatives will be continued through the 11th Malaysia Plan to transform Malaysia into a high-income, inclusive and sustainable economy.
Despite Fitch’s concerns on 1MDB, the clarification on its rationalisation plan and options including monetisation of its assets, clearly indicates that 1MDB will not pose a systemic risk to the financial sector. Notwithstanding the challenges in the external environment, the Malaysian economy remains resilient with the private sector driving growth. Investor confidence remains strong as seen in the over-subscription of Malaysia’s US$1.5 billion sukuk issuance in April 2015.
In our view, the latest assessment on Malaysia’s credit rating is a recognition of the Government’s continuous efforts in embracing structural reforms to build a sustainable, inclusive and competitive economy. It also reflects the strong economic fundamentals and the sound financial position of the country.
Ministry of Finance Malaysia, 1 July 2015
Fitch’s Reaffirmation of Malaysia’s A- Rating
Malaysia - China Economic Forum at One World Hotel Kuala Lumpur, 29 June 2015

MITI Weekly Bulletin / www.miti.gov.my
“DRIVING Transformation, POWERING Growth”
PhilippinesH.E. Gregory L. DomingoSecretary of Trade and Industry
MyanmarH.E. Dr. Kan ZawUnion Minister of National Planning & Economic Development
SingaporeH.E. Lim Hng KiangMinister of Trade and Industry
ThailandH.E. General Chatchai SarikalyaMinister of Commerce
Viet NamH.E. Dr. Vu Huy HoangMinister of Industry and Trade
ASEAN SecretariatH.E. Le Luong MinhSecretary General
AustraliaThe Honorable Andrew Robb Ao MP
ChinaH.E. Gao HuchengMinister of Commerce
IndiaH.E. Nirmala SitharamanMinister of State (Independent Charge) for Commerce and Industry (Independent Charge)
JapanH.E. Yoichi MiyazawaMinister of Economy, Trade and Industry Japan
KoreaH.E. Yoon Sang-JickMinister of Trade, Industry and Energy
New ZealandThe Honorable Tim GrosserMinister of Trade
Regional Comprehensive Economic Partnership (RCEP), 12 - 13 July 2015 at Renaissance Hotel Kuala Lumpur
List of Ministers Attending RCEP Meeting:
MalaysiaH.E Dato’ Sri Mustapa MohamadMinister of International Trade and Industry
BruneiH.E. Pehin Dato Lim Jock SengSecond Minister of Foreign Affairs and Trade
CambodiaH.E. Sun ChantholSenior Minister and Minister of Commerce
IndonesiaH.E. Rahmat GobelMinister of Trade
Lao PDRH.E. Khemmani PholsenaMinister of Industry and Commerce
Penang UNESCO World Herritage Day 7 July 2015

MITI Weekly Bulletin / www.miti.gov.my
“DRIVING Transformation, POWERING Growth”
http://www.miti.gov.my/index.php/forms/form/13
Comments & SuggestionsDear Readers,Kindly click the link below for any comments in this issue. MWB reserves the right to edit and to republish letters as reprints.
Name : Fazilah HamidDesignation : Assistant AccountantJob Description : Consulting & monitoring - Managing advisory accounting and financial management.Division : AccountsContact No : 603-6200 0079Email : [email protected]
Name : Nor Salina SharuddinDesignation : Assistant AccountantJob Description : Financial Accounting - Managing processing fees and asset accounting.Division : AccountsContact No : 603-6200 0079Email : [email protected]
R E M E M B R A N C E
May their souls rest in peace...