mistm presentation at aera - maine.gov
TRANSCRIPT

1
Maine’s Impact Study of Technology in Mathematics (MISTM)
David L. Silvernail, Director Maine Education Policy Research Institute University of Southern Maine Gorham Maine 04038
Funded by the U.S. Department of Education Office of elementary Secondary Education School support and Technology Program (#5318A03005)
March 2008

2
Maine’s Challenge 79% of eighth grade students failed to meet state
mathematic learning standards in 2002. 85% of low performing schools in mathematics are
in rural communities. Over 50% of middle school teachers had limited
mathematics content knowledge because they were trained as elementary school teachers.
Only 61% of seventh and eighth grade mathematics teachers report using laptops in their instruction.

Maine Learning Technology Initiative The Maine Learning Technology Initiative (MLTI) has provided all 7th and 8th grade students and their teachers with laptop computers, and provided schools and teachers technical assistance and professional development for integrating laptop technology into their curriculum and instruction.
3

4
Research Question
Can middle school mathematics test scores be improved by providing high quality, technology-infused professional development to middle school mathematics teachers in rural districts?

5
Maine’s Impact Study of Technology in Mathematics (MISTM)
Partners: • Maine Department of Education • Maine Education Policy Research Institute • Education Development Center
Grant Funded by the U.S. Department of Education • Office of Elementary and Secondary Education • School Support and Technology Program • (#5318A030005)

6
Randomized Control Group Design
Experimental Group
Control Group
Receive Professional Development
Receive No PD
Impact on Student
Mathematics Performance
Qualifying Rural
Schools
7
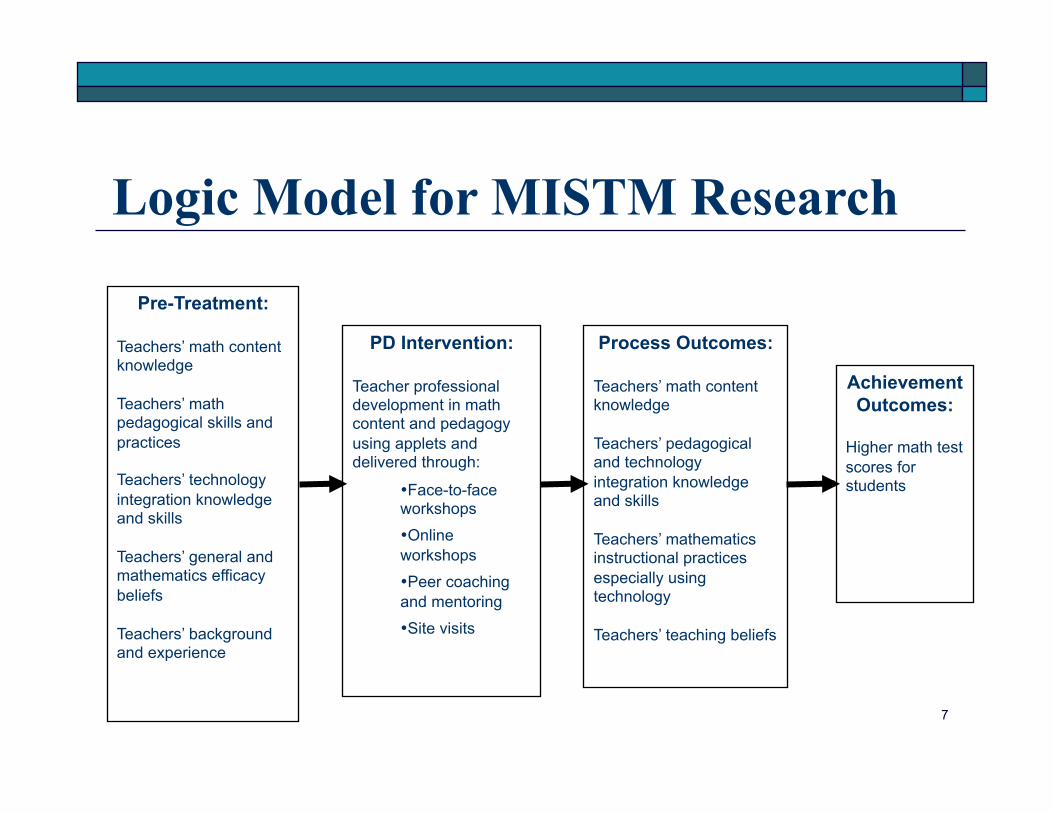
Logic Model for MISTM Research
Pre-Treatment:
Teachers’ math content knowledge
Teachers’ math pedagogical skills and practices
Teachers’ technology integration knowledge and skills
Teachers’ general and mathematics efficacy beliefs
Teachers’ background and experience
PD Intervention:
Teacher professional development in math content and pedagogy using applets and delivered through:
• Face-to-face workshops
• Online workshops
• Peer coaching and mentoring
• Site visits
Process Outcomes:
Teachers’ math content knowledge
Teachers’ pedagogical and technology integration knowledge and skills
Teachers’ mathematics instructional practices especially using technology
Teachers’ teaching beliefs
Achievement Outcomes:
Higher math test scores for students

8
Sample Participation Criteria: To qualify schools must have
• Served rural communities • Contained 7th and 8th graders in same building • Scored below state average in mathematics on state test for most recent 2 years • At least 40% of students eligible for free or reduced lunch programs
191 Schools qualified: 56 schools volunteered • 57 experimental and 54 control teachers • Approx. 2,600 students in each group
All grade 7 and 8 teacher who taught mathematics in the school had to agree to participate : • Participate in PD if assigned to experimental group • Complete all data collection activities

Mathematics Content Knowledge and Skills Target Areas of Maine Learning Results A1 – Numbers and Operations, which includes Numbers
and Number Sense, and Computation.
G1/K2 – Patterns, which includes patterns, relations & functions, algebra concepts, and mathematical communication.
9

10
Professional Development Intervention Content Knowledge
• Deepen teacher content knowledge Pedagogy
• Improve teacher pedagogical practice in technology infused mathematics classrooms
Technology Integration • Develop and apply strategies that support the integration of technology for the
teaching, learning and assessment of mathematics Professional Learning Community
• Engage teachers in meaningful interaction and dialogue about mathematics through face-to-face and online environments
A multi-faceted two-year program which included: • Face-to-Face Activities (60 hours) • Online Learning Component (100 hours) • Peer Coaching/Staff Mentoring/Site Visits (48 hours) • 208 hours total over two years

11
Student & Teacher Assessment Measures Assessment Development Teacher and student assessments used in MISTM were developed by
mathematics specialists at the Maine Department of Education and researchers at the Education Development Center. Three different versions of each test were developed, field tested and
analyzed for validity and reliability characteristics Test items checked for difficulty, discrimination and bias
Teacher Assessments Teachers were provided with examples of student work and asked to
indicated what, if anything, was wrong with the students’ thinking or understanding of the problem.

12
Analysis Procedures – Three Phases
Standard analysis of variance techniques to examine total group post test performance.
Hierarchical linear modeling (HLM) to model differences in achievement between the experimental and control groups.
Path analysis to examine the impacts of the intervention on teachers’ knowledge, beliefs and practices and student achievement.
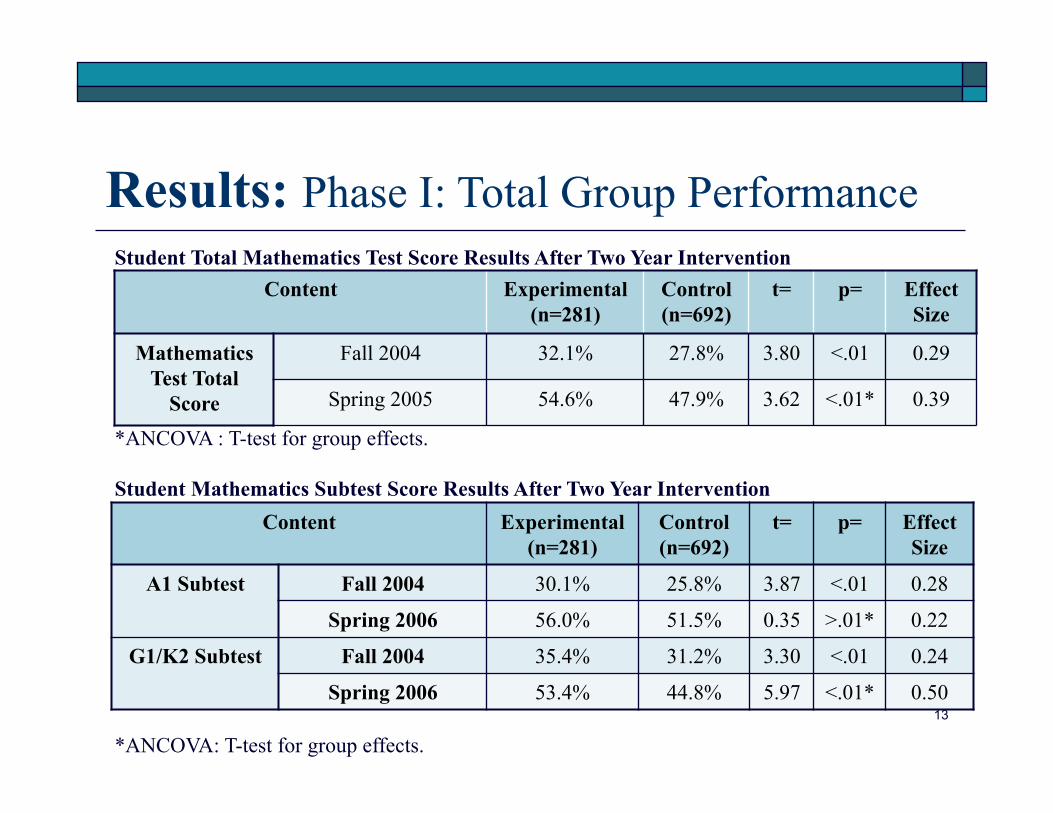
Results: Phase I: Total Group Performance Student Total Mathematics Test Score Results After Two Year Intervention
*ANCOVA : T-test for group effects.
Student Mathematics Subtest Score Results After Two Year Intervention
*
*ANCOVA: T-test for group effects. 13
Content Experimental (n=281)
Control (n=692)
t= p= Effect Size
Mathematics Test Total
Score
Fall 2004 32.1% 27.8% 3.80 <.01 0.29
Spring 2005 54.6% 47.9% 3.62 <.01* 0.39
Content Experimental (n=281)
Control (n=692)
t= p= Effect Size
A1 Subtest Fall 2004 30.1% 25.8% 3.87 <.01 0.28
Spring 2006 56.0% 51.5% 0.35 >.01* 0.22
G1/K2 Subtest Fall 2004 35.4% 31.2% 3.30 <.01 0.24
Spring 2006 53.4% 44.8% 5.97 <.01* 0.50
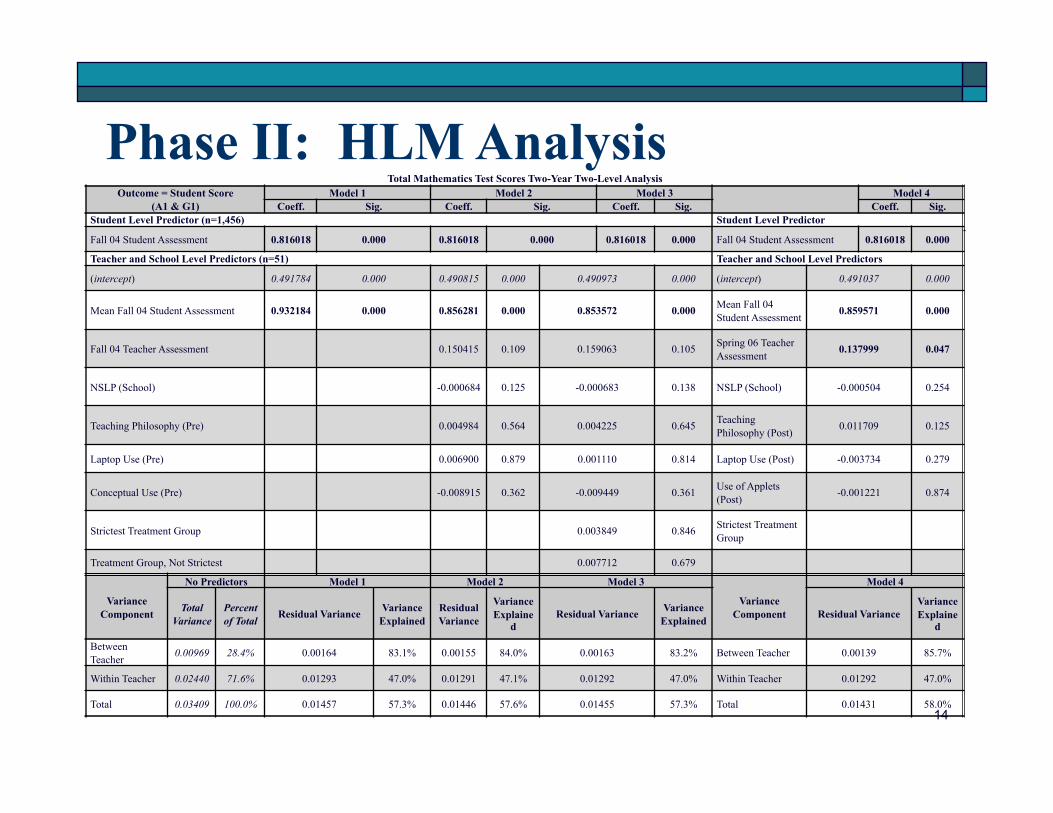
Phase II: HLM Analysis
14
Total Mathematics Test Scores Two-Year Two-Level Analysis Outcome = Student Score
(A1 & G1) Model 1 Model 2 Model 3 Model 4
Coeff. Sig. Coeff. Sig. Coeff. Sig. Coeff. Sig. Student Level Predictor (n=1,456) Student Level Predictor
Fall 04 Student Assessment 0.816018 0.000 0.816018 0.000 0.816018 0.000 Fall 04 Student Assessment 0.816018 0.000
Teacher and School Level Predictors (n=51) Teacher and School Level Predictors
(intercept) 0.491784 0.000 0.490815 0.000 0.490973 0.000 (intercept) 0.491037 0.000
Mean Fall 04 Student Assessment 0.932184 0.000 0.856281 0.000 0.853572 0.000 Mean Fall 04 Student Assessment 0.859571 0.000
Fall 04 Teacher Assessment 0.150415 0.109 0.159063 0.105 Spring 06 Teacher Assessment 0.137999 0.047
NSLP (School) -0.000684 0.125 -0.000683 0.138 NSLP (School) -0.000504 0.254
Teaching Philosophy (Pre) 0.004984 0.564 0.004225 0.645 Teaching Philosophy (Post) 0.011709 0.125
Laptop Use (Pre) 0.006900 0.879 0.001110 0.814 Laptop Use (Post) -0.003734 0.279
Conceptual Use (Pre) -0.008915 0.362 -0.009449 0.361 Use of Applets (Post) -0.001221 0.874
Strictest Treatment Group 0.003849 0.846 Strictest Treatment Group
Treatment Group, Not Strictest 0.007712 0.679
Variance Component
No Predictors Model 1 Model 2 Model 3
Variance Component
Model 4
Total Variance
Percent of Total Residual Variance Variance
Explained Residual Variance
Variance Explaine
d Residual Variance Variance
Explained Residual Variance Variance Explaine
d
Between Teacher 0.00969 28.4% 0.00164 83.1% 0.00155 84.0% 0.00163 83.2% Between Teacher 0.00139 85.7%
Within Teacher 0.02440 71.6% 0.01293 47.0% 0.01291 47.1% 0.01292 47.0% Within Teacher 0.01292 47.0%
Total 0.03409 100.0% 0.01457 57.3% 0.01446 57.6% 0.01455 57.3% Total 0.01431 58.0%

Phase III: Causal Modeling
15
Path Diagram for G1/K2 Subtest Scores Free/Reduced Lunch
Percentage Mean Student G1 Post-Test Mean Student
G1 Pre-Test
Teaching Philosophy (Post)
Teacher G1 Post-Test Teacher G1
Pre-Test FSS PD Group
PD Group
.676 .192 .508
-.045 -.165
-.177 .267
-.141
Classroom Laptop Use (Pre) Classroom Laptop
Use (Post) .239 .490
.289
.506
.193 .177
Teaching Philosophy (Pre)
.594

16
Results Summary Research Question: Can middle school
mathematics test scores be improved by providing high quality, technology-infused professional development to middle school mathematics teachers in rural districts?
Answer: Qualified “yes”

17
Results Summary When teachers actively participated in the PD
intervention activities for two years, their content knowledge increased as did their use of laptops in teaching mathematics. But that did not consistently translate into increased student learning.
Student knowledge of mathematics patterns and relationships did increase (G1/K2), but knowledge of numbers and operations (A1) did not.

18
Why didn’t we see more dramatic results?
Possible Reasons:
Substantial treatment non-compliance
Timing issues between instruction received by students and assessments completed
A1 taught primarily in 7th grade and G1/K2 in 8th
Length of study (not long enough to measure impact on student learning)

Implementation of the RCT Design Some of the Challenges of Conducting Scientifically Based Experimental Field Trials: Potential Impacts on Design and Results:
Sample: Selection and assignment. Losses in longitudinal sample.
Intervention: Varying levels of commitment. Implementations in varying settings.
Data Collection: Reliance on self-reporting data. Loss or incomplete data points.
Analysis: Unit of analysis.
19

20
Summary Observation: Balancing Classic Experimental Design with the Realities of Schools
“Can high-quality research take place in schools? Absolutely. Can such research inform best practices and guide educational policy? Certainly. Can this research, in all cases, reflect the types of medical models that inform the new federal guidelines for educational inquiry? Probably not.”
Overbay, A.S., Grable, L.L., Vasra, E.S. (2006). “Evidence-based education: Postcards from the edge.” Journal of Technology and Teacher Education, 14(3), 623-632.

21
For Additional Information
Website: www.cepare.usm.maine.edu/mistm E-mail:
• David L. Silvernail, Maine Education Policy Research Institute [email protected]