missouri gaming · pdf filemissouri gaming commission ... introduction ... an entrepreneur by...
TRANSCRIPT

Floyd O. Bartch Chair
Judith (Judy) Sutter-Hinrichs Vice-Chair
Ralph Biele Commissioner
Darryl T. Jones Commissioner
Noel J. Shull Commissioner
Missouri Gaming CommissionAnnual Report to The General Assembly
Fiscal Year 2005

MISSION STATEMENTof the
To serve the citizens of Missouri by ensuring the integrity of charitable and commercial gaming and
by optimizing its social and economic impact on the state.
Photographs on cover taken by Missouri Gaming Commission staff


111
Table of ContentsMissouri Gaming Commission Mission Statement ............................................................ inside coverThe Commissioners ..................................................................................................................... 2Message from the Chairman ..................................................................................................... 4Section 313.837 Report on Competitiveness .......................................................................... 7 Introduction .................................................................................................................................. 7 Competitive Impact of the $500 Loss Limit ............................................................................ 7 Competitive Impact of Missouri’s Gaming Tax Rate ............................................................. 7 Summary ........................................................................................................................................ 9Staff Report ..................................................................................................................................... 10 Executive Director........................................................................................................................ 10 Enforcement .................................................................................................................................. 11 Administration .............................................................................................................................. 15 Information Technology ............................................................................................................. 18 Legal ................................................................................................................................................ 19 Corporate Securities and Finance .............................................................................................. 19 Missouri Gaming Commission Organizational Chart ............................................................ 21Gaming Market Report ............................................................................................................... 22 Introduction .................................................................................................................................. 22 Statewide Market ........................................................................................................................... 23 Kansas City Market ...................................................................................................................... 25 St. Louis Market ............................................................................................................................ 26 Other Markets ............................................................................................................................... 27Licensed Casino Locations ........................................................................................................ 28Charitable Gaming ........................................................................................................................ 29Problem Gambling ....................................................................................................................... 32Fiscal Year 2005 Report Appendices ....................................................................................... 37

22
The CommissionersChief Floyd Bartch (Retired), Chair
Chief Floyd Bartch retired from the Kansas City, Missouri police department on April 2, 1999. After retirement, Chief Bartch served and continues to serve on various committees and boards concerning public issues in the Kansas City Metropolitan area. During his 31-year career with the police department, Chief Bartch was involved in the development of many programs. However, his experience in criminal justice and fi nancial matters and as a lobbyist for the police department should assist him with gaming issues in the State of Missouri.
Judy Hinrichs recently retired after a career that included public relations, marketing and not-for-profi t management. Ms. Hinrichs has considerable volunteer experience as a community activist in civic, health, social service and cultural organizations. She serves as a board member of the St. Mary’s Hospital Foundation of East St. Louis, Illinois and as a national board member of the Business and Professional Women’s Foundation. She has served as President of the St. Louis Zoo Friends Association and the Asthma and Allergy Association. She has been an executive board member of the Missouri Environmental Improvement Energy Resources Authority (EIERA), Missouri Goodwill Industries, Leadership St. Louis, Life Crisis and the St. Louis Junior League as well as board member of many other organizations. As a member of the RCGA Public Policy Council and the RCGA Illinois Public Policy Council, Ms. Hinrichs remains committed to the improvement and growth of downtown St. Louis and the St. Louis region. She and her husband, Rich Meckfessel, live in St. Louis County.
Judith (Judy) Sutter-Hinrichs, Vice-Chair
Ralph BieleRalph Biele retired from the Missouri State Highway Patrol in 1996. At the time of his retirement, he served as the assistant superintendent of the Patrol. From 1996-2000, Mr. Biele served on the staff of the Missouri Gaming Commission as the Department Director responsible for overseeing all of its enforcement activities. He is very active in the community and is a member of several civic and charitable organizations. He is a member of the Missouri Boy’s State Board of Directors and currently serves on the Executive Committee as their treasurer. He was recently inducted into the Missouri Boy’s State Hall of Fame. Mr. Biele has also been active in Missouri Special Olympics for many years and is currently on the Board of Directors, having served as the Board Chairman from 1991-1993. His law enforcement background, coupled with his gaming enforcement experience, should assist him in his duties as a Commissioner.

33
Darryl T. Jones
Noel J. Shull
Darryl T. Jones was formerly employed by Southwestern Bell Telephone Company, now known as SBC, for 15 years as a planning and design engineer and later as a fi nancial analyst. After his career with Bell, Mr. Jones took the bold step in becoming an entrepreneur by forming his own foodservice management company known as TRI-TEC, Inc. Over the past 10 years, he has strategically formed joint-venture partnerships with some of the giants of the foodservice industry: Levy Restaurants in operating the foodservice at America’s Center and the Edward Jones Dome; HMSHost in operating the foodservice for Lambert International Airport; and Aramark in operating foodservice for the St. Louis Public Schools. Mr. Jones is currently volunteering numerous hours with several non-profi t organizations: Trustee with Fontbonne University, Chairman Garden District Commission; Board Director with Our Little Haven; and Board Director Epsilon Lambda Foundation of Alpha Phi Alpha Fraternity. Some of his former civic duties included: Secretary/Treasurer Missouri Housing Development Commission; Chairman St. Louis Metropolitan Sewer District; St. Louis Public Schools Role Model Program; and Board Director of Inroads St. Louis. Mr. Jones and his wife, Villa, and sons are long time residents of St. Louis City.
Noel Shull has extensive experience in the fi nancial services industry, primarily in the commercial lending area. He has served the Missouri Bankers Association as Chairman of their Governmental Affairs Committee. The U.S. Small Business Administration National Advisory Council Chairman appointed him Chairman of the Access to Capital Committee in 1988 and 1996. He has served on the board of directors for several banking institutions. Mr. Shull has volunteered on many charitable organization projects, including Missouri Cattlemen Foundation Board, Students in Free Enterprise International Exposition Judge, American Royal Governor and committees and University of Missouri-Columbia Honorary Professors Programs. He received an undergraduate degree from UMC in fi nance and real estate and a graduate degree in banking from Southwestern Graduate School of Banking at Southern Methodist University in Dallas, Texas. Mr. Shull is a past recipient of the U.S. Small Business Administration Regional Financial Services Advocate of the year award and the Kansas City University of Missouri-Columbia Business Alumni Chapter, 2004 Alumni of the year award.

44
Message from the ChairmanOn behalf of the Missouri Gaming Commission, it is my pleasure to present the
annual report for FY 2005. This report is submitted to comply with Section 313.837, RSMo, and contains an account of the Commission’s activities over the past year. The report includes a summary of the status of each licensed gaming facility; a report of gaming tax and admission fee collections; an analysis of the gaming markets in Missouri; a summary of the responsibilities and activities of each section of the Commission’s staff; a report on the status of the gaming industry affi rmative action programs; and an update on the Commission’s programs for problem gamblers and their families.
The report also contains a section fulfi lling the Commission’s statutory mandate to report to you on the effect of the loss limit on the competitiveness of Missouri riverboat casinos versus gaming facilities in neighboring jurisdictions. You may notice that the Commission offers much less commentary on the loss limit than it has in previous years. For the past decade, this Commission has reported to you that the data clearly shows the loss limit renders Missouri riverboat casinos less competitive versus its competitors in Illinois, Iowa and Mississippi.1 There has been little change in the data over the past decade, making the issue as to whether the loss limit has a negative impact on Missouri casino’s ability to compete with neighboring states well settled. The Commission continues to recommend you consider repealing this reporting requirement. The Joint Committee on Gaming and Wagering supports this position as indicated by its adoption of a resolution expressing its opinion on the issue during the 2005 legislative session.2
The gaming statutes also require the Commission to suggest changes in the adjusted gross receipts tax as provided in Section 313.822, RSMo. On pages 7-9, you will fi nd a detailed analysis of Missouri’s gaming tax rate as it compares to the gaming tax rates in other riverboat gambling states. In addition, the report provides the Commission’s view of how tax rates affect the economics of gaming, the quality of the operations located in the state and the impact of gaming taxes on employees, home dock communities, patrons and state revenues.
Another of the Commission’s statutory mandates is to provide recommendations for legislation the Commission deems advisable. Two years ago, the Commission opened the debate regarding the expansion of enforcement authority for Commission agents. The current system has served the citizens of Missouri and Commission admirably during the startup phase of riverboat gambling. It provided an immediate infl ux of experienced law enforcement offi cers who had established an important bond of trustworthiness with the
1 Indian casinos do not release the results of their operations. Thus, we are not able to provide an analysis of the competitive environment versus the Indian casinos in Kansas.
2 The resolution states, in part that:
“WHEREAS, the Joint Committee on Gam-ing and Wagering recognizes the importance of maintaining the independence of the Mis-souri Gaming Commission; and
WHEREAS, the Joint Committee on Gam-ing and Wagering believes that requiring the Missouri Gaming Commission to report on the effects of loss limits unnecessarily involves the Commission in a political issue, which is inconsistent with the duties of an impartial regulatory and law enforcement agency; and
WHEREAS, the Joint Committee on Gaming and Wagering fi nds that it is in the best interest of the effective regulation of legalized gaming to isolate the Missouri Gaming Commission from political issues or involvement; and

55
public. However, recent inquiries from the Missouri Government Review Commission (MGRC), prompted by responses from the Highway Patrol to an MGRC questionnaire, suggest that policy makers may consider other, more effi cient ways to allocate scarce state law enforcement resources. With this in mind, it is now imperative that we build more fl exibility into the gaming statutes to allow us to adapt to potential changes in administrative policy and, perhaps more importantly, to allow the Commission to adapt to changes in personnel that might be brought about as a result of a statewide emergency that would require highway patrol offi cers on riverboat casinos to be reassigned. In the absence of policy direction from the Governor and/or General Assembly, the Commission’s only plan would be to use the proposed statutory provisions to commission a few seasoned gaming enforcement managers who have extensive law enforcement experience. We believe the time to act on this issue has come and ask that you give this issue your most serious consideration in the 2006 legislative session.
The Commission also recommends legislation be adopted requiring casinos to pay interest on delinquent admission fees. A decision by one of the Commission’s hearing offi cers pointed out that the current gaming statute provides specifi c language allowing the Commission to impose interest on delinquent adjusted gross receipts taxes. However, the language is missing from the section imposing an admission fee. Thus, the Commission cannot assess interest against delinquent admission fees until the legislature grants it the authority to do so.
Finally, the Commission recommends the General Assembly enact legislation directing that jackpot winnings of problem gamblers who have voluntarily excluded themselves from Missouri casinos be deposited into a fund for problem gambling prevention and treatment. Under the provisions of Missouri’s internationally renowned voluntary exclusion program, problem gamblers who have excluded themselves are ineligible to place a wager. Thus, if the problem gambler surreptitiously enters the casino, illegally places a wager and wins a jackpot, the current law allows the casino to keep the money. The Commission believes a better policy is to deposit the money into the Compulsive Gamblers Fund and asks that you enact legislation authorizing the Commission to redirect the funds.
Perhaps the most signifi cant action by the Commission during the past fi scal year was the completion of the prioritization process for new licensees in the St. Louis metropolitan area. The Commission spent more than a year analyzing the submission of applications for six casino locations. The process was very competitive with the Commission receiving quality proposals from four companies. The process was also very open, as the Commission held enough public hearings so that any member of the public who wished to be heard on the issue was given the opportunity to
WHEREAS, the Joint Committee on Gam-ing and Wagering fi nds that relieving the Missouri Gaming Commission from the requirement of reporting to the General Assembly on the effect of loss limits will benefi t the Commission by allowing it to focus entirely on its mission of administering laws and regulations maintaining the integ-rity of commercial and charitable gaming in Missouri;
NOW, THEREFORE, BE IT RESOLVED, that the Joint Committee on Gaming and Wagering recommends that the provision of Section 313.837, RSMo, requiring the Missouri Gaming Commission to report annually to the General Assembly the effects of loss limits on the competitiveness of the gaming industry in Missouri be repealed.

666
speak directly to the Commission in an open forum. The quality and fairness of the selection process can perhaps best be judged by the absence of any signifi cant controversy or negative media coverage following the Commission’s selection of Pinnacle Entertainment as a priority for investigation for its projects in downtown St. Louis and in St. Louis County.3
The Commission is particularly grateful for the cooperation and professionalism exhibited by the St. Louis City and County governments. Each of these entities has been very helpful during the process in providing the Commission with information and in establishing the clear support of their communities for a casino development. The Commission has never licensed a casino in a community unless there was substantial and widespread support for it. The Commission continues to believe that local community support is critical to the selection and licensing process. Local governments play a critical role in this process but are also at risk of falling to the temptation of unethical or illegal conduct.4 The Commission’s experience with St. Louis City and County offi cials thus far has been excellent and they are to be commended for their handling of this highly volatile issue.
Governor Matt Blunt appointed two new members to the Commission in 2005. Both members bring a wealth of experience in business matters and public service. Darryl Jones is an experienced businessman who also has a lengthy record of serving the St. Louis community as both an appointed offi cial and a volunteer. Noel Shull is a veteran of the banking industry who will bring much needed expertise to the Commission’s oversight of complex fi nancial matters. Both members will help build upon the solid foundation that has been laid by previous Commissioners.
4 In 1999, former Kansas City Port Authority Chairman, Elbert Anderson, was sentenced to a federal prison term for his role in a bribery scheme involving Hilton Casino offi cials. The indictments also involved Kansas City Councilwoman D. Jeanne Rob-inson and former Jackson County Legislator James Tindall, as well as Hilton executive Mark Rousseau.
3 The Commission has been sued by Colum-bia-Sussex Corporation who asserts that the Commission does not have the authority to issue a license to Pinnacle Entertainment in downtown St. Louis because its proposed casino location is more than 1,000 feet from the Mississippi River as defi ned in statutes and the Missouri Constitution. The Commission views this lawsuit as more of an action by a potentially competing casino company than a protest against the selection process. The selection process provided for a meticulous examination of site related is-sues by an outside consultant who concluded that the site was within 1,000 feet of the river according to the legal defi nition estab-lished by the legislature.

777
Section 313.837 Report on CompetitivenessIntroduction Since its inception, the Missouri law governing riverboat gambling has included a loss limit of $500 per person for each “gambling excursion”, now a legal fi ction used only for purposes of collecting the $2 admission fee and administering the loss limit.1 Missouri’s loss limit emulated an Iowa law that was repealed in 1995. Missouri is now the only jurisdiction in the world imposing a loss limit on its gambling customers.
Section 313.837, RSMo, requires the Commission to report annually to the General Assembly “the status of the competitiveness of Missouri excursion gambling boats when compared to the gaming tax rate of adjoining states and the effects of the loss limit imposed by subdivision (3) of Section 313.805, RSMo, on the competitiveness of the gaming industry in Missouri.”
Competitive Impact of the $500 Loss LimitFor the past ten years, the Commission has fulfi lled this statutory requirement by reporting that the
data unequivocally shows the loss limit renders Missouri casinos less competitive than casinos in neighboring jurisdictions. The Commission believes that the data reported during this tenure offers the General Assembly suffi cient information to assess the impact of the loss limit on the competitiveness of Missouri casinos versus those in neighboring jurisdictions.
For the past several years, the Commission has asked the General Assembly to consider legislation repealing this requirement and thus allowing the Commission to step away from this often-volatile political issue. During the 2005 legislative session, the Joint Committee on Gaming and Wagering endorsed this concept by adopting a resolution recognizing the importance of maintaining an independent Gaming Commission that is isolated from involvement in such political issues.2
Competitive Impact of Missouri’s Gaming Tax Rate The gaming tax rates imposed on riverboat gaming operations in Missouri have not changed since the fi rst licenses were issued in May 1994. Missouri law imposes an 18% tax on the adjusted gross receipts (AGR) of riverboat gaming operators.3 In addition, a local tax of 2% on AGR is collected by the state and distributed to each home dock city or county.4 The statute also imposes an admission fee on the operators of excursion gambling boats in the amount of two dollars ($2) per patron, per excursion, which is split between the home dock community and the state.5 Furthermore, pursuant to Section 313.824, RSMo, excursion gambling boat operators are charged for the cost of gaming agents who are assigned to the riverboat with the responsibility of protecting the public. While the cost of Commission agents varies with each operation, the average annual cost is approximately $611,000 per gaming facility. Despite the massive tax increases recently enacted by Illinois, Missouri’s gaming tax rate remains among the top tier in the United States. The Commission continues to believe that graduated gaming tax rates, such as that adopted by Illinois, represent bad economic policy. Graduated tax rates based on gaming
1 Section 313.800.1(8), RSMo., defi nes a “gambling excursion” as “the time during which gambling games may be operated on an excursion gambling boat whether docked or during a cruise.” Riverboat gambling operators are required to submit an excursion schedule to the Gaming Commission, which is responsible for approving the schedule. Most excursions are two hours with the exception usually being the last excursion of the gaming day, which is typically three hours. Thus, as a practical matter, the loss limit is $500 every two hours.
2 The resolution stated, in part, the follow-ing:
WHEREAS, the Joint Committee on Gam-ing and Wagering recognizes the importance of maintaining the independence of the Mis-souri Gaming Commission; and
WHEREAS, the Joint Committee on Gam-ing and Wagering believes that requiring the Missouri Gaming Commission to report on the effects of loss limits unnecessarily involves the Commission in a political issue, which is inconsistent with the duties of an impartial regulatory and law enforcement agency; and
WHEREAS, the Joint Committee on Gaming and Wagering fi nds that it is in the best interest of the effective regulation of legalized gaming to isolate the Missouri Gaming Commission from political issues or involvement; and

88
tax revenue penalize companies for placing capital at risk. Furthermore, high graduated tax rates discourage reinvestment of profi ts in such things as new technology, the construction of non-gaming amenities and marketing dollars used to grow the business. Finally, such tax policy inevitably results in layoffs and fewer job offerings.6 In summary, this type of tax policy encourages poorly maintained, understaffed facilities that cater primarily to local customers.
Illinois is currently reconsidering its tax policy. The tax hike in 2003 that produced a top rate of 70% of gross gaming revenues resulted in the loss of 3,000 jobs, a $50 million reduction in wages and benefi ts for casino workers and nearly a moratorium on casino improvements other than necessary maintenance.7 While state revenue collections from casinos did increase, the state’s take was less than half of what had been projected. Meanwhile, Missouri’s stable tax environment continues to attract substantial investment dollars despite Missouri’s strict regulatory stance in other areas. Since the licensing of the fi rst casinos in 1994, approximately 60% of the operating cash fl ow generated by casino companies has been reinvested back into Missouri, much of it in non-gaming amenities such as hotel rooms, better infrastructure, meeting space, restaurants, movie theatres and venues for live performances. In simpler terms, for every $100 million the Missouri casinos have generated in profi t, they have invested $60 million of it back into Missouri.
During the past legislative session, the Illinois legislature passed a bill lowering the top tax rate to 50%. At the time of this writing, the bill awaits consideration from Illinois Governor Rod Blagojevich. While this will still put Illinois towards the top of the gaming tax rate list, it will likely result in an increase in capital investment in Illinois as well as more aggressive marketing by Illinois casinos. We can expect this activity to cut into gains made over the past few years by Missouri casinos on the eastern side of the state.
In 2002, Indiana increased its effective tax rate by 5% by adopting a graduated tax rate and eliminating its boarding fee on customers staying over for more than one “excursion”. While the Commission argues against the graduated tax rate, the policy has not had a negative impact on Indiana gaming revenues because the legislature coupled regulatory reforms with the tax increase. Before
3 Adjusted gross receipts are defi ned by Sec-tion 313.800, RSMo, as “the gross receipts from licensed gambling games and devices less the winnings paid to wagerers.” In other words, the amount the casino “wins” from patrons. It is often referred to as “casino win”. The tax on AGR is set forth in Section 313.822, RSMo.
4 Section 313.822, RSMo.
5 Section 313.820, RSMo.
6 “Casinos blast Illinois tax increase”, Chi-cago Sun Times, September 3, 2003, quoting Illinois Casino Gaming Association execu-tive director Tom Swoik, “As a direct result of this tax policy, we have laid off nearly 700 employees and are not fi lling close to 600 additional vacancies. Additionally, we anticipate there may be further layoffs in the months to come.”
WHEREAS, the Joint Committee on Gam-ing and Wagering fi nds that relieving the Missouri Gaming Commission from the requirement of reporting to the General Assembly on the effect of loss limits will benefi t the Commission by allowing it to focus entirely on its mission of administer-ing laws and regulations maintaining the integrity of commercial and charitable gam-ing in Missouri;
NOW, THEREFORE, BE IT RESOLVED, that the Joint Committee on Gaming and Wagering recommends that the provision of Section 313.837, RSMo, requiring the Missouri Gaming Commission to report annually to the General Assembly the effects of loss limits on the competitiveness of the gaming industry in Missouri be repealed.
Illinois Tax Increase SummaryTax Bracket (AGR) Previous Rate 2002 Increase
Less than $25 million 15.0% 15.0% $25 - $50 million 20.0% 22.5% $50 - $75 million 25.0% 27.5% $75 - $100 million 30.0% 32.5% $100 - $150 million 35.0% 37.5% $150 - $200 million 35.0% 45.0% Greater than $200 million 35.0% 50.0%
Tax Bracket (AGR) 2003 Increase Less than $25 million 15.0% $25 - $37.5 million 27.5% $37.5 - $50 million 32.5% $50 - $75 million 37.5% $75 - $100 million 45.0% $100 - $250 million 50.0% Greater than $250 million 70.0%

99
2002, Indiana imposed restricted boarding and mandatory cruising. In conjunction with the 2002 tax increase, Indiana rescinded the boarding and cruising requirements, thus allowing casino operators to effectively absorb the tax increase.8
While the Iowa tax rate is lower than Missouri’s, it is comparable; and like Missouri, its tax structure has not changed since initial enactment. There is no evidence that the lower Iowa tax rate is having negative impact on the competitiveness of Missouri casinos. Certainly, over the long term, the fact that Indian casinos in Kansas pay no tax will have an impact on western Missouri gaming operators. You should also be aware of the potential for rapid expansion of Kansas Indian casinos. Finally, Missouri casinos have been profi table in spite of the high tax rate largely because of the Commission’s gradual approach to licensure. The Commission’s practice of waiting to introduce new gaming capacity into a market until there is adequate demand allows Missouri licensees to remain profi table and encourages them to reinvest in Missouri.
SummaryThe Missouri tax rate remains among the highest in the gaming industry. However, its structure has
some inherent advantages over Illinois and the lower tax rate in Iowa does not appear to be affecting the competitiveness of the Missouri operators.
8 For the 12 months ended June 2003, Indi-ana casinos realized a $233 million increase in gaming revenue, while taxes increased only about $165 million. Gaming revenue continued to outpace taxes in FY 2004.
7 WJLA.com news service.
46.7%
21.7%27.7%
0
0.1
0.2
0.3
0.4
0.5
Illinois Iowa Missouri
Effective Tax RateNeighboring States
Jun-02Oct-02
Feb-03Jun-03
Oct-03Feb-04
Jun-04Oct-04
Feb-05Jun-05
-0.15
-0.1
-0.05
0
0.05
0.1
0.15
0.2
Comparison of Gaming Revenue Growth(year over year % change)
MO
IL
1010
Staff ReportEXECUTIVE DIRECTORKevin Mullally
The Missouri Gaming Commission, created in 1993, has worked hard to quickly establish itself as a national leader in providing effi cient, effective regulation of the often-controversial gaming industry. To do this, the Commission has relied on the hard work and dedication of its employees as well as maintaining a focus on its strategic mission and vision.
The Commission is currently an agency in transition. It is moving out of its formative stage into a more mature agency and is developing meaningful, relevant performance measures that the executive branch, legislators and citizens can relate to and understand. Among the Commission’s goals for FY 2006 is to establish itself as a leader in the area of performance measurement. The Commission’s “Managing for Results” initiative will create an agency that has clear goals and objectives and uses regulatory and enforcement tactics that track progress in achieving the goals and objectives. It will use information management systems to report the measures to a range of audiences for a variety of uses, so that our measures are not only understandable for each audience but relevant, as well. Our measures will be such that they can be used to make informed decisions regarding priorities, program management and budget allocation.
Admittedly, this is a formidable goal for a regulatory and enforcement agency where it is inherently diffi cult to develop meaningful performance measures (how do you measure criminal activity avoided, risks mitigated, hazards eliminated, patterns of noncompliance addressed?). A common practice in performance measurement reporting is to evaluate the effectiveness of “programs”. This practice is not generally applicable to a regulatory and enforcement agency like the Gaming Commission because, as a general rule, it doesn’t have a variety of “programs”.
The Commission’s mission is rather simple and straightforward – “To serve the citizens of Missouri by ensuring the integrity of charitable and commercial gaming and by optimizing its social and economic impact on the state.” Thus, the Commission’s performance measurement system is more likely to account for and evaluate various tactics used to achieve broader strategic goals. For instance, a recurring goal of the Commission will be to maintain a zero tolerance for convicted felons and persons involved in organized crime participating in gaming operations. In order to achieve this goal, the Commission will use a variety of tactics that might include investigations, intelligence gathering, enforcement actions such as penalties for companies who fail to perform adequate due diligence on prospective employees, information campaigns educating the industry on techniques to identify non-qualifying employees and partnership initiatives with other state regulatory and law enforcement agencies. For a correlating example, think of how your doctor might prescribe a combination of medicines that, when taken in concert, will treat your illness while eliminating one of the medicines

1111
ENFORCEMENTSteve Johnson, Chief Deputy DirectorDirector of Enforcement
The enforcement section has enjoyed an extremely productive year in its role as the operational center of the Commission. We continue to be focused on the safety of patrons and staff, the integrity of gaming
renders the treatment ineffective.1 So it is with regulatory practice; it is the coordination of resources that results in effective risk management.
One of the major staff initiatives during the past fi scal year was the enhancement of the Commission’s technical oversight of electronic gaming devices (EGDs) that was authorized by the General Assembly in 2004. The Commission has been able to augment its EGD technical staff without increasing its FTEs through a “core swap” that exchanged eight highway patrol positions for less expensive EGD technicians. These employees are skilled and highly specialized through extensive training on the incredible variety of EGD platforms and technologies that are constantly being updated. Technology is one of the principal forces driving new gaming revenue and fi erce competition in the industry requires employees who are constantly learning and adapting to new technology. Employees in this area do not have time to invest in other areas of regulation as was required of highway patrol offi cers who had previously been performing some work in this area. The new system is proving to be much more effi cient and effective, and Missouri citizens will benefi t because it allows new technology to move into the state more quickly, thus helping all the businesses that support EGDs (including, but not limited to, trucking and transportation, electrical workers, advertisers, printers, associated equipment manufacturers, distributors and retailers).
One of the major initiatives for the upcoming fi scal year will be a review of the Commission’s internationally recognized voluntary exclusion program for problem gamblers.2 Recent scientifi c studies indicate that allowing a menu of options rather than a “lifetime only” program would be more useful to a wider array of problem gamblers. The proposed changes will also include a behavioral education program designed to provide individuals with the opportunity to learn how to make healthier decisions. The education program will target areas of behavioral health that are weak areas for problem gamblers and their loved ones. Problem gamblers will need to complete this behavior education program prior to seeking to terminate a temporary self-exclusion.
The Commission staff believes that these changes are important to the evolution of the voluntary exclusion program. They signify the Commission’s continued dedication to explore new and better ways to assist problem gamblers with their recovery. The proposed changes will be openly debated and citizens will have ample opportunity for public comment during public hearings and through the submission of written comments. The staff expects to submit the proposed changes to the Commission during FY 2006.
1 This example is adapted from The Regula-tory Craft, by Malcolm K. Sparrow, Brook-ings Institute Press, 2000, pg. 285.
2 Missouri’s voluntary exclusion program for problem gamblers was the fi rst government sponsored exclusion program. In addi-tion to being the world’s largest and most comprehensive program, it has also served as a model for other jurisdictions. Some of the jurisdictions that have used Missouri as a model include Illinois, Indiana, Michigan, New Jersey, Arizona and Louisiana.

1212
and the protection of assets as we execute our many responsibilities. The changes in Electronic Gaming Device (EGD) technology and the many new games being approved continue to result in a relatively small number of patron complaints, with many of these complaints resulting from a lack of understanding of the game being played. In all cases, we investigate, report and respond to the patron with the results of our investigation.
The enforcement section is involved in a wide variety of specifi c activities including, but not limited to, charitable gaming, policy development, coordination of the industry discipline system, new construction and expansion oversight, promotions approval and a host of licensing activity including individuals in various capacities, suppliers and corporate entities. We rely on a diversifi ed staff to accomplish our mission, including individuals with major metropolitan, state and federal law enforcement backgrounds. This staff represents hundreds of years of investigative experience. We have utilized the Community Oriented Regulation and Enforcement (CORE) concept in developing regulations, Minimum Internal Controls (MICs) and procedural requirements, generating involvement and buy-in by all affected parties resulting in a timelier and more effi cient rule making process. Our reliance on CORE has permitted us to rewrite various sections of regulation and add additional MICs and policies greatly facilitating competitive growth and accommodating new technology.
The Commission’s electronic gaming device program continues to be recognized as an innovative industry leader in an extremely fast paced environment. This is a very competitive industry, which forces us to work hard to maintain the competency levels necessary to do our jobs. Missouri’s leadership and expertise in this fi eld is evidenced by an invitation to speak at the Global Gaming Exposition (G2E), a gathering of more than 25,000 gaming manufacturers, operators and regulators. We have also been invited to speak at Gaming Laboratories International’s Regulators Roundtable, a meeting attended by 128 regulators from 50 or so jurisdictions.
Our day-to-day activities include conversions, upgrades, replacement of revoked or obsolete software, installation and oversight of redemption kiosks, installation of ticketing systems and a host of other EGD related activity. We routinely verify critical software and programs, seal critical program storage media and conduct function testing on various devices and systems. We have implemented an EGD Specialist program that has resulted in the retention and assignment of eight intensively trained specialists in the St. Louis and Kansas City areas. Previously, these functions were performed by Highway Patrol Gaming Agents assigned to the Commission; however, the aforementioned evolution in this business has resulted in the need to dedicate highly trained specialists to this function. The number of devices in play in Missouri will result in the Highway Patrol Gaming Agents remaining active in this aspect of regulation although it is anticipated the very high number of overtime hours worked by the Patrol Agents will be reduced. Finally, our EGD program is moving into a paperless environment with the development of network and web based systems. This environment results in documentation for approval, software approvals and revocations being immediately available to all
1313
casino EGD personnel as well as our own staff. This timely notifi cation is absolutely necessary to protect the integrity of gaming in our state.
Audit – The Commission compliance audit staff conducts audits of each casino in Missouri to identify areas of noncompliance with statutes, regulations and internal controls. This year the audit department instituted a new audit approach, which includes an audit program that addresses critical areas directly related to the integrity of gaming. We believe this process will allow more effi cient review of each casino’s operations.Our audit staff interprets the applied policies and recommends corrective action for areas of noncompliance when conducting audits and assisting gaming agents with investigations. The casino’s internal audit department conducts semi-annual audits, which our audit staff reviews to detect irregularities that require corrective action and also ensures that proper corrective measures have been taken. The audit staff performs the same procedures for external audit reports completed by various independent audit fi rms. During the year, our auditors attend internal and external audit cash counts and observe numerous coin and token relocations and destructions. Our auditors comply with the Standards for the Professional Practice of Internal Auditing and Government Audit Standards. During FY 2005, the audit staff completed 38 audit reports refl ecting the results of audits of various casino operations.
Licensing - The Missouri Gaming Commission is charged by statute to license excursion gambling boats, suppliers of gambling equipment and occupational licensees involved in an occupation within an excursion gambling boat operation. Licensing staff currently coordinate and implement the licensing and renewal of eleven (11) Class A (riverboat) licensees, nineteen (19) suppliers, eleven (11) Class A liquor licenses and over 12,500 active occupational licensees.
FY 2005 brought an array of licensing activity regarding Class A and supplier licensees. Class A applications were fi led by Herbst Gaming, Inc. (HGI-Mark Twain and HGI-St. Jo) due to the purchase of St. Jo Riverboat Casino and Mark Twain Casino from Grace Entertainment. Pinnacle Entertainment’s projects in downtown St. Louis (Casino One Corporation-City) and in Lemay (Casino One Corporation – County) were selected as priorities for investigation. St. Louis Riverboat Entertainment, Inc., a subsidiary of Wimar Tahoe Corporation/Columbia Sussex Corporation, fi led application for a fi nding of suitability by the Commission and authorization of a change in control to acquire President Riverboat Casino-Missouri, Inc. Harrah’s Maryland Heights, LLC’s two Class A licenses were consolidated to one Class A license doing business as Harrah’s St. Louis Casino. Penn National Gaming, Inc. fi led application for the purchase of Argosy Gaming Company.
Konami Gaming was issued a temporary supplier license. Paul-Son Gaming Corporation initiated a name change to Gaming Partners International Corporation (GPI USA), and the sister subsidiary of GPI USA, Gaming Partners International S.A.S., fi led application and was granted a temporary supplier license. Two supplier companies (Anchor Coin, Inc. and Spin for Cash WAP, JV.) dissolved and now fall under the supplier license of IGT. Casino Data System’s supplier license was surrendered with all business transactions

1414
now conducted through the parent company, Aristocrat Technologies, Inc. Two suppliers (Kilmartin and R. Franco USA) withdrew applications for Missouri licensure.
License 2001, a statewide licensing system, provides the Commission a vehicle to license and track all occupational licenses, as well as generate a monthly invoice for fees associated with applications, licenses issued, duplicate licenses and renewals for Key/Level I, Level II and service technician occupational licenses. Occupational gaming licenses issued statewide for FY 2005 totaled over 3,300, with approximately 8,300 renewals. The proposal to outsource for development of a more modernized licensing system to ensure the integrity and accuracy of this statutory mandate was declined; therefore, requirements gathering continues to allow an advanced, all inclusive licensing system to be developed by MGC Information Technology staff to provide consistency, reliability and increased effi ciency for the State of Missouri. Projected increase in occupational licensees in the next two years could range from 1,000 to 3,000, depending on the St. Louis City and County proposed projects.
Pari-Mutuel Horse Racing – Pari-Mutuel Horse Racing was established in the State of Missouri with the enactment of Senate Bill 572 in 1986. This allowed for wagering on the outcome of horse races in which those who wager purchase tickets of various denominations on a horse or horses in one or more races. To this date no track has been established in the state. The Gaming Commission was assigned the responsibility for governing pari-mutuel horse racing from the Missouri Horse Racing Commission in 1997.
Missouri State Highway Patrol – The Gaming Division of the Highway Patrol, pursuant to a memorandum of understanding with the Gaming Commission, provides criminal and regulatory enforcement of gaming operations within the state. Under the command of Captain Robert Bloomberg, the division is divided into four sections: Eastern District Enforcement, Western District Enforcement, Background Investigations and Administrative Services. The enforcement districts are responsible for enforcing Missouri statutes and Commission regulations on licensed casino properties. The background unit conducts investigations of individuals, companies and suppliers applying for licensure with the Commission, as well as persons applying for employment with the Gaming Commission. The background unit has a section that is responsible for enforcement related to charitable games in Missouri. The administrative services section oversees the collection and preservation of evidence and property, division training, criminal records and case management and special projects performed by the Gaming Division.
Charges listed in the chart on the following page were fi led as a result of arrests made by troopers assigned to the Gaming Division from July 1, 2004 through June 30, 2005.

1515
ADMINISTRATIONDeborah A. Ferguson, Deputy Director
The administration section of the Missouri Gaming Commission is responsible for managing all fi scal, personnel and record retention resources of the agency. In addition, the administration section provides support services to 119 Commission employees and, pursuant to a memorandum of understanding, to 110 Highway Patrol offi cers assigned to the Commission. This section oversees the operating and leasing budgets, revenue collection, accounts payable, accounts receivable, cost accounting, procurement, facilities management, support services, human resources, asset inventory and records management.
FY 2005 for the administration section was marked by change. We had change in personnel, expense per diem, purchasing practices, facility management and records management.
Personnel changes included the replacement of our fi scal manager, a position that is critical in working with management to implement performance based budgeting for the Commission. Performance based budgeting is the key to moving forward with both internal and external assessment of how the Commission is managing its resources and achieving its goals and objectives. This will be an ongoing process. At the end of the fi scal year we lost our purchasing offi cer and have moved quickly with fi lling this position, as well.
Additionally, this past year the Commission decentralized its procurement by allowing the offi ce managers in Kansas City and St. Louis to be issued purchasing cards for small re-occurring purchases. Purchasing (travel) card was also issued to the account clerk to enable the Commission to make purchases from the internet for travel. This new procedure allows the Commission to take advantage of lower fares when offered.
With the passage of SB 1020, 889, & 869 the Commission was tasked with reviewing our practice for sunshine law requests. Specifi cally, administration worked with legal, bingo and public information to review
TYPE OF CHARGE NUMBER TYPE OF CHARGE NUMBER18elciheV rotoM1nosrA895ssecorP laiciduJ fo noitcurtsbO44tluassA
81eciloP gnitcurtsbO2yralgruB7ecnabrutsiD ecaeP61ytreporP degamaD1redrO cilbuP37sgurD suoregnaD4yrebboR8esneffO ylimaF3sesneffO xeS31epacsE/thgilF1tluassA lauxeS35yregroF
851gnilaetS44duarF5ytreporP nelotS032swaL gnilbmaG fo noitaloiV5snopaeW2ycavirP fo noisavnI
7swaL rouqiL fo noitaloiVMiscellaneous Federal Charges 6 Total Charges * 1,380
*These totals reflect the number of charges filed by agents of the Commission. The number of individuals arrested will be loweras some individuals may have multiple charges filed as a result of an individual incident. These totals also include arrests madeattendant to outstanding warrants for criminal activity that did not occur on property of excursion gambling boats.
1616
its copy fee charges and update them to insure our practice was consistent with legislative intent. As a result of this coordinated effort a new database is maintained on the Commission public drive to track all sunshine requests.
Also in the area of record retention, the records manager worked with the DAP program manager to establish a record retention schedule with the Secretary of State’s offi ce.
The administration section has had another very successful year, and continues to strive in creating and developing more effective and effi cient ways of providing quality service.
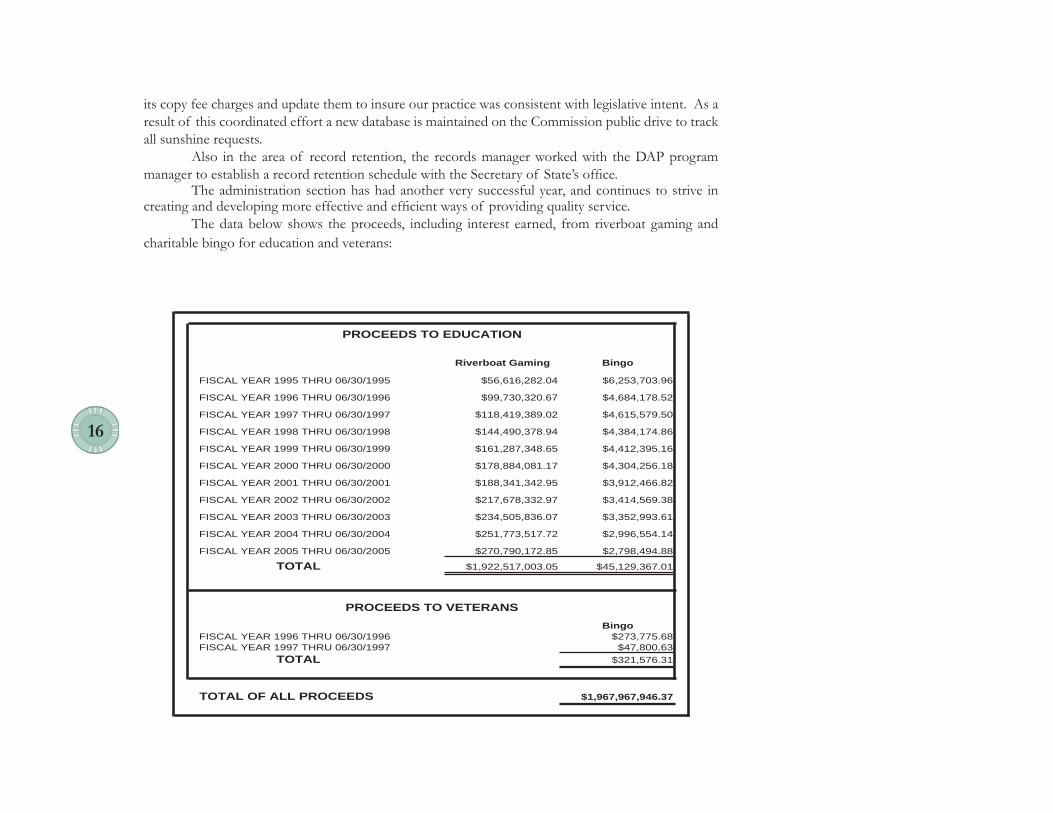
The data below shows the proceeds, including interest earned, from riverboat gaming and charitable bingo for education and veterans:
Riverboat Gaming Bingo
FISCAL YEAR 1995 THRU 06/30/1995 $56,616,282.04 $6,253,703.96
FISCAL YEAR 1996 THRU 06/30/1996 $99,730,320.67 $4,684,178.52
FISCAL YEAR 1997 THRU 06/30/1997 $118,419,389.02 $4,615,579.50
FISCAL YEAR 1998 THRU 06/30/1998 $144,490,378.94 $4,384,174.86
FISCAL YEAR 1999 THRU 06/30/1999 $161,287,348.65 $4,412,395.16
FISCAL YEAR 2000 THRU 06/30/2000 $178,884,081.17 $4,304,256.18
FISCAL YEAR 2001 THRU 06/30/2001 $188,341,342.95 $3,912,466.82
FISCAL YEAR 2002 THRU 06/30/2002 $217,678,332.97 $3,414,569.38
FISCAL YEAR 2003 THRU 06/30/2003 $234,505,836.07 $3,352,993.61
FISCAL YEAR 2004 THRU 06/30/2004 $251,773,517.72 $2,996,554.14
FISCAL YEAR 2005 THRU 06/30/2005 $270,790,172.85 $2,798,494.88
TOTAL $1,922,517,003.05 $45,129,367.01
Bingo86.577,372$6991/03/60 URHT 6991 RAEY LACSIF36.008,74$7991/03/60 URHT 7991 RAEY LACSIF
TOTAL $321,576.31
TOTAL OF ALL PROCEEDS $1,967,967,946.37
PROCEEDS TO VETERANS
PROCEEDS TO EDUCATION

1717
The Missouri Gaming Commission follows Section 313.835, RSMo, for operating fund transfers. It states: “All revenue received by the Commission from license fees, penalties, administrative fees, reimbursement by any excursion gambling boat operators for services provided by the Commission and admission fees authorized pursuant to the provision of Section 313.800 to 313.850, except that portion of the admission fee, not to exceed one cent, that may be appropriated to the compulsive gamblers fund as provided in section 313.820, shall be deposited in the state treasury to the credit of the ‘Gaming Commission Fund’ which is hereby created for the sole purpose of funding the administrative costs of the Commission, subject to appropriation.”
The statute also provides that the remaining net proceeds in the Gaming Commission Fund for each fi scal year are distributed to various funds in amounts defi ned in the statute. Additionally, the fi rst fi ve hundred thousand dollars shall be appropriated on a per capita basis to cities and counties that match the state portion and have demonstrated a need for community assistance. As a result, the amounts below have been transferred since inception to the Gaming Commission Fund.
Fiscal Year of Transfer
VeteransCommission Capital Improvement Trust
FundMissouri National Guard Trust Fund
Mo College Guarantee Fund
Early Childhood Development,
Education and Care Fund
CompulsiveGamblers Fund Totals
FY 1994/1995 $8,408,536.13 $8,408,536.13FY 1996 $23,487,182.59 $23,487,182.59FY 1997 $30,388,830.54 $30,388,830.54FY 1998 $35,905,493.46 $35,905,493.46
15.367,737,04$15.367,732,03$00.000,005,4$00.000,000,3$00.000,000,3$9991 YF57.308,717,44$57.308,712,43$00.000,005,4$00.000,000,3$00.000,000,3$0002 YF
FY 2001 $3,000,000.00 $3,000,000.00 $4,500,000.00 $30,691,290.20 $46,612.00 $41,237,902.20FY 2002 $3,000,000.00 $3,000,000.00 $4,500,000.00 $31,266,433.92 $398,074.00 $42,164,507.92FY 2003 $3,000,000.00 $3,000,000.00 $4,500,000.00 $33,947,613.45 $489,850.00 $44,937,463.45FY 2004 $6,000,000.00 $4,000,000.00 $5,000,000.00 $30,320,589.96 $489,850.00 $45,810,439.96FY 2005 $6,000,000.00 $4,000,000.00 $5,000,000.00 $30,952,627.54 $489,850.00 $46,442,477.54
Totals $125,190,042.72 $23,000,000.00 $32,500,000.00 $221,634,122.33 $1,914,236.00 $404,238,401.05
Missouri Gaming CommissionSummary of Fund Transfers from Gaming Commission Fund
The Commission report refl ects all transfers for a given fi scal year to include end of year transfers that occur in July for June activity. These fi gures will vary from those shown in the state accounting system (SAMII), which does not have a means to account for lapse period transfers.
Effective August 28, 2003, the 92nd Missouri General Assembly, at its First Regular Session, passed House Bill 444 changing the distribution of net proceeds in the Gaming Commission Fund each year. Under the provisions of this bill, the total distribution for each fund will be as follows: $6 million to the Veterans’ Commission Capital Improvement Trust Fund; $5 million to the Missouri College Guarantee Fund; $4 million to the Missouri National Guard Trust Fund; and the remaining net proceeds to the Early Childhood Development, Education and Care Fund.

1818
INFORMATION TECHNOLOGY Ray Pope, Director
The IT section has three basic functions: the installation and support of the microcomputer infrastructure, the development and implementation of process support applications and training all Commission employees in the effi cient use of the computer systems available.
During this year, we have continued to make progress in the application development process. We have completed the requirements gathering for 14 systems, created design documents for 12 systems and deployed six new or revised systems. We currently have four systems in coding and two in testing. All of this was accomplished while we experienced a 50% turnover in our development staff.
The website has been routinely utilized for publishing the Commission press releases, agendas and minutes of Commission meetings, as well as job postings. We have a link that allows us to add these items to the state website at the same time. We have been delayed in the redesign of the website but plan to resume our efforts to make it more useful for the people we serve.
We have stabilized our network environment and improved production stability. We have been monitoring the network confi guration capacity and it seems to be able to accommodate the Commission’s data collection and delivery needs. By upgrading our desktop computers, we have been able to reduce the maintenance costs to the Commission’s remote locations.
In support of the new EGD technicians implemented in the Enforcement Section, we assisted in the selection of new tablet PC’s; then ordered, confi gured and set up the new machines. We also set up 11 laptop computers to be used at each casino for tracking upgrade levels for all installed Electronic Gaming Devices.
Training has been very active serving as primary internal testing and development of user documentation for new systems. This helps prepare for training users on the application of new systems prior to deployment. We conducted user application training to 68 Gaming employees and 25 casino employees. We also trained 348 participants in 61 Microsoft Windows and Offi ce classes.

1919
LEGALMichael Bushmann, General Counsel
The legal section provides legal advice to the Commissioners, Executive Director and other Commission staff regarding riverboat and charitable gaming issues, including review of fi nancial transactions, interpretation of laws and regulations and analysis of policy proposals. The section assists the Commission in its quest to ensure that riverboats, bingo organizations, suppliers and individual licensees abide by all laws and rules of the Commission. In particular, Commission lawyers are responsible for drafting proposed disciplines against licensees for violations of laws or rules and presenting those disciplines to the Commission. The legal staff also serves as a liaison with the Attorney General’s offi ce regarding discipline appeals and related matters. In FY 2005, 24 disciplines were proposed against Class A excursion gambling boat licensees. Five of those disciplines have appeals currently pending. The disciplines proposed fi nes ranging from $5,000 to $200,000 for violations such as a progressive slot machine violation, marketing violations, liquor violations, failure to remove revoked software from slot machines and failure to promptly report criminal activity to the Commission. Level I licensees hold gaming licenses for key managerial positions within a riverboat gaming operation, such as the general manager, controller and department managers. In FY 2005, one Level I license was revoked and one license was suspended. Level II licensees hold gaming licenses for occupational positions such as dealers, slot machine technicians and cocktail servers, to name a few. In FY 2005, disciplines were proposed against 253 Level II licensees. Of the disciplinary actions proposed against Level II licensees, 36 were license revocations, 172 were license suspensions and 45 were denials of permanent licensure. In the past year, the bingo section imposed discipline against one bingo organization and fi ned one bingo manufacturer. In addition, the bingo section denied requests from seven applicants for a bingo license based on the applicants’ failure to establish suitability for licensure.
CORPORATE SECURITIES AND FINANCEJennifer Bruns, Senior Auditor
The primary functions of the corporate securities and fi nance section are fi nancial reporting, gaming market analysis, fi nancial suitability analysis and tax collection. The Commission provides a monthly market statistics report on its website.1 The report provides data on adjusted gross receipts (gaming revenue), patron volume, admission counts and the amount of gaming tax and admission fees collected.
1 www.mgc.dps.mo.gov/fi nan_map.html

2020
The corporate securities and fi nance section is responsible for analysis of the gaming markets in Missouri for the purpose of providing senior staff with information they need to make decisions regarding expansion, rule changes and regulatory resolutions. Regarding expansion, the goal is to determine the timing, number and placement of additional casinos. The Commission’s charge is to issue licenses to applicants that best serve the interests of the citizens of Missouri. In order to fulfi ll this responsibility, the Commission evaluates many factors, including whether new gaming capacity can be added to the market without unduly impacting previously licensed facilities. The Commission, in evaluating proposals for additional licenses, focuses on creating incremental growth, expansion of tax revenues, ancillary economic development and employment. Furthermore, it carefully scrutinizes the level of community support and the ability of the developer to minimize the negative social and economic impact of the facility. Thus, Missourians can expect the Commission to deal with expansion issues in a cautious and prudent manner that includes a lengthy public process. However, should a facility become substandard, fall into disrepair or otherwise become non-competitive, the Commission would be forced to consider new projects in that market of better quality that meet the high standards it sets for licensees. The section also examines business transactions of the licensee’s parent company, including the issuance of debt or equity, acquisitions, mergers and others. This analysis is done to determine whether the fi nancial suitability of the gaming entity will be impaired due to the transaction and whether any regulatory action is necessary. Another function of the corporate securities and fi nance section is the collection of the gaming tax and admission fees assessed upon casino licensees by statute. The critical role of the tax auditors is to audit approximately 4,180 tax returns for accuracy and completeness. They also perform on-site tax audits in order to reconcile supporting documentation to the tax returns.

2121
EXECUTIVEDIRECTOR
DEP. DIR. ENF.PUBLIC SAFETYMANAGER B-3
GENERALCOUNSEL
CHIEF FINANCEANALYST
FISCAL & ADMIN.MANAGER B-2
DEP. DIR. ADMIN.FISCAL & ADMIN.
MANAGER B-3
LEGAL COUNSEL
PUBLIC SAFETYPROG. SPEC.(DAP ADMIN.)
DESIGNATEDPRINCIPALASSISTANT
SENIORAUDITOR
TAX
AUDITOR I/IITAX(3)
COMPUTER INFO.TECH. SPEC. I
(2)
COMPUTER INFO.TECH. I/II/III
(6)
Info. SupportCoordinator
HUMANRELATIONSOFFICER I
RECRUITMENT
FISCAL &ADMIN.
MANAGER (B-2)
ACCOUNTANTIII
DES. PRINCIPALASSISTANT
(ACCTS. REC.)
EXECUTIVE I(Records
Administrator)
EXECUTIVE I(PURCHASING)
OFFICESUPPORTASSIST.
(KEYBOARD)
OFFICESERVICESASSISTANT
ACCOUNTCLERK II
ADMIN. OFFICESUPPORT ASSIST.
(OFFICE MANAGER)(2)
Captain MSHPGaming Division
MSHPBackground/Enf.
(109)
PUBLIC SAFETYMANAGER B-1
(training)
PUBLIC SAFETYMANAGER B-1
(licensing)Financial Auditor
(4)
SR. OFFICESUPPORTASSIST.
(KEYBOARD)
(13)
PUBLICINFORMATIONCOORDINATOR
ACCOUNTANT II(licensing)
OFFICE SUPPORTASSIST.
(KEYBOARD)
(4)
FISCAL & ADMIN.MGR. B-1
(audit)
AUDITOR II(AIC)
INVESTIGATOR II(4)
PUBLIC SAFETYMANAGER B-1
(bingo)
ADMIN. OFFICESUPP. ASSIST.
SR. AUDITOR
AUDITOR I/II(2)
PUBLIC SAFETYMANAGER B-2
(GEM)
PUBLIC SAFETYMANAGER B-2
(GEM)
PUBLIC SAFETYMANAGER B-2
(GEM)
ADMIN.ANALYST III
DES.PRINCIPALASSISTANT
PERSONNELOFFICER I
PAYROLL/ BENEFITS
COMPUTERINFO. TECH.
SUPERVISOR II
MISSOURI GAMING COMMISSION
March 2005
FISCAL & ADMIN.MANAGER B-2
(audit)
SR. AUDITOR(EAST SUP.)
SR. AUDITOR(WEST SUP.)
AUDITOR II(AIC)
AUDITOR I(3)
AUDITOR ILaGrange
AUDITOR II(AIC)
AUDITOR I(3)
AUDITOR I(3)
AUDITOR I(2)
COMMISSIONERS(5)
ACCOUNTANTI
SR. OFFICESUPPORTASSIST.
(KEYBOARD)
SR. OFFICESUPPORTASSIST.
(KEYBOARD)
SR. OFFICESUPPORTASSIST.
(KEYBOARD)
OFFICESUPPORTASSIST.
(KEYBOARD)
AUDITOR II(AIC)
SR. OFFICESUPPORTASSIST.
(KEYBOARD)
OFFICESUPPORTASSIST.
(KEYBOARD)
EGDCoordinator
(2)
EGDSpecialist
(8) AUDITOR I Boonville
AUDITOR IIComplianceSupervisor
RESEARCHANALYST II
ADMIN.ANALYST II

2222
Gaming Market ReportIntroduction
In each year since 1999, the Commission has used this section to articulate its philosophy for managing Missouri’s commercial gaming market. Missouri statutes assign the Commission responsibility for determining the number, location and type of riverboat casinos.1 The statute also authorizes the Commission to issue licenses to applicants that best serve the interests of Missouri.2 During this period, the Commission has warned licensees, with progressive emphasis, that their failure to maintain a competitive facility will cause the Commission to consider proposals from other applicants in the market that are willing to develop facilities capable of maximizing the benefi ts a gaming license provides.
Realizing that downtown St. Louis lacked a casino development befi tting a city of its size and stature, St. Louis Mayor Francis Slay appeared before the Commission in May 2002 to request that it consider applications for new developments that would offer a destination attraction for downtown St. Louis.3 Mayor Slay’s comments and the city’s subsequent RFP process attracted two high quality proposals from Isle of Capri and Pinnacle Entertainment. While potential to recapture market share in downtown St. Louis currently being lost to Illinois was evident from both proposals, the Commission chose Pinnacle Entertainment’s multi-faceted entertainment complex as a priority for investigation.
The Commission also chose Pinnacle’s companion project at the beleaguered National Lead site in Lemay as a priority for investigation. While this project is challenging, the Commission ultimately viewed it as a rare opportunity to pull the Lemay area community out of a 20-year economic decline.4 The project faces many obstacles in order to gain suitable access, thus the Commission imposed strict conditions on the priority selection. To date, Pinnacle has been able to make signifi cant progress in obtaining the permits and approvals to build a road to the site. The September 1, 2005 due date for the fi rst set of conditions will occur while this report is being printed. The Commission will evaluate the company’s progress at that time and continue to keep you informed of developments in the regulatory process.
1 Section 313.812.1, RSMo
2 Section 313.805(1), RSMo.
3 The following is an excerpt from Mayor Slay’s testimony to the Commission on May 23, 2002: “Downtown is the public face to our city and indeed to our region. It is the biggest center of employment, the home of our sports teams, the place that is St. Louis. It is even now the primary center of our metropolitan area in image and reality.We believe that the unique combination of attractions, convention center, the major league sports venues, the historic Laclede’s Landing area, the Gateway Arch and grow-ing Washington Avenue loft district make downtown a magnet for tourists throughout the region, across the nation and around the world. Gaming should be a centerpiece of that effort. We believe the St. Louis Riverfront is the best site in the state for a fi rst-rate gaming facility with a hotel, quality restaurants and other entertainment attractions, but we do not have that on our riverfront right now. In comparison with other metropolitan areas, casino projects throughout the state, even in comparison with projects in much smaller areas, our location underachieves.In short, we want a fi rst-rate gaming facility with all the amenities that would make it a destination attraction. We are not in the City of St. Louis casino licensing experts. That is your job. The City of St. Louis will work with you, the President and anyone else to help reach the potential that I know we can reach.The City of St. Louis and State of Missouri want and deserve something much better. We are eager to work with developers that ensure that the area north of Laclede’s Land-ing becomes one of the premiere gaming sites and one of the premiere mixed use developments in the United States.”
2323
Statewide Market
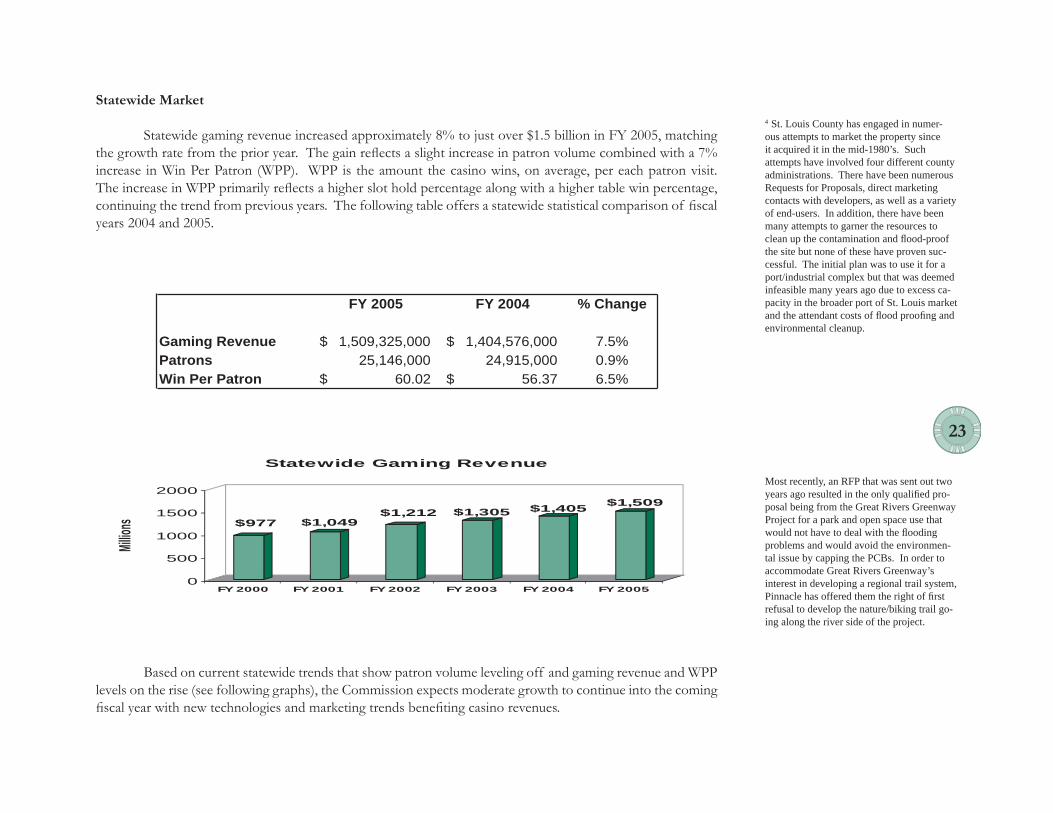
Statewide gaming revenue increased approximately 8% to just over $1.5 billion in FY 2005, matching the growth rate from the prior year. The gain refl ects a slight increase in patron volume combined with a 7% increase in Win Per Patron (WPP). WPP is the amount the casino wins, on average, per each patron visit. The increase in WPP primarily refl ects a higher slot hold percentage along with a higher table win percentage, continuing the trend from previous years. The following table offers a statewide statistical comparison of fi scal years 2004 and 2005.
$977 $1,049$1,212 $1,305 $1,405
$1,509
0
500
1000
1500
2000
Millio
ns
FY 2000 FY 2001 FY 2002 FY 2003 FY 2004 FY 2005
Statewide Gaming Revenue
FY 2005 FY 2004 % Change
Gaming Revenue 1,509,325,000$ 1,404,576,000$ 7.5%Patrons 25,146,000 24,915,000 0.9%Win Per Patron 60.02$ 56.37$ 6.5%
Based on current statewide trends that show patron volume leveling off and gaming revenue and WPP levels on the rise (see following graphs), the Commission expects moderate growth to continue into the coming fi scal year with new technologies and marketing trends benefi ting casino revenues.
4 St. Louis County has engaged in numer-ous attempts to market the property since it acquired it in the mid-1980’s. Such attempts have involved four different county administrations. There have been numerous Requests for Proposals, direct marketing contacts with developers, as well as a variety of end-users. In addition, there have been many attempts to garner the resources to clean up the contamination and fl ood-proof the site but none of these have proven suc-cessful. The initial plan was to use it for a port/industrial complex but that was deemed infeasible many years ago due to excess ca-pacity in the broader port of St. Louis market and the attendant costs of fl ood proofi ng and environmental cleanup.
Most recently, an RFP that was sent out two years ago resulted in the only qualifi ed pro-posal being from the Great Rivers Greenway Project for a park and open space use that would not have to deal with the fl ooding problems and would avoid the environmen-tal issue by capping the PCBs. In order to accommodate Great Rivers Greenway’s interest in developing a regional trail system, Pinnacle has offered them the right of fi rst refusal to develop the nature/biking trail go-ing along the river side of the project.

2424
Gaming Revenue Trend(trailing twelve months)
$1.30
$1.35
$1.40
$1.45
$1.50
$1.55
Jun-03Jul-0
3
Aug-03
Sep-03Oct-0
3
Nov-03
Dec-03
Jan-04
Feb-04
Mar-04
Apr-04
May-04
Jun-04Jul-0
4
Aug-04
Sep-04Oct-0
4
Nov-04
Dec-04
Jan-05
Feb-05
Mar-05
Apr-05
May-05
Jun-05
Billio
ns
Patron Volume Trend(trailing twelve months)
21.5
22.5
23.5
24.5
25.5
26.5
Jun-03Jul-0
3
Aug-03
Sep-03
Oct-03
Nov-03
Dec-03
Jan-04
Feb-04
Mar-04
Apr-04
May-04
Jun-04Jul-0
4
Aug-04
Sep-04
Oct-04
Nov-04
Dec-04
Jan-05
Feb-05
Mar-05
Apr-05
May-05
Jun-05
Mill
ions
WPP Trend(trailing twelve months)
$54$55$56$57$58$59$60
Jun-
03
Jul-0
3
Aug-
03
Sep-
03
Oct
-03
Nov-
03
Dec-
03
Jan-
04
Feb-
04
Mar
-04
Apr-0
4
May
-04
Jun-
04
Jul-0
4
Aug-
04
Sep-
04
Oct
-04
Nov-
04
Dec-
04
Jan-
05
Feb-
05
Mar
-05
Apr-0
5
May
-05
Jun-
05

2525
Kansas City Market
The Kansas City market posted gaming revenue of $681 million for the fi scal year, a 5% increase over the prior year. The gain refl ects an increase in patron volume as the momentum from the previous year expansions at many of the market’s casinos is still carrying forward. The Kansas City market will likely report moderate growth in the coming fi scal year as more expansion plans are in the works for Argosy and Harrah’s casinos.
$521 $545$596 $613 $649 $681
$0
$200
$400
$600
$800
Million
s
FY 2000 FY 2001 FY 2002 FY 2003 FY 2004 FY 2005
Kansas City Market Gaming Revenue
FY 2005 FY 2004 % Change
Gaming Revenue 680,482,000$ 649,317,000$ 4.8%Patrons 11,666,000 11,412,000 2.2%Win Per Patron 58.33$ 56.90$ 2.5%

2626
FY 2005 FY 2004 % ChangeMissouri BoatsGaming Revenue 670,020,000$ 611,262,000$ 9.6%
000,839,01snortaP 11,040,000 -0.9%Win Per Patron 61.26$ 55.37$ 10.6%
Illinois BoatsGaming Revenue 276,172,000$ 267,119,000$ 3.4%
000,845,3snortaP 3,534,000 0.4%Win Per Patron 77.84$ 75.59$ 3.0%
$411 $446$506 $553 $611
$670
0
200
400
600
800
Millio
ns
FY 2000 FY 2001 FY 2002 FY 2003 FY 2004 FY 2005
St. Louis Market Gaming RevenueMissouri Boats Only
St. Louis Market
The Missouri boats in the St. Louis market had another good year as gaming revenue increased 10% over the prior year, to $670 million. The gain primarily refl ects the increase in revenue despite a slight decrease in patron volume on a high WPP due primarily to the $85 million expansion at Harrah’s. This expansion included several new restaurants and a 211 room hotel tower. The St. Louis market will likely report steady growth in the coming year as the momentum carries from the added attractions at Harrah’s.
The Illinois boats in the St. Louis market posted gaming revenue of $276 million, a 3% increase over the prior year. They captured 29% of the gaming revenue in the St. Louis market, which is only a slight decrease from the previous year, but continues to indicate that the more superior facilities on the Missouri side are capturing the St. Louis market.

2727
Other Markets
In the out-state markets, gaming revenue increased a strong 10% to $159 million. The gain primarily refl ects the 12% increase in St. Joseph and the 13% increase in LaGrange due to Herbst Gaming, Inc. acquiring these properties from Grace Entertainment. New technologies and marketing strategies have increased the revenues at both facilities in comparison to the previous years. Also, new technologies have aided the revenue growth in Caruthersville by 18% over the prior year. The out-state markets will likely continue to post strong to moderate growth in the coming fi scal year as they continue to benefi t from the new technology used.
FY 2005 FY 2004 % Change
Gaming Revenue 158,822,000$ 143,996,000$ 10.3%Patrons 2,542,000 2,464,000 3.2%Win Per Patron 62.48$ 58.44$ 6.9%
$45 $49
$110$139 $144
$159
$0
$50
$100
$150
$200
Milli
ons
FY 2000 FY 2001 FY 2002 FY 2003 FY 2004 FY 2005
Other Market Gaming Revenue

282828
St. Joseph
St. Jo FrontierCasino N. Kansas City
Harrah'sN. Kansas City
La Grange
Mark TwainCasino
Riverside
ArgosyCasino
Kansas City
Isle of CapriCasino
Boonville
Isle of CapriCasino
St. Charles
AmeristarCasino
St. Charles
Kansas City
AmeristarCasino
Kansas City
Maryland Heights
Harrah'sSt. Louis
St. Louis Downtown
President CasinoLaclede'sLanding
Caruthersville
CasinoAztar
Licensed CasinoLocations

292929
Charitable GamingCharitable gaming includes licensed bingo and associated games such as pull-tabs, merchandise coin
boards and other “free” no charge promotional events. The operation of these games is restricted to qualifi ed licensed, religious, charitable, fraternal, veteran and service organizations. In addition, to qualify for the license, the organization must possess an Internal Revenue Service 501(c) (3), (4), (5), (7), (8), (10), (19), or 501 (d) exemption. Organizations must have been in continuing existence in this state for at least fi ve years preceding making of application and have had at least 20 bona fi de members during that period.
All proceeds derived from the conduct of bingo must be used for lawful, charitable, religious or philanthropic purposes of the organization, and no part of the net earnings may inure to the benefi t of any individual member of the organization.
The chart below refl ects the total number of licensees over the past three years.
TYPE OF LICENSE FY 03 FY 04 FY 05Regular Bingo 517 483 459Special Bingo (Valid for one event from 1 to 7 days) 350 361 309
Abbreviated Pull-Tab(Valid for 24 hours, limit 4 per calendar year) 141 142 131Supplier 7 7 7Manufacturer 13 13 12Hall Provider 151 141 131
05$esneciL ogniB ralugeR52$esneciL ogniB laicepS01$esneciL baT-lluP detaiverbbA
)lawener( 000,1$ )wen( 000,5$esneciL reilppuS)lawener( 005$ )wen( 000,1$esneciL rerutcafunaM
Hall Provider License - the fee is based on the number of occasions conducted on the premises
$150 (new per organization)$100 (renewal per organization)
The fees charged for the various licenses within the Charitable Games Division are as follows:

3030
The following chart represents the licensing fees collected for the past three fi scal years. The miscellaneous fees resulted in a negative, due to the transfer of interest charged on Supplier Tax Returns to the Proceeds for Education fund.
Type of License FY03 FY04 FY05Bingo Licenses 36,670$ 36,790$ 33,975$ Manf./Supplier Licenses 20,000$ 14,500$ 23,000$ Hall Provider Licenses 13,150$ 10,950$ 10,300$ Miscellaneous (statute book sales, directory sales, interest) $ 610 $ 524 (53)$
Total 70,430$ 62,764$ 67,222$
The current tax rate for bingo paper is 2/10ths of one cent per bingo face. The current tax rate for pull-tabs is 2% of the retail sales value of each pull-tab deal. The tax is remitted by the suppliers and is due by the last day of the month following the month the product was sold. The supplier retains 2% of the total due for the cost of collection. The following chart represents the bingo tax collected over the past three fi scal years. All bingo tax is deposited into the Proceeds for Education Fund.
Proceeds for Education FY03 FY04 FY05Supplier Tax 3,209,784$ 2,909,716$ 2,704,144$ Interest Earned 143,210$ 86,838$ 94,351$
TOTAL 3,352,994$ 2,996,554$ 2,798,495$
The Missouri Gaming Commission adopted one new bingo regulation in FY 2005. Regulation 11 CSR 45-30.035 provides a defi nition of a “bingo card” which matches the defi nition in Section 313.005(1), RSMo. In addition, several regulations have been rescinded and many were amended. These changes were made to the regulations in an attempt to further clarify various bingo requirements and also to simplify the regulations by combining language that was contained in more than one regulation. Some of the regulations, which had an immediate effect on the operators, were Regulation 11 CSR 45-30.060, which requires the operator to notify the Commission of the bingo chairperson. Regulation 11 CSR 45-30.175, now allows the operator to destroy such records as the pull-tab fl are,

3131
winning pull-tab tickets for $100 or more and winning bingo paper for $200 or more, after one year. They were previously required to retain this information for three years. Regulation 11 CSR 45-30.600 was amended to clarify that the downloading into an Electronic Bingo Card Monitoring Device must be completed prior to the drawing of the fi rst ball of a bingo game. Previously this was required to be done prior to the fi rst ball being drawn for the entire occasion.
The bingo section received 84 complaints, 62 of which were completed in the same year. The enforcement section conducted 20 inspections during FY 2005. The audit staff assisted the enforcement section with 11 of these inspections. The audit section conducted 132 additional audits, including bingo product manufacturers, suppliers and charity game operators. Although bingo operator audits and/or inspections are generally initiated by complaints from players or members of the organization, the audit section also conducts random audits of bingo operators who had never been contacted in person by Commission representatives. At the end of last fi scal year, the audit section began implementation of a new approach to auditing the bingo operators. Previously, most operator audits were unannounced audits conducted during the operators’ bingo occasions, which are usually held in the evening or on weekends. Although the audit staff was able to observe the conduct of the game, many times the necessary records needed to complete a full audit were unavailable that evening. This approach also limited the time the representatives of the organization had to spend with the staff to clarify questions or concerns. The audit staff has been setting appointments with the operators to meet with their representatives during the day to ensure the necessary records are available at the time of the audit. This allows the organization to ensure that the appropriate representatives are present to ask any questions and receive assistance in areas of concern to them. Although certain circumstances still require unannounced audits and/or inspections to observe the actual conduct of the game, the new approach has enabled us to increase the number of organizations we visit each year and has been much more effi cient and cost effective for the State of Missouri.
Bingo statutes and regulations establish due dates for suppliers, hall providers and bingo operators to submit renewal applications and quarterly reports. Failure to meet the established due dates result in a penalty being assessed in the amount of $5 per day. Penalties are also assessed in some disciplinary cases. The penalty is collected by the Bingo Division and then forwarded to the County Treasurer in the county where the company or organization is located for deposit in the county school fund. During FY 2005, the bingo section processed 198 penalties, which resulted in $20,140.00 additional funds for various schools throughout Missouri.
Offi cers and/or workers of charitable organizations participating in the management, conduct or operation of bingo may only participate, if they have never been convicted of a felony. The Commission performs a criminal background check on all names submitted to ensure that no felons are involved. During FY 2005, approximately 28,447 record checks were performed and a total of 32 convicted felons were identifi ed and excluded from participating in the management or operation of charitable games. The current number of convicted felons excluded from bingo, since 1994, is 666.

3232
Problem Gambling Public Health Model
The expansion of both legalized and illegal gambling opportunities challenges us to focus on the broad implications for both individual and community health. A public health model is well suited to address matters of healthy public policy, burden of illness, lifestyle behaviors and promotion of healthy decisions. Through seeking to understand the distribution and determinants of gambling problems in the general population and among subgroups, as well as the potential benefi ts, there is opportunity to develop effective strategies to protect vulnerable people, foster responsible choices with regard to gambling (for those who choose to participate in legal gambling activities) and improve the quality of community life. A multi-dimensional public health framework could stimulate a better understanding of gambling, help to illuminate the determinants of problem and pathological gambling, its potential consequences and the various opportunities for multi-level interventions.1 Like most public health issues, gambling involves a complex relationship among multiple determinants. When applied to gambling, the public health paradigm invites consideration of a broad array of prevention, harm minimization and treatment strategies targeting various elements of the model. Generally speaking, four steps are recommended:
1. Adopt strategic goals for gambling that provide a focus for public health action and accountability.
2. Endorse public health principles. The following are three primary principles: a. Ensure prevention is a community priority. b. Incorporate a multi-faceted mental health promotion approach. c. Foster personal and social responsibility for gambling policies and practices. 3. Adopt harm reduction strategies.
4. Allocate appropriate resources to identify and treat problem gamblers prior to their possible progression to pathological gambling.
The most cost effective way to assist potential problem gamblers and minimize the associated harms is to educate them about the risk factors so that those who are at risk either will choose to ab-stain from gambling or will make a concerted effort to follow the principles of gambling responsibly if they do choose to gamble, and they (or their family members) will at least recognize the symptoms of problem gambling early so that the individuals can work to avoid becoming engulfed by the condition. Problem gambling is not an issue that can be attacked on any one front. It requires the atten-tion, cooperation and resources of many public and private organizations. Only through a cooperative effort with other public agencies and providers of education and treatment services can this goal be effi ciently and effectively achieved.
1 Shaffer, H.J., & Korn, D.A. (2002). Gambling and Related Mental Disorders: A Public Health Analysis. Annual Review Pubic Health, vol. 23, p. 171-212

3333
Missouri’s Collaborative Approach – Missouri took its fi rst steps toward a proactive public health model for problem gambling with the formation of the Missouri Alliance to Curb Problem Gambling (Alliance) in 1997. The Alliance, of which the Missouri Gaming Commission is an active governing member, brings together diverse groups who share a common interest of working on issues relating to problem gambling and consists of both governing and participating members.2 Working together allows the members to streamline the provision of problem gambling programs and services, prevent duplication of efforts, and to be fi scally effi cient with state, public and private resources - maximizing the benefi t of each dollar available for problem gambling services.
The Alliance is a pivotal component in Missouri’s innovative and comprehensive program to address the public health implications of gambling and problem gambling following the steps recommended by Shafer and Korn. Missouri is recognized both nationally and internationally as a proactive leader in gambling problem services. Indeed, many other states and countries have emulated various components of Missouri’s multi-dimensional approach to problem gambling prevention, outreach, harm minimization and treatment, and have often expressed surprise at how much Missouri has accomplished with its limited budget.
Voluntary Exclusion Program – The Commission developed a unique voluntary exclusion program designed to provide problem gamblers with a means to acknowledge that they have a problem and to take personal responsibility for it. Although the Commission believes the voluntary exclusion program is helping many people who are suffering through a gambling problem, the Commission continues to review it and explore new ideas to get people the help they need.
This program was developed in 1996 in response to a request from a citizen who recognized the need for an external tool to self-exclude from all casinos in the state as a part of his recovery program. At that time, the consensus in the fi eld among treatment professionals and researchers was that there is no cure for pathological gambling and, therefore, the program should be for life with no provision for removal. The Commission has again received requests from residents seeking a problem gambling tool that better fi ts their needs. In response to these requests, as well as recent scientifi c research, Commission staff have been investigating revising the program to offer a “menu” of self-exclusion options. While the research and treatment community still advocate that pathological gamblers are unable to resume gambling activity in a responsible manner, recent research also indicates many individuals who experience problems from their gambling activity do not necessarily progress to the more extreme level of pathological gambling and may only experience episodic gambling problems during a traumatic life event, such as a divorce or loss of a loved one. These individuals could potentially benefi t greatly from a tool that allows them to self-exclude for a period of time while they work their way through their personal trauma.
Furthermore, there are also a number of pathological gamblers who have expressed that they are not yet ready to commit to a lifetime self-exclusion, but are interested in some other period of self-exclusion. Anecdotal evidence has shown that many of these individuals exclude with individual Class A licensees and later choose to place themselves on the List. Therefore, they too could benefi t from the availability of increased options for the self-exclusion period.
2 Governing members who share the responsibility of administering the Alliance programs include: the Missouri Department of Mental Health; the Missouri Gaming Commission; the Missouri Lottery; the Port Authority of Kansas City; the Missouri Riv-erboat Gaming Association, a private trade organization that represents riverboat casino operators; and the Missouri Council on Prob-lem Gambling Concerns, Inc., a non-profi t advocacy group for problem gamblers.
Participating members are non-voting mem-bers who desire to participate in Alliance activities and share their unique expertise and viewpoints to assist in comprehensively addressing problem gambling issues in the state. Participating members could include local government entities that host licensed gambling activities, private social service organizations, mental health advocates, researchers, counselors and counseling agen-cies, education institutions, consumer credit counseling agencies, charitable gaming operators and chambers of commerce.
For more information about the Alliance or becoming a participating member, please contact Melissa Stephens at 573-526-4080.
3434
The enhancements to the program also include a behavioral health education component targeting areas of vulnerability for problem gamblers and their family members, including building a healthier relationship with money through improving their fi scal literacy, identifying healthier coping strategies and teaching the individual to recognize and counteract their cognitive distortions about their gambling (and other high-risk) behaviors. This education component will provide problem gamblers and their loved ones an opportunity to learn how to make healthier choices about their behavioral lifestyles and choices.
There are currently more than 8,900 individuals on the List and approximately 145 applications are received each month. There was a 15 percent increase in applications for placement on the List of Disassociated Persons (also known as the Voluntary Exclusion Program) for FY 2005 over FY 2004. Indeed, more than 440 individuals initiated an application during the fourth quarter of FY 2005, a 21 percent increase over the same time period for the previous year. These appear to be statistically signifi cant since the projected increase was anticipated to be approximately seven percent. The Commission believes the increase in program access to result from expanded outreach efforts as well as intermittent and ongoing media coverage of the Commission’s current deliberations on the potential revision of the program.
Missouri Problem Gambling Research – The Department of Health and Senior Services added three questions on gambling to the 2004 BRFSS survey at the request of the Alliance. This annual survey is accomplished with support from the National Center for Chronic Disease Prevention and Health Promotion (CDC).3 The BRFSS is the world’s largest telephone survey; it tracks health risks in the United States. Information from the survey is used to improve the health of the American people. Since there has not yet been a statewide problem gambling prevalence study accomplished for Missouri, this was an important step to conduct at least a brief inspection of gambling and problem gambling activity by Missouri residents. The gambling questions used for the 2004 Missouri BRFSS were identifi ed from other states that have included them on their own state’s BRFSS for several years. The preliminary results from the 2004 BRFSS were received in June 2005 and indicated 31.7 percent of the surveyed Missouri adults acknowledged gambling in the prior 12 months. However, the Missouri Lottery’s market research results indicate more than 70 percent of Missouri adults reported purchasing a Lottery ticket in the past year.
Thus, rather than indicating that less than 1/3 of Missouri adults have gambled in the past year, this result supports the anecdotal evidence from the Alliance’s outreach efforts that many Missourians do not identify many locally-available and/or socially-accepted gambling activities as “gambling” and supports the need for continued education and outreach efforts. If a citizen does not recognize their activity as a gambling activity, they would be unlikely to identify any associated warning signs as an indication of a problem with gambling, and, therefore, would be less likely to access the appropriate resources for help.
3 Visit http://www.cdc.gov/brfss/index.htm for additional information about the BRFSS.

3535
Responsible Gaming Education Month (RGEM) – Governor Bob Holden offi cially proclaimed August 2004 Missouri Responsible Gaming Education Month and events for the awareness month included an educational exhibit at the 2004 Missouri Black Expo; an exhibit, two focus groups and an educational track on underage addiction prevention and problem gambling issues at the Statewide Prevention Conference; and hosting the Midwest Conference on Problem Gambling and Substance Abuse. Class A licensees also audited their own properties and the properties of their fellow members of the Missouri Riverboat Gaming Association to ensure full compliance with the American Gaming Association’s Code of Conduct for Responsible Gaming.4
Missouri is the only state, to our knowledge, to set aside one month to highlight awareness activities promoting problem gambling outreach and education. In 1999, Missouri was also the fi rst state in the country to set aside a week to promote responsible gaming and to educate its residents about the programs available to help problem gamblers. The response to the awareness week was so positive that awareness events gradually were held throughout the month. Thus, in 2003 the Alliance requested to expand from an awareness week to an awareness month. RGEW and RGEM have been extremely valuable tools to promote awareness of problem gambling as a public health issue. Although the Alliance provides outreach, presentations and exhibits throughout the year, the events that are provided within the context of a declared awareness month yield a much greater opportunity for media coverage and, therefore, reach many more citizens. The Alliance has been able to note spikes in the utilization of various problem gambling programs and services following each of the past RGEWs and RGEMs. The Missouri Gaming Commission and other members of the Alliance have been diligently working on the events that will be the highlights of Missouri Responsible Gaming Education Month. These events will include an exhibit, one focus group and an educational track on underage addiction prevention and problem gambling issues at the NCADA National Youth Leadership Conference in St. Louis; an educational exhibit at the 2005 Missouri Black Expo; and hosting the 2005 Midwest Conference on Problem Gambling and Substance Abuse. The Missouri Riverboat Gaming Association is also providing special training on problem gambling issues for employees at each Class A licensee and launching a new awareness campaign for patrons.
Midwest Conference on Problem Gambling and Substance Abuse – The 2004 Midwest Conference on Problem Gambling and Substance Abuse was a collaborative effort with representatives from a variety of state agencies and organizations in Iowa, Kansas and Nebraska to facilitate this regional conference and to jointly apply for a grant from the Substance Abuse and Mental Health Services Administration (SAMHSA), U.S. Department of Health and Human Services. The conference was well-received and resulted in not only expanding the awareness of problem gambling as a potential co-occurring disorder among mental health and substance abuse clients, but also in the assignment of problem gambling as a core issue for the Prairielands Addiction Transfer Technology Center (PATTC). Not long after PATTC was directed to be the lead ATTC on problem gambling issues, SAMHSA issued a mandate to all ATTCs to be prepared to provide information on problem gambling issues for their service areas.
4 The AGA Code of Conduct for Responsible Gaming was enacted September 2003 by the AGA Board of Directors. For more informa-tion, visit http://www.americangaming.org/programs/responsiblegaming/code_pub-lic.cfm

363636
Missouri is proud to have hosted the second Midwest Conference on Problem Gambling and Substance Abuse at the Hyatt Regency-Crown Center in Kansas City on August 24-26, 2005. Due to the success of the 2004 conference, SAMHSA chose to provide some discretionary funding to assist in funding the 2005 conference. The conference was opened with a plenary session on overcoming obstacles to outreach, treatment and recovery; this plenary session was open to the public at no cost. Registrations included attendees from throughout the U.S., as well as Canada and Sweden.5
National Conference on Problem Gambling – In June 2005, the National Council on Problem Gambling announced its selection of Missouri as the host state for the 2007 National Conference on Problem Gambling. The selection of Missouri to host the national conference was infl uenced by the key roles held by various members of the Missouri Alliance to Curb Problem Gambling in hosting the fi rst Midwest Conference on Problem Gambling and Substance Abuse (Midwest Conference) as a featured event of Missouri’s Responsible Gaming Education Month in August 2004, as well as the international reputation of both Missouri and the Alliance as proactive and innovative leaders in problem gambling programs for prevention, education/outreach and treatment.
Underage Prevention Efforts – The Alliance members jointly sponsor two in-school programs on preventing problem gambling and other addictive behaviors. Due to the common risk factors and warning signs between many of the addictive and compulsive behaviors, the need for schools to streamline their efforts on addiction education, as well as the reluctance to address problem gambling as a potential issue, the Alliance has created two innovative programs for middle-school and junior high students that use an “umbrella approach” to addressing addiction and high-risk behaviors. Both programs include extra information on problem gambling issues to help address the disparity in information and resources available. “Addiction – the Game No One Wins” is an assembly program featuring a dramatic duo who provide education on problem gambling issues.
Speakers Bureau and Traveling Educational Exhibits – The Missouri Gaming Commission participated in more than 24 speaking engagements and exhibits during FY 2005. Through these efforts Commission staff provided gambling outreach services to more than 700 individuals.
Speakers are available to provide presentations to groups and organizations throughout the state on a variety of topics relating to problem gambling and the guidelines for gambling responsibly.6 All presentations are free of charge and include information about the resources available in Missouri for residents who have a gambling problem, or loved one with a gambling problem.
5 Please visit the conference Web site at http://www.888betsoff.com/links/midwest_conference.shtm for a full list of present-ers, agenda items, sponsors and details on conference happenings.
6 To request a presentation or exhibit for an event in your area, please contact Melissa Stephens at 573-526-4080

373737
Appendix ContentsMissouri Gaming Commission Fund Balance Report – Fiscal Year 2005 ............ 38Fiscal Year 2005 Project Summary .................................................................................... 39Admission Fee Summary ..................................................................................................... 40Gaming Tax Summary .......................................................................................................... 41Ameristar – Kansas City ....................................................................................................... 42Ameristar – St. Charles ......................................................................................................... 44Argosy Riverside Casino ...................................................................................................... 46Aztar Casino – Caruthersville ............................................................................................. 48Harrah’s Maryland Heights ................................................................................................ 50 Harrah’s North Kansas City ............................................................................................... 52Isle of Capri – Boonville ...................................................................................................... 54Isle of Capri – Kansas City ................................................................................................. 56Mark Twain Casino – LaGrange ....................................................................................... 58President Casino on the Admiral ....................................................................................... 60St. Jo Frontier Casino ............................................................................................................ 62Home Dock Communities’ Use of Gaming Funds .................................................... 64City of Boonville ..................................................................................................................... 64City of Caruthersville ............................................................................................................ 65City of Kansas City ................................................................................................................ 66City of LaGrange ................................................................................................................... 67City of Maryland Heights ................................................................................................... 68City of North Kansas City ................................................................................................... 69City of Riverside ..................................................................................................................... 70City of St. Charles .................................................................................................................. 71City of St. Joseph .................................................................................................................... 72County of Buchanan ............................................................................................................. 73City of St. Louis ...................................................................................................................... 74Missouri Gaming Commission Actions – FY 2005 ...................................................... 75Contacting MGC .................................................................................................................... 76
Fiscal Year 2005
ReportAppendices

38
Beginning Balance--07/01/2004 $10,837,431.28
esnepxE noissimmoC gnimaGeuneveR sLicense Fees 47.598,739,8$seiralaS
37.733,498,4$stifeneB egnirF15.071,325$eeF noitacilppA esneciL gnimaG34.306,321$etatS-nI levarT00.579,33$eeF esneciL ogniB99.401,401$etatS-fo-tuO levarT00.003,01$esneciL redivorP llaH ogniB59.938,42$seitilitU & leuF00.000,41$esneciL reilppuS ogniB56.240,231$seilppuS00.000,9$esneciL rerutcafunaM ogniB04.096,16$tnempoleveD lanoisseforP00.000,62$eeF noitacilppA esneciL lanoitapuccO 1 leveL46.072,991$seilppuS & secivreS noitacinummoC00.057,552$eeF noitacilppA esneciL lanoitapuccO 2 leveL26.482,532$secivreS lanoisseforP00.051,9$eeF noitacilppA esneciL lanoitapuccO 2 leveL reilppuS08.931,81$secivreS rotinaJ & gnipeekesuoH00.001,51$laweneR esneciL lanoitapuccO launnA 2 leveL reilppuS93.913,98$secivreS riapeR & ecnanetniaM00.000,052$eeF laweneR esneciL gnimaG77.700,58$tnempiuqE retupmoC00.054,21$eeF laweneR esneciL lanoitapuccO 1 leveL08.819,41$tnempiuqE eciffO00.050,555$eeF laweneR esneciL lanoitapuccO 2 leveL89.890,2$tnempiuqE rehtO00.000,01$eeF noitacilppA esneciL reilppuS00.437,4$stnemevorpmI dna ytreporP28.087,011$eeF laweneR esneciL launnA reilppuS75.693,2$stnemyaP esaeL gnidliuB00.044,01$esneciL gnimaG tnemecalpeR73.679,2$sesaeL dna latneR tnempiuqE00.005,6$esneciL rouqiL
33.666,158,1$seeF esneciL latoT 67.016,604$stnemyaP esaeL gnidliuB81.628,81$sesnepxE suoenallecsiM77.890,853,51$sesnepxE CGM latoT
Other Expense & TransfersReimbursements 30.556,2$seiralaS rotiduA etatS
50.201$tnempiuqE & esnepxE rotiduA etatS29.858,21$dnuorgkcaB ynapmoC - tnemesrubmieR CGM25.442,721$seiralaS lareneG yenrottA00.434,041$dnuorgkcaB 1 leveL - tnemesrubmieR CGM00.366,38$ecnanetniaM elciheV PHSM35.632,86$dnuorgkcaB reilppuS - tnemesrubmieR CGM53.247,632$enilosaG PHSM60.356,987,7$tnemecrofnE - tnemesrubmieR CGM
15.281,110,8$stnemesrubmieR latoT MSHP Automotive Technical Personal Service $2,738.3232.215,92$emitrevO lacinhceT evitomotuA PHSM53.006,4$noitartsinimdA PHSM68.553,221$ecivreS lanosreP ymedacA PHSM83.288,131$tnempiuqE dna esnepxE ymedacA PHSM
Other Income 00.056,063$tnemecalpeR elciheV32.152,644$noisreviD truoC elinevuJ00.199,641,45$seeF noissimdA00.446,31$refsnarT snoitarepO gnisaeL39.224$emocnI evitartsinimdA noissimmoC gnimaG00.609,8$refsnarT ecnanetniaM gnidliuB eciffO etatS16.511$seeF ssentiW00.165,81$refsnarT paC sdnuF rehtO dna laredeF38.011,81$tseretnI stisopeD emiT51.143$srefsnarT ecnairaV dna noitcerroC gnicnaniF rehtO65.166,711$tseretnI seitiruceS ycnegA/SU
82.722$seitlaneP Total Other Expenses & Transfers $1,589,849.4755.771$tnemesrubmieR esnepxE lanosreP eeyolpmE81.976$ecnalaB dnuF ogniB fo ni refsnarT Appropriated Transfers
00.000,000,9$5002 YF dnuF tsurT IC noissimmoC snareteV00.438$sdnufeR rodneV00.000,000,5$5002 YF dnuF tsurT drauG lanoitaN iruossiM86.76$setabeR
26.782,582,45$emocnI rehtO latoT Missouri College Guarantee Fund Transfer FY 2005 $5,000,000.00Early Childhood Development Fund Transfer FY 2005 $26,750,006.14Early Childhood Development Fund Transfer FY 2004 $6,820,589.96Compulsive Gamblers Fund Transfer FY 2005 $472,704.00Compulsive Gamblers Fund Transfer FY 2004 $17,146.00Cost Allocation Plan Transfer to General Revenue $740,260.00
Total Appropriated Transfers $53,800,706.10
Total All Revenue $64,148,136.46 Total All Expenses & Transfers $70,748,654.34
Balance--Cash less Payables $4,236,913.40
04.319,632,4$**50/03/60--ecnalaB hsaC
Missouri Gaming Commission Fund ReportRevenue from Cash Receipts
Fiscal Year 2005 as of June 30, 2005
**On July 19, 2005 the remaining cash balance was distributed as follows: Early Childhood Development Education and Care Fund $4,219,767.40 and Compulsive Gambler Fund $17,146.00.

39
Fiscal Year 2005 Project Summary
GNIMAGDETAMITSEECAPSTOLSELBATLATIPACGNIMAGDETSUJDANOISSIMDAGNINEPONOITACOL / ONISAC
DATE ADMISSIONS FEES (a) GROSS RECEIPTS TAX (b) INVESTMENT * EMPLOYEES GAMES MACHINES (SQ FT)
President / St. Louis 27-May-94 3,552,354 7,104,708$ 71,371,201$ 14,274,240$ 75,900,000 646 $ 35 1,021 53,800
Ameristar / St. Charles 27-May-94 10,613,823 21,227,646 297,873,442 59,574,688 425,600,000 949,1 98 3,274 130,000
Argosy / Riverside 22-Jun-94 4,876,329 9,752,658 149,634,188 29,926,838 183,200,000 949 40 1,748 62,000
St. Jo Frontier / St. Joseph 24-Jun-94 991,685 1,983,370 26,713,282 5,342,656 18,000,000 372 12 594 18,000
Harrah's / North Kansas City 22-Sep-94 6,227,301 12,454,602 184,935,738 36,987,148 212,800,000 394,1 62 1,701 63,300
Aztar / Caruthersville 27-Apr-95 868,004 1,736,008 26,210,179 5,242,036 62,500,000 403 21 694 21,400
Isle of Capri / Kansas City 18-Oct-96 4,493,593 8,987,186 100,624,613 20,124,923 64,900,000 437 38 1,550 45,300
Ameristar / Kansas City 16-Jan-97 9,004,102 18,008,204 245,287,918 49,057,584 325,000,000 638,1 107 3,003 140,000
Harrah's - Maryland Heights 11-Mar-97 9,888,895 19,777,790 300,774,902 60,154,980 388,000,000 770,2 87 2,832 120,000
Isle of Capri / Boonville 06-Dec-01 2,673,604 5,347,208 76,730,366 15,346,073 67,200,000 206 33 898 28,000
Mark Twain / LaGrange 25-Jul-01 1,105,032 2,210,064 29,169,077 5,833,815 15,200,000 372 14 560 18,000
227,492,45SLATOT DNARG 108,589,444$ 1,509,324,905$ 301,864,981$ 1,838,300,000 631,11 $ 547 17,875 699,800
* Figures reflect the current operating property amounts carried on the casino balance sheet at cost.
(a) 50% of Admission Fees go to the State, with the remaining 50% to the Local Home Dock.
(b) 90% of Gaming Taxes go to the State, with the remaining 10% to the Local Home Dock.
The figures published in this report are subject to adjustment.

40
ADMISSION FEE SUMMARY
Fiscal Year Ended June 30, 2004
ETATSRATSIREMARATSIREMAIRPAC FO ELSIIRPAC FO ELSIS'HARRAHS'HARRAHMONTH ARGOSY AZTAR NKC MH KC BOONVILLE KC MARK TWAIN PRESIDENT SC ST. JO TOTAL
Jul-03 566,772 137,068 1,137,272 1,458,868 679,884 495,994 1,464,372 179,432 660,114 1,748,804 154,228 8,682,808Aug-03 575,990 137,244 1,325,618 1,505,110 677,320 535,844 1,631,244 182,104 688,332 1,853,614 160,630 9,273,050Sep-03 513,508 120,144 1,189,920 1,522,412 669,364 478,818 1,362,376 164,120 590,452 1,594,646 142,090 8,347,850Oct-03 522,934 123,366 1,139,992 1,570,006 667,054 473,334 1,512,384 167,650 577,178 1,637,820 145,984 8,537,702Nov-03 514,686 117,032 1,150,164 1,526,854 640,974 452,120 1,548,892 168,428 568,394 1,734,230 141,168 8,562,942Dec-03 905,122 112,966 1,128,930 1,435,362 683,288 412,046 1,474,452 157,792 546,768 1,723,846 139,358 8,719,930Jan-04 886,042 128,894 1,109,558 1,400,494 737,584 452,308 1,589,038 164,312 603,984 1,847,608 138,980 9,058,802Feb-04 858,054 137,092 1,077,444 1,429,384 728,506 464,534 1,528,214 175,790 624,910 1,847,732 145,762 9,017,422Mar-04 831,240 129,684 1,106,150 1,459,784 750,626 477,124 1,599,184 187,676 647,494 1,884,234 151,638 9,224,834Apr-04 778,478 121,888 1,061,134 1,423,740 703,620 442,060 1,475,776 173,014 600,150 1,737,566 142,842 8,660,268May-04 830,466 123,038 1,064,058 1,517,994 721,388 457,132 1,593,836 173,084 612,010 1,812,448 150,064 9,055,518Jun-04 785,954 114,630 928,032 1,447,894 736,786 432,748 1,489,404 167,424 598,652 1,679,468 143,654 8,524,646
TOTAL 8,569,246 1,503,046 13,418,272 17,697,902 8,396,394 5,574,062 18,269,172 2,060,826 7,318,438 21,102,016 1,756,398 105,665,772
ETAMONTH ARGOSY AZTAR NKC MH KC BOONVILLE KC MARK TWAIN * PRESIDENT SC ST. JO * TOTAL
Jul-04 839,970 137,912 1,078,816 1,741,954 833,266 522,698 1,690,134 187,434 672,826 1,887,106 154,892 9,747,008Aug-04 756,408 125,522 1,075,786 1,775,474 764,506 457,660 1,498,702 167,362 631,224 1,788,858 148,746 9,190,248Sep-04 730,064 138,082 1,028,762 1,743,492 753,426 458,236 1,396,006 163,096 626,118 1,777,364 142,362 8,957,008Oct-04 757,884 141,400 1,093,708 1,804,908 808,712 462,160 1,497,116 165,044 615,116 1,764,988 147,228 9,258,264Nov-04 693,930 128,374 977,952 1,703,312 722,298 410,236 1,394,152 157,986 567,686 1,730,766 135,062 8,621,754Dec-04 869,730 127,630 1,107,022 1,614,792 780,498 420,016 1,574,008 172,406 551,658 1,844,944 154,330 9,217,034Jan-05 884,412 152,898 996,124 1,576,448 714,326 430,812 1,487,762 163,658 571,138 1,785,828 146,154 8,909,560Feb-05 857,892 160,204 1,004,846 1,513,208 736,586 454,964 1,509,762 217,148 577,960 1,777,282 188,664 8,998,516Mar-05 870,454 153,752 1,087,396 1,599,318 782,540 476,004 1,549,692 214,058 619,350 1,827,786 185,918 9,366,268Apr-05 845,504 158,630 1,033,030 1,538,940 724,974 411,904 1,477,886 204,770 591,856 1,759,936 186,966 8,934,396May-05 842,514 158,192 991,184 1,582,448 704,928 422,298 1,481,028 201,318 550,110 1,694,288 200,460 8,828,768Jun-05 803,896 153,412 979,976 1,583,496 661,126 420,220 1,451,956 195,784 529,666 1,588,500 192,588 8,560,620
TOTAL 9,752,658 1,736,008 12,454,602 19,777,790 8,987,186 5,347,208 18,008,204 2,210,064 7,104,708 21,227,646 1,983,370 108,589,444
Fiscal Year Ended June 30, 2005
TSRATSIREMARATSIREMAIRPAC FO ELSIIRPAC FO ELSIS'HARRAHS'HARRAH
*Effective February 1, 2005, Herbst Gaming acquired Mark Twain and St. Jo Casinos

41
GAMING TAX SUMMARY
Fiscal Year Ended June 30, 2004
ETATSRATSIREMARATSIREMAIRPAC FO ELSIIRPAC FO ELSIS'HARRAHS'HARRAHMONTH ARGOSY AZTAR NKC MH KC BOONVILLE KC MARK TWAIN PRESIDENT SC ST. JO TOTAL
Jul-03 1,593,017 385,067 3,610,958 3,926,337 1,632,796 1,234,145 3,604,874 430,735 1,235,207 4,593,803 394,813 22,641,752Aug-03 1,652,241 396,812 3,966,934 4,270,411 1,592,400 1,302,271 3,985,127 433,283 1,320,530 4,964,380 431,375 24,315,763Sep-03 1,444,296 357,549 3,511,045 4,138,429 1,539,007 1,161,599 3,343,964 397,336 1,119,696 4,055,941 385,107 21,453,969Oct-03 1,496,522 369,099 3,429,599 4,361,031 1,589,227 1,207,889 3,708,671 393,396 1,162,233 4,360,044 371,045 22,448,757Nov-03 1,435,579 351,755 3,294,263 4,243,489 1,583,488 1,208,739 3,752,071 420,681 1,093,956 4,523,018 361,268 22,268,306Dec-03 2,155,263 336,725 3,220,005 4,148,432 1,551,715 1,078,654 3,462,538 398,528 1,096,936 4,560,845 396,121 22,405,762Jan-04 2,559,992 381,200 3,191,401 4,158,622 1,627,581 1,150,317 3,730,644 404,393 1,191,529 4,978,293 396,625 23,770,597Feb-04 2,559,002 425,938 3,135,014 4,330,693 1,917,071 1,253,284 3,828,979 453,530 1,292,310 5,025,489 404,645 24,625,955Mar-04 2,505,383 396,729 3,186,888 4,234,013 1,802,299 1,225,651 4,076,053 489,503 1,249,805 5,111,617 445,764 24,723,706Apr-04 2,445,961 357,526 3,206,690 4,302,422 1,739,176 1,177,688 3,833,608 449,601 1,241,694 4,936,098 407,545 24,098,009May-04 2,580,677 351,231 3,239,815 4,471,497 1,741,635 1,225,530 4,029,287 460,618 1,180,507 5,144,217 412,488 24,837,503Jun-04 2,372,585 327,515 2,873,955 4,348,936 1,705,081 1,189,804 3,819,120 428,072 1,184,632 4,695,397 380,102 23,325,197
TOTAL 24,800,518 4,437,146 39,866,566 50,934,313 20,021,475 14,415,572 45,174,936 5,159,676 14,369,035 56,949,141 4,786,898 280,915,275
TOTAL 29,926,838 5,242,036 36,987,148 60,154,980 20,124,923 15,346,073 49,057,584 5,833,815 14,274,240 59,574,688 5,342,656 301,864,981
ETATSMONTH ARGOSY AZTAR NKC MH KC BOONVILLE KC MARK TWAIN * PRESIDENT SC ST. JO * TOTAL
Jul-04 2,545,895 382,204 3,256,665 5,076,120 1,811,319 1,415,803 4,394,424 471,012 1,287,219 5,234,891 412,920 26,288,472Aug-04 2,425,576 384,712 3,116,605 5,012,429 1,889,809 1,315,139 3,955,883 444,627 1,204,534 4,760,613 396,108 24,906,034Sep-04 2,283,882 417,369 3,167,456 4,939,158 1,655,430 1,263,958 3,767,220 419,241 1,174,036 4,640,057 382,984 24,110,789Oct-04 2,381,321 443,778 3,177,216 5,187,888 1,707,754 1,313,786 4,066,718 449,398 1,235,886 4,809,062 422,891 25,195,700Nov-04 2,192,976 396,179 2,934,717 4,925,218 1,577,877 1,188,471 3,864,554 438,116 1,140,278 4,702,849 387,848 23,749,082Dec-04 2,501,309 376,280 3,296,304 4,960,466 1,598,100 1,188,078 4,127,989 463,505 1,126,273 4,979,277 423,661 25,041,242Jan-05 2,558,002 482,690 2,914,643 5,045,356 1,607,151 1,216,557 4,072,653 428,615 1,158,266 4,975,138 388,252 24,847,324Feb-05 2,576,034 491,493 2,894,194 4,673,307 1,548,662 1,259,737 3,865,931 589,669 1,173,299 4,898,070 549,893 24,520,288Mar-05 2,826,489 462,900 3,253,402 5,296,310 1,875,176 1,383,035 4,386,989 580,627 1,309,834 5,326,885 511,543 27,213,188Apr-05 2,735,080 489,328 3,170,873 5,005,721 1,590,275 1,265,519 4,286,527 549,154 1,262,452 5,255,103 477,985 26,088,018May-05 2,536,049 476,149 2,902,195 5,121,051 1,741,599 1,293,831 4,216,655 525,602 1,144,576 5,103,144 509,155 25,570,005Jun-05 2,364,226 438,955 2,902,879 4,911,956 1,521,770 1,242,161 4,052,041 474,247 1,057,589 4,889,599 479,417 24,334,839
Fiscal Year Ended June 30, 2005
RATSIREMAIRPAC FO ELSIIRPAC FO ELSIS'HARRAHS'HARRAH RATSIREMA
* Effective February 1, 2005, Herbst Gaming acquired Mark Twain and St. Jo Casinos

42
Ameristar - Kansas CityMonthly Gaming Revenue
$8.0
$10.0
$12.0
$14.0
$16.0
$18.0
$20.0
$22.0
$24.0
Jul Aug Sep Oct Nov Dec Jan Feb Mar Apr May JunM
illio
ns
FY 2004
FY 2005
Monthly Patrons
250
275
300
325
350
375
400
Jul Aug Sep Oct Nov Dec Jan Feb Mar Apr May Jun
Thou
sand
s
FY 2004
FY 2005
General Manager: David Albrecht3200 N Ameristar DriveKansas City, Missouri 64161(816) 414-7000
Date Licensed: December 19, 2000Gaming Space: 140,000 Square FeetElectronic Gaming Devices: 3,003Table Games: 107Buffet, (6) Specialty Restaurants, Deli and Food CourtParking Garage200 Room Hotel18 Screen Movie Theatre, Concert HallTotal Employee Compensation: $47,400,000Real Estate/Personal Property Tax: $4,918,000State Sales Tax: $2,265,000Charitable Donations: $518,000Total Employment: 1,836Minority Employment: 643Female Employment: 863
Ameristar KC had another solid year as gaming revenue increased 9% to $245 million, holding their market leadership position for another year. The gain can be attributed to a 9% increase in Win Per Pa-tron over the prior year, as well as benefi t-ing from the construction at other market casinos. Ameristar continues to post strong results and will likely show moder-ate growth in the coming fi scal year.

43
Fiscal year ended June 30, 2005
NIW YLIADNIW YLIADREP NIWTOLSTOLSELBATELBATLATOTMONTH AGR AGR WIN % AGR HOLD % PATRONS PATRON ADMISSIONS PER TABLE PER SLOT
Jul-04 $21,972,120 $2,949,303 21.89% $19,022,817 7.28% 389,990 $56.34 845,067 $919 $217Aug-04 $19,779,414 $2,710,166 23.20% $17,069,248 7.48% 350,058 $56.50 749,351 $844 $193Sep-04 $18,836,100 $2,575,870 23.68% $16,260,230 7.60% 321,643 $58.56 698,003 $802 $183Oct-04 $20,333,592 $2,676,067 23.02% $17,657,525 7.56% 342,011 $59.45 748,558 $834 $199Nov-04 $19,322,768 $2,840,290 25.32% $16,482,478 7.56% 315,183 $61.31 697,076 $885 $188Dec-04 $20,639,945 $2,972,226 23.42% $17,667,719 7.36% 352,603 $58.54 787,004 $926 $196Jan-05 $20,363,267 $2,676,943 23.46% $17,686,324 7.60% 329,435 $61.81 743,881 $834 $196Feb-05 $19,329,654 $2,572,075 23.08% $16,757,579 7.13% 339,467 $56.94 754,881 $801 $191Mar-05 $21,934,943 $2,711,370 23.34% $19,223,573 7.66% 351,982 $62.32 774,846 $845 $214Apr-05 $21,432,636 $2,481,032 22.80% $18,951,604 7.91% 333,963 $64.18 738,943 $773 $211May-05 $21,083,273 $2,451,939 22.75% $18,631,333 7.69% 344,331 $61.23 740,514 $764 $206Jun-05 $20,260,207 $2,182,673 20.80% $18,077,534 7.92% 336,855 $60.15 725,978 $680 $201
TOTALS $245,287,918 $31,799,952 23.06% $213,487,965 7.56% 4,107,521 $59.72 9,004,102 $826 $200
Fiscal year ended June 30, 2004
NIW YLIADNIW YLIADREP NIWTOLSTOLSELBATELBATLATOTMONTH AGR AGR WIN % AGR HOLD % PATRONS PATRON ADMISSIONS PER TABLE PER SLOT
Jul-03 $18,024,371 $2,581,596 21.64% $15,442,775 7.10% 334,301 $53.92 732,186 $812 $182Aug-03 $19,925,633 $3,120,718 23.99% $16,804,916 7.38% 365,937 $54.45 815,622 $981 $190Sep-03 $16,719,819 $2,687,686 24.21% $14,032,134 7.07% 308,328 $54.23 681,188 $845 $159Oct-03 $18,543,353 $2,767,208 23.40% $15,776,145 7.15% 340,132 $54.52 756,192 $878 $178Nov-03 $18,760,354 $3,079,321 24.83% $15,681,034 7.01% 340,721 $55.06 774,446 $978 $179Dec-03 $17,312,691 $2,858,074 23.17% $14,454,617 6.98% 330,026 $52.46 737,226 $907 $164Jan-04 $18,653,219 $3,006,216 23.96% $15,647,004 6.65% 346,014 $53.91 794,519 $954 $177Feb-04 $19,144,896 $2,855,768 23.90% $16,289,128 7.20% 340,038 $56.30 764,107 $907 $185Mar-04 $20,380,266 $3,161,117 24.58% $17,219,149 7.23% 363,682 $56.04 799,592 $1,004 $195Apr-04 $19,168,041 $2,831,949 24.62% $16,336,092 7.33% 334,541 $57.30 737,888 $882 $186May-04 $20,146,437 $2,614,274 21.00% $17,532,164 7.32% 360,243 $55.92 796,918 $814 $200Jun-04 $19,095,598 $2,418,428 20.49% $16,677,170 7.34% 346,578 $55.10 744,702 $753 $190
TOTALS $225,874,679 $33,982,352 23.32% $191,892,327 7.15% 4,110,541 $54.95 9,134,586 $893 $182

44
Monthly Gaming Revenue
$10.0
$12.0
$14.0
$16.0
$18.0
$20.0
$22.0
$24.0
$26.0
$28.0
Jul Aug Sep Oct Nov Dec Jan Feb Mar Apr May JunM
illio
ns
FY 2004
FY 2005
Monthly Patrons
150
200
250
300
350
400
450
Jul Aug Sep Oct Nov Dec Jan Feb Mar Apr May Jun
Thou
sand
s
FY 2004
FY 2005
General Manager: Jim Franke1260 South Main StreetSt. Charles, Missouri 63301(636) 940-4300
Date Licensed: December 19, 2000Gaming Space: 130,000 Square FeetElectronic Gaming Devices: 3,274Table Games: 98Buffet, (6) Specialty Restaurants and DeliParking GarageTotal Employee Compensation: $46,320,000Real Estate/Personal Property Tax: $4,029,000State Sales Tax: $1,685,000Charitable Donations: $365,500Total Employment: 1,949Minority Employment: 567Female Employment: 922
Ameristar - St. Charles
Ameristar SC showed moderate growth as gaming revenue increased 5% to $297 million, despite fl at results on patron volume. The gain refl ects a higher slot hold percentage combined with a slightly higher slot volume per patron. Ameristar contin-ues to benefi t from the many amenities they offer and will likely continue the trend of moderate growth in the coming fi scal year.

45
Fiscal year ended June 30, 2005
NIW YLIADNIW YLIADREP NIWTOLSTOLSELBATELBATLATOTMONTH AGR AGR WIN % AGR HOLD % PATRONS PATRON ADMISSIONS PER TABLE PER SLOT
Jul-04 $26,174,454 $2,677,491 22.47% $23,496,963 7.33% 419,771 $62.35 943,553 $1,026 $238Aug-04 $23,803,066 $2,360,255 22.56% $21,442,811 7.34% 388,047 $61.34 894,429 $904 $218Sep-04 $23,200,283 $2,338,419 23.65% $20,861,864 7.61% 370,356 $62.64 888,682 $896 $212Oct-04 $24,045,312 $2,385,386 22.79% $21,659,926 7.78% 375,111 $64.10 882,494 $914 $220Nov-04 $23,514,246 $2,418,506 23.04% $21,095,740 7.71% 363,345 $64.72 865,383 $927 $215Dec-04 $24,896,383 $2,697,311 24.21% $22,199,072 7.62% 384,884 $64.69 922,472 $1,033 $226Jan-05 $24,875,692 $2,667,176 24.73% $22,208,516 7.73% 374,924 $66.35 892,914 $1,022 $225Feb-05 $24,490,350 $2,577,737 24.04% $21,912,613 7.55% 377,293 $64.91 888,641 $988 $225Mar-05 $26,634,423 $2,464,493 21.27% $24,169,931 7.80% 398,280 $66.87 913,893 $830 $248Apr-05 $26,275,516 $2,350,377 20.81% $23,925,139 7.75% 379,258 $69.28 879,968 $799 $245May-05 $25,515,720 $2,389,992 23.31% $23,125,728 7.91% 379,357 $67.26 847,144 $821 $235Jun-05 $24,447,997 $2,117,106 21.75% $22,330,891 8.12% 360,276 $67.86 794,250 $720 $227
TOTALS $297,873,442 $29,444,249 22.87% $268,429,193 7.68% 4,570,902 $65.17 10,613,823 $907 $228
Fiscal year ended June 30, 2004
NIW YLIADNIW YLIADREP NIWTOLSTOLSELBATELBATLATOTMONTH AGR AGR WIN % AGR HOLD % PATRONS PATRON ADMISSIONS PER TABLE PER SLOT
Jul-03 $22,969,016 $2,663,896 24.37% $20,305,121 7.14% 384,563 $59.73 874,402 $897 $205Aug-03 $24,821,901 $2,714,629 23.16% $22,107,273 7.42% 404,840 $61.31 926,807 $923 $223Sep-03 $20,279,703 $2,146,727 22.27% $18,132,976 7.12% 351,171 $57.75 797,323 $832 $189Oct-03 $21,800,221 $1,966,360 19.69% $19,833,861 7.31% 357,592 $60.96 818,910 $762 $207Nov-03 $22,615,089 $2,625,440 24.84% $19,989,649 7.17% 369,273 $61.24 867,115 $1,018 $208Dec-03 $22,804,223 $2,604,322 23.94% $20,199,901 7.17% 369,414 $61.73 861,923 $1,009 $204Jan-04 $24,891,464 $2,807,752 24.67% $22,083,712 7.35% 385,388 $64.59 923,804 $1,088 $222Feb-04 $25,127,443 $2,703,125 24.03% $22,424,319 7.30% 389,268 $64.55 923,866 $1,170 $228Mar-04 $25,558,083 $2,635,711 22.45% $22,922,372 7.18% 410,150 $62.31 942,117 $998 $233Apr-04 $24,680,490 $2,649,410 24.47% $22,031,080 7.36% 382,135 $64.59 868,783 $1,004 $225May-04 $25,721,086 $2,492,783 22.25% $23,228,303 7.29% 403,653 $63.72 906,224 $955 $238Jun-04 $23,476,984 $2,368,260 22.98% $21,108,724 7.32% 378,552 $62.02 839,734 $907 $214
TOTALS $284,745,704 $30,378,415 23.29% $254,367,289 7.26% 4,585,999 $62.09 10,551,008 $964 $216

46
Argosy Riverside CasinoMonthly Gaming Revenue
$6.5
$7.5
$8.5
$9.5
$10.5
$11.5
$12.5
$13.5
$14.5
$15.5
Jul Aug Sep Oct Nov Dec Jan Feb Mar Apr May JunM
illio
ns
FY 2004
FY 2005
Monthly Patrons
110
120
130
140
150
160
170
180
190
200
210
220
Jul Aug Sep Oct Nov Dec Jan Feb Mar Apr May Jun
Thou
sand
s
FY 2004
FY 2005
General Manager: Gary Johnson777 NW Argosy ParkwayRiverside, Missouri 64150(816) 746-3100
Date Licensed: June 22, 1994Gaming Space: 62,000 Square FeetElectronic Gaming Devices: 1,748Table Games: 40Buffet, (2) specialty restaurants, Deli and Coffee HouseMeeting Space: 11,000 Square FeetParking GarageTotal Employee Compensation: $27,400,000Real Estate/Personal Property Tax: $2,231,000State Sales Tax: $421,000City Lease Payments: $4,486,000Charitable Donations: $23,000Total Employment: 949Minority Employment: 324Female Employment: 486
Argosy posted strong results as the mo-mentum from the prior year’s expansion continued. The prior year’s predictions were realized as gaming revenue increased 21% to approximately $150 million, and their market share climbed from 19% to 22%. Argosy has begun an additional $75 million expansion project, featuring a 250 room hotel and a 1,400 space parking garage.

47
Fiscal year ended June 30, 2005
NIW YLIADNIW YLIADREP NIWTOLSTOLSELBATELBATLATOTMONTH AGR AGR WIN % AGR HOLD % PATRONS PATRON ADMISSIONS PER TABLE PER SLOT
Jul-04 $12,729,476 $1,724,267 22.72% $11,005,209 7.01% 196,867 $64.66 419,985 $1,249 $210Aug-04 $12,127,881 $1,555,083 22.80% $10,572,798 7.16% 178,312 $68.01 378,204 $1,127 $201Sep-04 $11,419,411 $1,411,574 21.31% $10,007,836 7.08% 174,884 $65.30 365,032 $1,023 $191Oct-04 $11,906,606 $1,439,282 21.11% $10,467,323 7.09% 180,300 $66.04 378,942 $1,043 $199Nov-04 $10,964,878 $1,459,888 22.49% $9,504,990 7.17% 164,602 $66.61 346,965 $1,106 $180Dec-04 $12,506,543 $1,657,247 23.01% $10,849,296 7.30% 180,754 $69.19 434,865 $1,255 $205Jan-05 $12,790,008 $1,580,323 22.63% $11,209,685 7.10% 197,408 $64.79 442,206 $1,317 $212Feb-05 $12,880,169 $1,397,834 20.45% $11,482,335 6.94% 203,009 $63.45 428,946 $1,165 $218Mar-05 $14,132,443 $1,675,810 22.78% $12,456,634 7.27% 207,692 $68.05 435,227 $1,397 $236Apr-05 $13,675,400 $1,620,814 23.55% $12,054,586 7.37% 200,624 $68.16 422,752 $1,351 $229May-05 $12,680,243 $1,582,726 23.89% $11,097,517 7.00% 199,374 $63.60 421,257 $1,319 $212Jun-05 $11,821,129 $1,533,060 23.63% $10,288,070 7.43% 182,574 $64.75 401,948 $1,278 $196
TOTALS $149,634,188 $18,637,908 22.53% $130,996,280 7.16% 2,266,400 $66.02 4,876,329 $1,219 $207
Fiscal year ended June 30, 2004
NIW YLIADNIW YLIADREP NIWTOLSTOLSELBATELBATLATOTMONTH AGR AGR WIN % AGR HOLD % PATRONS PATRON ADMISSIONS PER TABLE PER SLOT
Jul-03 $7,965,085 $935,354 23.52% $7,029,731 6.13% 131,279 $60.67 283,386 $1,039 $208Aug-03 $8,261,205 $874,496 20.50% $7,386,709 6.20% 132,258 $62.46 287,995 $972 $219Sep-03 $7,221,482 $761,059 20.28% $6,460,423 6.14% 119,275 $60.54 256,754 $846 $191Oct-03 $7,482,612 $820,921 21.20% $6,661,691 6.20% 121,518 $61.58 261,467 $912 $197Nov-03 $7,177,895 $913,504 23.07% $6,264,391 6.11% 117,849 $60.91 257,343 $1,450 $245Dec-03 $10,776,313 $1,411,009 20.21% $9,365,304 6.62% 185,069 $58.23 452,561 $1,120 $178Jan-04 $12,799,962 $1,724,193 21.48% $11,075,769 7.25% 201,576 $63.50 443,021 $1,368 $211Feb-04 $12,795,011 $1,590,444 21.23% $11,204,567 7.26% 198,247 $64.54 429,027 $1,262 $213Mar-04 $12,526,915 $1,569,773 20.39% $10,957,142 6.97% 192,253 $65.16 415,620 $1,138 $209Apr-04 $12,229,803 $1,405,376 19.47% $10,824,427 7.14% 178,806 $68.40 389,239 $997 $206May-04 $12,903,383 $1,656,186 22.56% $11,247,197 7.07% 193,761 $66.59 415,233 $1,200 $214Jun-04 $11,862,926 $1,169,482 16.98% $10,693,444 7.09% 185,024 $64.12 392,977 $847 $204
TOTALS $124,002,591 $14,831,796 20.75% $109,170,795 6.75% 1,956,915 $63.37 4,284,623 $1,096 $208

48
Aztar Casino - CaruthersvilleMonthly Gaming Revenue
$1.4
$1.6
$1.8
$2.0
$2.2
$2.4
$2.6
Jul Aug Sep Oct Nov Dec Jan Feb Mar Apr May JunM
illio
ns
FY 2004
FY 2005
Monthly Patrons
24
26
28
30
32
34
36
38
Jul Aug Sep Oct Nov Dec Jan Feb Mar Apr May Jun
Thou
sand
s
FY 2004
FY 2005
General Manager: Vacant777 E 3rd StreetCaruthersville, Missouri 63830(573) 333-1000
Date Licensed: April 27, 1995Gaming Space: 21,400 Square FeetElectronic Gaming Devices: 694Table Games: 21(1) Specialty RestaurantRV Park (27-Space)Total Employee Compensation: $6,800,000Real Estate/Personal Property Tax: $383,600State Sales Tax: $77,400City Lease Payments: $100,000Charitable Donations: $31,000Total Employment: 304Minority Employment: 78Female Employment: 182
Aztar in Caruthersville turned things around this year, utilizing new slot tech-nologies and the popularity of new poker rooms. They reported a gaming revenue increase of 18% to $26 million, com-bined with a nearly 9% increase in patron volume. They continue to report the highest slot hold percentage of 10.7% in the state.

49
Fiscal year ended June 30, 2005
NIW YLIADNIW YLIADREP NIWTOLSTOLSELBATELBATLATOTMONTH AGR AGR WIN % AGR HOLD % PATRONS PATRON ADMISSIONS PER TABLE PER SLOT
Jul-04 $1,911,021 $353,634 24.82% $1,557,387 10.41% 32,331 $59.11 68,956 $842 $74Aug-04 $1,923,558 $309,813 23.38% $1,613,745 11.28% 28,720 $66.98 62,761 $738 $77Sep-04 $2,086,843 $365,469 29.39% $1,721,374 11.28% 31,516 $66.22 69,041 $677 $82Oct-04 $2,218,889 $508,664 37.17% $1,710,225 10.98% 30,966 $71.66 70,700 $942 $81Nov-04 $1,980,893 $419,411 32.06% $1,561,482 10.84% 27,913 $70.97 64,187 $777 $74Dec-04 $1,881,400 $366,750 27.66% $1,514,650 10.46% 27,630 $68.09 63,815 $643 $72Jan-05 $2,413,452 $488,779 30.70% $1,924,673 10.45% 31,917 $75.62 76,449 $858 $93Feb-05 $2,457,463 $439,878 28.64% $2,017,585 10.33% 34,249 $71.75 80,102 $772 $97Mar-05 $2,314,501 $421,196 28.65% $1,893,305 10.33% 32,672 $70.84 76,876 $739 $90Apr-05 $2,446,640 $434,300 28.75% $2,012,340 10.53% 33,588 $72.84 79,315 $689 $98May-05 $2,380,745 $352,126 26.44% $2,028,620 10.93% 34,808 $68.40 79,096 $559 $96Jun-05 $2,194,774 $353,382 25.60% $1,841,392 10.45% 33,730 $65.07 76,706 $561 $88
TOTALS $26,210,179 $4,813,401 28.62% $21,396,778 10.67% 380,040 $68.97 868,004 $733 $85
Fiscal year ended June 30, 2004
NIW YLIADNIW YLIADREP NIWTOLSTOLSELBATELBATLATOTMONTH AGR AGR WIN % AGR HOLD % PATRONS PATRON ADMISSIONS PER TABLE PER SLOT
Jul-03 $1,925,334 $355,937 25.28% $1,569,397 9.88% 32,758 $58.77 68,534 $847 $74Aug-03 $1,984,059 $371,881 25.55% $1,612,178 10.31% 32,365 $61.30 68,622 $885 $79Sep-03 $1,787,745 $350,970 28.54% $1,436,775 10.22% 28,606 $62.50 60,072 $836 $69Oct-03 $1,845,497 $353,584 26.65% $1,491,913 10.28% 29,098 $63.42 61,683 $842 $72Nov-03 $1,758,777 $364,404 27.85% $1,394,373 10.01% 26,953 $65.25 58,516 $868 $67Dec-03 $1,683,625 $358,538 26.52% $1,325,087 10.23% 25,864 $65.10 56,483 $854 $63Jan-04 $1,906,001 $359,951 23.84% $1,546,050 10.37% 29,104 $65.49 64,447 $857 $74Feb-04 $2,129,688 $441,225 29.33% $1,688,463 10.63% 31,288 $68.07 68,546 $1,051 $80Mar-04 $1,983,646 $425,262 28.12% $1,558,384 10.40% 30,035 $66.04 64,842 $1,013 $74Apr-04 $1,787,628 $369,649 25.54% $1,417,979 10.13% 28,088 $63.64 60,944 $880 $67May-04 $1,756,155 $283,497 20.86% $1,472,658 10.33% 28,354 $61.94 61,519 $675 $70Jun-04 $1,637,573 $291,693 23.97% $1,345,880 10.49% 27,093 $60.44 57,315 $695 $64
TOTALS $22,185,729 $4,326,591 26.02% $17,859,138 10.27% 349,606 $63.46 751,523 $858 $71

50
Harrah’s Maryland HeightsMonthly Gaming Revenue
$14.0
$16.0
$18.0
$20.0
$22.0
$24.0
$26.0
$28.0
Jul Aug Sep Oct Nov Dec Jan Feb Mar Apr May JunM
illio
ns
FY 2004
FY 2005
Monthly Patrons
200
250
300
350
400
450
500
550
Jul Aug Sep Oct Nov Dec Jan Feb Mar Apr May Jun
Thou
sand
s
FY 2004
FY 2005
General Manager: Bill Keena777 Casino Center DriveMaryland Heights, Missouri 63146(314) 770-8100
Date Licensed: March 11, 1997Gaming Space: 120,000 Square Feet Electronic Gaming Devices: 2,832Table Games: 87Buffet, (3) Specialty Restaurants, Noodle Bar, Coffee House and Deli502 Room HotelMeeting SpaceParking GarageTotal Employee Compensation: $55,300,000Real Estate/Personal Property Tax: $5,010,000State Sales Tax: $1,818,000Charitable Donations: $33,000Total Employment: 2,077Minority Employment: 739Female Employment: 1,045
Harrah’s MH posted strong results as gam-ing revenue increased 18% to over $300 million, despite a slight decrease in patron volume. This gain can likely be attributed to an increase of nearly 20% in Win Per Patron over the prior year. Also, Harrah’s opened an $85 million expansion, which includes a 211 room hotel, several new restaurants and additional meeting space.

51
Fiscal year ended June 30, 2005
NIW YLIADNIW YLIADREP NIWTOLSTOLSELBATELBATLATOTMONTH AGR AGR WIN % AGR HOLD % PATRONS PATRON ADMISSIONS PER TABLE PER SLOT
Jul-04 $25,380,602 $2,937,183 21.75% $22,443,419 7.81% 476,157 $53.30 870,977 $1,239 $279Aug-04 $25,062,143 $3,177,869 24.04% $21,884,274 7.64% 485,907 $51.58 887,737 $1,308 $271Sep-04 $24,695,790 $2,836,839 21.98% $21,858,952 7.99% 461,459 $53.52 871,746 $1,167 $271Oct-04 $25,939,440 $3,165,111 24.01% $22,774,329 8.05% 469,836 $55.21 902,454 $1,303 $282Nov-04 $24,626,092 $3,182,498 24.12% $21,443,595 7.90% 441,602 $55.77 851,656 $1,310 $267Dec-04 $24,802,331 $3,468,353 24.57% $21,333,978 7.79% 369,382 $67.15 807,396 $1,427 $256Jan-05 $25,226,780 $3,043,880 23.42% $22,182,900 8.36% 338,633 $74.50 788,224 $1,253 $268Feb-05 $23,366,537 $3,084,559 24.34% $20,281,978 7.65% 333,451 $70.07 756,604 $1,269 $271Mar-05 $26,481,552 $3,469,162 25.60% $23,012,389 8.17% 359,406 $73.68 799,659 $1,428 $318Apr-05 $25,028,603 $3,009,631 23.24% $22,018,973 8.08% 335,698 $74.56 769,470 $1,254 $296May-05 $25,605,254 $3,191,893 25.25% $22,413,361 8.22% 358,921 $71.34 791,224 $1,195 $283Jun-05 $24,559,778 $2,634,490 21.20% $21,925,287 8.23% 361,588 $67.92 791,748 $1,009 $258
TOTALS $300,774,902 $37,201,466 23.64% $263,573,435 7.99% 4,792,040 $62.77 9,888,895 $1,264 $277
Fiscal year ended June 30, 2004
NIW YLIADNIW YLIADREP NIWTOLSTOLSELBATELBATLATOTMONTH AGR AGR WIN % AGR HOLD % PATRONS PATRON ADMISSIONS PER TABLE PER SLOT
Jul-03 $19,631,685 $2,255,509 20.13% $17,376,175 7.25% 401,666 $48.88 729,434 $1,274 $223Aug-03 $21,352,055 $2,268,042 19.78% $19,084,014 7.68% 412,012 $51.82 752,555 $1,326 $246Sep-03 $20,692,147 $2,260,155 20.28% $18,431,993 7.55% 425,898 $48.58 761,206 $1,299 $242Oct-03 $21,805,156 $2,348,828 20.31% $19,456,328 7.66% 434,803 $50.15 785,003 $1,350 $256Nov-03 $21,217,443 $2,145,172 17.45% $19,072,271 7.59% 418,472 $50.70 763,427 $1,192 $250Dec-03 $20,742,160 $2,661,378 21.53% $18,080,782 7.58% 391,221 $53.02 717,681 $1,431 $230Jan-04 $20,793,109 $2,657,436 21.88% $18,135,673 7.53% 374,610 $55.51 700,247 $1,429 $231Feb-04 $21,653,466 $2,736,169 23.69% $18,917,297 7.66% 385,170 $56.22 714,692 $1,471 $241Mar-04 $21,170,065 $2,685,584 21.81% $18,484,481 7.29% 398,684 $53.10 729,892 $1,444 $236Apr-04 $21,512,110 $2,521,714 21.56% $18,990,395 7.61% 388,614 $55.36 711,870 $1,356 $242May-04 $22,357,487 $2,681,062 21.60% $19,676,424 7.41% 419,463 $53.30 758,997 $1,441 $251Jun-04 $21,744,681 $2,435,396 21.67% $19,309,285 7.81% 402,554 $54.02 723,947 $1,309 $243
TOTALS $254,671,564 $29,656,445 20.97% $225,015,118 7.55% 4,853,167 $52.48 8,848,951 $1,360 $241

52
Harrah’s North Kansas CityMonthly Gaming RevenueMonthly Gaming Revenue
$12.0$12.0
$14.0$14.0
$16.0$16.0
$18.0$18.0
$20.0$20.0
$22.0$22.0
$24.0$24.0
JuJul AuAug SeSep OcOct NoNov DeDec JaJan FeFeb MaMar ApApr MaMay JunJun
Mill
ions
FY 2004FY 2004
FY 2005FY 2005
Monthly PatronsMonthly Patrons
200200
220220
240240
260260
280280
300300
320320
JuJul AuAug SeSep OcOct NoNov DeDec JaJan FeFeb MaMar ApApr MaMay JunJun
Thou
sand
s
FY 2004FY 2004
FY 2005FY 2005
General Manager: Thomas CookOne Riverboat DriveNorth Kansas City, Missouri 64116(816) 472-7777
Date Licensed: September 22, 1994Gaming Space: 63,300 Square FeetElectronic Gaming Devices: 1,701Table Games: 62Buffet, (3) Specialty Restaurants200 Room HotelMeeting Space: 10,000 Square FeetParking GarageTotal Employee Compensation: $38,400,000Real Estate/Personal Property Tax: $2,408,000State Sales Tax: $1,165,000City Lease Payments: $3,749,000Charitable Donations: $123,000Total Employment: 1,493Minority Employment: 491Female Employment: 744
Harrah’s NKC reported weak results as they continued to feel the impact of the Argosy expansion and were in the process of their own improvements. The new ex-pansion features an additional hotel tower and new parking garage. Gaming revenue fell 7% to $185 million, along with a 5% decrease in patron volume. Harrah’s an-ticipates the added expansion to increase their market share in the coming year.

53
Fiscal year ended June 30, 2005
NIW YLIADNIW YLIADREP NIWTOLSTOLSELBATELBATLATOTMONTH AGR AGR WIN % AGR HOLD % PATRONS PATRON ADMISSIONS PER TABLE PER SLOT
Jul-04 $16,283,324 $2,195,573 22.35% $14,087,751 7.52% 265,720 $61.28 539,408 $1,240 $282Aug-04 $15,583,025 $2,094,988 22.26% $13,488,037 7.34% 273,998 $56.87 537,893 $1,164 $270Sep-04 $15,837,278 $2,381,168 26.73% $13,456,109 7.57% 259,122 $61.12 514,381 $1,323 $268Oct-04 $15,886,082 $2,238,862 23.59% $13,647,220 7.35% 269,456 $58.96 546,854 $1,244 $279Nov-04 $14,673,583 $2,291,027 23.93% $12,382,557 7.63% 247,052 $59.39 488,976 $1,273 $261Dec-04 $16,481,519 $2,693,024 25.67% $13,788,495 7.51% 275,448 $59.84 553,511 $1,521 $255Jan-05 $14,573,217 $2,133,413 22.78% $12,439,804 7.42% 239,174 $60.93 498,062 $1,205 $242Feb-05 $14,470,969 $2,029,349 23.05% $12,441,621 7.30% 240,753 $60.11 502,423 $1,147 $241Mar-05 $16,267,009 $2,219,086 23.05% $14,047,923 7.64% 264,634 $61.47 543,698 $1,233 $277Apr-05 $15,854,366 $2,301,833 25.64% $13,552,533 7.32% 256,414 $61.83 516,515 $1,279 $275May-05 $14,510,973 $1,868,526 21.33% $12,642,447 7.63% 248,351 $58.43 495,592 $1,005 $245Jun-05 $14,514,394 $1,954,665 23.43% $12,559,729 7.76% 246,166 $58.96 489,988 $1,051 $246
TOTALS $184,935,738 $26,401,513 23.66% $158,534,225 7.50% 3,086,288 $59.92 6,227,301 $1,224 $262
Fiscal year ended June 30, 2004
NIW YLIADNIW YLIADREP NIWTOLSTOLSELBATELBATLATOTMONTH AGR AGR WIN % AGR HOLD % PATRONS PATRON ADMISSIONS PER TABLE PER SLOT
Jul-03 $18,054,789 $2,373,295 24.42% $15,681,494 7.72% 272,984 $66.14 568,636 $1,614 $255Aug-03 $19,834,668 $2,348,339 22.38% $17,486,329 7.63% 321,126 $61.77 662,809 $1,598 $285Sep-03 $17,555,226 $2,200,897 23.10% $15,354,329 7.49% 296,229 $59.26 594,960 $1,497 $250Oct-03 $17,147,995 $1,996,996 20.76% $15,151,000 7.58% 280,929 $61.04 569,996 $1,359 $251Nov-03 $16,471,314 $2,227,465 23.31% $14,243,849 7.39% 273,908 $60.13 575,082 $1,515 $247Dec-03 $16,100,027 $2,242,517 22.89% $13,857,511 7.15% 268,553 $59.95 564,465 $1,526 $235Jan-04 $15,957,004 $2,054,294 21.58% $13,902,711 7.38% 256,211 $62.28 554,779 $1,397 $236Feb-04 $15,675,070 $1,894,643 20.87% $13,780,427 7.33% 248,512 $63.08 538,722 $1,289 $234Mar-04 $15,934,442 $1,954,441 21.11% $13,980,001 7.19% 262,355 $60.74 553,075 $1,386 $246Apr-04 $16,033,448 $1,926,957 21.60% $14,106,491 7.47% 255,674 $62.71 530,567 $1,367 $248May-04 $16,199,074 $2,034,687 22.16% $14,164,388 7.44% 269,305 $60.15 532,029 $1,443 $249Jun-04 $14,369,773 $1,913,152 22.72% $12,456,621 7.54% 238,020 $60.37 464,016 $1,357 $239
TOTALS $199,332,830 $25,167,679 22.25% $174,165,150 7.45% 3,243,806 $61.45 6,709,136 $1,446 $248
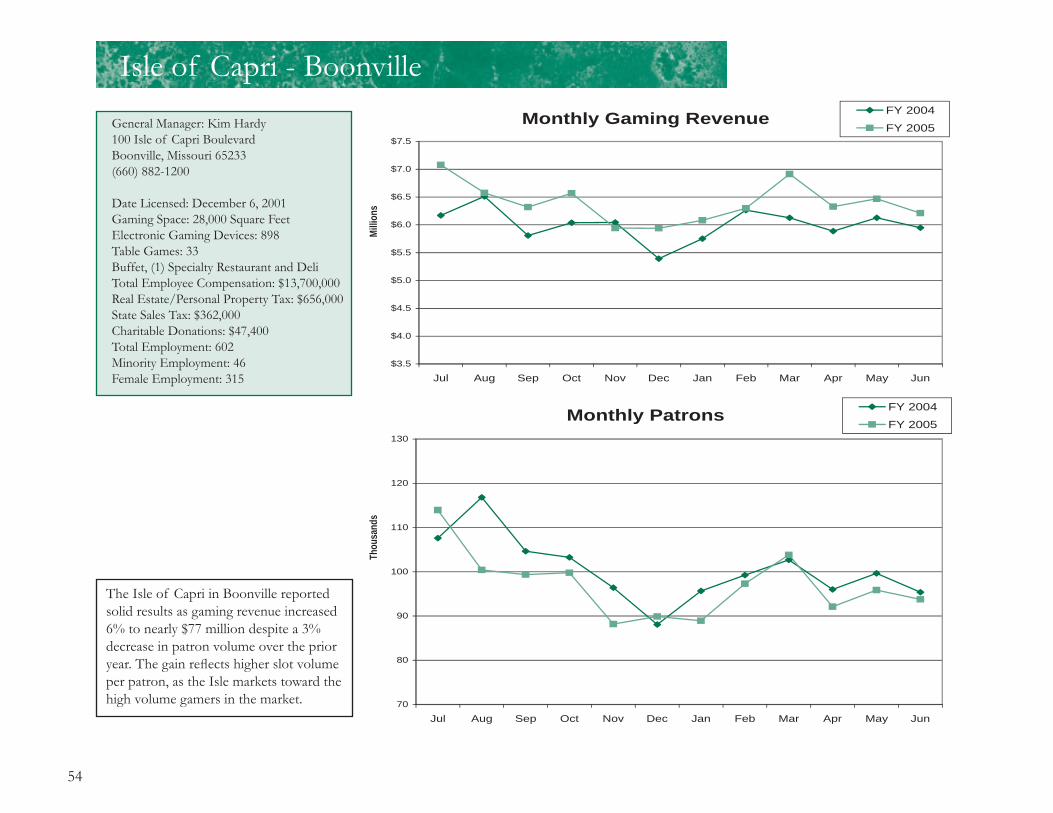
54
Isle of Capri - BoonvilleMonthly Gaming Revenue
$3.5
$4.0
$4.5
$5.0
$5.5
$6.0
$6.5
$7.0
$7.5
Jul Aug Sep Oct Nov Dec Jan Feb Mar Apr May JunM
illio
ns
FY 2004
FY 2005
Monthly Patrons
70
80
90
100
110
120
130
Jul Aug Sep Oct Nov Dec Jan Feb Mar Apr May Jun
Thou
sand
s
FY 2004
FY 2005
The Isle of Capri in Boonville reported solid results as gaming revenue increased 6% to nearly $77 million despite a 3% decrease in patron volume over the prior year. The gain refl ects higher slot volume per patron, as the Isle markets toward the high volume gamers in the market.
General Manager: Kim Hardy100 Isle of Capri BoulevardBoonville, Missouri 65233(660) 882-1200
Date Licensed: December 6, 2001Gaming Space: 28,000 Square FeetElectronic Gaming Devices: 898Table Games: 33Buffet, (1) Specialty Restaurant and DeliTotal Employee Compensation: $13,700,000Real Estate/Personal Property Tax: $656,000State Sales Tax: $362,000Charitable Donations: $47,400Total Employment: 602Minority Employment: 46Female Employment: 315

55
Fiscal year ended June 30, 2005
NIW YLIADNIW YLIADREP NIWTOLSTOLSELBATELBATLATOTMONTH AGR AGR WIN % AGR HOLD % PATRONS PATRON ADMISSIONS PER TABLE PER SLOT
Jul-04 $7,079,013 $674,757 21.97% $6,404,256 7.35% 113,948 $62.12 261,349 $833 $236Aug-04 $6,575,695 $570,188 20.62% $6,005,507 7.77% 100,399 $65.50 228,830 $704 $221Sep-04 $6,319,790 $649,581 24.59% $5,670,210 7.56% 99,367 $63.60 229,118 $802 $211Oct-04 $6,568,932 $732,543 26.03% $5,836,389 7.49% 99,788 $65.83 231,080 $904 $217Nov-04 $5,942,354 $576,200 20.83% $5,366,154 7.68% 88,178 $67.39 205,118 $711 $200Dec-04 $5,940,390 $670,142 24.26% $5,270,248 7.24% 89,884 $66.09 210,008 $827 $194Jan-05 $6,082,783 $627,085 21.24% $5,455,698 7.64% 88,919 $68.41 215,406 $774 $201Feb-05 $6,298,683 $634,266 21.29% $5,664,418 7.33% 97,317 $64.72 227,482 $783 $208Mar-05 $6,915,173 $712,877 23.06% $6,202,296 7.48% 103,823 $66.61 238,002 $880 $228Apr-05 $6,327,594 $728,426 25.42% $5,599,168 7.31% 92,114 $68.69 205,952 $736 $206May-05 $6,469,157 $598,064 22.28% $5,871,093 7.74% 95,870 $67.48 211,149 $604 $218Jun-05 $6,210,803 $635,523 24.83% $5,575,280 7.47% 93,757 $66.24 210,110 $642 $207
TOTALS $76,730,366 $7,809,650 23.00% $68,920,716 7.50% 1,163,364 $65.96 2,673,604 $767 $212
Fiscal year ended June 30, 2004
NIW YLIADNIW YLIADREP NIWTOLSTOLSELBATELBATLATOTMONTH AGR AGR WIN % AGR HOLD % PATRONS PATRON ADMISSIONS PER TABLE PER SLOT
Jul-03 $6,170,727 $592,052 20.60% $5,578,674 7.40% 107,596 $57.35 247,997 $731 $207Aug-03 $6,511,355 $692,828 21.58% $5,818,528 7.14% 116,804 $55.75 267,922 $855 $216Sep-03 $5,807,994 $444,633 16.38% $5,363,361 7.39% 104,648 $55.50 239,409 $549 $200Oct-03 $6,039,446 $602,118 20.84% $5,437,328 7.25% 103,262 $58.49 236,667 $743 $201Nov-03 $6,043,695 $630,053 22.17% $5,413,642 7.36% 96,412 $62.69 226,060 $778 $200Dec-03 $5,393,268 $634,216 23.41% $4,759,053 7.15% 88,090 $61.22 206,023 $783 $176Jan-04 $5,751,587 $680,634 22.83% $5,070,953 7.18% 95,653 $60.13 226,154 $840 $188Feb-04 $6,266,420 $669,802 23.00% $5,596,618 7.53% 99,249 $63.14 232,267 $827 $206Mar-04 $6,128,258 $710,156 23.17% $5,418,102 6.95% 102,692 $59.68 238,562 $877 $200Apr-04 $5,888,442 $660,548 23.69% $5,227,894 7.03% 95,997 $61.34 221,030 $815 $192May-04 $6,127,651 $671,427 23.51% $5,456,224 7.14% 99,635 $61.50 228,566 $829 $201Jun-04 $5,949,018 $543,546 21.86% $5,405,472 7.46% 95,368 $62.38 216,374 $671 $199
TOTALS $72,077,861 $7,532,011 21.94% $64,545,850 7.25% 1,205,406 $59.80 2,787,031 $775 $199
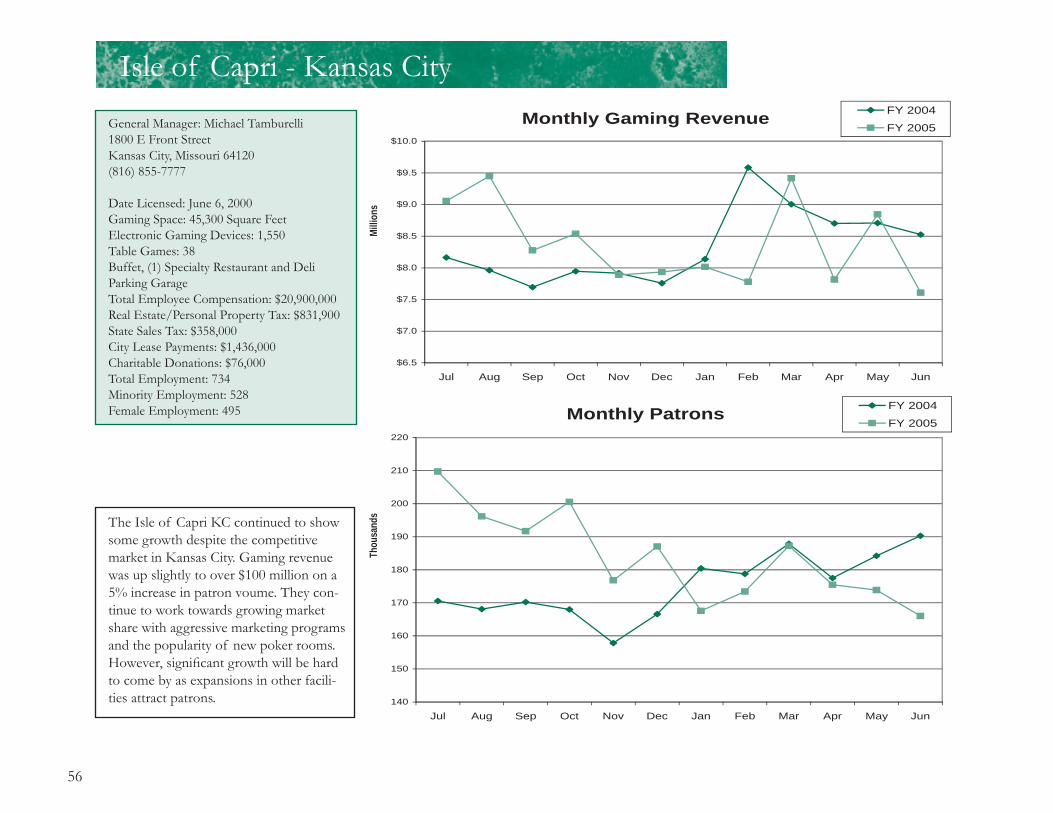
56
Isle of Capri - Kansas CityMonthly Gaming Revenue
$6.5
$7.0
$7.5
$8.0
$8.5
$9.0
$9.5
$10.0
Jul Aug Sep Oct Nov Dec Jan Feb Mar Apr May JunM
illio
ns
FY 2004
FY 2005
Monthly Patrons
140
150
160
170
180
190
200
210
220
Jul Aug Sep Oct Nov Dec Jan Feb Mar Apr May Jun
Thou
sand
s
FY 2004
FY 2005
General Manager: Michael Tamburelli1800 E Front StreetKansas City, Missouri 64120(816) 855-7777
Date Licensed: June 6, 2000Gaming Space: 45,300 Square FeetElectronic Gaming Devices: 1,550Table Games: 38Buffet, (1) Specialty Restaurant and DeliParking GarageTotal Employee Compensation: $20,900,000Real Estate/Personal Property Tax: $831,900State Sales Tax: $358,000City Lease Payments: $1,436,000Charitable Donations: $76,000Total Employment: 734Minority Employment: 528Female Employment: 495
The Isle of Capri KC continued to show some growth despite the competitive market in Kansas City. Gaming revenue was up slightly to over $100 million on a 5% increase in patron voume. They con-tinue to work towards growing market share with aggressive marketing programs and the popularity of new poker rooms. However, signifi cant growth will be hard to come by as expansions in other facili-ties attract patrons.

57
Fiscal year ended June 30, 2005
NIW YLIADNIW YLIADREP NIWTOLSTOLSELBATELBATLATOTMONTH AGR AGR WIN % AGR HOLD % PATRONS PATRON ADMISSIONS PER TABLE PER SLOT
Jul-04 $9,056,595 $1,232,787 28.59% $7,823,808 6.97% 209,721 $43.18 416,633 $1,326 $169Aug-04 $9,449,043 $955,831 24.89% $8,493,213 8.18% 196,170 $48.17 382,253 $1,028 $183Sep-04 $8,277,149 $811,597 21.48% $7,465,552 7.38% 191,691 $43.18 376,713 $873 $161Oct-04 $8,538,772 $998,670 24.84% $7,540,102 6.91% 200,568 $42.57 404,356 $1,040 $162Nov-04 $7,889,384 $842,452 22.42% $7,046,932 7.08% 176,789 $44.63 361,149 $878 $152Dec-04 $7,935,010 $961,028 23.38% $6,973,982 6.42% 187,054 $42.42 390,249 $866 $153Jan-05 $8,014,771 $877,196 23.73% $7,137,575 7.12% 167,599 $47.82 357,163 $790 $156Feb-05 $7,779,787 $878,126 22.97% $6,901,661 6.30% 173,411 $44.86 368,293 $770 $152Mar-05 $9,415,878 $1,088,265 25.58% $8,327,613 7.20% 187,241 $50.29 391,270 $955 $182Apr-05 $7,815,368 $967,098 25.78% $6,848,271 6.35% 175,463 $44.54 362,487 $848 $145May-05 $8,844,005 $749,885 21.51% $8,094,120 8.04% 173,898 $50.86 352,464 $625 $171Jun-05 $7,608,850 $768,492 23.62% $6,840,359 7.37% 166,054 $45.82 330,563 $674 $147
TOTALS $100,624,613 $11,131,425 24.15% $89,493,188 7.10% 2,205,659 $45.62 4,493,593 $889 $161
Fiscal year ended June 30, 2004
NIW YLIADNIW YLIADREP NIWTOLSTOLSELBATELBATLATOTMONTH AGR AGR WIN % AGR HOLD % PATRONS PATRON ADMISSIONS PER TABLE PER SLOT
Jul-03 $8,163,979 $875,312 22.09% $7,288,667 7.03% 170,565 $47.86 339,942 $1,167 $214Aug-03 $7,961,999 $886,268 21.74% $7,075,731 6.87% 168,105 $47.36 338,660 $1,182 $210Sep-03 $7,695,036 $937,761 24.29% $6,757,275 6.96% 170,260 $45.20 334,682 $1,250 $222Oct-03 $7,946,135 $1,002,671 25.24% $6,943,464 7.09% 168,005 $47.30 333,527 $1,337 $228Nov-03 $7,917,441 $993,068 25.85% $6,924,373 7.28% 157,853 $50.16 320,487 $1,324 $146Dec-03 $7,758,575 $839,912 21.64% $6,918,663 7.02% 166,614 $46.57 341,644 $1,120 $147Jan-04 $8,137,903 $867,461 22.65% $7,270,442 7.00% 180,430 $45.10 368,792 $1,157 $153Feb-04 $9,585,354 $852,359 22.16% $8,732,995 8.23% 178,753 $53.62 364,253 $1,136 $184Mar-04 $9,004,503 $975,770 23.76% $8,028,734 7.24% 187,867 $47.93 375,313 $1,301 $172Apr-04 $8,702,870 $945,084 23.87% $7,757,787 7.38% 177,513 $49.03 351,810 $1,260 $166May-04 $8,708,177 $910,699 23.01% $7,797,478 7.58% 184,218 $47.27 360,694 $1,214 $168Jun-04 $8,525,402 $946,967 25.09% $7,578,436 7.49% 190,277 $44.81 368,393 $1,018 $164
TOTALS $100,107,376 $11,033,330 23.44% $89,074,046 7.27% 2,100,460 $47.66 4,198,197 $1,206 $181

58
Mark Twain - LaGrangeMonthly Gaming Revenue
$1.8
$2.0
$2.2
$2.4
$2.6
$2.8
$3.0
Jul Aug Sep Oct Nov Dec Jan Feb Mar Apr May JunM
illio
ns
FY 2004
FY 2005
Monthly Patrons
30
35
40
45
50
55
60
Jul Aug Sep Oct Nov Dec Jan Feb Mar Apr May Jun
Thou
sand
s
FY 2004
FY 2005
General Manager: Robert Thursby104 Pierce StreetLaGrange, Missouri 63448(573) 655-4770
Original License: July 25, 2001Acquired by Herbst: February 1, 2005Gaming Space: 18,000 Square FeetElectronic Gaming Devices: 560Table Games: 14(1) Specialty RestaurantMeeting SpaceTotal Employee Compensation: $5,100,000Real Estate/Personal Property Tax: $241,000State Sales Tax: $88,800City Lease Payments: $201,200Charitable Donations: $7,600Total Employment: 273Minority Employment: 11Female Employment: 153
The Mark Twain Casino in LaGrange reported strong results as the property was acquired in February 2005 by Herbst Gaming. Their gaming revenue increased 13%, to $29 million, along with a 10% increase in patron volume over the previ-ous fi scal year. As with the St. Jo acquisi-tion by Herbst, new marketing strategies and new slot technologies proved positive results. As these new enhancements con-tinue, Mark Twain Casino will likely post moderate growth in the next year.

59
Fiscal year ended June 30, 2005
NIW YLIADNIW YLIADREP NIWTOLSTOLSELBATELBATLATOTMONTH AGR AGR WIN % AGR HOLD % PATRONS PATRON ADMISSIONS PER TABLE PER SLOT
Jul-04 $2,355,062 $307,165 28.12% $2,047,897 8.07% 43,681 $53.92 93,717 $602 $136Aug-04 $2,223,137 $270,309 28.03% $1,952,828 8.50% 39,018 $56.98 83,681 $530 $130Sep-04 $2,096,206 $238,371 26.81% $1,857,835 8.20% 38,151 $54.94 81,548 $467 $123Oct-04 $2,246,990 $224,555 24.38% $2,022,435 8.51% 38,004 $59.13 82,522 $440 $133Nov-04 $2,190,581 $270,892 27.39% $1,919,689 8.57% 35,146 $62.33 78,993 $531 $127Dec-04 $2,317,527 $319,932 28.87% $1,997,595 8.04% 38,478 $60.23 86,203 $627 $132Jan-05 $2,143,077 $309,496 31.62% $1,833,581 7.68% 36,017 $59.50 81,829 $607 $121Feb-05 $2,948,346 $271,856 24.13% $2,676,491 8.60% 50,780 $58.06 108,574 $533 $176Mar-05 $2,903,133 $338,218 27.50% $2,564,915 8.51% 50,217 $57.81 107,029 $663 $166Apr-05 $2,745,772 $319,614 27.35% $2,426,158 8.40% 48,842 $56.22 102,385 $666 $157May-05 $2,628,010 $291,701 28.46% $2,336,310 8.51% 49,037 $53.59 100,659 $695 $150Jun-05 $2,371,236 $195,087 21.78% $2,176,149 8.82% 47,343 $50.09 97,892 $464 $130
TOTALS $29,169,077 $3,357,194 27.10% $25,811,884 8.38% 514,714 $56.67 1,105,032 $569 $140
Fiscal year ended June 30, 2004
NIW YLIADNIW YLIADREP NIWTOLSTOLSELBATELBATLATOTMONTH AGR AGR WIN % AGR HOLD % PATRONS PATRON ADMISSIONS PER TABLE PER SLOT
Jul-03 $2,153,677 $256,507 23.13% $1,897,170 8.39% 42,274 $50.95 89,716 $503 $125Aug-03 $2,166,415 $273,623 23.36% $1,892,792 8.26% 42,241 $51.29 91,052 $537 $125Sep-03 $1,986,678 $238,672 21.58% $1,748,006 8.44% 37,849 $52.49 82,060 $468 $116Oct-03 $1,966,978 $248,726 22.39% $1,718,252 7.84% 38,619 $50.93 83,825 $488 $114Nov-03 $2,103,404 $306,236 27.33% $1,797,168 8.04% 37,783 $55.67 84,214 $600 $120Dec-03 $1,992,640 $258,061 23.38% $1,734,579 8.15% 35,501 $56.13 78,896 $506 $115Jan-04 $2,021,966 $257,197 23.27% $1,764,769 8.22% 36,657 $55.16 82,156 $504 $117Feb-04 $2,267,651 $225,362 21.39% $2,042,289 8.37% 38,883 $58.32 87,895 $442 $136Mar-04 $2,447,515 $318,412 27.01% $2,129,103 8.18% 42,728 $57.28 93,838 $624 $141Apr-04 $2,248,006 $235,924 22.41% $2,012,082 8.19% 39,581 $56.80 86,507 $463 $134May-04 $2,303,092 $253,957 23.18% $2,049,135 8.49% 40,354 $57.07 86,542 $498 $136Jun-04 $2,140,361 $219,692 22.45% $1,920,669 8.45% 39,108 $54.73 83,712 $431 $128
TOTALS $25,798,381 $3,092,368 23.45% $22,706,013 8.25% 471,578 $54.71 1,030,413 $505 $126

60
President Casino on the AdmiralMonthly Gaming Revenue
$4.5
$5.0
$5.5
$6.0
$6.5
$7.0
$7.5
$8.0
Jul Aug Sep Oct Nov Dec Jan Feb Mar Apr May JunM
illio
ns
FY 2004
FY 2005
Monthly Patrons
100
110
120
130
140
150
160
Jul Aug Sep Oct Nov Dec Jan Feb Mar Apr May Jun
Thou
sand
s
FY 2004
FY 2005
General Manager: Chris Strobbe1000 N Leonor K. Sullivan BlvdSt. Louis, Missouri 63102(314) 622-3000
Date Licensed: May 27, 1994Gaming Space: 53,800 Square FeetElectronic Gaming Devices: 1,021Table Games: 35BuffetTotal Employee Compensation: $16,800,000Real Estate/Personal Property Tax: $306,000State Sales Tax: $255,000City Lease Payments: $1,407,000Charitable Donations: $37,800Total Employment: 646Minority Employment: 437Female Employment: 340
The President continues to report weak results as gaming revenue fell 1%, to $71 million, along with a decrease in patron volume in comparison to the prior year. The decline was due to higher levels of competition at the other area casinos, including the Alton Belle and Casino Queen in East St. Louis, Illinois. Due to the marketing capabilities of the larger casinos in the market, the President will fi nd it diffi cult to show growth in the coming fi scal year.

61
Fiscal year ended June 30, 2005
NIW YLIADNIW YLIADREP NIWTOLSTOLSELBATELBATLATOTMONTH AGR AGR WIN % AGR HOLD % PATRONS PATRON ADMISSIONS PER TABLE PER SLOT
Jul-04 $6,436,095 $780,483 22.09% $5,655,612 6.98% 155,664 $41.35 336,413 $685 $171Aug-04 $6,022,668 $852,137 25.43% $5,170,531 6.88% 143,992 $41.83 315,612 $747 $157Sep-04 $5,870,178 $721,034 21.37% $5,149,144 6.87% 141,886 $41.37 313,059 $632 $158Oct-04 $6,179,432 $968,622 26.62% $5,210,811 6.66% 136,303 $45.34 307,558 $897 $160Nov-04 $5,701,391 $777,711 25.54% $4,923,680 6.69% 124,801 $45.68 283,843 $665 $154Dec-04 $5,631,365 $833,503 29.37% $4,797,863 6.62% 118,712 $47.44 275,829 $712 $150Jan-05 $5,791,329 $810,988 28.12% $4,980,341 6.30% 117,754 $49.18 285,569 $693 $154Feb-05 $5,866,494 $859,390 26.30% $5,007,104 5.94% 124,901 $46.97 288,980 $735 $155Mar-05 $6,549,169 $920,527 25.14% $5,628,642 6.57% 132,391 $49.47 309,675 $787 $174Apr-05 $6,312,258 $966,717 24.29% $5,345,541 6.74% 132,477 $47.65 295,928 $826 $166May-05 $5,722,879 $707,538 23.50% $5,015,341 6.80% 124,881 $45.83 275,055 $605 $155Jun-05 $5,287,943 $563,506 19.09% $4,724,436 6.67% 120,989 $43.71 264,833 $537 $154
TOTALS $71,371,201 $9,762,156 24.69% $61,609,045 6.64% 1,574,751 $45.32 3,552,354 $710 $159
Fiscal year ended June 30, 2004
NIW YLIADNIW YLIADREP NIWTOLSTOLSELBATELBATLATOTMONTH AGR AGR WIN % AGR HOLD % PATRONS PATRON ADMISSIONS PER TABLE PER SLOT
Jul-03 $6,176,036 $676,280 20.45% $5,499,756 6.84% 145,805 $42.36 330,057 $777 $134Aug-03 $6,602,651 $858,896 23.57% $5,743,755 6.72% 152,412 $43.32 344,166 $868 $140Sep-03 $5,598,478 $632,460 20.79% $4,966,019 6.65% 131,466 $42.58 295,226 $639 $121Oct-03 $5,811,163 $828,544 24.97% $4,982,619 6.44% 132,411 $43.89 288,589 $837 $122Nov-03 $5,469,782 $795,612 25.84% $4,674,170 6.51% 122,252 $44.74 284,197 $804 $111Dec-03 $5,484,682 $675,910 22.37% $4,808,772 6.80% 115,199 $47.61 273,384 $683 $114Jan-04 $5,957,644 $727,894 23.80% $5,229,750 6.87% 123,567 $48.21 301,992 $714 $124Feb-04 $6,461,549 $782,008 24.56% $5,679,541 6.94% 130,620 $49.47 312,455 $790 $140Mar-04 $6,249,023 $808,054 22.05% $5,440,969 6.75% 141,434 $44.18 323,747 $728 $164Apr-04 $6,208,472 $800,540 25.04% $5,407,933 6.83% 133,040 $46.67 300,075 $721 $166May-04 $5,902,535 $735,792 22.62% $5,166,743 6.56% 136,109 $43.37 306,005 $645 $157Jun-04 $5,923,158 $740,177 23.88% $5,182,981 6.86% 136,328 $43.45 299,326 $649 $157
TOTALS $71,845,174 $9,062,166 23.32% $62,783,007 6.73% 1,600,643 $44.89 3,659,219 $738 $137

62
St. Jo Frontier CasinoMonthly Gaming Revenue
$1.6
$1.8
$2.0
$2.2
$2.4
$2.6
$2.8
Jul Aug Sep Oct Nov Dec Jan Feb Mar Apr May JunM
illio
ns
FY 2004
FY 2005
Monthly Patrons
30
35
40
45
50
55
60
Jul Aug Sep Oct Nov Dec Jan Feb Mar Apr May Jun
Thou
sand
s
FY 2004
FY 2005
General Manager: Craig Travers777 Winners CircleSt. Joseph, Missouri 64505(816) 279-5514
Original License: June 24, 1994Acquired by Herbst: February 1, 2005Gaming Space: 18,000 Square FeetElectronic Gaming Devices: 594Table Games: 12Buffet and (1) Specialty RestaurantMeeting SpaceTotal Employee Compensation: $6,400,000Real Estate/Personal Property Tax: $240,000State Sales Tax: $103,100City/County Lease Payments: $635,000Charitable Donations: $33,600Total Employment: 273Minority Employment: 17Female Employment: 149
St. Jo posted strong results after the Febru-ary 2005 purchase of the facility by Herbst Gaming. Their gaming revenue increased 12%, to nearly $27 million, along with an 11% increase in patron volume over the prior year. The new ownership has used marketing strategies and new slot technol-ogies to increase their results with a posi-tive outcome. As the new enhancements continue, St. Jo will likely continue to post moderate growth in the coming year.

63
Fiscal year ended June 30, 2005
NIW YLIADNIW YLIADREP NIWTOLSTOLSELBATELBATLATOTMONTH AGR AGR WIN % AGR HOLD % PATRONS PATRON ADMISSIONS PER TABLE PER SLOT
Jul-04 $2,064,599 $236,898 25.92% $1,827,702 7.75% 39,740 $51.95 77,446 $526 $122Aug-04 $1,980,542 $210,352 23.21% $1,770,190 7.92% 38,087 $52.00 74,373 $467 $119Sep-04 $1,914,918 $192,500 24.51% $1,722,418 7.77% 36,007 $53.18 71,181 $428 $118Oct-04 $2,114,455 $231,801 26.91% $1,882,655 7.89% 36,278 $58.28 73,614 $515 $129Nov-04 $1,939,241 $224,569 26.50% $1,714,672 7.99% 32,854 $59.03 67,531 $499 $117Dec-04 $2,118,307 $229,830 23.05% $1,888,477 7.62% 37,315 $56.77 77,165 $511 $129Jan-05 $1,941,261 $209,825 23.82% $1,731,436 7.66% 35,430 $54.79 73,077 $466 $118Feb-05 $2,749,464 $237,952 23.28% $2,511,512 8.66% 45,486 $60.45 94,332 $529 $171Mar-05 $2,557,714 $244,889 24.73% $2,312,825 7.60% 45,098 $56.71 92,959 $680 $173Apr-05 $2,389,925 $190,654 20.77% $2,199,271 7.32% 44,948 $53.17 93,483 $530 $133May-05 $2,545,773 $186,070 19.61% $2,359,703 7.50% 46,780 $54.42 100,230 $517 $132Jun-05 $2,397,083 $204,805 23.21% $2,192,279 6.98% 45,877 $52.25 96,294 $569 $123
TOTALS $26,713,282 $2,600,141 23.74% $24,113,141 7.70% 483,900 $55.20 991,685 $520 $132
Fiscal year ended June 30, 2004
NIW YLIADNIW YLIADREP NIWTOLSTOLSELBATELBATLATOTMONTH AGR AGR WIN % AGR HOLD % PATRONS PATRON ADMISSIONS PER TABLE PER SLOT
Jul-03 $1,974,063 $218,838 22.70% $1,755,225 7.44% 38,823 $50.85 77,114 $456 $114Aug-03 $2,156,873 $237,425 21.89% $1,919,448 7.88% 39,766 $54.24 80,315 $495 $124Sep-03 $1,925,537 $219,389 24.82% $1,706,149 7.78% 35,599 $54.09 71,045 $457 $111Oct-03 $1,855,225 $182,958 20.77% $1,672,267 7.37% 36,412 $50.95 72,992 $381 $106Nov-03 $1,806,338 $184,754 18.04% $1,621,584 7.75% 34,774 $51.95 70,584 $385 $106Dec-03 $1,980,605 $256,880 26.82% $1,723,725 8.14% 34,425 $57.53 69,679 $535 $113Jan-04 $1,983,127 $239,831 27.47% $1,743,296 7.98% 34,019 $58.29 69,490 $533 $116Feb-04 $2,023,225 $276,914 28.71% $1,746,311 7.73% 35,579 $56.87 72,881 $615 $116Mar-04 $2,228,821 $266,682 27.09% $1,962,139 8.09% 37,499 $59.44 75,819 $593 $131Apr-04 $2,037,726 $252,718 28.64% $1,785,008 7.83% 35,671 $57.13 71,421 $562 $119May-04 $2,062,439 $224,367 25.12% $1,838,072 7.79% 37,950 $54.35 75,032 $499 $126Jun-04 $1,900,510 $197,634 24.02% $1,702,876 7.62% 36,653 $51.85 71,827 $439 $115
TOTALS $23,934,489 $2,758,388 24.59% $21,176,100 7.78% 437,170 $54.75 878,199 $496 $116

64
6002 YFserutidnepxE6002 YFserutidnepxE
000,05ffirehS ytnuoC drawoH 063,6margorP htuoY remmuS $ $ 000,52rotucesorP ytnuoC drawoH 000,4strA edistuO kcilsnooB $ $ 000,52tnemtrapeD eciloP nilknarF weN 000,081stnemevorpmI eganiarD $ $ 000,05ffirehS ytnuoC repooC 000,003noitacoleR tnemtrapeD eriF $ $ 000,52rotucesorP ytnuoC repooC 000,766noitavoneR ACMY $ $ 000,02ffirehS ytnuoC uaetinoM 000,72tinU eninaC $ $ 000,01rotucesorP ytnuoC sitteP 000,64sraC lortaP $ $ 000,01ffirehS ytnuoC sitteP 000,002,1noitatS pmuP reviR $ $ 000,02ffirehS ytnuoC enilaS 000,000,1noitcurtsnoceR teertS htruoF $ $ 000,52GNATSUM 000,03margorP klawediS 01/09 $ $ 000,1retawkcalB 000,002sgnillewS teertS niaM $ $ 000,2evorG toliP 000,06sneriS ycnegremE owT $ $ 000,1notecnuB 000,05redarG dliubeR $ $ 000,1ellivrettO 000,002repeewS teertS $ $ 000,1emoH eiriarP 000,57sniarD yratinaS/mrotS esiveleT $ $ 000,27ACMY $ 051,24retneC roineS $
015,524,4serutidnepxE dnuF gnimaG $
SOURCE: City of Boonville
CITY OF BOONVILLE
HOME DOCK COMMUNITIES' USE of GAMING FUNDS

65
CITY OF CARUTHERSVILLE
EXPENDITURES 2003-2004
Actual2004-2005
Actual2005-2006Estimated
EXPENDITURES 2003-2004
Actual2004-2005
Actual2005-2006Estimated
Drainage 339,023$ 200,000$ Public Safety898,11eganiarD teertS ht02 550,67sreciffO eciloP lanoitiddA $ $ 50,703$ 52,225$ 000,52snilloC ht01 984,52gnidliuB retlehS enamuH $ $ 80,511$
Drug Task Force 49,449$ Water/Wastewater Improvements Fire Department Equipment 82,813$
Water Tower Maintenance 129,473$ 56,204$ Other Infrastructure
Street Improvements Downtown Redevelopment 12,154$ 1,679$ Miscellaneous Street Improvements 74,652$ 14,604$ 15,000 500,1sklawediS $ $ 865$ 10,000$
Nursing Home 25,000$ Cemetery Fencing 54,968$
000,11stnemevorpmI tropriA $
341,584SLATOT $ 626,402$ 288,225$
SOURCE: City of CaruthersvilleNOTE: Numbers were rounded off

66
Adopted FY 2004-05
Adopted FY 2005-06
Adopted FY 2004-05
Adopted FY 2005-06
stnemevorpmI latipaCecnanetniaM derrefeD/tnempiuqEsgnikraM teertS dna syawdaoRygolonhceT noitamrofnI
Citywide Personal Computer Replacement Program 1,500,000$ 1,450,000 000,002noitcurtsnoceR draveluoB $ $ 527,483edargpU SIG $ 385,191 529,719,1noitavreserP teertS $ $ 69,805$
000,001tnemecalpeR ngiS doohrobhgieN $ Police Department
804,084snoitarepO teelF $ 824,000$ Streetlight System000,522ecnanetniaM oidaR $ 225,000$ Streetlight System Expansion 9,000,000$ 9,396,000$ 413,391stnemevorpmI oidaR ytefaS cilbuP 065,352esahcruP thgilteertS BUPOM $ $ 255,360$
seitilicaF cilbuPtnemtrapeD eriFFire Apparatus and Equipment Replacement 40,000 513,993,1tnemeriteR tbeD retneC ecivreS lapicinuM $ $ 1,400,981$
City Market Debt Retirement 1,389,646$ 1,395,755$ Neighborhood and Community Services Kansas City Zoo Buildings & Grounds 400,000$
684,072tnemecalpeR tnempiuqE $ 270,000 000,001tnempiuqE dnuorgyalP $ $ 000,008ecnanetniaM kraP $ 500,000$
Parks and Recreation Department 000,003ecnanetniaM looP gnimmiwS $ 300,000$ 986,401tnemecalpeR tnempiuqE $ 284,000 000,001ecnanetniaM niatnuoF ytiC $ $ 200,207$
000,05noitavoneR dleifllaB $ Environmental Management Community Center Maintenance 890,000$ 1,000,000$
643,46tnemecalpeR teelF etsaW diloS 000,052noitarotseR tnemunoM/niatnuoF %1 $ $ Parks Roads and Parking Lots 150,000$ 100,000$
Department of Public Works 000,05ecnanetniaM epacsteertS $ 966,133tnemecalpeR tnempiuqE $ 957,000 000,575gnimmirT eerT $ $ 1,000,000$ 534,29stnemevorpmI oidaR ytefaS cilbuP 780,94noitarotseR ekaL $ $
Parks Administration Headquarters 75,000$ 000,523stnemevorpmI seitilicaF kraP $ 1,000,000$
000,571stnemevorpmI ytefaS efiL llaH ytiC $
000,004ytilicaF retneC tnemniatretnE & noitnevnoC $ 000,001ecnailpmoC ADA $
3,687,072$ 4,395,191$ 000,09lavomeR )TSUL( knaT leuF $
18,224,533$ 17,483,108$ SOURCE: City of Kansas City Total Gaming Funds Allocated 21,911,605$ 21,878,299$
CITY OF KANSAS CITY
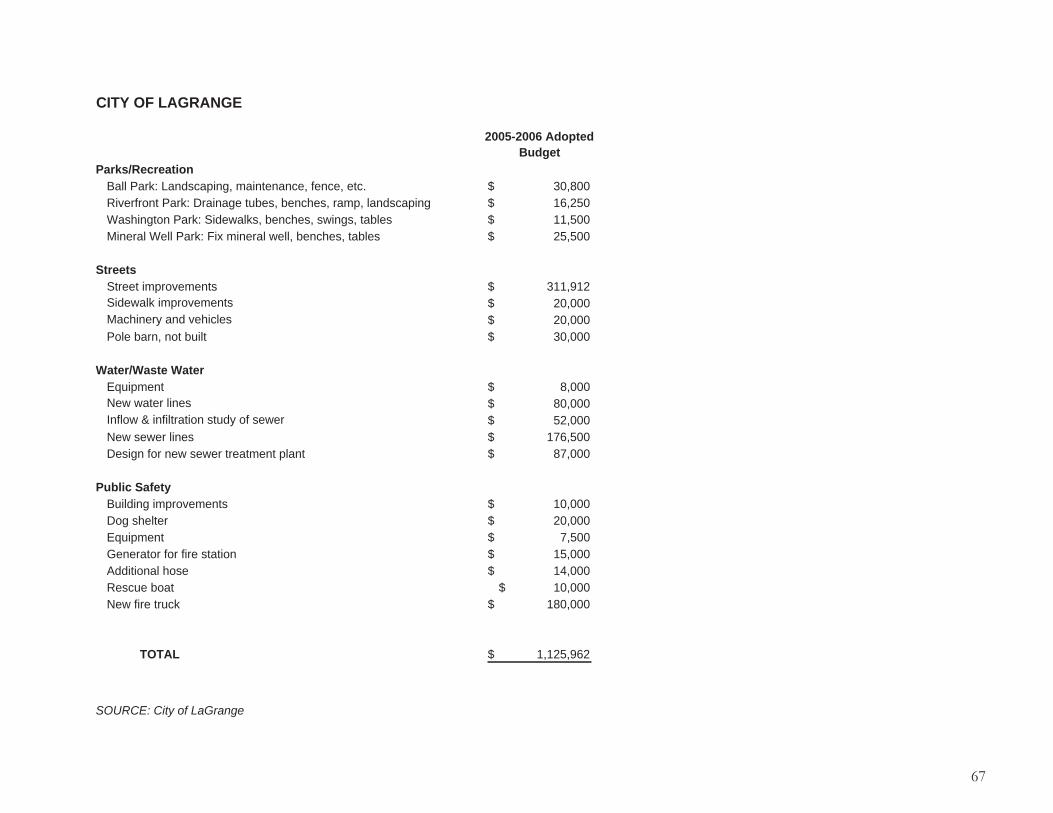
67
2005-2006 Adopted Budget
Parks/Recreation008,03.cte ,ecnef ,ecnanetniam ,gnipacsdnaL :kraP llaB $ 052,61gnipacsdnal ,pmar ,sehcneb ,sebut eganiarD :kraP tnorfreviR $ 005,11selbat ,sgniws ,sehcneb ,sklawediS :kraP notgnihsaW $ 005,52selbat ,sehcneb ,llew larenim xiF :kraP lleW lareniM $
Streets219,113stnemevorpmi teertS $
Sidewalk improvements 20,000$ Machinery and vehicles 20,000$
000,03tliub ton ,nrab eloP $
Water/Waste WaterEquipment 8,000$ New water lines 80,000$ Inflow & infiltration study of sewer 52,000$
005,671senil rewes weN $ 000,78tnalp tnemtaert rewes wen rof ngiseD $
Public Safety000,01stnemevorpmi gnidliuB $
Dog shelter 20,000$ Equipment 7,500$
000,51noitats erif rof rotareneG $ 000,41esoh lanoitiddA $ 000,01taob eucseR $ 000,081kcurt erif weN $
TOTAL 1,125,962$
SOURCE: City of LaGrange
CITY OF LAGRANGE

68
CITY OF MARYLAND HEIGHTS
2005 General FundPolice Department Expanded Operations 1,250,000$ Finance Department Expanded Operations 115,000$ Government Center - Debt Service Fund (Revenue Bonds) 1,080,000$
000,032troppuS metsyS SIG $ 000,001snoitaleR cilbuP $ General Fund (Requirement for funding) 2,295,000$ 000,57)secruoseR namuH( evitartsinimdA $
Planning Department Expanded Operations 58,000$ Reserve Fund (Total of 5% of gambling taxes placed in Reserve Fund) 765,000$ 000,764stsoC gnitarepO deificepsnU $ 000,177secivreS gniluaH hsarT laitnediseR $ General Fund (Equal to cost of basic residential trash collection) 771,000$
000,660,3sesnepxE gnitarepO latoT $ Capital Improvement Fund (50% of gambling taxes less debt service) 6,570,000$ 000,567dnuF evreseR 5002 $
Regional Infrastructure Fund (Any remaining funds) 3,819,000$ 2005 Capital Improvement Projects
000,000,2margorP tnemecalpeR balS teertS $ 000,003,51latoT $ 000,002)steertS tlahpsA( gnicafrusorciM $ 000,001gnicafruseR teertS tlahpsA $ 000,02stnemevorpmI daoR htrowegdE $ 000,528,1gninnalP egnahcretnI 072-I/ttesroD $
Midland Avenue Reconstruction Phase II 650,000$ 000,080,1ecivreS tbeD noitatS eciloP/llaH ytiC $ 000,050,4noitcurtsnoC noitatS eciloP/llaH ytiC $ 000,002,1ytilicaF skroW cilbuP $ 000,003,51euneveR xaT gnimaG detamitsE 5002 $ 000,001stnemevorpmI klawediS $ 000,002gninnalP aerA dneB drawoH $ 005,327,2* sexat gnimag s'raey roirp fo esU $000,005,1 eunevA nodlE $ 000,527ecalP notgninneB $ 005,764tnemeganaM tnemevorpmI latipaC $ 005,320,81sdnuF gnimaG fo secruoS latoT $000,57margorP noitacifitnedI ediw-ytiC $
Total Capital Improvement Expenditures 14,192,500$
Total Expenditures in 2005 of Gaming Funds 18,023,500$
SOURCE: City of Maryland Heights
In 2003 the City established the distribution of gaming taxes to funds based on the priorities established by the City Council. These priorities took affect beginning in 2005 as follows:
* Amounts that had accumulated in the City's Capital Improvement Fund to finance projects in 2004.

69
CITY OF NORTH KANSAS CITYFY 03-04 Update
FY 04-05 Budget Buildings/Improvements
FY 03-04 Update
FY 04-05 Budget
Services 000,011noitavoneR ybboL dna rebmahC licnuoC $ 000,79secivreS lanoisseforP $ 146,300 000,01yrtneG 1212 - evlaV kcehC $ $ 000,002seicnegnitnoC $ 200,000 000,572sdnalrehtuS yb desaeL gnidliuB ytiC fooreR $ $ 441,5.R.P - margorP nezitiC roineS $ 5,000$ City Hall Administration - Carpet and Wiring 6,383$
Snake Saturday Parade/BBQ - P.R. 47,315$ 45,000 000,053eliT looP riapeR - retneC ytinummoC $ $ 178,6.R.P - dnalrednoW retniW $ 7,100 005,72srood citamotua ecnartne S - retneC ytinummoC $ $ 211,6.R.P - tsefnuF remmuS $ 10,000 000,03gniroolF - retneC ytinummoC $ $ 005,52.R.P - licnuoC ssenisuB $ 25,800 456rewoT gniniarT tnemtrapeD eriF $ $ 25,000$ 298.R.P - eettimmoC lacirotsiH $ 2,500 000,572# noitatS eriF etavoneR $ $ 500,000$
Saturday in Square & Friday in Park - P.R. 6,930$ 11,510 000,571# noitatS eriF etavoneR $ $ 705,5.R.P - egnellahC etaroproC $ 6,500 000,521# noitatS lacirtcelE $ $
Employee Wellness Program - P.R. 4,500$ 4,500 005,35ngiseD ytilicaF eciloP $ $ 260,500$ 737,2.R.P - eettimmoC ytefaS $ 4,500 125,02ydutS tsoC ytilicaF eciloP $ $ 000,55.R.P - baL cisneroF lanoigeR $ 55,000 006,752,1noitcurtsnoC ytilicaF eciloP $ $
Land Acquisition 1,313,912$ 2,300,000 184,71tnemecalpeR rooD tnalP retaW $ $ Land Improvements 555,7retlehS yrotnevnI noitubirtsiD - retaW $
509,1stcejorP noitacifituaeB $ 250,000 531,3noitatS pmuP nonreV baheR - retaW $ $ Removal of Community Center Bush Garden 7,305 082,2noitatS pmuP slliH ynnuS fooreR - retaW $ $ Fencing for Sunny Hills and Vernon 39,000 000,01yawklaW etagrebiF - retaW $ $
000,401liarT gniklaW kraP nekcaM evaP 000,521rotavelE tnalP retaW $ $ 000,81noisnapxE toL gnikraP 1181 000,05tnalP retaW fooreR $ $ 000,38stoL ytiC yalrevO tlahpsA $ Equipment/Furniture000,431erutcurtS & skceD erauqS nwoT 000,522tnempiuqE - noitartsinimdA $ $
000,05nalP retsaM noitaerceR dna skraP 087,38tnempiuqE - tnemtrapeD eriF $ $ 282,000$ 000,01stnemecnahnE niatnuoF sdooW 354,432tnempiuqE - tnemtrapeD eciloP $ $ 134,470$
Information Technology 086,51tnempiuqE - tnemecrofnE sedoC $ 667,31eriF $ 97,925 650,52tnempiuqE - sdnuorG & sgnidliuB $ $ 98,500$ 607,01eciloP $ 48,000 541,29tnempiuqE - retneC ytinummoC $ $ 130,000$ 368,297latnemtrapedretnI $ 242,200 057,11tnempiuqE - skraP $ $ 438,42retneC ytinummoC $ 18,000 000,601485,651$tnempiuqE - retaW $ $ 000,65retaW 009,211erutinruF - noitartsinimdA $ $
Infrastructure 000,01erutinruF - eriF $ 829,82stnemtaerT lleW 667,4erutinruF - skroW cilbuP $ $ 51,200$ 000,85rotoM 3# dna 1# ecalpeR 052,41erutinruF - retneC ytinummoC $ $ 000,07tnemssessA ytilibarenluV $ Interfund Transfers Out598,96rekalS emiL 000,005tnemwodnE yrarbiL ot refsnarT $ $ 500,000$ 085,5epiP refsnarT emiL 000,000,2tnemwodnE retneC ytinummoC ot refsnarT $ $ 2,000,000$
000,51sehctaH fooR riovreseR 000,4dnuF yrarbiL ot refsnarT $ $ 4,000$ 000,27toL gnikraP tnemtrapeD retaW tlahpsA $ Transfer to Communications Utility Fund 2,454,462$ 6,500,000$ 000,57gnihsibrufeR retliF $ Transfer to Health Insurance Reserve 80,000$ 55,000$ 000,81seguaG sretemidibruT retliF $ Transfer to Northgate Redevelopments 1,950,000$
Contributions/Partnerships Transfer to M-210 and Walker Road Fund 108,576$ 636,5sesaC yalpsiD yteicoS lacirotsiH $ Total Expenditures 11,466,499$ 16,885,855$
000,55lairomeM snareteV $
000,51tamzaH dnalhtroN $ SOURCE: City of North Kansas City

70
CITY OF RIVERSIDE
5002-4002 YF5002-4002 YF
tilicaF ytefaS cilbuP weNseititnE rehtO ot ecnatsissA y000,52eraC htlaeH dnalhtroN $ Design, Construction & Furnishings 927,848$ 000,01ymrA noitavlaS $ 000,5ssorC deR naciremA $ Property Acquisitions/Right of Way 47,392$ 000,61stnediseR rof secivreS tisnarT $ 000,1ynohpmyS dnalhtroN $ Park Improvements006,3loohcS hgiH htuoS lliH kraP $ Line Creek Trail - Design Phase 14,545$
Park Hill South High School Jazz Band 1,000$ New Shelter House - EH Young Park 98,640$ 000,1nuR dnaltraeH $
City Sponsored Fall Festival/Concerts in Park 35,000$ Equipment Purchases588,12rotpecretnI eciloP droF 5002 $
Horizon Development Commitment 219,2skcaR htiw sekiB eciloP 4 $ 900 Acre Commercial/Industrial Park 1,761,285$ Police Gator with canopy & access 10,875$
057,7stseV ralveK $ Major Thoroughfare/Infrastructure 650,9sredaerpS leetS 2 $
592,466yawetaG reppU 827,1knaT leuF $ $ 729,428daoR noiviV/yawetaG 000,24redaoL eohkcaB C614 taC $ $ 310,68paG reweS mrotS yawetaG 656,41srewoM "06 kcarT Z 2 $ $ 646,690,2egdirB & daoR ettalP tseW 000,51raeG reknuB $ $ 968,73stcartnoC teertS $ 987,621kroW bruC $ Community Services269,222evirD hgiH $ City Wide Trash Collection Service 57,484$ 590,24tseW daoR noiviV $ City Wide Clean Up Campaign 17,646$ 009,51eunevA weivffilC $
897,562,7LATOT $
SOURCE: City of Riverside

71
CITY OF ST. CHARLESStormwater Projects CY 2003 CY 2004 CY 2005 Facilities Maintenance CY 2003 CY 2004 CY 2005
Debt Service - Stormwater Bonds 845,000$ 845,000$ 845,000$ Parking Garage Work 150,000$ Miscellaneous Stormwater Projects 50,000$ 200,000$ 275,000$ Parking Lot Renovation 171,000$
000,544noitazilibatS knabkeerC keerC eloC $ 405,000 000,001seliT gnilieC llaH ytiC ecalpeR $ $ 000,561noitazilibatS knaB keerC .csiM $ 267,000 000,53tnemecalpeR tnempiuqE $ $ 000,53nalP noitneverP doolF sliarT kaO $ 200,000 000,06metsyS etaG egaraG ecalpeR $ $ 000,95magorP SEDPN $ (100,517) 000,04ecivreS lacirtcelE edargpU $ $
000,33gninaelC knaB keerC 000,52sisylanA CAVH $ $ 000,001eganiarD ronaM revonaH 000,03ADA sriapeR rotavelE $ $
000,004gnippaM 000,05stnemevorpmI retneC roineS $ $ Street Projects 000,54repeewS egaraG ecalpeR $
Street Surface Repairs 498,000 000,03noitavoneR adnutoR llaH ytiC $ $ Debt Service - Streets 127,100$ 166,000$ 1,097,000 000,08noitavoneR edanolooC $ $
000,52ecnanetniaM yellA $ Police Department000,52ecnanetniaM klawediS $ 225,000$ 250,000$ Personnel Costs 2,381,000$ 2,745,000$ 3,078,614$
000,51snoisnetxE klawediS $ 230,000$ Personnel Costs-Dare/SRO 650,000$ 795,000$ 892,221$ 000,052toL gnikraP yalrevO $ 70,000 000,095metsyS oidaR-ecivreS tbeD $ $ 556,000$
1st Cap. Improvmnts./Beautification 100,000$ Parks - Frenchtown Greenway 250,000$ 000,003.vorpmI dR ocixeM & sgnirpS evaC 000,051tnempoleveD kraP retsbeW $ $ 300,000$
5th Street Extension 1,050,000$ 1,150,000$ 184,219 004,869noitisiuqcA dnaL $ 060,371 $ $ Randolph Street Reconstruction 270,000 000,05ddA kraP lliH xoF-ecivreS tbeD $ $ Boone's Lick Improvements 380,000$ Economic Development/Redev.
000,002sklawediS niaM htroN 000,003dnuF tnempoleveD cimonocE $ $ 437,500$ 35,000$ Intersection Improvements 477,500$ 275,000 005,232tcejorP retneC noitnevnoC $ $ 685,000$ 5th & Riverbluff Improvements 600,000 000,003tcejorP anerA $ $ 300,000$ 300,000$ Traffic Signalization Projects 333,000$ 120,000$ 235,000 000,5stnemevorpmI rehtO/etisbeW $ $ (5,000)$
000,82egangiS emocleW 000,007tcejorP retneC ytinummoC $ $ 000,616,1noitcurtsnoceR teertS mlE 000,001stcejorP trA cibuP $ $
000,053.vorpmI teertS dr3 & hesmuceT $ Water - Debt Service/Bonds 400,000$ 400,000$ 000,04loohcS notneB ecneF evitaroceD $ Water Pollution Control-Bonds 300,000$ 300,000$ 000,05dnoceS htroN .csiM - sehcneB $ Other - Veterans Memorial 300,000$
000,02margorP rettuG & bruC 000,002retneC trA yrdnuoF $ $ 200,000$ 200,000$ Comprehensive Citywide Traffic Study 200,000 000,002esuohtaoB kralC & siweL $ $
000,04 teertS niaM htuoS $ 300,000 000,052tropriA lapicinuM $ $ (250,000)$ 000,002ycnegnitnoC teertS 000,823stsoC lennosreP $ $ 898,050$ 1,010,396$ 000,03gnimlaC ciffarT $ 30,000$ Additions to (use of) Reserves (54,346)$ 50,000$ 484,500$ 000,03snoitisiuqcA ytreporP suoenallecsiM $ 30,000$ Frenchtown Facade Program 25,000$ 75,000$ 25,000$
000,002niaM N sklawediS nwotnwoD $ Lewis & Clark 2004 Event 100,000$ 200,000$ 000,001noitcennoC daoR nikskcuB $ Arts & Culture Activities 200,000$ 200,000$ 200,000$ 000,003trevluC xoB tS ht5 htuoS 000,02stnemevorpmI/nalP tnorfreviR $ $ 20,000$ 000,05stnemecnahnE dR nwotrehcsoB 000,001rehtO- tnemevorpmI edaçaF $ $
000,051.cte kraP notgnitnuH-sklawediS 000,001.vorpmI latipaC nwothcnerF $ $ Fire - Personnel Costs 1,862,000$ 1,930,000$ 2,164,507 000,001.vorpmI latipaC N 073 ywH $ $
000,05eucseR nibaC goL $ 000,05muesuM nwothcnerF $ 000,046straC hsarT yawalloR $
SOURCE: City of St. Charles 451,262,51SLATOT $ 16,472,550$ 16,814,000$

72
FY04 -Revised FY05
FY04 -Revised FY05
sevitaitinI doohrobhgieNytefaS cilbuP000,8tnempiuqE latipaC eriF $ 14,438$ Community Appearance Plan Implementations 165,719$ 75,554$
Contribution to Historic Steam Engine Renovation 20,000$
Economic Development 000,2hctaM noitacifituaeB kraP llehctiM $ Chamber of Commerce/Economic Development Contract 145,000$ 150,000$ Neighborhood Association Project Match 3,736$
000,52noitubirtnoC NAK-OM $ 25,000 513,1daehworrA ta yaD eoJ .tS $ $ 000,21nalP cigetartS ytinummoC $ 12,000$ 005,51tcartnoC pihsrentraP nwotnwoD $ 18,000$ Public Service Initiatives/Miscellaneous
Local & Federal Legislative Lobbyists 35,500$ 35,500$ Other Expenditures:Economic Development - Professional Services 80,000$ 106,000$ 000,64snoitarbeleC/troppuS slavitseF $ 46,000$
000,57snalP tnempoleveD sdleifnworB/nwotnwoD 034,2sesahcruP tnempiuqE suoenallecsiM $ $ 986,791tcejorP tnempoleveD $ Special/Limited Contributions or Payments:000,52etutitsnI secneicS efiL lairtsudnI 000,51evitaitinI gninozeR evitcaorP $ $
000,52noitomorP ytiC ecremmoC fo rebmahC $ Infrastructure 000,002tcejorP latipaC no tnemeltteS lageL $
007,9noitazilativeR nwotnwoD $ 9,700 003,3noitilaoC etaR retaW/noitroP ytiC $ $ Riverfront Recreation Complex & Trail $ 58,138 10,760$ Youth Soccer League - Field Improvements 15,000$ Riverfront Alternate Access Study 62,500$ ECHO-ADA Accessibility Manual 3,750$
429,952sliarT ekiB dna ekiH 000,32tnemssessA latnemnorivnE $ $ 045,1stnemevorpmI evirD ruhtrAcM $ 1,540$ 010,61noitavoneR xelpmoC sinneT seyoN $
581,6stnemecalpeR egangiS ytiC $ 000,05tcejorP evreserP yrotsiH gniviL $
747,881,1serutidnepxE latoT $ 924,681$
SOURCE: City of St. Joseph
CITY OF ST. JOSEPH

73
2003 Actual Expenditures
2004 Actual Expenditures
2005 Budget2003 Actual Expenditures
2004 Actual Expenditures
2005 Budget
Juvenile Office Circuit Court
Academy Improvements & Equipment
18,331 146,8tnempiuqE truoC tiucriC $ $ 10,118$ 12,000$
000,5tnempiuqE elinevuJ $
Project Payoff Match 27,000$ Data Processing
Commercial Telecom Service 5,827$ 7,167$ 7,200$
Health and Welfare Computer Equip./Service 241,341$ 207,894$ 420,000$
Health Department 126,397$ 141,038$ 132,500$
005,22latipsoH ycreM $
Public Services
Soil & Water Conservation District
10,000$ 10,000$ 10,000$
General Accounts
Community Support 149,333$ 208,059$ 100,000$
New Radio System 53,177$ 53,177$ 53,177$
Green Acres Relocation 12,570$
Public Defender Lease 35,626$ 35,739$ 35,600$
439,591egatsoP $ 154,650$ 220,000$
Professional Services 223,624$ 242,039$ 150,000$
Radio Antenna Contract 12,725$ 12,000$ 12,000$
General Expenses 182,751$ 161,566$ 144,576$
677,523,1SLATOT $ 1,243,447$ 1,302,053$
SOURCE: Buchanan CountyNOTE: Numbers were rounded off
COUNTY OF BUCHANAN

74
CITY OF ST. LOUIS
Three Primary Sources:2% AGR Tax:
Admission Fee:
Port Authority Lease (2%of AGR):
FY02 FY03 FY04 FY05 FY06b
Public Safety000,05 gnithgiL teertS tnorfreviR $
000,006 ytirohtuA troP ot tnemyaP $ 600,000$ 600,000$ 575,000$ 300,000$ 627,994slortaP eciloP $ 650,000$ 650,000$ 650,000$ 950,000$ 010,32seilppuS tinU eniraM tnemtrapeD eriF $ 40,273$ 9,977$ 2,509$ 25,000$
Compulsive Gamblers' Fund 50,000$ Subtotal 1,122,736$ 1,340,273$ 1,259,977$ 1,227,509$ 1,325,000$
Capital Improvements000,000,4noitubirtnoC dnuF latipaC $ 5,445,000$ 3,900,000$ 3,600,000$ 3,700,000$
Subtotal 4,000,000$ 5,445,000$ 3,900,000$ 3,600,000$ 3,700,000$ Economic Development
000,002,1tnempoleveD cimonocE CDLS $ 1,400,000$ 1,500,000$ 1,500,000$ 1,500,000$ Subtotal 1,200,000$ 1,400,000$ 1,500,000$ 1,500,000$ 1,500,000$
Total 6,322,736$ 8,185,273$ 6,659,977$ 6,327,509$ 6,525,000$
SOURCE: City of St. Louis
Allocated to support police patrols, fire marine unit supplies and conduct public safety related capital improvements on the riverfront.
Allocated to the City's Capital Fund. These funds are budgeted each year for items such as arterial street paving, bridge repair, rolling stock replacement, public building improvements, etc.
In addition to gaming taxes, this revenue is in the form of a lease payment paid to the Port Authority. These funds are generally appropriated for furthering housing and economic development efforts of the St. Louis Development Corporation (SLDC).

75
# of Occurrences A rettaM tcejbuSepyT noitc16 Approval of Minutes Commission Meeting Minutes Adopted
tegduB 6002 YF fo lavorppAtegduB1senif - detaler onisaCnoitcA yranilpicsiD42
I leveL - laudividnInoitcA yranilpicsiD215 Hearing Officer Recommendation Individual's license denied1 Hearing Officer Recommendation Individual reprimanded10 Hearing Officer Recommendation Individual's license revoked3 Hearing Officer Recommendation Individual's license suspended5 Hearing Officer Recommendation Case/Discipline dismissed1 Hearing Officer Recommendation Fine amended - Casino1 Hearing Officer Recommendation Penalty voided - Casino2 Hearing Officer Recommendation Approval of Design & Dockside for Casino One - City & County1 Hearing Officer Recommendation Organization's license suspended - Bingo
srerutcafunaM ogniBdeweneR esneciL9sonisaCdeweneR esneciL9
sreilppuSdeweneR esneciL91ogniBdeussI esneciL1
deripxe dah esnecil s'eesneciLssimsiD ot noitoM42 Gaming License Issued Casino35 Occupational License Issued Individual19 Rules & Regulations - Casino related Final Order of Rulemaking10 Rules & Regulations - Casino related Proposed Amendment2 Rules & Regulations - Casino related Proposed Rule29 Rules & Regulations - Bingo related Final Order of Rulemaking1 Rules & Regulations - Bingo related Proposed Amendment2 Rules & Regulations - Bingo related Proposed Rule21 Rules & Regulations - Bingo related Proposed Rule Amendment8 Rules & Regulations - Bingo related Proposed Rescission
detaler ogniBtnemeltteS11 detaler onisaC tnemeltteS7
I leveL - laudividnItnemeltteS3sretneserP suoiraVsnoitatneserP23
Summary of Missouri Gaming Commission (MGC) Actions During FY 2005

76
Contacting the Missouri Gaming Commission
The Missouri Gaming Commission offi ces are located in Jefferson City, Kansas City and St. Louis. The offi ces are open Monday through Friday except on state holidays.
Jefferson City: Missouri Gaming Commission Headquarters3417 Knipp Drive(Mailing Address: PO Box 1847) Jefferson City MO 65102 Telephone: (573) 526-4080 Fax: (573) 526-1999
Kansas City: Missouri Gaming Commission Kansas City Offi ce6300 Enterprise Road, Suite 125 Kansas City MO 64120 Telephone: (816) 482-5700 Fax: (816) 482-5704
St. Louis: Missouri Gaming Commission St. Louis Offi ce11775 Borman Drive, Suite 104 St. Louis MO 63146 Telephone: (314) 340-4400 Fax: (314) 340-4404
Web site address: http://www.mgc.dps.mo.gov