missouri gaming commission · gaming tax rate of adjoining states and the effects of the loss...
TRANSCRIPT

Julian Seeherman,Chairman
Robert C. Smith,Vice-Chairman
Lynne R. Nikolaisen,Secretary
L.G. Ullery,Commissioner
Julian Seeherman,Chairman
Robert C. Smith,Vice-Chairman
Lynne R. Nikolaisen,Secretary
L.G. Ullery,Commissioner
MissouriGaming
CommissionAnnual Report to
the General AssemblyFiscal Year 1999

Missouri Gaming CommissionMission Statement
�To administer honestly, equitably andefficiently the statutes and rules and regulations
that govern the riverboat gaming, bingo andhorse racing industries in Missouri.�
Permission to reproduce cover photograph granted by the Missouri Department of Tourism.
3
Missouri Gaming Commission Mission Statement ...................................... 2The Commissioners .......................................................................................................... 4Message from the Chairman ....................................................................................... 6§ 313.837 Report on Competitiveness ................................................................... 8
Introduction ............................................................................................................................ 8Effect of the Loss Limit on Competitiveness .................................................................. 8Competitive Impact of Missouri�s Gaming Tax Rate ................................................. 10
Gaming Market Report ................................................................................................ 15Introduction .......................................................................................................................... 15Statewide Market ................................................................................................................. 15Kansas City Market ............................................................................................................. 16St. Louis Market ................................................................................................................... 17Other Markets ...................................................................................................................... 18
Where Does the Gaming Money Go? ................................................................. 19Introduction .......................................................................................................................... 19Use of Funds ........................................................................................................................ 21Remaining Admission Fee Use ......................................................................................... 22
Early Childhood Education ........................................................................................ 23Continuous Boarding ..................................................................................................... 24
Introduction .......................................................................................................................... 24History of the Boarding Restriction ............................................................................... 24The Boarding Restriction and the $500 Loss Limit .................................................... 25The Boarding Restriction�s Impact on Other Regulatory Priorities ....................... 26
Problem Gambling .......................................................................................................... 28The Missouri Alliance to Curb Compulsive Gambling ............................................... 29The Need for Additional Research ................................................................................... 30
Charity Gaming � Bingo .............................................................................................. 31Audit and Enforcement ...................................................................................................... 32History of Bingo in Missouri ........................................................................................... 33
Fiscal Year 1999 Report Appendices ................................................................... 35
Contents

4
The Commissioners
Mr. Seeherman is the former Chairman of the Board of the Venture Stores. Prior to becom-ing Chairman of the Board, Mr. Seeherman held various top executive positions withVenture. He began his career as a retailer with Abraham & Straus, a division of FederatedDepartment Stores, in 1951. In 1977, Mr. Seeherman joined the May Co. as President andCEO of Consumers Distributing. Mr. Seeherman currently operates a consulting business.Mr. Seeherman was inducted into the Discounting Hall of Fame in 1995. He is a recipientof the International Mass Retail Association�s Partnership Award and was voted the 1991Discounter of the Year by retail industry executives. Mr. Seeherman is currently or hasserved on the boards of Webster University, the Boy Scouts, Junior Achievement, CivicProgress, Jewish Community Center Association, Jewish Hospital, Greenfield Industries,Inc. and is involved in many other charitable and business organizations in the St. Louisarea.
Lynne R. Nikolaisen is a former Regional President for Mercantile Bank NA. She beganher banking career in 1980, holding various sales and management positions for the twolargest banks in St. Louis. At the present time Ms. Nikolaisen is a consultant for DoncasterClothing and also handles stock portfolio management.
Ms. Nikolaisen is currently or has been involved as a member and/or director of theRCGA, NAWBO, the Mathews-Dickey Boys Club, Outstanding Women, the MissouriDevelopment Finance Board and the St. Louis AMC Cancer Research Board. She is alsoactive in fundraising for various charitable and civic organizations.
Julian M. Seeherman, Chairman
Lynne R. Nikolaisen, Secretary

5
Mr. Smith is a retired senior partner in the firm of Smith, Lewis, Beckett, Powell & Roark. Heformerly served as a Master in Federal Court on insurance litigation. He has served as anarbitrator for the U.S. and Midwest Arbitration Associations and as a Missouri Administra-tive Hearing Commissioner. Mr. Smith served as a member of the Missouri House of Repre-sentatives from 1953-56, including two years as Speaker Pro-tem. He was Mayor of Colum-bia from 1961-63. Mr. Smith has served on numerous Missouri Bar Association boards,including the Board of Governors from 1975-79. He has served as a member of the StephensCollege Board of Curators; President of Columbia Kiwanis; President of the Missouri Sym-phony Society; and a Member of the State Historical Society Board of Trustees. He hasreceived the Missouri Bar Pro-bono Award; University of Missouri Alumni Faculty Award;University of Missouri Law School Citation of Merit; Outdoor Writers Association OfAmerica Ham Brown Service Award; and is an Honorary Citizen of Fulton, Missouri.
Major Glen Ullery retired from the Missouri State Highway Patrol in 1991. After retirement,Major Ullery served as Safety Director for Crabtree-Harmon Corp. where he established andorganized its safety department. Major Ullery continues to work as a safety consultant forvarious organizations.
During his 27-year career with the Highway Patrol, Major Ullery was instrumental indeveloping programs to reduce fatalities on the highways and increase safety monitoring ofthe public. He implemented a statewide drug interdiction program, reintroducing techniquesand encouraging officers on the road to be alert to criminal activities and operations. Thisprogram has been recognized as one of the best criminal apprehension efforts in the nation.
Robert C. Smith, Vice-Chairman
Major L.G. Ullery (retired)
* There is currently one vacancy on the Commission.

6
Message from the Chairman
I am pleased to present the Missouri GamingCommission�s Annual Report for fiscal year 1999. It is submit-ted to comply with the Commission�s statutory reporting man-dates and to provide you with a status report of the riverboatgambling, bingo and horse racing industries in Missouri.
Among the topics addressed in this year�s report are anupdate on the state of gaming in Missouri; a summary of thestatus of each licensed facility; the statutorily required report onthe impact Missouri�s tax rate and gaming regulations have onits licensees� ability to compete with gaming operations inadjoining jurisdictions; an expanded section on the use ofgaming revenue; a report on the issue of continuous boarding;an update on the Commission�s programs for problem gambling;and a comprehensive history of bingo as well as an update of thestatus of charity gaming.
One of the more difficult challenges that continuouslyfaces the Commission is to effectively communicate its missionto the public. The Commission frequently finds that it is not wellunderstood that its responsibility is to administer the statutes,rules and regulations that govern the gaming industry. While theCommission does have some latitude to set policy through therules, the broader policy governing gaming is set by the legisla-ture and is not within the authority of the Commission.
The issue of continuous boarding is an example of anarea where the Commission can revise the rules regarding theway the gaming statute is administered. There is no statutoryreference to a boarding restriction. The restriction was createdby the Commission in 1994 to prevent continuously dockedgaming boats from having a competitive advantage over thosethat cruised. During the Commission�s review of this policy, itbecame apparent that it no longer served a legitimate purpose. A
detailed description of this process is contained in a sectionbeginning on page 24.
Continuous boarding is an example of how the Commis-sion must constantly review and reevaluate the rules administer-ing the gaming statutes. However, the Commission�s primaryfocus is to serve Missouri citizens by honestly and efficientlyenforcing the gaming law and the rules and regulations. By sodoing, the Commission administers a system that will produce astrong economic benefit in the form of employment, additionaltax income and increased economic development. The economicdevelopment produced by this activity has not been limited togaming operations but has involved non-gaming economicdevelopment as well.
Another principle function of the Commission is tocollect gaming taxes and admission fees. I am pleased to reportthat in fiscal year 1999 the Commission collected $161.6 millionin state tax on gaming revenues. All of this money will be usedto fund public education. In addition, the Commission collected$40.8 million in state admission fees. The distribution formulafor these funds is complex and is explained in detail beginningon page 19. Finally, the home dock cities will have receivedalmost $60 million to help them fund programs for public safetyand improving the infrastructure of their communities.
The charge of the Commission is to give the state aclean industry, free from criminal influence. By enforcing thegaming statutes and rules, the Commission staff is able to fulfillthis responsibility. I am pleased to report that the staff continuesto vigorously apply these standards and whenever any evidenceof crime or wrongdoing has been discovered, it has been ex-posed and eliminated and any responsible parties have been heldaccountable.
7
In addition, the Commission has high standards for theconduct of gaming that we expect the operators to live by.Whenever these standards are breached, stiff penalties areimposed upon all parties. The penalties include fines andsuspension or revocation of licenses for the guilty parties.
Problem gambling is an issue that will always be presentwherever gaming is conducted. The Commission understands itsresponsibility to be involved in education, treatment and preven-tion efforts to minimize the impact of problem gambling. TheCommission continues to strive to be an innovative leader onthis issue and its work in this area over the past year is explainedbeginning on page 28 of this report. The Commission willcontinue to work with the Missouri Department of MentalHealth, gaming operators, communities and social organizationsto provide a comprehensive program to prevent problem gam-bling and treat those who suffer from it.
1999 was a year of transition for the Commission and itsstaff. Robert L. Wolfson, who was the first Chairman of theCommission, completed his term after nearly six years ofservice to the Commission and the state. It was Bob�s responsi-bility to develop the plan of how to best operate gaming in ourstate; to develop a plan to organize the staff; to develop the rulesand regulations that would administer the gaming statues; and todetermine a selection process for licensees who would best servethe state and the communities in which they operated. We can beproud of what Bob, his original Commission, and the staff havedone. Their efforts have resulted in establishing the MissouriGaming Commission�s national reputation for strict regulationand a firm but fair application of the law. All of the originalCommissioners have rotated off the Commission and have leftthe new Commissioners a legacy that we can look up to withhonor and dignity and continue to strive to maintain the high
standards they have set for all of us.
An organization is only as good as its staff can make it,and we are very fortunate to have a superb staff dedicated totheir jobs and the mission of the Commission. Our ExecutiveDirector, Deputy Directors, the legal and support staff and themembers of the Highway Patrol assigned to the Commission,allow us to do the kind of a job that is virtually without fault.The determination by all of them can only lead to continuedsuccess for all that lies ahead of us as these industries grow inour state.
We are extremely pleased with our record in 1999 andlook forward to continually fulfilling our mission as we goforward.
Respectfully Submitted,
Julian SeehermanChairman

8
§ 313.837 Report on CompetitivenessIntroduction
Section 313.837, RSMo. requires the Commission to report annually to the General Assem-bly �the status of the competitiveness of Missouri excursion gambling boats when compared to thegaming tax rate of adjoining states and the effects of the loss limits imposed by subdivision (3) ofsection 313.805 on the competitiveness of the gaming industry in Missouri.�
Effect of the Loss Limit on CompetitivenessThe loss limit continues to be the source of the most frequent complaints of gaming patrons.
Through reports from licensees and direct observations by Commission staff, it is clear that a largeportion of riverboat gaming customers view the loss limit as intrusive, patronizing, frustrating,confusing and inconvenient.
Missouri operators continue to lag behind gaming operators in neighboring states with noloss limits. The shortfall exists despite expansion efforts and new property developments which haveproduced facilities that are larger, provide superior comfort and more non-gaming amenities thantheir competitors in other states. For the fifth consecutive year, the data clearly shows that the losslimit reduces customer counts and revenues for Missouri operators. The inconvenience of the losslimit results in the export of Missouri gaming customers to other states and the loss of potentialgaming revenue from local gamers and tourists.
This proposition is supported not only by the chart on page 9, but also by the fact that Illinoisriverboats are capturing a larger market share than that state�s population base represents. Missouriresidents account for 76% of the St. Louis metropolitan area population base.1 However, Missouricasinos in the St. Louis metropolitan area capture only 66% of the gaming revenue market.2 Thisequates to an inequity of $55.4 million in relation to gaming revenue and $16.1 million in state andlocal taxes per year.
Furthermore, to put this data in a different perspective, it is unlikely that Illinois is capturingmore than its share of the tourist market because of the proximity of the Missouri properties to theairport and downtown. In addition, the Missouri properties are more lavish and offer more non-gaming amenities than their Illinois competitors. Therefore, all other things being equal, the Missouriproperties seem more likely to attract tourists. If this theory is correct, it must be assumed that almostall of the $55.4 million inequity is a direct transfer of wealth from Missouri to Illinois. Regardless ofthe validity of this theory, it is irrefutable that Missouri gaming facilities, although generally superior
1 Randy McNally Metropolitan StatisticalAreas. January 1, 1997 estimate.
2 Based on Missouri fiscal year 1999 datafrom the Illinois Gaming Control Boardand the Missouri Gaming Commission.

9
in design and location, are not earning their fair share of the market.
The Commission understands that the General Assembly may have intended that Mis-souri gaming facilities operate at a competitive disadvantage in order to achieve a public policyobjective advanced by the loss limit. If the public policy objective was to prevent patrons frombecoming problem gamblers, it now seems appropriate to revisit the issue to determine if thepolicy is having its intended effect. As noted in the section on problem gambling later in thisreport, the Commission believes that further study is needed in order to determine the bestmethod to deter, prevent and treat problem gambling.
The Commission is planning a program evaluation of its voluntary exclusion programfor problem gamblers which may provide some insight into this issue. However, if the issuesrelating to problem gambling and the $500 loss limit are to be fully examined, resources must beauthorized to conduct a thorough study. This includes funding for research and a full timeemployee that administers and continually evaluates the voluntary exclusion program. The
43.15
46.73
37.69
41.45 20.29
22.02
Illinois Iowa Missouri
State
0
10
20
30
40
50
Win
Per
Adm
issi
on in
Dol
lars
FY 1998
FY 1999
Win Per AdmissionMissouri vs. Neighboring Jurisdictions

10
Commission requests that the General Assembly appropriate money for such purposes consistentwith the Commission�s budget request that will be submitted later this year.
The above findings are intended to satisfy the Commission�s statutory mandate to reportannually to the General Assembly on the effects of the loss limit on the competitiveness of thegaming industry in Missouri. The enactment of any changes in policy as a result of these findingsare obviously the purview of the General Assembly and the Governor.
Competitive Impact of Missouri�s Gaming Tax RateThe gaming tax rates imposed on riverboat gaming operations in Missouri have not
changed since the first licenses were issued in May 1994. Missouri law imposes an 18% tax onthe adjusted gross receipts (AGR)3 of riverboat gaming operators. In addition, a local tax of 2%on AGR is collected by the state and distributed to each home dock city or county.4
The statute also imposes an admission fee on the operators of excursion gambling boats
3 Adjusted gross receipts are defined bySection 313.800, RSMo as �the grossreceipts from licensed gambling games anddevices less the winnings paid towagerers.� In other words, the amount thecasino �wins� from patrons. It is oftenreferred to as �casino win�. The tax onAGR is set forth in Section 313.822,RSMo.
4 Section 313.822, RSMo.
$22
$47$41
$21
$34 $36 $34$38
$22
$41
MissouriIllinois
Iowa St. LouisAlton
E. St. Louis CaruthersvilleMetropolis St. Joseph
Council Bluffs$0
$10
$20
$30
$40
$50
$60
Win Per AdmissionMissouri vs. Competing Jurisdictions

11
in the amount of two dollars ($2) per patron, per excursion, which is split between the homedock community and the state.5 Furthermore, pursuant to section 313.824, RSMo., excursiongambling boat operators are charged for the cost of gaming agents that are assigned to theriverboat with the responsibility of protecting the public. While the cost of Commission agentsvaries with each operation, the average annual cost is approximately $578,179 per boat.
The Overall Impact of Gaming Taxes and FeesRiverboat gaming operators are taxed unlike any other business. The Commission�s
experience in responding to public information requests is that the gaming tax structure is notwell understood. To put the gaming tax in perspective, consider the following example. If agaming operator takes in $1,000,000 in gross revenue, it must pay $200,000 in gaming taxes.6
Assuming it required 50,000 admissions to accumulate $1,000,000 in gross revenue, the operatorwould have to pay an additional $100,000 in admission fees.
7 Finally, the operator is responsible
for the cost of the gaming agents assigned to that facility during the period that the $1,000,000 isgenerated. Assume that the gaming agent cost is $6,000, leaving $694,000 in net revenue aftergaming taxes, admission fees and gaming agent reimbursements. The operator must then pay allits expenses, such as outstanding debt on capital, employee salaries and benefits, utilities,marketing, local property tax, sales taxes and other business expenses related to the operation ofthe casino. After paying all the gaming taxes, fees and operating expenses, the casino must paythe applicable federal, state and local income taxes like any other business.
Comparing the Missouri Tax Rate to Other JurisdictionsUntil recently, Missouri�s gaming tax was structured almost identically to Illinois, the
state that hosts its principal competitors. The Missouri tax rate is significantly higher than theIowa rate and is difficult to compare to casino operations at Indian reservations in Kansasbecause revenue figures are not available and no taxes are assessed. The Missouri tax structurewas originally patterned after the Illinois system. However, recent legislative changes have beenenacted in Illinois that now significantly distinguish its tax rates from Missouri�s.
Furthermore, the addition of more Indian casinos in Kansas has increased competition inthe Kansas City and St. Joseph markets. While the Kansas Indian casinos face a disadvantagebecause of their less convenient locations, the fact that they pay no state taxes and do not haveloss limits provide them with a tremendous advantage over their Missouri competitors.
8 In
addition, Indian tribes are attempting to secure permission to open casinos in Miami County,
5 Section 313.820, RSMo.
6 In this example, gross revenue is the sameas AGR described in footnote 3 on page 10.It is the amount the casino �wins� from itspatrons.
7 While a gaming operator may chargepatrons for admission, it is not required bylaw. The casino is assessed $2 peradmission regardless as to whether itcharges patrons for admission. In Missouri,most operators do not charge for admission.
8 Indian casinos are not regulated by anyindependent agency. Therefore, Indiancasino operators do not have to pay for thecost of regulation, which is significant.

12
Kansas and at the Woodlands racing facility in Kansas. Both of these proposed sites have closeproximity to casino operators in the Kansas City area and would have a substantial and immedi-ate impact on jobs and state revenue.
Illinois Legislative ChangesDuring the past two legislative sessions, the Illinois legislature has enacted major
changes to the riverboat gaming tax structure. In 1998, the flat 20% tax on adjusted gross re-ceipts was abandoned in favor of a progressive scale ranging from 15% to 35% of gross rev-enue.9 In 1999, the legislature eliminated the stayover admission fee along with the cruisingrequirement.10 Illinois chose not to continue collecting stayover fees by eliminating phantomcruises similar to those conducted in Missouri, electing instead to assess only one $2 fee perpatron rather than a $2 fee for each two hour �cruise�.11
Effective Gaming Tax RateStates that have legalized gaming have devised a variety of different taxes, fees and
assessments that apply to casino operators. In addition, varying regulatory policies have asignificant impact on the amount of revenue a casino operator generates. In order to compare theeffects of such policy decisions, industry analysts and those who research public policy issuesrelated to gaming have devised a simple formula to compare the public costs paid by gamingoperators in various states. Commonly referred to as the �effective tax rate� the formula issimply the total of all gaming taxes, fees and assessments as a percentage of gross revenue.
12
The effective tax rate is a helpful tool on at least two levels. First, it consolidates intoone number all gaming taxes, fees and assessments that casino operators are required to pay.These expenses are typically separated in public report tables and it becomes difficult to evaluatethe total costs being paid by a casino operator in order to maintain the privilege of being li-censed. In addition, assessments against a licensee for various regulatory activities are often notreflected in the revenue reports that are distributed by the states.13 However, these costs can besignificant and must be considered in evaluating the effect of taxes and regulations on theeconomic impact of gaming.
The effective tax rate is instructive in comparing the impact of varying state regulatoryschemes on gaming revenues. When regulations limit the amount of revenue that a gaming
9 Illinois P.A. 90-548, 1998. The scaleimposes a tax of 15% on AGR up to $25million; 20% between $25 and $50 million;25% betwen $50 and $75 million; 30%between $75 and $100 million; and 35%over $100 million.
10 SB 1017, Illinois General Assembly,1999.
11 Id.
12 The formula does not include taxes andfees that are not unique to the gamingindustry. Therefore, such things as stateincome or sales tax are not included.
13 For instance, Section 313.824, RSMo.requires that the riverboat gamblingoperators reimburse the Commission forthe full cost of the staff necessary to protectthe public. Last year this resulted in anaverage annual cost of $578,179 perlicensee. However, these costs are notincluded in the revenue report issued by theCommission.
13
30%
20%
30%
Illinois * Iowa ** Missouri
State
0%
5%
10%
15%
20%
25%
30%
35%
Effe
ctiv
e T
ax R
ate
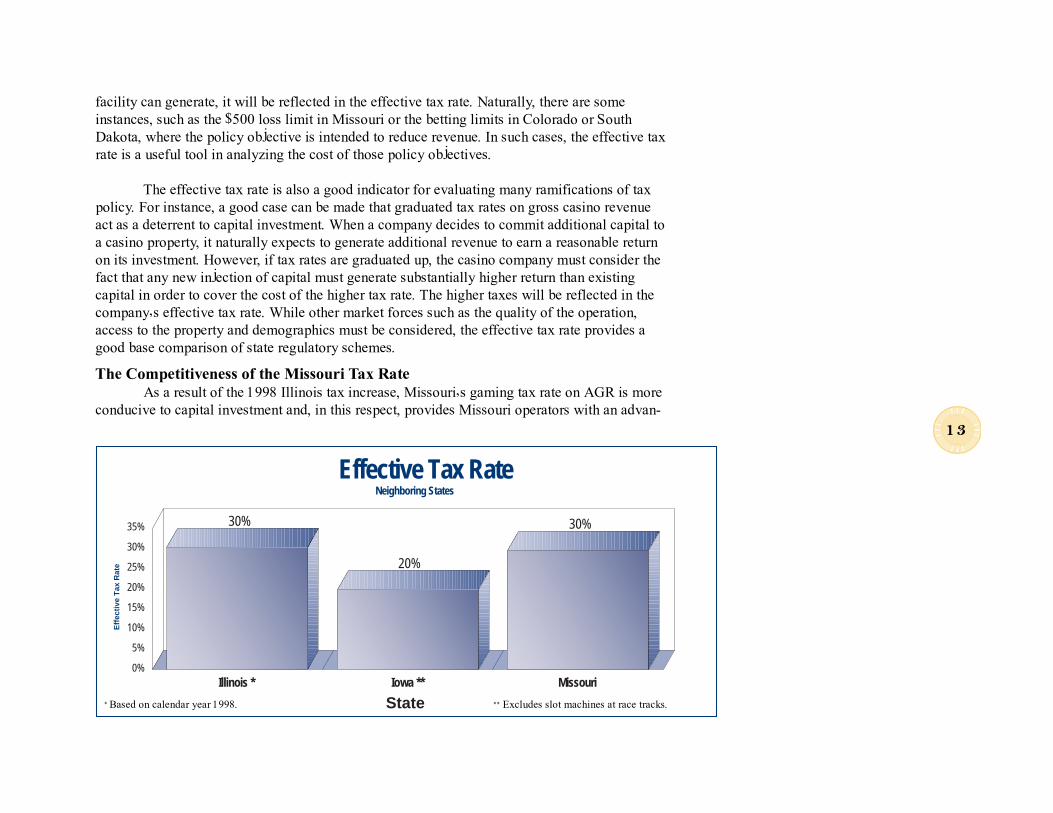
Effective Tax RateNeighboring States
facility can generate, it will be reflected in the effective tax rate. Naturally, there are someinstances, such as the $500 loss limit in Missouri or the betting limits in Colorado or SouthDakota, where the policy objective is intended to reduce revenue. In such cases, the effective taxrate is a useful tool in analyzing the cost of those policy objectives.
The effective tax rate is also a good indicator for evaluating many ramifications of taxpolicy. For instance, a good case can be made that graduated tax rates on gross casino revenueact as a deterrent to capital investment. When a company decides to commit additional capital toa casino property, it naturally expects to generate additional revenue to earn a reasonable returnon its investment. However, if tax rates are graduated up, the casino company must consider thefact that any new injection of capital must generate substantially higher return than existingcapital in order to cover the cost of the higher tax rate. The higher taxes will be reflected in thecompany�s effective tax rate. While other market forces such as the quality of the operation,access to the property and demographics must be considered, the effective tax rate provides agood base comparison of state regulatory schemes.
The Competitiveness of the Missouri Tax RateAs a result of the 1998 Illinois tax increase, Missouri�s gaming tax rate on AGR is more
conducive to capital investment and, in this respect, provides Missouri operators with an advan-
* Based on calendar year 1998. ** Excludes slot machines at race tracks.

14
tage over their most direct competitor. Currently, Missouri properties generally enjoy a capitalinvestment advantage over their Illinois competitors. The average investment of the properties inthe St. Louis metropolitan area in Missouri is approximately $125 million versus an estimated$67.5 million in Illinois.
14 The Missouri properties in the St. Louis area average 1,750 gaming
positions in 52,250 square feet of gaming space as opposed to the Illinois average of 1,002positions in 23,400 square feet. Furthermore, the Missouri properties have more non-gamingamenities than the facilities in Illinois.
However, any advantages gained through a lower AGR tax are diminished when consid-ering that Illinois does not charge for the cost of Commission agents assigned to gaming facili-ties to protect the public and because of the 1999 legislative changes where the stayover admis-sion fee was eliminated. To illustrate the impact of these changes, in Missouri fiscal year 1999,the Casino Queen and Alton Belle paid $5,233,554 in stayover admission fees.15 These fees wereeliminated on June 26, 1999, thus freeing the Illinois operators to utilize more money to maketheir facilities more attractive to patrons. The net result is that more Missourians are likely tospend their gambling dollar in Illinois and fewer Illini will travel to the more elaborate propertiesin Missouri. While the Illinois facilities will no longer be responsible for paying stayover admis-sion fees, Missouri boats will continue to pay for stayover customers which resulted in paymentsfrom St. Louis area facilities of $14,290,000 to state and local governments in fiscal year 1999.
16
There have been no changes to the Iowa tax rate since the first Missouri gaming facilitieswere licensed in 1994. Because its graduated rate tops out at 20%, Iowa has a lower tax on AGRthan Missouri. In addition, Iowa�s admission fee is set by the Commission and designed only tocover the cost of regulation and provide some local revenue. Therefore, Iowa gaming facilitiespay an average of $1.40 less per admission than their Missouri competitors.
The Missouri tax rate is certainly one of the highest in the gaming industry. However, itsstructure has some inherent advantages over Illinois� and the lower tax rate in Iowa does notappear to be affecting the competitiveness of the Missouri operators. Certainly, over the longterm, the fact that Kansas Indian casinos pay no tax will have an impact on western Missourioperators. Finally, because Missouri has chosen the gradual approach to licensure by waiting tointroduce new gaming capacity into a market until there is some indication that it can be ab-sorbed, the tax rate has been effectively managed by the Missouri casino licensees.
15 Illinois Gaming Control Board reports.The Alton Belle had 921,791 stayoveradmissions, the Casino Queen had1,694,986. Each stayover admissionresulted in a $2 fee, split between the hostcommunity and the state.
16 Even if a continuous boarding policy isadopted, Missouri casinos will continue topay admission fees for stayover patrons.Statewide, stayovers accounted for$33,891,026 in admission fees.
14 Because the Casino Queen is a privatecompany, there are no officially reportedcapital investment figures. However,Prudential Securities estimates theinvestment to be $90. Prudential SecuritiesInvestors Guide to U.S. Gaming Markets,Spring 1999 Edition, page 115.
19
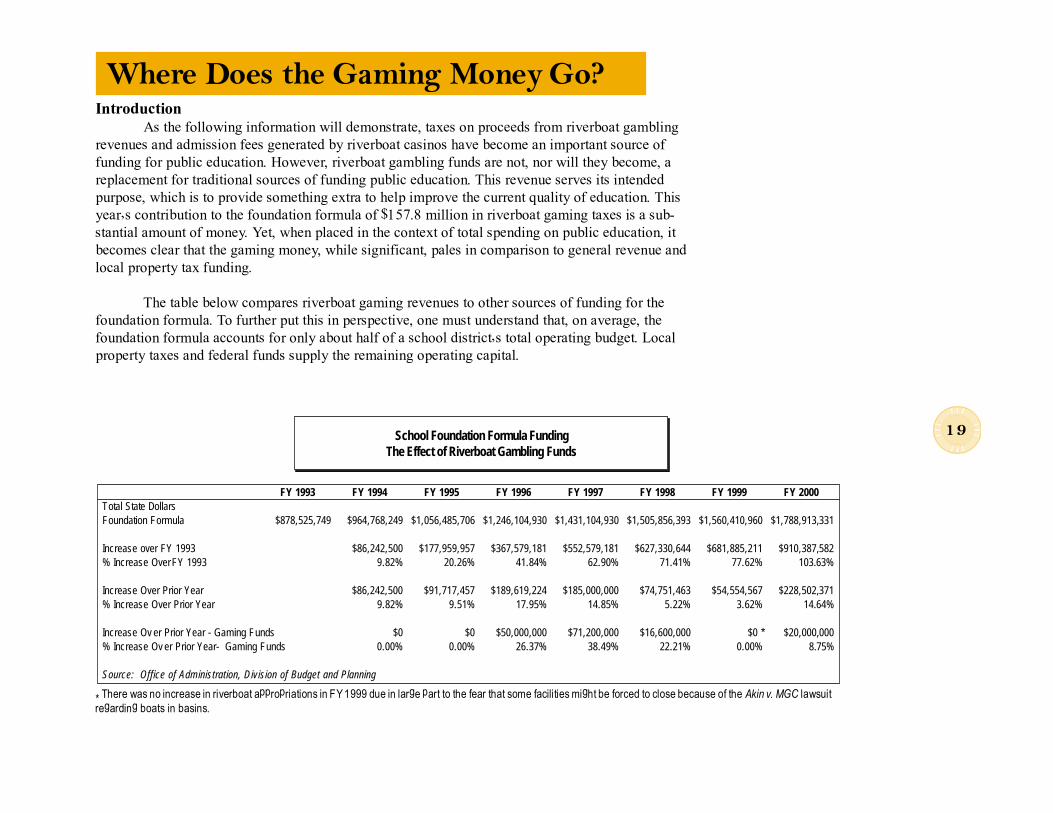
IntroductionAs the following information will demonstrate, taxes on proceeds from riverboat gambling
revenues and admission fees generated by riverboat casinos have become an important source offunding for public education. However, riverboat gambling funds are not, nor will they become, areplacement for traditional sources of funding public education. This revenue serves its intendedpurpose, which is to provide something extra to help improve the current quality of education. Thisyear�s contribution to the foundation formula of $157.8 million in riverboat gaming taxes is a sub-stantial amount of money. Yet, when placed in the context of total spending on public education, itbecomes clear that the gaming money, while significant, pales in comparison to general revenue andlocal property tax funding.
The table below compares riverboat gaming revenues to other sources of funding for thefoundation formula. To further put this in perspective, one must understand that, on average, thefoundation formula accounts for only about half of a school district�s total operating budget. Localproperty taxes and federal funds supply the remaining operating capital.
Where Does the Gaming Money Go?
* There was no increase in riverboat appropriations in FY 1999 due in large part to the fear that some facilities might be forced to close because of the Akin v. MGC lawsuitregarding boats in basins.
FY 1993 FY 1994 FY 1995 FY 1996 FY 1997 FY 1998 FY 1999 FY 2000Total State DollarsFoundation Formula $878,525,749 $964,768,249 $1,056,485,706 $1,246,104,930 $1,431,104,930 $1,505,856,393 $1,560,410,960 $1,788,913,331
Increase over FY 1993 $86,242,500 $177,959,957 $367,579,181 $552,579,181 $627,330,644 $681,885,211 $910,387,582% Increase Over FY 1993 9.82% 20.26% 41.84% 62.90% 71.41% 77.62% 103.63%
Increase Over Prior Year $86,242,500 $91,717,457 $189,619,224 $185,000,000 $74,751,463 $54,554,567 $228,502,371% Increase Over Prior Year 9.82% 9.51% 17.95% 14.85% 5.22% 3.62% 14.64%
Increase Ov er Prior Year - Gaming Funds $0 $0 $50,000,000 $71,200,000 $16,600,000 $0 * $20,000,000% Increase Ov er Prior Year- Gaming Funds 0.00% 0.00% 26.37% 38.49% 22.21% 0.00% 8.75%
Source: Office of Administration, Division of Budget and Planning
School Foundation Formula FundingThe Effect of Riverboat Gambling Funds

20The Commission does not suggest that the tax revenue from riverboat gaming is insig-
nificant. In five years, taxes on gaming revenue and admission fees have contributed over $725million to the state treasury.21 The Missouri Constitution requires that all state tax revenuederived from the conduct of gambling be used for public education.22 Until recently, the admis-sion fee, which is not derived from the conduct of gaming, has been used for a variety of pur-poses, primarily for programs benefiting the state�s veterans.23 However, because of recentlegislation, the vast majority of the revenue collected from gaming facilities is now used tobenefit public education, regardless as to whether it is subject to the Constitutional requirement.Perhaps most importantly, the gaming tax money helped to fund the new foundation formulaadopted under Senate Bill 380 in 1995. Had the gaming money not been available to allocate tothe foundation formula, the state would have to try to find other funds to replace it. This, ofcourse, would result in either a failure to fully fund the formula or funding reductions in otherareas.
The remaining information in this section provides a history of how the gaming money
21 Source: Office of Administration,Division of Budget and Planning.
22 Constitution of Missouri, Article III,Section 39(d).
23 The admission fee is first used to fundthe regulatory activities of the Commission.In addition, from 1994 to 1998, admissionfees were used primarily to constructnursing homes for Missouri veterans.Finally, while the bulk of the admission feeis currently used for early childhoodeducation and student loans, funds are alsoallocated to help fund nursing homes forveterans, the Missouri National Guard andprograms for the homeless and to detergang violence. The fee is not subject to theConstitutional requirement for gamingmoney because it is not derived from theconduct of gaming.
$157,800,000
$666,345,082
Amount of Increase
Riverboat FundsOther Funds
School Foundation FormulaSource of Increase
FY 95 to FY 00
21
has come to be utilized. While gaming revenue has become an important component of the wayMissouri funds public education, it has not eliminated the occasional need for some local schooldistricts to ask for levy increases. Furthermore, gaming revenues do not generate enough moneyto replace traditional means of funding education. It has provided an important source of newrevenue for education that has allowed all but the wealthiest school districts to add importantresources used to educate Missourians.
Use of FundsDuring the five year tenure of riverboat gaming in Missouri, the tax money generated by
the casino operations has been used for a variety of purposes related to public education. At first,there was a great deal of uncertainty about the amount of revenue that gaming would generateand whether the casino properties would be successful. Prudent policy makers chose at that timeto allocate the gaming revenue for capital improvement projects at the state�s colleges andunversities that could be delayed if the revenue projections proved to be too high.24
As the industry stabilized and it became apparent that the Commission and the Divisionof Budget and Planning could forecast gaming tax revenue with reasonable accuracy, the legisla-ture became more comfortable in using the funds for operational expenses. In 1995, the legisla-ture enacted SB 301 which allocates the gaming tax revenue for the operation of public elemen-tary and secondary schools.25 According to law, the first $7 million is used for the school bondfund with the remainder going to the school foundation formula, which distributes state funds tolocal public school districts.26
Since gaming revenues have been dedicated to the foundation formula, year to yearincreases in the formula have, on average, grown substantially. For the two years prior to theinjection of gaming funds into the formula, it increased approximately 10% per year. Since theintroduction of gaming funds, the formula increases have been as high as 38.48%.
The incorporation of new gaming revenues into the formula become more importantwhen one considers that built into the formula are certain categorical add-on programs that willnot be funded unless the foundation formula is fully funded. These add-ons include programs forspecial needs students, transportation, special education, gifted students, career ladder, voca-tional education and early childhood development programs. Without the $157.8 million ingaming taxes allocated to the foundation formula in FY 2000, the state would have had to cutother programs in order to fully fund the foundation formula or allow these important add-on
24 In FY 95-96, over $56.2 million wasappropriated for capital improvements forMissouri�s colleges and universities.Improvements included numerous libraryimprovements including the KirkpatrickLibrary at CMSU as well as much neededmaintence and rennovation projects in otherparts of the state such as the rennovation ofEckles Hall at the University of Missouri-Columbia.
25 SB 380, adopted in 1994, directed up tothe first $50 million in riverboat gamingadjusted gross receipts tax to the founda-tion formula. SB 301 dedicates all therevenue generated by the state tax adjustedgross receipts of riverboat gaming to thefoundation formula.
26 The School Bond Fund is used by the
Missouri Health and Education FacilitiesAuthority to pay the costs associated withthe issuance of local school district bondsand credit enhancement.

22
programs to go unfunded.
Early Childhood EducationIn addition to the tax revenue generated from gaming activity, the Commission also
collects a $2 admission fee for each patron attending each gaming session.27 This fee is splitbetween the home dock community and the state. The majority of the state�s portion of theadmission fee is used for early childhood education programs.
The Early Childhood Education and Care Fund (ECECF) was established by the legisla-ture in 1998 through the passage of HB 1519 and 1165 and funds programs that prepare childrenfor school prior to their enrollment in kindergarten. The programs are designed to allow morechildren the opportunity to enter school ready to learn. ECECF provides grants to public, privateand parochial schools, to provide early childhood services to assist families in preparing theirchildren with child care and educational arrangements that will prepare them for their formaleducation.
Research has shown that learning begins at birth and that early learning experiences havea decisive influence on brain development. Children who are not provided the opportunity forquality learning experiences may not develop crucial skills, which may significantly affect theirability to learn later in life. Focusing on early childhood care and education is critical as morethan one-half of mothers return to work within one year of their baby�s birth.
The Missouri Early Childhood program has been hailed as a model for the country. Theexpanded program is possible because of an additional $58 million to be used to better prepareMissouri�s children for school and to help provide care for the children of low-income workingparents. Of the $58 million in new money for early childhood programs, the majority is derivedfrom riverboat gaming admission fees.28 The new revenue allocation will provide funding for theearly childhood education initiatives outlined in the blue box on the following page.
Remaining Admission Fee UseThe use of admission fees is not confined to early childhood education. The funds are
also used to pay for the cost of regulating the gaming industry; to deter gang violence and aid thehomeless; to construct, renovate and maintain nursing homes for Missouri veterans; to aid theMissouri National Guard Trust Fund; and to pay for the cost of issuing college student loans.29
27 Section 313.820, RSMo.
28 The breakdown of funds is as follows:$29.2 million from gaming revenue; $10.5million from general revenue; and $18.2million from federal funds.
29 Section 313.835, RSMo.

23
Ö $8.7 million to expand child care subsidies to 3,500 additional low-income working families, bringing the total number of childrenreceiving services to 52,740 each month.
Ö $6.5 million to increase fees paid to child care providers to improveaccess for low-income families.
Ö $3.3 million to increase the child care reimbursement rate paid toaccredited facilities by 20 percent.
Ö $27.9 million for grants to schools and other agencies to expand or
start early childhood programs. The programs include: $22.9 millionfor Jump Start grants to schools and community partnerships topromote quality early childhood care and education for three- andfour-year olds. Schools and community partnerships will begin newprograms with startup grants of $10,000 and expand or start programsat a cost of $2,000 per child per year.
Ö $5.0 million to expand the Early Head Start program for 600 low-income families by providing funds to Head Start agencies that willcontract with center- and home-based facilities to provide child care.The Head Start agencies will be responsible for training, technicalassistance, and monitoring of the facilities.
Ö $891,934 to provide assistance to families and child care providersand to monitor results.
Ö $300,000 for grants to Community Colleges and Area Vo-TechSchools to expand the availability of field-based Child DevelopmentAssociate Certificate programs. Each year about six one-time grantsof $50,000 will be awarded for startup costs, with tuition covering theongoing costs of the program.
Ö $66,500 to the State Library for the Reach Out program, which willprovide libraries with resources and workshops to help child care
providers build literacy skills and enhance language develop-ment in young children. Funds will provide grants to 20 publicand school libraries in rural and high-poverty areas of the stateto purchase resource books and implement workshops for earlychildhood care and education providers.
Ö $4.6 million to increase state funding for the early childhoodspecial education program, which provides services to three- tofive-year old children with disabilities. These funds will expandservices to an additional 222 children for a total of 6,947 childrenreceiving services.
Ö $2.7 million for certificates to low-income at-home parents,allowing them access to early childhood education resources.This program will focus on children from birth to age three andfamilies with incomes below 185 percent of the federal povertylevel.
Ö $1.3 million for the healthy babies program. Funds will be usedfor a prenatal and early childhood nurse visitation program;evaluating various home visitation programs; and a publicawareness campaign to educate and encourage pregnantwomen to seek early and regular prenatal care.
Ö $871,322 to improve children�s health through better nutrition byproviding grants to community partnerships for nutritioneducation and other local needs; training nutrition educators;and expanding the Farmers� Market Nutrition Program.
Ö $498,000 for a nurses home visitation program to reduce childabuse, unplanned subsequent pregnancies, and dependency onpublic assistance. The program will serve an estimated 166 low-income families.
Ö $400,000 to provide additional training for parent educators inthe Parents as Teachers program.
Early Childhood EducationIn 1998, the General Assembly enacted the EarlyChildhood Education and Care Fund through thepassage of HB 1519 and 1165. The act fundsprograms that prepare children for school prior totheir enrollment in kindergarten. The following listsummarizes some of the programs that are designedto better prepare Missouri�s children to succeed inschool.
24
IntroductionFor the past eighteen months the Commission has been studying the usefulness of the
boarding restriction that the Commission imposed when the first excursion gambling boats werelicensed in May 1994. The Commission�s review was prompted by its reservations about thevalue of the boarding restriction. In addition, in January 1998, the Joint Committee on Gamingand Wagering recommended that the boarding restriction be revised to be consistent with thelaws enacted to regulate riverboat gambling.30 The Committee suggested that the revisionsshould ensure the public safety and provide economic benefits to the citizens of the state.
History of the Boarding RestrictionThe original referendum approved by the voters in 1992 that legalized riverboat gam-
bling, provided for both cruising and dockside riverboats.31 The law also required that riverboatoperators pay an admission fee for each patron embarking on a cruise.32 The original law con-tained no provisions imposing or implying a restriction on the time during which patrons couldboard, whether the boat was dockside or cruising. Similarly, neither of the two constitutionalamendments approved by the voters to allow riverboat gambling contained any provisionsrelating to a boarding restriction.
The boarding restriction is a creation of the Gaming Commission. When the Commis-sion licensed the first two riverboat gambling operations in May 1994, it had to determine how toequitably collect the admission fees required by law. In addition, since one riverboat, the Presi-dent Riverboat Casino on the Admiral was continuously docked, while the other, St. CharlesRiverfront Station, cruised, the Commission needed to adopt boarding procedures that preventedone operator from obtaining a competitive advantage over the other. The result was a Commis-sion ruling that the Admiral would have to conduct �simulated cruises� whereby boarding wouldbe restricted during the time when passengers aboard the St. Charles riverboat would be cruising.
The first simulated cruises were imposed by order of the Commission�s executivedirector. All riverboats were required to submit a cruise schedule, to be approved by the Com-mission. As required by rule, the cruises could not be less than two, nor greater than four hoursin length and allowed for a reasonable time for boarding and exiting the riverboat.33 Initially, theCommission determined that 30 minutes was a reasonable time for boarding. However, it soonbecame evident that large crowds and the special accommodations needed for disabled personsrequired additional boarding time. Therefore, in September 1994, the Commission extended the
Continuous Boarding
30The Committee found that �the boardingtime restriction is a regulatory matter. Thisrestriction was implemented by the GamingCommission by policy and is not requiredby statute.� Joint Committee on Gamingand Wagering Annual Report, 1998, page 6.
31 House Bill 149, TAFP, 86th GeneralAssembly. Section 1 (7) and (9) andSection 8.5. The referendum was adoptedby the voters on November 3, 1992 with1,397,750 in favor and 839,568 opposed.
32 Id, Section 9.
33 This issue was a primary focus of theJoint Committee on Administrative Rules�hearings on the Commission�s initial rulesin 1993-94. The Committee expressedstrong feelings that cruise times should beno less than two hours but at no timedemanded that a boarding restriction beimposed. The original rules did not containa boarding restriction. It was added in1995.

25
boarding time to 45 minutes.
The Boarding Restriction and the $500 Loss LimitAs the Missouri experience with riverboat gambling evolved, the boarding restriction
became a component of enforcing the five hundred dollar loss limit. The boarding restrictionprevented patrons from leaving the gaming area after the first 45 minutes and attempting tofraudulently obtain a second loss limit card. Because patrons would not be able to enter thecasino until the next cruise, it was believed that efforts to circumvent the loss limit could bereduced.34
After several years of monitoring patron behavior, it has become apparent that boardingrestriction is, at best, a nominally effective tool in enforcing the loss limit. Once patrons familiar-ize themselves with the procedures, those who are determined to circumvent the loss limitdevelop ways to do so. While Commission agents and casino employees identify a number ofloss limit violators, these patrons often report that they have been able to circumvent the limitundetected on previous occasions. Because there is no penalty for patrons violating the loss limit,the fear of being detected is minimal.35
Therefore, the Commission began investigating new methods to enforce the loss limit. Inaddition to staff research, the Commission conducted two public hearings on continuous board-ing in April and May 1999.36 During the hearings, it was asserted that new systems could bedeveloped to enforce the loss limit while permitting patrons to board at will. In order to test theproposed systems, the Commission authorized a pilot project on continuous boarding in August1999.
The proposed systems varied to account for the differences in the individual propertiesand available equipment. Advances in technology allowed some to use electronic cards, similarto debit cards or those used to access hotel rooms. These cards allow licensees to create a uniqueidentity for each patron and track their buy-in for each gaming session. In addition, some proper-ties have implemented systems similar to those used in amusement parks and dance clubswhereby an invisible stamp is used to identify patrons. The stamp prevents a patron from obtain-ing more than one buy-in card which is critical to the enforcement of the loss limit. The pilotproject allows the Commission to test all these systems to determine their effectiveness inenforcing the $500 loss limit.
The Commission has found that the time that a patron enters or reenters a casino is not
34 In past years the Commission hasrecommended that legislation be adoptedimposing a penalty on patrons that violatethe loss limit. Such legislation has notadvanced beyond a committee hearing. TheCommission continues to advocate theadoption of such a penalty.
35 A frequently used analogy for the losslimit is the old 55 mph speed limit.However, this analogy is flawed in twoimportant ways. First, the 55 mph hourspeed limit was regularly violated by amajority of drivers while the loss limit isviolated by a minute percentage of casinopatrons. The electonric monitoring systemshave enabled the Commission to track thenumber of patrons that buy-in for the full$500 during a gaming session. The numberrarely rises above 2% of total patrons. Theother important distinction is that when amotorist was caught violating the 55 mphspeed limit, they were issued a ticket andpaid a fine. There is no such penalty forviolating the loss limit.
36 Hearings were conducted on April 27,1999 in St. Louis and May 5, 1999 inKansas City. Transcripts are available.

26
critical to the enforcement of the loss limit. It is more important to establish procedures toprevent a patron from obtaining more than one implement needed for buy-in. While somepatrons will devise ways to circumvent even the most restrictive procedures, this illustrates thedeficiencies in the loss limit and the difficulties inherent in the government micro-managingconsumer behavior. Think of requiring all restaurants and bars to limit customers to a specifiednumber of drinks per two hour period. It might be laudable in theory but cumbersome and,therefore, ineffective in practice.
The Boarding Restriction�s Impact on Other Regulatory PrioritiesWhile the loss limit is an important regulatory issue, it is not the only regulatory require-
ment. One of the Commission�s principal responsibilities isto ensure that gambling games are conducted in a safeenvironment and that only those of legal age are allowed toaccess the casino.
The Commission�s two public hearings played animportant role in reviewing the advisability of retaining theboarding restriction. The bulk of the public commentemanated from casino patrons who testified about theirrepugnance for the restriction which they find to be frustrat-ing, inconvenient, patronizing and unnecessary.37 Moreover,many casino employees appeared to inform the Commissionthat the boarding restriction made the job of fulfilling theirregulatory responsibilities more difficult. These employeestestified that the boarding restriction:
Ü Creates a bottleneck of patrons that moves progressively from the parkinglot, to ticketing, to the turnstiles, to the cage.
Ü The unnecessary crowd creates an atmosphere where it is difficult to meetregulatory obligations.
Ü The bottleneck of patrons makes it more difficult to identify underage orintoxicated patrons, excluded persons and problem gamblers.
Ü The impatient crowd presents safety concerns, especially for elderly anddisabled patrons.
37 Bill Sinclair testified that �There is nologic, of course, from a customerstandpoint. Believe me there�s nothing lesstourist friendly than someone have to makea phone call to find out if they can get on afacility and then finding out, �well you canin an hour and half from now because youcouldn�t get there in time.� � EdwardCorbet said that �What I want to emphasizeis that an hour and twenty minutes is justtoo long to sit around and wait for things tohappen.� Kathy Franke stated that she feels�like I�m being put in a corral of cattle�waiting to get into the casino. Finally,Marly Yance testified that she wanted to�change the outdated, unnecessary andinconvenient boarding restrictions. We�renot children and we shouldn�t be treatedthat way.� From Missouri GamingCommission transcripts of public hearingson the boarding restriction.
The bulk of the publiccomment emanated fromcasino patrons who testifiedabout their repugnance forthe restriction which theyfind to be frustrating, incon-venient, patronizing andunnecessary.

27
The Commission discovered that by eliminating the boarding restriction, it could allowfor a more gradual flow of casino patrons, thus making it easier to spot loss limit violations,identify underage patrons, intoxicated patrons and those who have voluntarily excluded them-selves because they are problem gamblers. In addition, the elimination of the boarding restrictioneliminates the troubling safety concern created by hurried patrons rushing to the casino in orderto get there in time for boarding.
The Commission found little validity in the testimony of those who opposed the removalof the boarding restriction. Their testimony suggested that the Commission did not have theauthority to remove the boarding restriction arguing that it was a decision for the legislature.38
They also argued that it would lead to an increase in problem gambling. The Commission findsno evidence that continuous boarding will have any affect on problem gambling.39
38 Arguments that the Commission is actingbeyond its authority, ignoring existing lawor legislative intent fail in light of the factthat the Commission itself created theboarding restriction. The only expression oflegislative intent is a 1998 recommendationof the Joint Committee on Gaming andWagering that the Commission review itspolicy on the boarding restriction and makeit consistent with state law. Since state lawdoes not mention a boarding restriction, itseems clear that the Committee recommen-dation was to remove it. It should also benoted that the statutes specifically give theCommission authority �To adopt standardsunder which all excursion gambling boatoperations shall be held...�. Section313.805(3), RSMo. Moreover, the fact thatlegislative efforts to require removal of theboarding restriction have failed are as muchevidence of legislative intent that it is adecision for the Commission as they are oflegislative support for the boardingrestriction. Finally, should the legislaturedisagree with the Commission�s decisionon the boarding restriction, they have thepower to reverse the decision by establish-ing rules for boarding in the gaming statute.It has previously not chosen to do so.
39 Keith Spare, the Chairman of theMissouri Council on Gambling Concerns,testified at the public hearings on theboarding restriction and specifically saidthat he was not there to speak againstremoving the restriction. Instead he focusedon the need for dedicated funding to treatproblem gamblers and establish aprevention program. The Commissionsupports Mr. Spare�s comments andprovides a more detailed request in thefollowing section on problem gambling.

28
Missouri�s unique voluntary exclusion program for problem gamblers was created in1996 in response to a request from a citizen to be banned from the casinos because he foundhimself unable to control his gambling.40 The Commission first proposed a program whereby itwould require all the casinos to ban individuals who identified themselves as problem gamblers.
This proposal spawned a spirited reaction from mental health treatment professionalsfrom around the country. The treatment professionals commented that, while they understood theCommission�s good intentions, the rule as proposed did more harm that good. Their commentssuggested that the only way for a problem gambler to achieve long term recovery is for them toacknowledge that they have a problem and to take personal responsibility for it. The counselorscontended that the Commission, by suggesting that it could require gaming operators to keep theproblem gamblers out of the casino, was allowing the problem gambler to pass their problem onto someone else. Such a belief relieves the problem gambler from taking personal responsibilityfor their condition.
The treatment professionals advised the Commission that such a course of action isdoomed to fail because the condition is not being treated. Furthermore, they felt that the Com-mission was creating false hope in suggesting that it could prevent keep the problem gamblerfrom entering the casinos. The determined gambler will always find a way to circumvent thesystem. The theory is backed up by a Harvard University study commissioned by the NationalGambling Impact Study Commission (NGISC) found that about 1.6% of the population willsuffer from pathological gambling.41 To try to identify and prevent entry of this small percentageof casino patrons is a task that is fraught with difficulty and destined for failure.
Based on the comments from the treatment professionals, the Commission revised therule and initiated the program consistent with their advice. The program now provides theproblem gambler with a mechanism to step forward, acknowledge that they have a problem andagree to take personal responsibility for it. Under the provisions of the program, the problemgambler agrees to accept the responsibility of staying out of the casinos. They agree that it is notthe responsibility of the casinos or the Commission to prevent them from entering the casino.They agree that if they are discovered, they will be arrested for trespassing and will forfeit anychips, tokens and electronic gaming credits in their possession at the time of their arrest.
42
Problem Gambling
40 The program is formally called the List ofDisassociated Persons. The provisions ofthe program can be found at 11 CSR 45-17et. seq.
41 National Gambling Impact StudyCommission, Final Report.
42 There is currently no specific statutoryprovision that authorizes the Commissionto require forfeiture of chips, tokens orelectronic gaming credits in the possessionof problem gamblers who have voluntarilybanned themselves from Missouri casinos.Absent such a provision, the AttorneyGeneral has refused to pursue these cases.The General Assembly passed such aprovision in HB 793 last year. However, thebill was vetoed for other reasons. TheCommission urges the General Assembly topass similar language again this year. It willprovide an important deterrent for theproblem gambler and will help them andtheir families with the recovery process.

29
Since the problem gambler is agreeing not to go to a casino in Missouri for the remain-der of their life, it only seems fair to block efforts by the gaming companies to lure them into thecasinos. The program provides this protection. The Commission requires all licensees to removepersons in the program from their direct marketing lists, thus blocking enticements such as matchplay coupons, free dinners or free hotel visits. The Commission also directs the casinos to denypeople in the program check cashing privileges and participation in player�s clubs. Finally, theCommission requires all licensees to consult the list of people in the program before paying outany jackpot of $1200 or more.43
Once a person is placed on the Disassociated Persons List they can never get off. Thereis no procedure for removal. The reason for this policy is that those who treat problem gamblersare nearly unanimous in their belief that it is a lifetime condition and that a person is never curedbut continuously recovering.
The voluntary exclusion program is not for everyone. It is not a panacea or a quick fixfor problem gamblers. The vast majority of people who suffer from problem gambling will needcounseling or group therapy such as Gamblers Anonymous.44 However, the voluntary exclusionprogram can be an important part of an overall recovery program. Many people find that block-ing the direct marketing efforts of the casino and the consequence of being arrested for trespass-ing if they are discovered in a casino are helpful components of the recovery process.
The Missouri Alliance to Curb Compulsive GamblingThe Missouri Alliance to Curb Compulsive Gambling was created in 1997 to educate the
public on the characteristics and dangers of problem and compulsive gambling, to refer compulsivegamblers and their families and friends to free treatment through a toll-free hotline, and to preventunderage play and promote responsible gaming. This unique partnership between public, privateand nonprofit organizations consists of the Missouri Department of Mental Health (DMH), theMissouri Gaming Commission, the Missouri Lottery, the Missouri Riverboat Gaming Associationand the Missouri Council on Problem Gambling Concerns.
The Alliance plays a key role in Missouri�s comprehensive program to attack problemgambling.45 It sponsors the 1-888-BETSOFF hotline which provides 24 hour assistance to problemgamblers, their families, friends and coworkers. The hotline provides referrals to self-help groupslike Gamblers Anonymous or any one of more than 100 counselors that have been certified byDMH to provide treatment services to problem gamblers and their families. DMH also administers
43 Internal Revenue Service form W2-G is required for any jackpot of $1200or more. Since this form requires thepatron�s social security number, theDisassociated Persons List can bereferenced efficiently.
44 Gamblers Anonymous is a nonprofitvolunteer organization that helpsproblem gamblers to recover. Toobtain more information about GAmeetings in your area call 1-888-BETSOFF or go to their web site at http://www. gamblersanonymous.org/
45 Keith Whyte, the Executive Director
of the National Council on ProblemGambling has stated that the Missouriprogram is a model that alljurisidictions should emulate. Inaddition, during a discussion panel onvoluntary exclusion programs at theNational Council on ProblemGambling�s 1999 annual meeting,Prof. Carl Braunlich of PurdueUniversity, stated that the Missouriprogram is the most comprehensive,well thought out program he hasreviewed.

30
a program that provides free counseling to any Missouri resident who suffers from problem gam-bling.
The Alliance also sponsored its first annual Missouri Responsible Gaming Education Week(RGEW) during August 2-6, 1999. The events during RGEW included two main events held inKansas City and St. Louis where Keith Whyte, the Executive Director of the National Council onProblem Gambling served as the keynote speaker. In addition, a summary of current research onproblem gambling was presented by Dr. Linda Cottler and Dr. Renee Cunningham-Williams of thepsychiatry department at the Washington University of Medicine and members of the Committeeon the Social and Economic Impact of Pathological Gambling.
The Alliance also sponsored a number of education programs for counselors and gamingindustry employees. In addition, the Alliance produced an informational video that can be used inspeakers bureaus and replayed for community organizations.46 Furthermore, problem gambling is-sues were featured on the Lottery Minute, which is played on more than 70 radio and televisionstations throughout the state.
The Need for Additional ResearchAlthough the Missouri program to attack problem
gambling is recognized as one of the best in the world, morework is needed in this area. Too little is known about problemgambling and additional research is necessary. In order to makethe Alliance�s education, prevention and treatment efforts aseffective as possible, it needs to know more about problemgambling as a mental and/or physiological condition. There-fore, the Commission asks that the General Assembly autho-rize a full time employee to administer the Commission�s vol-untary exclusion program, perform education and outreachsessions on problem gambling and conduct in-house researchto help better understand the condition and adapt theCommission�s programs accordingly. In addition, the Com-mission requests an annual appropriation of funds that will bededicated to research of issues related to problem gambling.
46 If your organization would like a copy ofthis video, please contact the GamingCommission at 573-526-4080 or write to3417 Knipp Drive, Jefferson City, MO65109 and ask for the Responsible GamingEducation Week video.
139
139 317
456
400
FY 97 FY 98 FY 99
Fiscal Year
0
200
400
Par
ticip
ants
100
300
500
700
900
No. of Participants
Cumulative Total
Missouri’s Voluntary Exclusion Listfor Problem Gamblers
Level of Participation
536

31
Although the number of charity gaming licensees continued to decline in FY 1999, thedecrease was much less than in previous years. It appears that the full impact of riverboatgambling and the 1993 tax increase have been absorbed and the industry stabilizing. The BingoDivision issued 659 regular bingo licenses, down only 25 from the previous year. While thenumber of special licenses also declined, it too was significantly less than in previous years.
An important development for charity game operators was the decision in Associationof Charitable Games v. Missouri Gaming Commission, wherein the U.S. District Court ruledthat the provision in the Missouri Constitution that restricts bingo operators from advertising isunconstitutional. Fortunately, in 1996 the legislature acted on the Commission�s recommenda-tion to amend the bingo statute to allow advertising under certain conditions should the consti-tutional restriction be lifted.47 These statutory provisions will prohibit bingo operators fromtaking money that should be donated to charity and diverting it into questionable advertisingschemes. The statute restricts bingo advertising to two percent of the total amount expendedfrom receipts of bingo.48
Other new developments included the introduction of Electronic Bingo Card Monitor-ing Devices (EBCMD) which allow players to play up to 54 cards via a small hand held device.The devices are becoming increasingly popular with players and many organizations find thatthe EBCMDs increase the per player revenue and brings in new players. However, the use ofthe devices is mainly limited to the metropolitan areas and has not been as beneficial to opera-tors in rural areas.
The regulation limiting the number of bingo games in a single hall to five per week waseliminated effective July 1, 1999. This rule change will allow operators to lease premises at amore reasonable rate. It is also expected that the regulation will improve the quality of facilitiesthat are available for lease. Because of the recent change in the regulation, its impact on thebingo industry will not be known until FY 2000.
The Commission continues to conduct training seminars for bingo operators throughoutthe state. The seminars are designed to educate bingo operators on how to comply with thestandards set forth in the Missouri Constitution, the bingo statutes and the rules and regulationspromulgated by the Commission. Recently, the Commission began to survey bingo operatorsduring the seminars to solicit information regarding specific changes charities would like to
Charity Gaming - Bingo
47 H.B. Nos. 1159, 842 & 799, § A.
48 Section 313.040(9), RSMo.

32
make in order to make their games more exciting for their players. Many of these requestedchanges will require amending existing regulations and other changes may require statutorychanges. The Commission will submit the results of these surveys to the General Assembly priorto the 2000 legislative session.
The Bingo Division has recently implemented a Complaint Tracking System. Thissystem is designed to track all complaints received and work on a priority basis. After com-plaints are investigated summary reports are written which help assist the Commission in deter-mining if the conduct merits disciplinary action.
Audit and EnforcementThe audit staff completed forty-two (42) operator audit inspections and assisted the
enforcement staff with an additional twenty-three (23) inspections. The charity game operatorinspections were prioritized due to a high volume of complaints from players or members ofcharities. The comprehensive game inspection procedures have been updated to facilitate a morethorough audit/inspection and to ensure the operator�s compliance with Missouri Statutes andrules and regulations.
Charity game inspections are conducted randomly or many times as a direct result ofrequest/complaints from players or members of charities who report illegal game activity. Theaudit and inspection procedures are designed to limit game disruption and ensure organizationsare keeping records which accurately reflect game receipts and that the operators are using theirgame profits for charitable purposes. The audit and enforcement sections have presented theinspection requirements during the statewide seminars in order to ensure that the charities areinformed of what is required. The game inspection procedures mirror the recordkeeping require-ments outlined in the game operation requirements and recordkeeping requirements in thestatutes and regulations.
The Audit section has also completed audits of each of the licensed suppliers and threeof the six licensed manufacturers during fiscal year 1999. Audits of licensed suppliers are crucialbecause of the supplier�s responsibility to collect bingo taxes owed to the state. Audits of li-censed manufacturers focus on their ability to track product being shipped into the state andgame security.

33
History of Bingo in MissouriIn last year�s annual report, the Commission provided a history of riverboat gambling in
order to provide the General Assembly with a historical perspective of the rapid policy developmentsin that area. The section was well received and therefore, the Commission offers this summary of the21 year development of bingo in the State of Missouri.
In 1980, the voters approved bingo as the first form of legal lottery since the enactment ofthe Missouri Constitution of 1865.
49 Missouri�s first foray into legalized games of chance in over 100
years came with many restrictions attached. Bingo could only be operated by certain charitable,fraternal, religious, service or veterans organizations that had been in existence for more than fiveyears and had at least 20 bona fide members with at least two years of service. The amount of prizesthat could be given away in a single event was limited to $3,600 and organizations were prohibitedfrom advertising their bingo events or paying their workers. In addition, all proceeds of the gamewere required to be donated to charity.
Despite the myriad of restrictions, charitable bingo established itself as a regular pastime formany Missourians and emerged as a significant contributor to many charitable causes. By the timethe state lottery was approved in 1984, bingo operations were generating approximately $2 million instate revenue and a great deal more for charity. The proceeds from bingo continued to grow until, inFiscal Year 1995, revenues and the number of licensees declined dramatically. Revenues and thenumber of licensees have continued to decline each year since FY �95; although the decline appearsto have leveled off beginning in FY �98.
The reason for the initial decline can be attributed almost exclusively to the 120% taxincrease on the sale of bingo cards imposed by HB 112, passed in 1993. This new tax, which wasdesigned to finance the construction of nursing homes for veterans, decimated many of the state�sbingo games. The number of licensees declined from 970 to 852 in a single year.
The decline in the number of bingo games can also be partially attributed to a scandal thatwas revealed in 1992, when it was discovered that Bernard �Spanky� Black, a convicted thief,gambler and promoter of prostitution, was associated with the operation of a bingo hall in KansasCity, Kansas. It was also discovered that associates of Black, including a convicted felon, usedmoney gained from a massage parlor to purchase a bowling alley in Missouri which it then leased toorganizations to conduct bingo. One of the organizations operating at the bowling alley listed Joseph
49 Constitutional Amendment No. 3 wasapproved by the voters on November 4,1980 with 1,338,272 in favor and 533,458opposed.

34
B. King as its treasurer. King is a convicted felon and was a participant in the massage parlor andbowling alley ventures.
In order to save charitable bingo in Missouri from an onslaught of scandal and overtaxation, immediate action was necessary.50 The legislature reacted quickly by adopting SB 427,repealing the special tax for veterans homes, in the following session. The bill passed with anemergency clause and therefore the new tax was only in effect for less than six months.51 Thefunding for the construction of the new veterans homes was replaced by transferring the unen-cumbered moneys in the Gaming Commission Fund at the end of each fiscal year to the Veter-ans� Homes Capital Improvements Trust Fund. This is the second of four instances in the pastfour legislative sessions where the General Assembly has chosen to allocate unencumberedfunds from the Gaming Commission fund for a purpose other than the regulation of riverboatgambling.
SB 427 also overhauled the regulatory structure for bingo by establishing new licensingrequirements for manufacturers, suppliers and hall providers as well as implementing a newsystem of taxation that provided an audit trail of financial transactions in place of the old methodof voluntary reporting. The bill established a higher burden of proof for applicants and licensees,streamlined the bookkeeping and reporting requirements for bingo organizations and placed theresponsibility of collecting taxes on professional suppliers rather than volunteers serving chari-ties.
It appears that the remedial measures in SB 427 have been successful. While bingoreceipts have continued to recede, the decline has been gradual and largely attributed to thecompetition from riverboat gambling, not because of higher taxes or scandals involving criminalelements infiltrating bingo operations. The addition of progressive games, a decision in federalcourt that will permit bingo operators to advertise and the possibility of electronic card readershave given many of these charities renewed hope of survival and prosperity, despite the in-creased competition from riverboats and high stakes Indian bingo parlors in adjoining states.
50 An editorial in the Kansas City Staron September 9, 1992, said that�Bingo for too long has been seen bythe public as non-gambling. Felonslinked to prostitution and massageparlors can and do find a way to profitfrom the games, even though they arebarred by law. Bingo should be given ahard look by the next session of theGeneral Assembly.�
51 Under the provisions of HB 112, thenew special tax on bingo cards did notcommence until January 1, 1994. TheGovernor signed SB 740 into effect onMay 20, 1994, thereby repealing thetax.

35
Missouri Gaming Commission Fund Balance Report � Fiscal Year 1999 .................. 36Fiscal Year 1999 Project Summary ...................................................................................... 37Admission Fee Summary ........................................................................................................ 38Gaming Tax Summary ........................................................................................................... 39Argosy Riverside Casino ........................................................................................................ 40Aztar Casino - Caruthersville ................................................................................................ 42Harrah�s North Kansas City .................................................................................................. 44Harrah�s Maryland Heights ................................................................................................... 46Hilton - Kansas City ................................................................................................................ 48Kansas City Station Casino .................................................................................................... 50Players - Maryland Heights ................................................................................................... 52President Casino on the Admiral .......................................................................................... 54St. Charles Riverfront Station ............................................................................................... 56St. Jo Frontier Casino II ......................................................................................................... 58Home Dock Communities� Use of Gaming Funds........................................................... 60City of Kansas City, Missouri ............................................................................................... 61City of Maryland Heights ..................................................................................................... 62City of North Kansas City ..................................................................................................... 62City of Riverside ...................................................................................................................... 63City of St. Charles ................................................................................................................... 64City of St. Joseph ..................................................................................................................... 65City of St. Louis ....................................................................................................................... 66
Appendix Contents
Fiscal Year1999 ReportAppendices

36
AMOUNT SUBTOTAL TOTAL AMOUNT SUBTOTAL TOTAL
BEGINNING BALANCE 7/1/98 $37,550,937.46 Expense & EquipmentTrav el & Vehicle Ex p. $258,379.73
REVENUE Office Ex pense $79,745.56
Fees: Office & Comm. Equip. Purchase $28,969.63
A & B Application $1,004,000.00 Communications Ex pense $123,886.08
Lev el I Occup. Application $20,000.00 Inst. & Phy s. Plant Ex pense $115,827.85
Lev el II Occup. Application $376,375.00 Inst. & Phy s. Plant Equip. Purchase $8,188.94
Supplier Application $30,000.00 Data Processing Ex p. & Equip. $162,719.54
Lev el I Occup. Annual Fee $10,214.61 Professional Serv ices $643,768.87
Lev el II Occup. Annual Fee $631,085.37 Other Ex pense $42,780.09
Supplier Annual Fee $118,630.17 Refunds $18,731.94
Lev el II Supplier Application $3,075.00 Lease Pay ment $283,213.20 $1,766,211.43
Lev el II Supplier Annual Fee $6,658.61 Total Gaming Expenditures $11,825,611.57Admissions $40,689,436.02 $42,889,474.78
Licenses: EXPENDITURE - OTHERA & B Annual $425,000.00 Personal Service:Replacement Gaming License $6,495.00 DOR Salaries $25,188.00
Liquor License $8,000.00 $439,495.00 Attorney General Salaries $72,383.34
Other: Auditor's Office Salaries $4,304.15 $101,875.49
Administrativ e Income $4,427.10 Expense & EquipmentBackground Reimbursements $752,504.98 MSHP Education Incentiv e $2,651.00
Dev ice Testing Reimbursements $670,819.19 OT for Auto Technician $13,330.01
Enforcement Reimbursements $6,364,424.77 OT for Radio Installer $0.00
Interest $2,519,748.89 $10,311,924.93 MSHP Gasoline $116,094.67
TOTAL REVENUE $53,640,894.71 MSHP Auto Maintenance & Repair $80,517.91
MSHP Vehicle Purchase $589,371.00
EXPENDITURE - GAMING Auditor's Office Ex penses $22,580.00
Personal Service: Attorney General Ex penses $8,324.16
Gaming Salaries $2,067,101.57 Div . of Youth Serv ices $466,870.74
MSHP Salaries $5,126,279.97 Deferred Compensation - Transfer $43,224.28
MSHP Fringe Benefit $1,906,181.69 Miscellaneous Transfers $14,964.05
Gaming Fringe Benefit - Transfer $959,836.91 $10,059,400.14 Transfer for Article X (Hancock) $250,894.00
Transfer to Veterans CI Fund $38,905,493.46
Transfer to Mo National Guard $3,000,000.00
Transfer to Mo College Guar. Fund $4,462,750.72
Transfer to Early Childhood Fund $24,037,249.28
Total Other Expenditures $72,014,315.28 $72,116,190.77FUND BALANCE *** $7,250,029.83*** Subject to change
Missouri Gaming Commission Fund Balance Report
Fiscal Year 1999

37
Fiscal Year 1999 Project Summary
ADMISSION FEE GAMING TAX GAMING TAX ESTIMATED ELECTRONIC GAMING
BOAT NAME LICENSE FY 1999 ADMISSION STATE & ADJUSTED GAMING LOCAL STATE CAPITAL TABLE GAMING GAMING SPACE
LOCATION DATE ADMISSIONS FEES LOCAL PORTION** GROSS RECEIPTS TAX PORTION PORTION INVESTMENT*** EMPLOYEES GAMES DEVICES POSITIONS (SQ FT)
ADMIRAL 27-May-94 3,125,669 6,251,338 3,125,669 59,253,097 11,850,619 1,185,062 10,665,557 63,300,000 788 59 1,230 1,422 58,000
ST. LOUIS
CASINO ST. CHARLES I & II 27-May-94 4,779,516 9,559,032 4,779,516 111,379,893 22,275,979 2,227,598 20,048,381 166,000,000 1,296 62 1,986 2,107 47,000
ST. CHARLES 28-Dec-94
ARGOSY RIVERSIDE CASINO 22-Jun-94 3,425,104 6,850,208 3,425,104 77,390,591 15,478,118 1,547,812 13,930,306 87,748,690 769 39 1,064 1,173 30,000
RIVERSIDE
ST. JO FRONTIER CASINO 24-Jun-94 924,300 1,848,600 924,300 20,105,239 4,021,048 402,105 3,618,943 25,008,000 323 18 466 519 18,000
ST. JOSEPH
NORTH STAR & MARDI GRAS 22-Sep-94 6,515,864 13,031,728 6,515,864 169,067,703 33,813,541 3,381,354 30,432,187 172,649,000 2,095 76 2,174 2,387 61,600
NORTH KANSAS CITY 15-May-96
CASINO AZTAR 27-Apr-95 624,945 1,249,890 624,945 21,527,134 4,305,427 430,543 3,874,884 57,849,000 419 23 634 701 10,400
CARUTHERSVILLE
SAMS TOWN 13-Sep-95 39,299 78,598 39,299 635,836 127,167 12,717 114,450 n/a n/a n/a n/a n/a n/a
KANSAS CITY
FLAMINGO HILTON 18-Oct-96 3,564,558 7,129,116 3,564,558 66,211,268 13,242,254 1,324,225 11,918,028 119,800,000 856 44 1,029 1,166 30,000
KANSAS CITY
RIVER KING & QUEEN 16-Jan-97 7,883,179 15,766,358 7,883,179 162,671,060 32,534,212 3,253,421 29,280,791 303,000,000 2,224 146 3,317 3,785 140,000
KANSAS CITY
PLAYERS ISLAND
KOKOMO & GRAND CAYMEN 11-Mar-97 4,716,520 9,433,040 4,716,520 96,583,305 19,316,661 1,931,666 17,384,995 134,716,323 864 48 1,586 1,697 52,000
MARYLAND HEIGHTS
MARDI GRAS & EASY STREET 11-Mar-97 5,189,475 10,378,950 5,189,475 113,190,577 22,638,115 2,263,812 20,374,304 143,334,204 1,147 49 1,671 1,779 52,000
MARYLAND HEIGHTS
GRAND TOTALS: 40,788,429 81,576,858 40,788,429 898,015,703 179,603,141 17,960,314 161,642,827 1,273,405,217 10,781 564 15,157 16,736 499,000
** Amount of admission fees paid to each entity.
*** Formulas used by the Licensees to arrive at total capital investment vary.
The figures published in this report are subject to adjustment.
1) Boyd Gaming closed casino operations on July 15, 1998
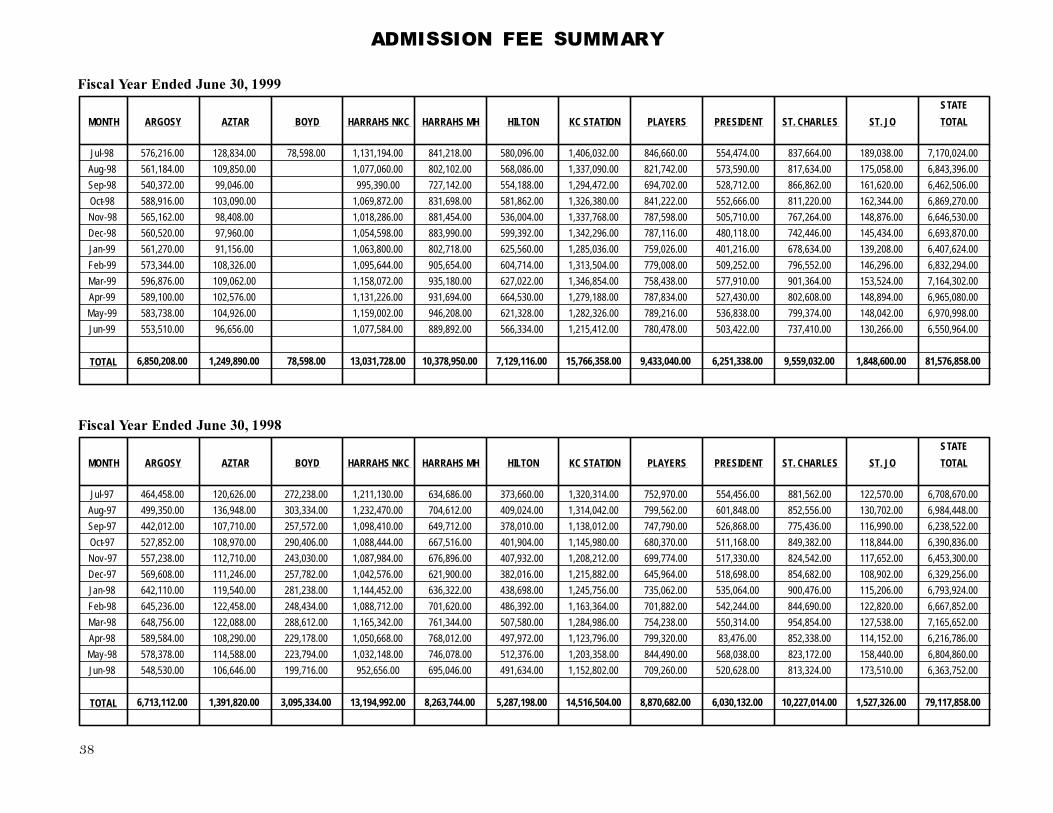
38
ADMISSION FEE SUMMARY
Fiscal Year Ended June 30, 1998
Fiscal Year Ended June 30, 1999
STATE
MONTH
MONTH
ARGOSY AZTAR BOYD HARRAHS NKC HARRAHS MH HILTON KC STATION PLAYERS PRESIDENT ST. CHARLES ST. JO TOTAL
Jul-97 464,458.00 120,626.00 272,238.00 1,211,130.00 634,686.00 373,660.00 1,320,314.00 752,970.00 554,456.00 881,562.00 122,570.00 6,708,670.00
Aug-97 499,350.00 136,948.00 303,334.00 1,232,470.00 704,612.00 409,024.00 1,314,042.00 799,562.00 601,848.00 852,556.00 130,702.00 6,984,448.00
Sep-97 442,012.00 107,710.00 257,572.00 1,098,410.00 649,712.00 378,010.00 1,138,012.00 747,790.00 526,868.00 775,436.00 116,990.00 6,238,522.00
Oct-97 527,852.00 108,970.00 290,406.00 1,088,444.00 667,516.00 401,904.00 1,145,980.00 680,370.00 511,168.00 849,382.00 118,844.00 6,390,836.00
Nov-97 557,238.00 112,710.00 243,030.00 1,087,984.00 676,896.00 407,932.00 1,208,212.00 699,774.00 517,330.00 824,542.00 117,652.00 6,453,300.00
Dec-97 569,608.00 111,246.00 257,782.00 1,042,576.00 621,900.00 382,016.00 1,215,882.00 645,964.00 518,698.00 854,682.00 108,902.00 6,329,256.00
Jan-98 642,110.00 119,540.00 281,238.00 1,144,452.00 636,322.00 438,698.00 1,245,756.00 735,062.00 535,064.00 900,476.00 115,206.00 6,793,924.00
Feb-98 645,236.00 122,458.00 248,434.00 1,088,712.00 701,620.00 486,392.00 1,163,364.00 701,882.00 542,244.00 844,690.00 122,820.00 6,667,852.00
Mar-98 648,756.00 122,088.00 288,612.00 1,165,342.00 761,344.00 507,580.00 1,284,986.00 754,238.00 550,314.00 954,854.00 127,538.00 7,165,652.00
Apr-98 589,584.00 108,290.00 229,178.00 1,050,668.00 768,012.00 497,972.00 1,123,796.00 799,320.00 83,476.00 852,338.00 114,152.00 6,216,786.00
May-98 578,378.00 114,588.00 223,794.00 1,032,148.00 746,078.00 512,376.00 1,203,358.00 844,490.00 568,038.00 823,172.00 158,440.00 6,804,860.00
Jun-98 548,530.00 106,646.00 199,716.00 952,656.00 695,046.00 491,634.00 1,152,802.00 709,260.00 520,628.00 813,324.00 173,510.00 6,363,752.00
TOTAL 6,713,112.00 1,391,820.00 3,095,334.00 13,194,992.00 8,263,744.00 5,287,198.00 14,516,504.00 8,870,682.00 6,030,132.00 10,227,014.00 1,527,326.00 79,117,858.00
STATE
ARGOSY AZTAR BOYD HARRAHS NKC HARRAHS MH HILTON KC STATION PLAYERS PRESIDENT ST. CHARLES ST. JO TOTAL
Jul-98 576,216.00 128,834.00 78,598.00 1,131,194.00 841,218.00 580,096.00 1,406,032.00 846,660.00 554,474.00 837,664.00 189,038.00 7,170,024.00
Aug-98 561,184.00 109,850.00 1,077,060.00 802,102.00 568,086.00 1,337,090.00 821,742.00 573,590.00 817,634.00 175,058.00 6,843,396.00
Sep-98 540,372.00 99,046.00 995,390.00 727,142.00 554,188.00 1,294,472.00 694,702.00 528,712.00 866,862.00 161,620.00 6,462,506.00
Oct-98 588,916.00 103,090.00 1,069,872.00 831,698.00 581,862.00 1,326,380.00 841,222.00 552,666.00 811,220.00 162,344.00 6,869,270.00
Nov-98 565,162.00 98,408.00 1,018,286.00 881,454.00 536,004.00 1,337,768.00 787,598.00 505,710.00 767,264.00 148,876.00 6,646,530.00
Dec-98 560,520.00 97,960.00 1,054,598.00 883,990.00 599,392.00 1,342,296.00 787,116.00 480,118.00 742,446.00 145,434.00 6,693,870.00
Jan-99 561,270.00 91,156.00 1,063,800.00 802,718.00 625,560.00 1,285,036.00 759,026.00 401,216.00 678,634.00 139,208.00 6,407,624.00
Feb-99 573,344.00 108,326.00 1,095,644.00 905,654.00 604,714.00 1,313,504.00 779,008.00 509,252.00 796,552.00 146,296.00 6,832,294.00
Mar-99 596,876.00 109,062.00 1,158,072.00 935,180.00 627,022.00 1,346,854.00 758,438.00 577,910.00 901,364.00 153,524.00 7,164,302.00
Apr-99 589,100.00 102,576.00 1,131,226.00 931,694.00 664,530.00 1,279,188.00 787,834.00 527,430.00 802,608.00 148,894.00 6,965,080.00
May-99 583,738.00 104,926.00 1,159,002.00 946,208.00 621,328.00 1,282,326.00 789,216.00 536,838.00 799,374.00 148,042.00 6,970,998.00
Jun-99 553,510.00 96,656.00 1,077,584.00 889,892.00 566,334.00 1,215,412.00 780,478.00 503,422.00 737,410.00 130,266.00 6,550,964.00
TOTAL 6,850,208.00 1,249,890.00 78,598.00 13,031,728.00 10,378,950.00 7,129,116.00 15,766,358.00 9,433,040.00 6,251,338.00 9,559,032.00 1,848,600.00 81,576,858.00

39
GAMING TAX SUMMARY
Fiscal Year Ended June 30, 1998
Fiscal Year Ended June 30, 1999
STATE
MONTH ARGOSY AZTAR BOYD HARRAHS NKC HARRAHS MH HILTON KC STATION PLAYERS PRESIDENT ST. CHARLES ST. JO TOTAL
Jul-97 1,038,858.40 359,697.85 618,781.02 2,750,478.20 1,077,902.65 746,704.55 2,196,680.49 1,217,715.89 1,026,433.00 1,984,565.82 263,746.93 13,281,564.80
Aug-97 1,075,984.95 399,940.06 704,206.96 2,663,443.16 1,188,981.81 754,930.81 2,257,756.81 1,283,848.64 1,142,301.70 1,827,322.52 297,271.09 13,595,988.51
Sep-97 938,389.26 370,419.65 593,548.17 2,539,481.21 1,140,299.74 704,517.85 1,989,886.37 1,115,396.16 1,010,796.99 1,705,828.75 274,539.26 12,383,103.41
Oct-97 1,068,447.86 335,349.15 671,518.35 2,476,760.05 1,232,832.16 726,822.58 1,988,904.63 1,166,812.18 974,561.34 1,869,084.09 292,501.63 12,803,594.02
Nov-97 1,003,453.36 336,235.70 585,002.40 2,572,487.48 1,259,515.17 755,115.97 2,084,986.95 1,185,675.31 986,580.72 1,768,723.32 287,003.16 12,824,779.54
Dec-97 1,047,405.12 361,378.36 587,281.69 2,350,344.89 1,134,460.33 754,553.13 2,032,750.81 1,167,269.21 985,128.09 1,880,335.07 270,269.66 12,571,176.36
Jan-98 1,277,906.08 378,924.23 657,139.05 2,665,304.66 1,258,259.39 849,270.33 2,209,388.57 1,300,982.38 1,053,130.44 1,961,940.61 277,689.88 13,889,935.62
Feb-98 1,240,295.50 408,237.56 573,943.19 2,522,383.00 1,317,389.98 930,331.74 2,061,257.52 1,246,032.69 1,063,901.46 1,785,640.26 287,157.51 13,436,570.41
Mar-98 1,255,647.05 404,321.98 671,427.94 2,832,626.67 1,507,360.30 956,670.46 2,282,652.26 1,321,273.59 1,070,386.74 2,065,381.33 298,946.85 14,666,695.17
Apr-98 1,191,299.39 371,042.77 563,267.58 2,622,328.32 1,508,255.17 920,681.68 2,193,325.92 1,462,871.73 165,737.34 1,888,442.83 282,227.81 13,169,480.54
May-98 1,134,732.37 375,922.25 533,256.99 2,595,914.20 1,636,575.14 990,883.50 2,358,392.16 1,552,666.67 1,076,074.60 1,782,803.92 337,435.70 14,374,657.50
Jun-98 1,164,636.24 347,471.76 480,581.44 2,460,653.90 1,405,664.94 936,365.50 2,255,992.98 1,349,830.80 963,121.33 1,829,969.84 362,761.77 13,557,050.50
TOTAL 13,437,055.58 4,448,941.32 7,239,954.78 31,052,205.74 15,667,496.78 10,026,848.10 25,911,975.47 15,370,375.25 11,518,153.75 22,350,038.36 3,531,551.25 160,554,596.38
STATE
MONTH ARGOSY AZTAR BOYD HARRAHS NKC HARRAHS MH HILTON KC STATION PLAYERS PRESIDENT ST. CHARLES ST. JO TOTAL
Jul-98 1,234,786.33 425,690.25 129,110.25 2,847,222.86 1,820,079.75 1,064,750.85 2,710,952.89 1,584,506.73 1,037,307.04 1,862,117.37 354,778.51 15,071,302.83
Aug-98 1,176,099.29 360,004.29 2,680,075.13 1,711,026.68 1,114,942.41 2,652,559.00 1,673,257.79 1,034,867.63 1,969,020.02 386,607.74 14,758,459.98
Sep-98 1,186,843.40 350,447.95 2,539,262.84 1,591,933.19 1,044,188.90 2,540,951.31 1,408,471.57 990,567.66 1,836,937.86 320,914.09 13,810,518.77
Oct-98 1,289,105.44 331,043.99 2,749,965.98 1,800,611.63 1,073,248.07 2,568,961.65 1,654,060.61 1,034,664.64 1,797,662.39 337,173.36 14,636,497.76
Nov-98 1,280,077.08 353,348.74 2,731,766.16 1,825,655.30 1,087,320.91 2,714,545.36 1,564,331.44 982,622.45 1,723,470.32 330,000.65 14,593,138.41
Dec-98 1,225,558.11 330,377.33 2,760,406.57 1,928,299.91 1,147,588.76 2,662,411.14 1,612,805.24 897,913.57 1,710,503.72 326,477.08 14,602,341.43
Jan-99 1,166,564.52 328,262.98 2,683,319.35 1,718,276.79 1,129,404.26 2,677,030.81 1,573,069.32 827,183.88 1,631,266.27 322,659.60 14,057,037.78
Feb-99 1,277,112.01 335,088.65 2,885,965.26 1,887,876.89 1,067,078.21 2,712,756.61 1,576,151.19 989,197.71 1,857,457.10 339,161.39 14,927,845.02
Mar-99 1,420,035.05 383,148.60 2,974,062.76 2,046,083.85 1,160,125.07 2,942,674.89 1,544,225.15 1,103,918.16 2,187,592.76 323,547.75 16,085,414.04
Apr-99 1,430,832.17 386,147.32 3,080,915.16 2,058,103.48 1,185,240.77 2,873,110.20 1,678,860.99 1,042,395.97 1,991,622.95 330,520.76 16,057,749.77
May-99 1,444,652.28 366,695.65 3,053,183.83 2,208,991.62 1,128,785.17 2,820,107.25 1,767,226.03 973,012.95 1,870,494.36 348,252.61 15,981,401.75
Jun-99 1,346,452.60 355,171.10 2,827,394.81 2,050,096.78 1,039,580.23 2,658,151.01 1,683,350.45 936,967.62 1,837,833.52 300,954.23 15,035,952.35
TOTAL 15,478,118.28 4,305,426.85 129,110.25 33,813,540.71 22,647,035.87 13,242,253.61 32,534,212.12 19,320,316.51 11,850,619.28 22,275,978.64 4,021,047.77 179,617,659.89

40
Argosy Riverside Casino
General Manager: Larry Kinser777 NW Argosy ParkwayRiverside, Missouri 64150(816) 741-7568
Date Licensed: June 22, 1994Gaming Space: 30,000 Square FeetGaming Positions: 1,173Electronic Gaming Devices: 769Table Games: 39Restaurants: 3Meeting SpaceParking Garage
Market Analysis
Argosy posted gaming revenue of $77million, a 15% increase over the prior fis-cal year. The results reflect a 2% increasein admissions and a 13% increase in WinPer Admissions (WPA). The increase inWPA primarily reflects more slot play perpatron. Argosy's gaming revenue marketshare was 16% for the year.
Jul Aug Sep Oct Nov Dec Jan Feb Mar Apr May Jun$0
$1
$2
$3
$4
$5
$6
$7
$8
Milli
ons
FY 1998
FY 1999
Monthly Gaming RevenueArgosy - Riverside
Jul Aug Sep Oct Nov Dec Jan Feb Mar Apr May Jun0
50
100
150
200
250
300
350
Thou
sand
s
FY 1998
FY 1999
Monthly AdmissionsArgosy Riverside
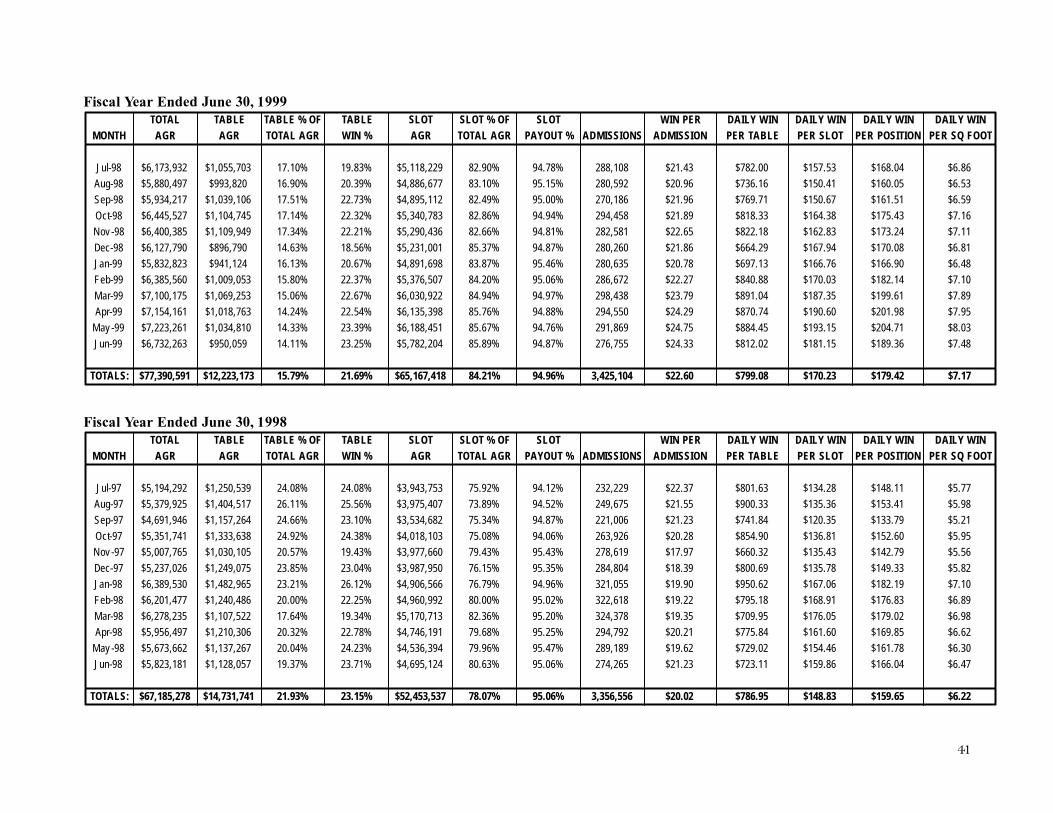
41
TOTAL TABLE TABLE % OF TABLE SLOT SLOT % OF SLOT WIN PER DAILY WIN DAILY WIN DAILY WIN DAILY WINMONTH AGR AGR TOTAL AGR WIN % AGR TOTAL AGR PAYOUT % ADMISSIONS ADMISSION PER TABLE PER SLOT PER POSITION PER SQ FOOT
Jul-98 $6,173,932 $1,055,703 17.10% 19.83% $5,118,229 82.90% 94.78% 288,108 $21.43 $782.00 $157.53 $168.04 $6.86
Aug-98 $5,880,497 $993,820 16.90% 20.39% $4,886,677 83.10% 95.15% 280,592 $20.96 $736.16 $150.41 $160.05 $6.53
Sep-98 $5,934,217 $1,039,106 17.51% 22.73% $4,895,112 82.49% 95.00% 270,186 $21.96 $769.71 $150.67 $161.51 $6.59
Oct-98 $6,445,527 $1,104,745 17.14% 22.32% $5,340,783 82.86% 94.94% 294,458 $21.89 $818.33 $164.38 $175.43 $7.16
Nov -98 $6,400,385 $1,109,949 17.34% 22.21% $5,290,436 82.66% 94.81% 282,581 $22.65 $822.18 $162.83 $173.24 $7.11
Dec-98 $6,127,790 $896,790 14.63% 18.56% $5,231,001 85.37% 94.87% 280,260 $21.86 $664.29 $167.94 $170.08 $6.81
Jan-99 $5,832,823 $941,124 16.13% 20.67% $4,891,698 83.87% 95.46% 280,635 $20.78 $697.13 $166.76 $166.90 $6.48
Feb-99 $6,385,560 $1,009,053 15.80% 22.37% $5,376,507 84.20% 95.06% 286,672 $22.27 $840.88 $170.03 $182.14 $7.10
Mar-99 $7,100,175 $1,069,253 15.06% 22.67% $6,030,922 84.94% 94.97% 298,438 $23.79 $891.04 $187.35 $199.61 $7.89
Apr-99 $7,154,161 $1,018,763 14.24% 22.54% $6,135,398 85.76% 94.88% 294,550 $24.29 $870.74 $190.60 $201.98 $7.95
May -99 $7,223,261 $1,034,810 14.33% 23.39% $6,188,451 85.67% 94.76% 291,869 $24.75 $884.45 $193.15 $204.71 $8.03
Jun-99 $6,732,263 $950,059 14.11% 23.25% $5,782,204 85.89% 94.87% 276,755 $24.33 $812.02 $181.15 $189.36 $7.48
TOTALS: $77,390,591 $12,223,173 15.79% 21.69% $65,167,418 84.21% 94.96% 3,425,104 $22.60 $799.08 $170.23 $179.42 $7.17
TOTAL TABLE TABLE % OF TABLE SLOT SLOT % OF SLOT WIN PER DAILY WIN DAILY WIN DAILY WIN DAILY WINMONTH AGR AGR TOTAL AGR WIN % AGR TOTAL AGR PAYOUT % ADMISSIONS ADMISSION PER TABLE PER SLOT PER POSITION PER SQ FOOT
Jul-97 $5,194,292 $1,250,539 24.08% 24.08% $3,943,753 75.92% 94.12% 232,229 $22.37 $801.63 $134.28 $148.11 $5.77
Aug-97 $5,379,925 $1,404,517 26.11% 25.56% $3,975,407 73.89% 94.52% 249,675 $21.55 $900.33 $135.36 $153.41 $5.98
Sep-97 $4,691,946 $1,157,264 24.66% 23.10% $3,534,682 75.34% 94.87% 221,006 $21.23 $741.84 $120.35 $133.79 $5.21
Oct-97 $5,351,741 $1,333,638 24.92% 24.38% $4,018,103 75.08% 94.06% 263,926 $20.28 $854.90 $136.81 $152.60 $5.95
Nov -97 $5,007,765 $1,030,105 20.57% 19.43% $3,977,660 79.43% 95.43% 278,619 $17.97 $660.32 $135.43 $142.79 $5.56
Dec-97 $5,237,026 $1,249,075 23.85% 23.04% $3,987,950 76.15% 95.35% 284,804 $18.39 $800.69 $135.78 $149.33 $5.82
Jan-98 $6,389,530 $1,482,965 23.21% 26.12% $4,906,566 76.79% 94.96% 321,055 $19.90 $950.62 $167.06 $182.19 $7.10
Feb-98 $6,201,477 $1,240,486 20.00% 22.25% $4,960,992 80.00% 95.02% 322,618 $19.22 $795.18 $168.91 $176.83 $6.89
Mar-98 $6,278,235 $1,107,522 17.64% 19.34% $5,170,713 82.36% 95.20% 324,378 $19.35 $709.95 $176.05 $179.02 $6.98
Apr-98 $5,956,497 $1,210,306 20.32% 22.78% $4,746,191 79.68% 95.25% 294,792 $20.21 $775.84 $161.60 $169.85 $6.62
May -98 $5,673,662 $1,137,267 20.04% 24.23% $4,536,394 79.96% 95.47% 289,189 $19.62 $729.02 $154.46 $161.78 $6.30
Jun-98 $5,823,181 $1,128,057 19.37% 23.71% $4,695,124 80.63% 95.06% 274,265 $21.23 $723.11 $159.86 $166.04 $6.47
TOTALS: $67,185,278 $14,731,741 21.93% 23.15% $52,453,537 78.07% 95.06% 3,356,556 $20.02 $786.95 $148.83 $159.65 $6.22
Fiscal Year Ended June 30, 1999
Fiscal Year Ended June 30, 1998

42
Aztar Casino - Caruthersville
General Manager: George Stadler777 E. 3rd StreetCaruthersville, MO 63830(314) 333-1000
Date Licensed: April 27, 1995Gaming Space: 10,400 Square FeetGaming Positions: 701Electronic Gaming Devices: 634Table Games: 23Restaurants: 3RV ParkSurface Parking
Market Analysis
Aztar posted gaming revenue of $21.5million, a 3% decline over the prior fis-cal year. The results reflect a 10% de-cline in admissions offset by a 8% in-crease in Win Per Admissions (WPA).The increase in WPA primarily reflectsa higher slot hold percentage.
Jul Aug Sep Oct Nov Dec Jan Feb Mar Apr May Jun$0
$500
$1,000
$1,500
$2,000
$2,500
Tho
usan
ds
FY 1998
FY 1999
Monthly Gaming RevenueCasino Aztar
Jul Aug Sep Oct Nov Dec Jan Feb Mar Apr May Jun0
10
20
30
40
50
60
70
80
Tho
usan
ds
FY 1998
FY 1999
Monthly AdmissionsCasino Aztar

43
TOTAL TABLE TABLE % OF TABLE SLOT SLOT % OF SLOT WIN PER DAILY WIN DAILY WIN DAILY WIN DAILY WINMONTH AGR AGR TOTAL AGR WIN % AGR TOTAL AGR PAYOUT % ADMISSIONS ADMISSION PER TABLE PER SLOT PER POSITION PER SQ FOOT
Jul-98 $2,128,451 $552,241 25.95% 29.05% $1,576,210 74.05% 91.43% 64,417 $33.04 $836.73 $113.36 $130.88 $6.82
Aug-98 $1,800,021 $411,392 22.85% 26.28% $1,388,629 77.15% 91.31% 54,925 $32.77 $623.32 $100.63 $111.32 $5.77
Sep-98 $1,752,240 $354,437 20.23% 26.15% $1,397,803 79.77% 90.02% 49,523 $35.38 $537.03 $100.78 $107.94 $5.62
Oct-98 $1,655,220 $422,292 25.51% 26.50% $1,232,928 74.49% 91.56% 51,545 $32.11 $639.84 $89.15 $102.19 $5.31
Nov -98 $1,766,744 $450,839 25.52% 28.12% $1,315,905 74.48% 90.80% 49,204 $35.91 $683.09 $95.15 $109.08 $5.66
Dec-98 $1,651,887 $396,787 24.02% 22.73% $1,255,100 75.98% 90.48% 48,980 $33.73 $601.19 $90.75 $101.99 $5.29
Jan-99 $1,641,315 $488,464 29.76% 29.07% $1,152,851 70.24% 90.69% 45,578 $36.01 $740.10 $83.36 $101.33 $5.26
Feb-99 $1,675,443 $335,269 20.01% 19.25% $1,340,174 79.99% 90.95% 54,163 $30.93 $508.01 $96.90 $103.44 $5.37
Mar-99 $1,915,743 $435,460 22.73% 23.32% $1,480,283 77.27% 90.27% 54,531 $35.13 $659.79 $107.03 $118.28 $6.14
Apr-99 $1,930,737 $464,690 24.07% 27.53% $1,466,047 75.93% 90.28% 51,288 $37.64 $704.83 $106.00 $119.20 $6.19
May -99 $1,833,478 $394,685 21.53% 24.91% $1,438,793 78.47% 90.84% 52,463 $34.95 $585.83 $106.34 $115.12 $5.88
Jun-99 $1,775,856 $411,045 23.15% 27.59% $1,364,811 76.85% 91.20% 48,328 $36.75 $594.41 $71.76 $84.49 $5.69
TOTALS: $21,527,134 $5,117,601 23.77% 25.83% $16,409,533 76.23% 90.84% 624,945 $34.45 $642.85 $96.77 $108.77 $5.75
Fiscal Year Ended June 30, 1999
Fiscal Year Ended June 30, 1998TOTAL TABLE TABLE % OF TABLE SLOT SLOT % OF SLOT WIN PER DAILY WIN DAILY WIN DAILY WIN DAILY WIN
MONTH AGR AGR TOTAL AGR WIN % AGR TOTAL AGR PAYOUT % ADMISSIONS ADMISSION PER TABLE PER SLOT PER POSITION PER SQ FOOT
Jul-97 $1,798,489 $492,504 27.38% 26.95% $1,305,985 72.62% 92.34% 60,313 $29.82 $608.03 $99.85 $111.02 $5.76
Aug-97 $1,999,700 $447,903 22.40% 22.59% $1,551,797 77.60% 91.84% 68,474 $29.20 $552.97 $118.64 $123.44 $6.41
Sep-97 $1,852,098 $545,636 29.46% 32.60% $1,306,462 70.54% 91.71% 53,855 $34.39 $673.62 $99.88 $114.33 $5.94
Oct-97 $1,676,446 $361,995 21.59% 20.93% $1,314,451 78.41% 92.11% 54,485 $30.77 $446.91 $100.49 $103.48 $5.37
Nov -97 $1,681,178 $346,700 20.62% 18.91% $1,334,478 79.38% 91.75% 56,355 $29.83 $428.02 $102.02 $103.78 $5.39
Dec-97 $1,806,892 $498,392 27.58% 26.59% $1,308,500 72.42% 91.81% 55,623 $32.48 $615.30 $100.04 $111.54 $5.79
Jan-98 $1,894,621 $522,682 27.59% 25.78% $1,371,939 72.41% 91.96% 59,770 $31.70 $645.29 $104.89 $116.95 $6.07
Feb-98 $2,041,188 $578,510 28.34% 28.66% $1,462,678 71.66% 92.16% 61,229 $33.34 $714.21 $111.83 $126.00 $6.54
Mar-98 $2,021,610 $489,677 24.22% 24.88% $1,531,933 75.78% 91.71% 61,044 $33.12 $604.54 $117.12 $124.79 $6.48
Apr-98 $1,855,214 $469,430 25.30% 27.24% $1,385,784 74.70% 91.26% 54,145 $34.26 $579.54 $105.95 $114.52 $5.95
May -98 $1,873,611 $463,359 24.73% 26.31% $1,410,252 75.27% 91.37% 57,294 $32.70 $572.05 $107.82 $115.66 $6.01
Jun-98 $1,732,359 $402,099 23.21% 23.83% $1,330,260 76.79% 91.42% 53,323 $32.49 $496.42 $101.70 $106.94 $5.55
TOTALS: $22,233,407 $5,618,887 25.27% 25.42% $16,614,520 74.73% 91.80% 695,910 $31.95 $578.07 $105.85 $114.37 $5.94

44
Harrah�s North Kansas City
General Manager: Michael St. PierreOne Riverboat DriveNorth Kansas City, MO 64116(816) 472-7777
Date Licensed: September 22, 1994Gaming Space: 61,600 Square FeetTwo CasinosGaming Positions: 2,387Electronic Gaming Devices: 2,174Table Games: 76Restaurants: 3200 Room HotelMeeting SpaceSurface and Garage Parking
Market Analysis
Harrah's North Kansas City posted thehighest gaming revenue in the state of$169.1 million, a 9% increase over theprior fiscal year. The results reflect a1% decline in admissions offset by a10% increase in Win Per Admissions(WPA). The increase in WPA prima-rily reflects more slot play per patron.Harrah's gaming revenue market sharewas 36% for the year.
Jul Aug Sep Oct Nov Dec Jan Feb Mar Apr May Jun0
100
200
300
400
500
600
700
Thou
sand
s
FY 1998
FY 1999
Monthly AdmissionsHarrah's North Kansas City
Jul Aug Sep Oct Nov Dec Jan Feb Mar Apr May Jun$0
$5
$10
$15
$20
Milli
ons
FY 1998
FY 1999
Monthly Gaming RevenueHarrah's North Kansas City

45
TOTAL TABLE TABLE % OF TABLE SLOT SLOT % OF SLOT WIN PER DAILY WIN DAILY WIN DAILY WIN DAILY WINMONTH AGR AGR TOTAL AGR WIN % AGR TOTAL AGR PAYOUT % ADMISSIONS ADMISSION PER TABLE PER SLOT PER POSITION PER SQ FOOT
Jul-98 $14,236,114 $3,147,891 22.11% 24.83% $11,088,223 77.89% 94.47% 565,597 $25.17 $1,380.65 $174.42 $203.04 $7.70
Aug-98 $13,400,376 $2,910,839 21.72% 23.41% $10,489,537 78.28% 94.71% 538,530 $24.88 $1,276.69 $161.50 $187.80 $7.25
Sep-98 $12,696,314 $2,688,307 21.17% 23.73% $10,008,007 78.83% 94.66% 497,695 $25.51 $1,194.80 $153.45 $177.70 $6.87
Oct-98 $13,749,830 $3,108,323 22.61% 23.75% $10,641,507 77.39% 94.68% 534,936 $25.70 $1,381.48 $163.09 $192.37 $7.44
Nov -98 $13,658,831 $3,267,979 23.93% 25.32% $10,390,851 76.07% 94.71% 509,143 $26.83 $1,452.44 $159.25 $191.10 $7.39
Dec-98 $13,802,033 $3,306,469 23.96% 24.15% $10,495,563 76.04% 94.63% 527,299 $26.17 $1,489.40 $162.90 $195.44 $7.47
Jan-99 $13,416,597 $3,120,713 23.26% 23.82% $10,295,883 76.74% 94.89% 531,900 $25.22 $1,342.24 $156.43 $185.06 $7.26
Feb-99 $14,429,826 $3,283,142 22.75% 25.73% $11,146,684 77.25% 94.58% 547,822 $26.34 $1,459.18 $170.91 $201.96 $7.81
Mar-99 $14,870,314 $3,103,749 20.87% 22.14% $11,766,565 79.13% 94.73% 579,036 $25.68 $1,379.44 $180.26 $207.98 $8.05
Apr-99 $15,404,576 $3,450,888 22.40% 24.58% $11,953,688 77.60% 94.77% 565,613 $27.24 $1,533.37 $183.11 $215.43 $8.34
May -99 $15,265,919 $3,448,046 22.59% 24.73% $11,817,873 77.41% 94.80% 579,501 $26.34 $1,532.46 $181.03 $213.50 $8.26
Jun-99 $14,136,974 $2,941,252 20.81% 23.11% $11,195,722 79.19% 94.62% 538,792 $26.24 $1,290.02 $171.66 $197.45 $7.65
TOTALS: $169,067,703 $37,777,600 22.34% 24.11% $131,290,104 77.66% 94.69% 6,515,864 $25.95 $1,392.68 $168.17 $197.40 $7.62
TOTAL TABLE TABLE % OF TABLE SLOT SLOT % OF SLOT WIN PER DAILY WIN DAILY WIN DAILY WIN DAILY WINMONTH AGR AGR TOTAL AGR WIN % AGR TOTAL AGR PAYOUT % ADMISSIONS ADMISSION PER TABLE PER SLOT PER POSITION PER SQ FOOT
Jul-97 $13,752,391 $3,538,989 25.73% 25.57% $10,213,402 74.27% 94.85% 605,565 $22.71 $1,355.93 $168.62 $199.14 $7.44
Aug-97 $13,317,216 $3,377,542 25.36% 24.02% $9,939,674 74.64% 95.04% 616,235 $21.61 $1,294.08 $164.10 $192.84 $7.21
Sep-97 $12,697,406 $3,223,109 25.38% 26.40% $9,474,297 74.62% 94.96% 549,205 $23.12 $1,234.91 $156.42 $183.86 $6.87
Oct-97 $12,383,800 $2,888,416 23.32% 22.90% $9,495,385 76.68% 94.92% 544,222 $22.76 $1,106.67 $156.77 $179.32 $6.70
Nov -97 $12,862,437 $3,259,892 25.34% 25.41% $9,602,546 74.66% 94.70% 543,992 $23.64 $1,249.00 $158.54 $186.25 $6.96
Dec-97 $11,751,724 $2,965,307 25.23% 22.89% $8,786,418 74.77% 94.83% 521,288 $22.54 $1,136.13 $145.06 $170.17 $6.36
Jan-98 $13,326,523 $3,603,370 27.04% 27.16% $9,723,154 72.96% 94.84% 572,226 $23.29 $1,380.60 $160.53 $192.97 $7.21
Feb-98 $12,611,915 $3,039,195 24.10% 24.70% $9,572,720 75.90% 94.71% 544,356 $23.17 $1,164.44 $158.04 $182.62 $6.82
Mar-98 $14,163,133 $3,399,780 24.00% 25.37% $10,763,354 76.00% 94.77% 582,671 $24.31 $1,302.60 $177.70 $205.08 $7.66
Apr-98 $13,111,642 $3,074,408 23.45% 24.88% $10,037,233 76.55% 94.70% 525,334 $24.96 $1,177.93 $165.71 $189.86 $7.10
May -98 $12,979,571 $2,930,116 22.57% 25.19% $10,049,455 77.43% 94.70% 516,074 $25.15 $1,122.65 $165.91 $187.95 $7.02
Jun-98 $12,303,270 $2,716,150 22.08% 24.96% $9,587,119 77.92% 94.41% 476,328 $25.83 $1,040.67 $158.28 $178.15 $6.66
TOTALS: $155,261,029 $38,016,273 24.49% 24.95% $117,244,756 75.51% 94.79% 6,597,496 $23.53 $1,213.80 $161.31 $187.35 $7.00
Fiscal Year Ended June 30, 1999
Fiscal Year Ended June 30, 1998

46
Harrah�s Maryland Heights
General Manager: Vern Jennings777 Casino Center DriveMaryland Heights, MO 63146(314) 770-8100
Date Licensed: March 11, 1997Gaming Space: 52,000 Square FeetTwo CasinosGaming Positions: 1,779Electronic Gaming Devices: 1,671Table Games: 49Restaurants: 4200 Room HotelMeeting SpaceSurface and Garage Parking
Market Analysis
Harrah's Maryland Heights posted gamingrevenue of $113 million, a 45% increaseover the prior fiscal year, the largest per-cent increase in the state. The results reflecta 26% increase in admissions combinedwith a 15% increase in Win Per Admissions(WPA). The increase in admissions prima-rily reflects higher market share. Harrah'sgaming revenue market share (Missouriboats only) was 30% for the fiscal year, upfrom 24% last year.
Jul Aug Sep Oct Nov Dec Jan Feb Mar Apr May Jun$0
$2
$4
$6
$8
$10
$12
Mill
ions
FY 1998FY 1999
Monthly Gaming RevenueHarrah's Maryland Heights
Jul Aug Sep Oct Nov Dec Jan Feb Mar Apr May Jun0
100
200
300
400
500
Tho
usan
ds
FY 1998
FY 1999
Monthly AdmissionsHarrah's Maryland Heights

47
TOTAL TABLE TABLE % OF TABLE SLOT SLOT % OF SLOT WIN PER DAILY WIN DAILY WIN DAILY WIN DAILY WINMONTH AGR AGR TOTAL AGR WIN % AGR TOTAL AGR PAYOUT % ADMISSIONS ADMISSION PER TABLE PER SLOT PER POSITION PER SQ FOOT
Jul-98 $9,100,399 $1,646,666 18.09% 18.73% $7,453,733 81.91% 94.32% 420,609 $21.64 $1,143.52 $149.85 $172.14 $5.83
Aug-98 $8,510,530 $1,726,586 20.29% 20.24% $6,783,944 79.71% 94.74% 401,051 $21.22 $1,199.02 $136.06 $160.65 $5.46
Sep-98 $7,959,666 $1,410,881 17.73% 17.93% $6,548,786 82.27% 94.56% 363,571 $21.89 $979.78 $131.50 $150.41 $5.10
Oct-98 $9,003,058 $1,591,373 17.68% 18.20% $7,411,685 82.32% 94.68% 415,849 $21.65 $1,102.20 $147.32 $168.66 $5.77
Nov -98 $9,128,277 $1,724,465 18.89% 18.61% $7,403,811 81.11% 94.72% 440,727 $20.71 $1,197.55 $147.16 $171.01 $5.85
Dec-98 $9,641,500 $1,848,099 19.17% 19.41% $7,793,400 80.83% 94.54% 441,995 $21.81 $1,283.40 $156.75 $182.34 $6.18
Jan-99 $8,591,384 $1,628,320 18.95% 18.40% $6,963,064 81.05% 94.95% 401,359 $21.41 $1,130.78 $139.71 $162.10 $5.51
Feb-99 $9,439,385 $1,772,765 18.78% 19.56% $7,666,620 81.22% 94.66% 452,827 $20.85 $1,231.09 $152.48 $176.93 $6.05
Mar-99 $10,230,419 $1,923,290 18.80% 19.19% $8,307,129 81.20% 94.67% 467,590 $21.88 $1,308.36 $165.22 $191.22 $6.56
Apr-99 $10,290,517 $1,666,137 16.19% 16.65% $8,624,380 83.81% 94.64% 465,847 $22.09 $1,133.43 $171.73 $192.53 $6.60
May -99 $11,044,958 $2,001,359 18.12% 19.50% $9,043,599 81.88% 94.57% 473,104 $23.35 $1,361.47 $180.19 $206.63 $7.08
Jun-99 $10,250,484 $1,698,479 16.57% 17.81% $8,552,005 83.43% 94.49% 444,946 $23.04 $1,155.43 $170.60 $192.06 $6.57
TOTALS: $113,190,577 $20,638,420 18.23% 18.68% $92,552,157 81.77% 94.63% 5,189,475 $21.81 $1,185.50 $154.05 $177.22 $6.05
TOTAL TABLE TABLE % OF TABLE SLOT SLOT % OF SLOT WIN PER DAILY WIN DAILY WIN DAILY WIN DAILY WINMONTH AGR AGR TOTAL AGR WIN % AGR TOTAL AGR PAYOUT % ADMISSIONS ADMISSION PER TABLE PER SLOT PER POSITION PER SQ FOOT
Jul-97 $5,352,286 $1,350,216 25.23% 16.40% $4,002,070 74.77% 94.64% 317,343 $16.87 $703.24 $101.29 $115.63 $3.43
Aug-97 $5,982,137 $1,607,186 26.87% 18.10% $4,374,950 73.13% 94.81% 352,306 $16.98 $837.08 $110.73 $129.23 $3.83
Sep-97 $5,701,499 $1,534,683 26.92% 18.65% $4,166,816 73.08% 94.99% 324,856 $17.55 $799.31 $105.46 $123.17 $3.65
Oct-97 $6,164,161 $1,725,027 27.98% 20.35% $4,439,133 72.02% 95.19% 333,758 $18.47 $898.45 $112.35 $133.16 $3.95
Nov -97 $6,297,576 $1,901,570 30.20% 21.89% $4,396,006 69.80% 95.42% 338,448 $18.61 $990.40 $111.26 $136.05 $4.04
Dec-97 $5,672,302 $1,481,964 26.13% 17.40% $4,190,338 73.87% 95.62% 310,950 $18.24 $771.86 $106.06 $122.54 $3.64
Jan-98 $6,291,297 $1,687,630 26.82% 20.96% $4,603,667 73.18% 95.17% 318,161 $19.77 $878.97 $116.52 $135.91 $4.03
Feb-98 $6,586,950 $1,646,140 24.99% 20.58% $4,940,809 75.01% 94.97% 350,810 $18.78 $857.36 $125.05 $142.30 $4.22
Mar-98 $7,536,802 $1,804,955 23.95% 19.82% $5,731,846 76.05% 94.84% 380,672 $19.80 $940.08 $145.07 $162.82 $4.83
Apr-98 $7,541,276 $1,853,407 24.58% 20.94% $5,687,869 75.42% 95.14% 384,006 $19.64 $965.32 $143.96 $162.91 $4.83
May -98 $8,182,876 $1,702,938 20.81% 19.94% $6,479,937 79.19% 94.60% 373,039 $21.94 $886.95 $164.01 $176.77 $5.25
Jun-98 $7,028,325 $1,508,544 21.46% 19.08% $5,519,781 78.54% 94.99% 347,523 $20.22 $785.70 $139.71 $151.83 $4.51
TOTALS: $78,337,484 $19,804,261 25.28% 19.52% $58,533,223 74.72% 95.03% 4,131,872 $18.96 $859.56 $123.46 $141.03 $4.18
Fiscal Year Ended June 30, 1999
Fiscal Year Ended June 30, 1998

48
Hilton - Kansas City
General Manager: Dave Miller1800 E. Front StreetKansas City, MO 64120(816) 855-7777
Date Licensed: October 18, 1996Gaming Space: 30,000 Square FeetGaming Positions: 1,166Electronic Gaming Devices: 1,029Table Games: 44Restaurants: 3Surface and Garage ParkingRiverfront Park
Market Analysis
Hilton posted substantially higher gam-ing revenue of $66.2 million, a 32% in-crease over the prior fiscal year. The re-sults reflect a 35% increase in admissions.The increase in admissions is partly dueto the Boyd closure. Hilton's WPA wasthe lowest in the market at $18.57. Theirgaming revenue market share was 14%for the year.
Jul Aug Sep Oct Nov Dec Jan Feb Mar Apr May Jun0
50100
150
200
250300
350
Thou
sand
s
FY 1998
FY 1999
Monthly AdmissionsHilton - Kansas City
Jul Aug Sep Oct Nov Dec Jan Feb Mar Apr May Jun$0
$1$2
$3
$4
$5$6
$7
Milli
ons
FY 1998
FY 1999
Monthly Gaming RevenueHilton - Kansas City

49
TOTAL TABLE TABLE % OF TABLE SLOT SLOT % OF SLOT WIN PER DAILY WIN DAILY WIN DAILY WIN DAILY WINMONTH AGR AGR TOTAL AGR WIN % AGR TOTAL AGR PAYOUT % ADMISSIONS ADMISSION PER TABLE PER SLOT PER POSITION PER SQ FOOT
Jul-98 $5,323,754 $1,305,043 24.51% 22.77% $4,018,711 75.49% 94.52% 290,048 $18.35 $906.28 $132.63 $151.80 $5.92
Aug-98 $5,574,712 $1,312,796 23.55% 22.87% $4,261,916 76.45% 94.11% 284,043 $19.63 $911.66 $140.66 $158.96 $6.19
Sep-98 $5,220,944 $1,263,067 24.19% 23.39% $3,957,878 75.81% 94.36% 277,094 $18.84 $877.13 $128.71 $147.03 $5.80
Oct-98 $5,366,240 $1,120,628 20.88% 19.08% $4,245,613 79.12% 94.40% 290,931 $18.45 $778.21 $138.88 $151.96 $5.96
Nov -98 $5,436,605 $1,251,187 23.01% 22.68% $4,185,418 76.99% 94.31% 268,002 $20.29 $868.88 $136.91 $154.53 $6.04
Dec-98 $5,737,944 $1,350,544 23.54% 23.98% $4,387,400 76.46% 94.22% 299,696 $19.15 $900.36 $143.52 $161.12 $6.38
Jan-99 $5,647,021 $1,414,591 25.05% 26.02% $4,232,430 74.95% 94.50% 312,780 $18.05 $943.06 $138.45 $158.57 $6.27
Feb-99 $5,335,391 $1,200,546 22.50% 23.42% $4,134,845 77.50% 94.51% 302,357 $17.65 $800.36 $135.26 $149.82 $5.93
Mar-99 $5,800,625 $1,228,368 21.18% 22.10% $4,572,258 78.82% 94.25% 313,511 $18.50 $818.91 $148.40 $161.77 $6.45
Apr-99 $5,926,204 $1,265,496 21.35% 22.59% $4,660,708 78.65% 94.52% 332,265 $17.84 $843.66 $151.27 $165.40 $6.58
May -99 $5,643,926 $1,142,083 20.24% 21.36% $4,501,843 79.76% 94.46% 310,664 $18.17 $865.22 $145.83 $161.33 $6.27
Jun-99 $5,197,901 $1,098,049 21.12% 22.50% $4,099,853 78.88% 94.63% 283,167 $18.36 $831.86 $132.81 $148.58 $5.78
TOTALS: $66,211,268 $14,952,395 22.58% 22.71% $51,258,873 77.42% 94.40% 3,564,558 $18.57 $862.13 $139.44 $155.91 $6.13
TOTAL TABLE TABLE % OF TABLE SLOT SLOT % OF SLOT WIN PER DAILY WIN DAILY WIN DAILY WIN DAILY WINMONTH AGR AGR TOTAL AGR WIN % AGR TOTAL AGR PAYOUT % ADMISSIONS ADMISSION PER TABLE PER SLOT PER POSITION PER SQ FOOT
Jul-97 $3,765,065 $1,094,240 29.06% 27.28% $2,670,826 70.94% 93.82% 186,830 $20.15 $729.49 $87.03 $105.29 $4.18
Aug-97 $3,774,654 $1,045,077 27.69% 24.58% $2,729,577 72.31% 94.16% 204,512 $18.46 $696.72 $88.94 $105.56 $4.19
Sep-97 $3,522,589 $1,008,228 28.62% 25.51% $2,514,362 71.38% 94.19% 189,005 $18.64 $672.15 $81.93 $98.51 $3.91
Oct-97 $3,634,113 $936,782 25.78% 21.80% $2,697,330 74.22% 94.27% 200,952 $18.08 $624.52 $87.89 $101.63 $4.04
Nov -97 $3,765,580 $1,038,271 27.57% 24.00% $2,727,309 72.43% 94.03% 203,966 $18.46 $692.18 $88.87 $105.30 $4.18
Dec-97 $3,772,766 $1,027,462 27.23% 23.83% $2,745,304 72.77% 93.88% 189,892 $19.87 $684.97 $89.45 $105.50 $4.19
Jan-98 $4,246,352 $1,272,740 29.97% 26.94% $2,973,612 70.03% 94.37% 217,775 $19.50 $848.49 $96.89 $118.75 $4.72
Feb-98 $4,651,659 $1,262,668 27.14% 26.62% $3,388,991 72.86% 94.07% 241,509 $19.26 $841.78 $110.43 $130.08 $5.17
Mar-98 $4,783,352 $1,092,021 22.83% 20.61% $3,691,332 77.17% 94.08% 252,086 $18.98 $728.01 $120.28 $133.76 $5.31
Apr-98 $4,603,408 $1,033,841 22.46% 20.43% $3,569,568 77.54% 94.39% 247,686 $18.59 $689.23 $116.31 $128.73 $5.11
May -98 $4,954,417 $1,209,144 24.41% 23.16% $3,745,274 75.59% 94.45% 254,657 $19.46 $806.10 $122.04 $138.55 $5.50
Jun-98 $4,676,735 $1,084,150 23.18% 21.86% $3,592,585 76.82% 94.21% 244,697 $19.11 $722.77 $117.06 $130.78 $5.20
TOTALS: $50,150,689 $13,104,621 26.13% 23.76% $37,046,069 73.87% 94.18% 2,633,567 $19.04 $728.03 $100.59 $116.87 $4.64
Fiscal Year Ended June 30, 1999
Fiscal Year Ended June 30, 1998
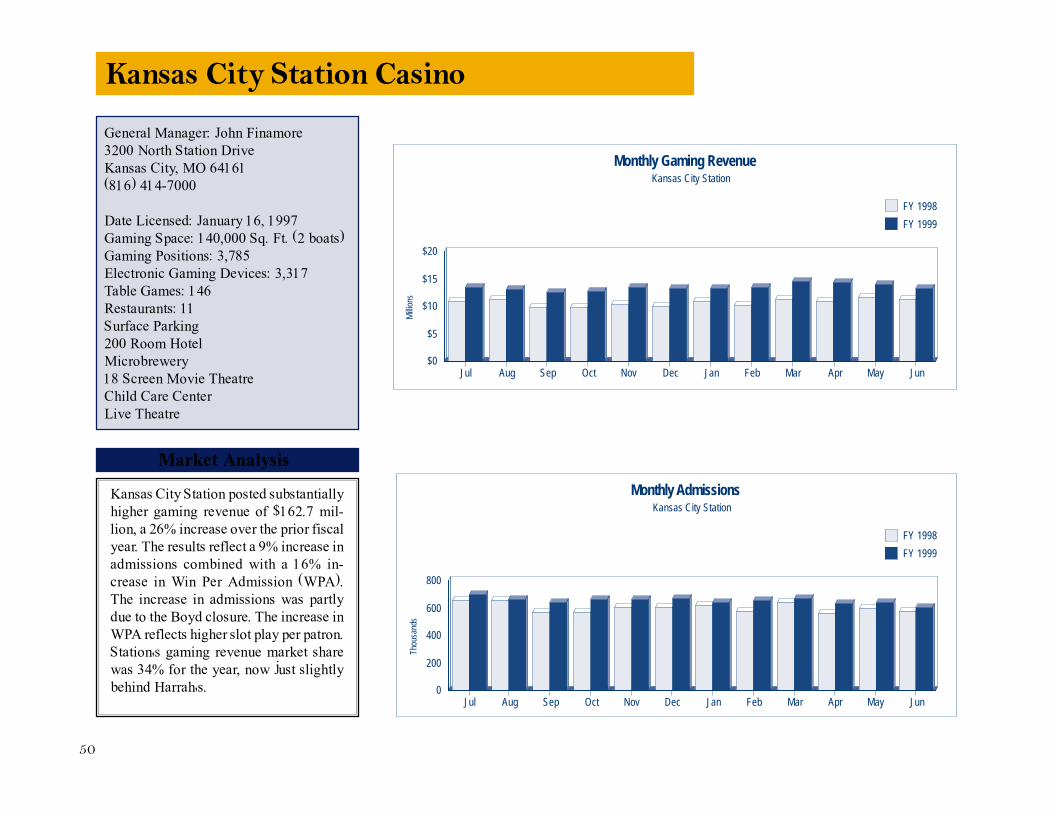
50
Jul Aug Sep Oct Nov Dec Jan Feb Mar Apr May Jun0
200
400
600
800
Thou
sand
s
FY 1998
FY 1999
Monthly AdmissionsKansas City Station
Jul Aug Sep Oct Nov Dec Jan Feb Mar Apr May Jun$0
$5
$10
$15
$20
Milli
ons
FY 1998
FY 1999
Monthly Gaming RevenueKansas City Station
General Manager: John Finamore3200 North Station DriveKansas City, MO 64161(816) 414-7000
Date Licensed: January 16, 1997Gaming Space: 140,000 Sq. Ft. (2 boats)Gaming Positions: 3,785Electronic Gaming Devices: 3,317Table Games: 146Restaurants: 11Surface Parking200 Room HotelMicrobrewery18 Screen Movie TheatreChild Care CenterLive Theatre
Kansas City Station Casino
Market Analysis
Kansas City Station posted substantiallyhigher gaming revenue of $162.7 mil-lion, a 26% increase over the prior fiscalyear. The results reflect a 9% increase inadmissions combined with a 16% in-crease in Win Per Admission (WPA).The increase in admissions was partlydue to the Boyd closure. The increase inWPA reflects higher slot play per patron.Station's gaming revenue market sharewas 34% for the year, now just slightlybehind Harrah's.

51
TOTAL TABLE TABLE % OF TABLE SLOT SLOT % OF SLOT WIN PER DAILY WIN DAILY WIN DAILY WIN DAILY WINMONTH AGR AGR TOTAL AGR WIN % AGR TOTAL AGR PAYOUT % ADMISSIONS ADMISSION PER TABLE PER SLOT PER POSITIONPER SQ FOOT
Jul-98 $13,554,764 $3,406,892 25.13% 23.54% $10,147,872 74.87% 94.28% 703,016 $19.28 $641.30 $109.29 $120.47 $3.23
Aug-98 $13,262,795 $3,460,996 26.10% 25.21% $9,801,799 73.90% 94.34% 668,545 $19.84 $644.82 $103.76 $116.06 $3.16
Sep-98 $12,704,757 $2,860,739 22.52% 21.91% $9,844,018 77.48% 94.25% 647,236 $19.63 $535.72 $104.24 $111.35 $3.02
Oct-98 $12,844,808 $3,198,563 24.90% 22.00% $9,646,245 75.10% 94.54% 663,190 $19.37 $598.98 $102.17 $112.61 $3.06
Nov -98 $13,572,727 $3,568,012 26.29% 25.12% $10,004,715 73.71% 94.36% 668,884 $20.29 $668.17 $105.97 $118.99 $3.23
Dec-98 $13,312,056 $3,582,646 26.91% 24.77% $9,729,410 73.09% 94.37% 671,148 $19.83 $670.91 $104.04 $117.52 $3.17
Jan-99 $13,385,154 $3,601,099 26.90% 25.69% $9,784,055 73.10% 94.51% 642,518 $20.83 $674.36 $105.20 $118.64 $3.19
Feb-99 $13,563,783 $3,269,561 24.11% 24.09% $10,294,222 75.89% 94.35% 656,752 $20.65 $608.86 $108.83 $118.58 $3.23
Mar-99 $14,713,374 $3,539,225 24.05% 24.13% $11,174,149 75.95% 94.09% 673,427 $21.85 $662.78 $118.13 $128.80 $3.50
Apr-99 $14,365,551 $3,454,566 24.05% 23.92% $10,910,985 75.95% 94.06% 639,594 $22.46 $646.91 $115.64 $126.00 $3.42
May -99 $14,100,536 $3,202,927 22.71% 22.62% $10,897,609 77.29% 94.14% 641,163 $21.99 $659.04 $115.76 $126.55 $3.36
Jun-99 $13,290,755 $3,053,016 22.97% 24.08% $10,237,739 77.03% 94.20% 607,706 $21.87 $694.10 $102.88 $116.93 $3.16
TOTALS: $162,671,061 $40,198,242 24.71% 23.93% $122,472,819 75.29% 94.29% 7,883,179 $20.64 $642.16 $107.99 $119.38 $3.23
TOTAL TABLE TABLE % OF TABLE SLOT SLOT % OF SLOT WIN PER DAILY WIN DAILY WIN DAILY WIN DAILY WINMONTH AGR AGR TOTAL AGR WIN % AGR TOTAL AGR PAYOUT % ADMISSIONS ADMISSION PER TABLE PER SLOT PER POSITIONPER SQ FOOT
Jul-97 $10,983,402 $3,372,698 30.71% 24.10% $7,610,704 69.29% 94.56% 660,157 $16.64 $635.16 $79.80 $98.07 $2.62
Aug-97 $11,288,784 $3,272,515 28.99% 22.82% $8,016,269 71.01% 94.11% 657,021 $17.18 $616.29 $84.05 $100.80 $2.69
Sep-97 $9,949,432 $3,020,963 30.36% 24.41% $6,928,469 69.64% 94.32% 569,006 $17.49 $568.92 $72.65 $88.84 $2.37
Oct-97 $9,944,523 $2,971,019 29.88% 22.35% $6,973,504 70.12% 94.39% 572,990 $17.36 $559.51 $73.12 $88.80 $2.37
Nov -97 $10,424,935 $2,885,779 27.68% 20.49% $7,539,156 72.32% 94.16% 604,106 $17.26 $543.46 $79.05 $93.09 $2.48
Dec-97 $10,163,754 $3,157,255 31.06% 23.03% $7,006,499 68.94% 94.53% 607,013 $16.74 $594.59 $73.47 $90.76 $2.42
Jan-98 $11,040,810 $3,750,738 33.97% 26.92% $7,290,072 66.03% 94.41% 622,878 $17.73 $706.35 $76.44 $98.59 $2.63
Feb-98 $10,310,045 $3,123,263 30.29% 23.83% $7,186,782 69.71% 94.50% 581,682 $17.72 $588.19 $75.36 $92.06 $2.45
Mar-98 $11,413,261 $3,301,380 28.93% 23.21% $8,111,881 71.07% 94.29% 642,420 $17.77 $621.73 $85.06 $101.91 $2.72
Apr-98 $10,966,630 $2,982,811 27.20% 24.07% $7,983,819 72.80% 94.11% 561,898 $19.52 $561.73 $83.71 $97.93 $2.61
May -98 $11,791,961 $2,909,777 24.68% 24.40% $8,882,184 75.32% 94.27% 601,679 $19.60 $547.98 $93.13 $105.29 $2.81
Jun-98 $11,279,965 $2,892,310 25.64% 24.22% $8,387,655 74.36% 94.43% 576,401 $19.57 $544.69 $87.95 $100.72 $2.69
TOTALS: $129,557,501 $37,640,508 29.05% 23.63% $91,916,993 70.95% 94.34% 7,257,251 $17.85 $590.72 $80.32 $96.41 $2.57
Fiscal Year Ended June 30, 1999
Fiscal Year Ended June 30, 1998

52
Players - Maryland Heights
General Manager: Larry Buck777 Casino Center Drive, Ste. 1Maryland Heights, MO 63143(314) 209-3900
Date Licensed: March 11, 1997Gaming Space: 52,000 Square FeetGaming Positions: 1,697Electronic Gaming Devices: 1,586Table Games: 48Restaurants: 1200 Room Hotel (Harrah�s Operates)Meeting SpaceSurface and Garage Parking
Market Analysis
Players posted substantially higher gam-ing revenue of $96.6 million, a 26% in-crease over the prior fiscal year. The re-sults reflect a 6% increase in admissionscombined with a 18% increase in Win PerAdmission (WPA). The increase in WPAreflects higher slot play per patron. Note,Players recorded $16.6 million less ingaming revenue than their joint venturepartner, Harrah's. Their gaming revenuemarket share (Missouri boats only) was25% for the year.
Jul Aug Sep Oct Nov Dec Jan Feb Mar Apr May Jun0
100
200
300
400
500
Thou
sand
s
FY 1998
FY 1999
Monthly Admissions
Jul Aug Sep Oct Nov Dec Jan Feb Mar Apr May Jun$0
$2
$4
$6
$8
$10
Milli
ons
FY 1998
FY 1999
Monthly Gaming RevenuePlayers - Maryland Heights

53
TOTAL TABLE TABLE % OF TABLE SLOT SLOT % OF SLOT WIN PER DAILY WIN DAILY WIN DAILY WIN DAILY WINMONTH AGR AGR TOTAL AGR WIN % AGR TOTAL AGR PAYOUT % ADMISSIONS ADMISSION PER TABLE PER SLOT PER POSITION PER SQ FOOT
Jul-98 $7,922,534 $1,989,597 25.11% 20.80% $5,932,937 74.89% 94.92% 423,330 $18.71 $934.08 $147.37 $165.04 $5.08
Aug-98 $8,366,289 $2,179,156 26.05% 22.98% $6,187,133 73.95% 94.86% 410,871 $20.36 $1,023.08 $153.66 $174.11 $5.36
Sep-98 $7,024,081 $1,712,271 24.38% 19.58% $5,311,810 75.62% 94.95% 347,351 $20.22 $803.88 $131.91 $145.19 $4.50
Oct-98 $8,270,303 $1,919,210 23.21% 20.06% $6,351,094 76.79% 95.05% 420,611 $19.66 $954.83 $151.94 $169.77 $5.30
Nov -98 $7,821,657 $1,737,638 22.22% 18.25% $6,084,020 77.78% 94.89% 393,799 $19.86 $965.35 $148.68 $167.39 $5.01
Dec-98 $8,064,026 $1,835,215 22.76% 19.88% $6,228,811 77.24% 94.75% 393,558 $20.49 $1,015.57 $152.66 $172.83 $5.17
Jan-99 $7,865,347 $1,835,114 23.33% 21.77% $6,030,233 76.67% 94.70% 379,513 $20.72 $1,019.51 $144.34 $165.50 $5.04
Feb-99 $7,880,756 $1,450,845 18.41% 18.11% $6,429,911 81.59% 94.71% 389,504 $20.23 $806.03 $150.71 $163.17 $5.05
Mar-99 $7,721,126 $1,275,841 16.52% 15.16% $6,445,285 83.48% 94.80% 379,219 $20.36 $708.80 $147.35 $156.69 $4.95
Apr-99 $8,394,305 $1,388,503 16.54% 16.80% $7,005,802 83.46% 94.62% 393,917 $21.31 $963.38 $156.94 $173.86 $5.38
May -99 $8,836,130 $1,671,009 18.91% 20.75% $7,165,121 81.09% 94.56% 394,608 $22.39 $1,158.61 $152.97 $177.48 $5.66
Jun-99 $8,416,752 $1,319,152 15.67% 17.22% $7,097,600 84.33% 94.57% 390,239 $21.57 $916.08 $149.17 $165.29 $5.40
TOTALS: $96,583,305 $20,313,548 21.03% 19.36% $76,269,757 78.97% 94.78% 4,716,520 $20.48 $939.10 $148.98 $166.36 $5.16
TOTAL TABLE TABLE % OF TABLE SLOT SLOT % OF SLOT WIN PER DAILY WIN DAILY WIN DAILY WIN DAILY WINMONTH AGR AGR TOTAL AGR WIN % AGR TOTAL AGR PAYOUT % ADMISSIONS ADMISSION PER TABLE PER SLOT PER POSITION PER SQ FOOT
Jul-97 $6,088,579 $1,848,083 30.35% 20.59% $4,240,496 69.65% 94.55% 376,485 $16.17 $789.78 $107.08 $125.05 $3.90
Aug-97 $6,419,243 $2,003,909 31.22% 21.54% $4,415,334 68.78% 94.59% 399,781 $16.06 $856.37 $111.50 $131.84 $4.11
Sep-97 $5,576,981 $1,749,815 31.38% 20.49% $3,827,166 68.62% 94.95% 373,895 $14.92 $747.78 $96.65 $114.54 $3.57
Oct-97 $5,834,061 $1,829,506 31.36% 20.69% $4,004,555 68.64% 94.74% 340,185 $17.15 $781.84 $101.13 $119.82 $3.74
Nov -97 $5,928,377 $1,847,133 31.16% 20.02% $4,081,243 68.84% 94.80% 349,887 $16.94 $789.37 $103.06 $121.76 $3.80
Dec-97 $5,836,346 $2,111,984 36.19% 23.60% $3,724,363 63.81% 94.80% 322,982 $18.07 $902.56 $94.05 $119.87 $3.74
Jan-98 $6,504,912 $2,148,542 33.03% 22.93% $4,356,370 66.97% 94.72% 367,531 $17.70 $918.18 $110.01 $133.60 $4.17
Feb-98 $6,230,163 $1,906,659 30.60% 21.99% $4,323,505 69.40% 94.67% 350,941 $17.75 $814.81 $109.18 $127.96 $3.99
Mar-98 $6,606,368 $1,744,233 26.40% 17.88% $4,862,135 73.60% 94.41% 377,119 $17.52 $745.40 $122.78 $135.68 $4.23
Apr-98 $7,254,280 $1,990,427 27.44% 21.79% $5,263,853 72.56% 94.61% 399,660 $18.15 $850.61 $132.93 $148.99 $4.65
May -98 $7,762,803 $1,940,308 24.99% 20.95% $5,822,496 75.01% 94.63% 422,245 $18.38 $829.19 $147.03 $159.43 $4.98
Jun-98 $6,749,154 $1,836,821 27.22% 21.57% $4,912,333 72.78% 94.92% 354,630 $19.03 $784.97 $124.05 $138.61 $4.33
TOTALS: $76,791,268 $22,957,420 29.90% 21.15% $53,833,848 70.10% 94.69% 4,435,341 $17.31 $817.57 $113.29 $131.43 $4.10
Fiscal Year Ended June 30, 1999
Fiscal Year Ended June 30, 1998

54
Jul Aug Sep Oct Nov Dec Jan Feb Mar Apr May Jun0
50
100
150
200
250
300
350
Thou
sand
s
FY 1998
FY 1999
Monthly AdmissionsPresident - St. Louis
Jul Aug Sep Oct Nov Dec Jan Feb Mar Apr May Jun$0
$1
$2
$3
$4
$5
$6
Milli
ons
FY 1998
FY 1999
Monthly Gaming RevenuePresident - St. Louis
President Casino on the Admiral
General Manager: Jesus Aviles800 N. First StreetSt. Louis, MO 63102(314) 622-3000
Date Licensed: May 27, 1994Gaming Space: 58,000 Square FeetGaming Positions: 1,422Electronic Gaming Devices: 1,230Table Games: 59Restaurants: 2Garage Parking Nearby
Market Analysis
The President posted slightly higher gam-ing revenue of $59.3 million, a 3% in-crease over the prior fiscal year. The re-sults reflect a 4% increase in admissionsoffset by a 1% decline in Win Per Admis-sion (WPA). The increase in admissionsprimarily reflect the favorable comparisonwith the prior year when the boat wasclosed for about a month due to the bargeaccident. The President's gaming revenuemarket share (Missouri boats only) was16% for the year.

55
TOTAL TABLE TABLE % OF TABLE SLOT SLOT % OF SLOT WIN PER DAILY WIN DAILY WIN DAILY WIN DAILY WINMONTH AGR AGR TOTAL AGR WIN % AGR TOTAL AGR PAYOUT % ADMISSIONS ADMISSION PER TABLE PER SLOT PER POSITION PER SQ FOOT
Jul-98 $5,186,535 $891,644 17.19% 22.10% $4,294,891 82.81% 93.47% 277,237 $18.71 $521.43 $115.36 $121.18 $2.98
Aug-98 $5,174,338 $934,227 18.05% 21.73% $4,240,112 81.95% 93.54% 286,795 $18.04 $541.62 $114.81 $122.51 $2.97
Sep-98 $4,952,838 $892,331 18.02% 22.23% $4,060,508 81.98% 93.40% 264,356 $18.74 $487.61 $109.68 $115.00 $2.85
Oct-98 $5,173,323 $936,149 18.10% 23.02% $4,237,175 81.90% 93.67% 276,333 $18.72 $503.31 $114.43 $119.70 $2.97
Nov -98 $4,913,112 $918,358 18.69% 23.88% $3,994,755 81.31% 93.57% 252,855 $19.43 $493.74 $107.89 $113.68 $2.82
Dec-98 $4,489,568 $833,221 18.56% 21.36% $3,656,347 81.44% 93.79% 240,059 $18.70 $447.97 $100.35 $105.24 $2.58
Jan-99 $4,135,919 $798,322 19.30% 24.97% $3,337,598 80.70% 93.50% 200,608 $20.62 $466.86 $90.44 $97.63 $2.38
Feb-99 $4,945,989 $970,705 19.63% 24.66% $3,975,283 80.37% 93.92% 254,626 $19.42 $521.89 $107.73 $114.73 $2.84
Mar-99 $5,519,591 $1,176,711 21.32% 25.92% $4,342,880 78.68% 93.76% 288,955 $19.10 $622.60 $117.69 $127.59 $3.17
Apr-99 $5,211,980 $929,983 17.84% 22.52% $4,281,997 82.16% 93.52% 263,715 $19.76 $492.06 $116.04 $120.48 $3.00
May -99 $4,865,065 $881,760 18.12% 21.99% $3,983,305 81.88% 93.87% 268,419 $18.12 $466.54 $107.95 $112.46 $2.80
Jun-99 $4,684,838 $908,687 19.40% 25.48% $3,776,151 80.60% 93.76% 251,711 $18.61 $513.32 $102.33 $109.82 $2.69
TOTALS: $59,253,097 $11,072,096 18.69% 23.29% $48,181,001 81.31% 93.65% 3,125,669 $18.96 $506.58 $108.73 $115.00 $2.84
TOTAL TABLE TABLE % OF TABLE SLOT SLOT % OF SLOT WIN PER DAILY WIN DAILY WIN DAILY WIN DAILY WINMONTH AGR AGR TOTAL AGR WIN % AGR TOTAL AGR PAYOUT % ADMISSIONS ADMISSION PER TABLE PER SLOT PER POSITION PER SQ FOOT
Jul-97 $5,132,165 $823,627 16.05% 17.93% $4,308,539 83.95% 93.29% 277,228 $18.51 $435.78 $122.12 $122.54 $2.95
Aug-97 $5,711,508 $1,080,030 18.91% 22.60% $4,631,478 81.09% 93.40% 300,924 $18.98 $571.44 $131.28 $136.38 $3.28
Sep-97 $5,053,985 $1,021,703 20.22% 23.35% $4,032,282 79.78% 93.59% 263,434 $19.19 $540.58 $114.29 $120.68 $2.90
Oct-97 $4,872,807 $988,396 20.28% 23.28% $3,884,411 79.72% 93.75% 255,584 $19.07 $522.96 $110.10 $116.35 $2.80
Nov -97 $4,932,904 $940,015 19.06% 21.72% $3,992,889 80.94% 93.74% 258,665 $19.07 $497.36 $113.18 $117.79 $2.84
Dec-97 $4,925,853 $1,036,416 21.04% 23.16% $3,889,437 78.96% 93.76% 259,349 $18.99 $548.37 $110.24 $117.62 $2.83
Jan-98 $5,265,652 $925,608 17.58% 21.90% $4,340,045 82.42% 93.47% 267,532 $19.68 $489.74 $123.02 $125.73 $3.03
Feb-98 $5,319,507 $875,276 16.45% 20.82% $4,444,231 83.55% 93.68% 271,122 $19.62 $463.11 $125.97 $127.02 $3.06
Mar-98 $5,351,934 $1,034,547 19.33% 22.98% $4,317,386 80.67% 93.60% 275,157 $19.45 $547.38 $122.37 $127.79 $3.08
Apr-98** $827,652 $151,080 18.25% 24.40% $676,572 81.75% 93.78% 41,738 $19.83 $599.52 $143.83 $148.22 $3.57
May -98 $5,380,373 $1,009,894 18.77% 24.62% $4,370,479 81.23% 93.74% 284,019 $18.94 $534.34 $123.88 $128.47 $3.09
Jun-98 $4,815,607 $796,261 16.53% 20.74% $4,019,346 83.47% 93.86% 260,314 $18.50 $421.30 $113.93 $114.99 $2.77
TOTALS: $57,589,946 $10,682,850 18.55% 22.12% $46,907,097 81.45% 93.63% 3,015,066 $19.10 $514.32 $121.18 $125.30 $3.02
Fiscal Year Ended June 30, 1998
Fiscal Year Ended June 30, 1999

56
Jul Aug Sep Oct Nov Dec Jan Feb Mar Apr May Jun0
100
200
300
400
500
600
Thou
sand
s
FY 1998
FY 1999
Monthly AdmissionsSt. Charles Riverfront Station
Jul Aug Sep Oct Nov Dec Jan Feb Mar Apr May Jun$0
$2
$4
$6
$8
$10
$12
Milli
ons
FY 1998
FY 1999
Monthly Gaming RevenueSt. Charles Riverfront Station
St. Charles Riverfront Station
General Manager: Tony Raymon1260 South Main StreetSt.Charles, MO 63301(314) 940-3400
Date Licensed: May 27, 1994Gaming Space: 47,000 Square FeetTwo CasinosGaming Positions: 2,107Electronic Gaming Devices: 1,986Table Games: 62Restaurants: 2 (full service) 2 (fast)Garage and Surface Parking
Market Analysis
St. Charles Station posted flat gaming rev-enue of $111.4 million, now second toHarrah's in the St. Louis market (Missouriboats only). The results reflect a 7% de-crease in admissions offset by a 7% increasein Win Per Admission (WPA). The declinein admissions primarily reflect the loss ofmarket share to Riverport. The increase inWPA reflects more slot play per patron anda higher slot hold percentage. Station's gam-ing revenue market share (Missouri boatsonly) was 29% for the year.

57
TOTAL TABLE TABLE % OF TABLE SLOT SLOT % OF SLOT WIN PER DAILY WIN DAILY WIN DAILY WIN DAILY WINMONTH AGR AGR TOTAL AGR WIN % AGR TOTAL AGR PAYOUT % ADMISSIONS ADMISSION PER TABLE PER SLOT PER POSITION PER SQ FOOT
Jul-98 $9,310,587 $1,883,406 20.23% 23.34% $7,427,181 79.77% 94.42% 418,832 $22.23 $738.59 $133.61 $145.18 $6.60
Aug-98 $9,845,100 $1,504,620 15.28% 20.64% $8,340,480 84.72% 93.68% 408,817 $24.08 $604.27 $150.77 $145.25 $6.98
Sep-98 $9,184,689 $1,591,794 17.33% 21.81% $7,592,895 82.67% 94.37% 433,431 $21.19 $624.23 $146.68 $142.56 $6.51
Oct-98 $8,988,312 $1,529,752 17.02% 19.47% $7,458,560 82.98% 94.42% 405,610 $22.16 $599.90 $144.04 $139.33 $6.37
Nov -98 $8,617,352 $1,488,522 17.27% 19.14% $7,128,830 82.73% 94.33% 383,632 $22.46 $583.73 $136.62 $132.42 $6.11
Dec-98 $8,552,519 $1,803,133 21.08% 22.58% $6,749,385 78.92% 94.56% 371,223 $23.04 $780.58 $123.27 $136.89 $6.07
Jan-99 $8,156,331 $1,770,482 21.71% 25.55% $6,385,849 78.29% 94.54% 339,317 $24.04 $694.31 $116.47 $125.92 $5.78
Feb-99 $9,287,285 $1,789,269 19.27% 22.10% $7,498,017 80.73% 94.10% 398,276 $23.32 $784.77 $134.37 $148.19 $6.59
Mar-99 $10,937,964 $2,319,661 21.21% 27.48% $8,618,302 78.79% 94.20% 450,682 $24.27 $1,310.54 $149.94 $178.34 $7.76
Apr-99 $9,958,115 $1,960,348 19.69% 25.51% $7,997,767 80.31% 94.14% 401,304 $24.81 $960.95 $134.03 $154.02 $7.06
May -99 $9,352,472 $1,708,083 18.26% 23.35% $7,644,389 81.74% 94.25% 399,687 $23.40 $849.79 $128.50 $145.36 $6.63
Jun-99 $9,189,168 $1,666,667 18.14% 24.87% $7,522,501 81.86% 93.81% 368,705 $24.92 $896.06 $126.26 $145.35 $6.52
TOTALS: $111,379,893 $21,015,736 18.87% 23.06% $90,364,157 81.13% 94.23% 4,779,516 $23.30 $785.64 $135.38 $144.90 $6.58
TOTAL TABLE TABLE % OF TABLE SLOT SLOT % OF SLOT WIN PER DAILY WIN DAILY WIN DAILY WIN DAILY WINMONTH AGR AGR TOTAL AGR WIN % AGR TOTAL AGR PAYOUT % ADMISSIONS ADMISSION PER TABLE PER SLOT PER POSITION PER SQ FOOT
Jul-97 $9,922,829 $1,843,746 18.58% 23.10% $8,079,083 81.42% 94.48% 440,781 $22.51 $675.36 $144.79 $152.07 $7.04
Aug-97 $9,136,613 $1,670,264 18.28% 20.94% $7,466,349 81.72% 94.69% 426,278 $21.43 $611.82 $133.81 $140.02 $6.48
Sep-97 $8,529,144 $1,591,651 18.66% 21.17% $6,937,493 81.34% 94.35% 387,718 $22.00 $583.02 $124.33 $130.71 $6.05
Oct-97 $9,345,420 $1,899,191 20.32% 23.10% $7,446,229 79.68% 94.28% 424,691 $22.01 $695.67 $133.44 $143.22 $6.63
Nov -97 $8,843,617 $1,766,337 19.97% 22.61% $7,077,280 80.03% 94.45% 412,271 $21.45 $647.01 $126.83 $135.53 $6.27
Dec-97 $9,401,675 $2,119,430 22.54% 24.79% $7,282,246 77.46% 94.54% 427,341 $22.00 $776.35 $130.51 $144.09 $6.67
Jan-98 $9,809,703 $1,806,609 18.42% 22.17% $8,003,094 81.58% 94.30% 450,238 $21.79 $661.76 $143.42 $150.34 $6.96
Feb-98 $8,928,201 $1,604,720 17.97% 20.32% $7,323,482 82.03% 94.51% 422,345 $21.14 $587.81 $131.25 $136.83 $6.33
Mar-98 $10,326,907 $1,792,751 17.36% 20.50% $8,534,156 82.64% 94.24% 477,427 $21.63 $656.69 $152.94 $158.27 $7.32
Apr-98 $9,442,214 $1,714,136 18.15% 22.15% $7,728,079 81.85% 94.21% 426,169 $22.16 $627.89 $138.50 $144.71 $6.70
May -98 $8,914,020 $1,410,039 15.82% 18.52% $7,503,981 84.18% 94.34% 411,586 $21.66 $516.50 $134.48 $136.61 $6.32
Jun-98 $9,149,849 $1,699,066 18.57% 23.37% $7,450,784 81.43% 94.30% 406,662 $22.50 $622.37 $133.53 $140.23 $6.49
TOTALS: $111,750,192 $20,917,937 18.72% 21.91% $90,832,255 81.28% 94.39% 5,113,507 $21.85 $638.52 $135.65 $142.72 $6.60
Fiscal Year Ended June 30, 1999
Fiscal Year Ended June 30, 1998
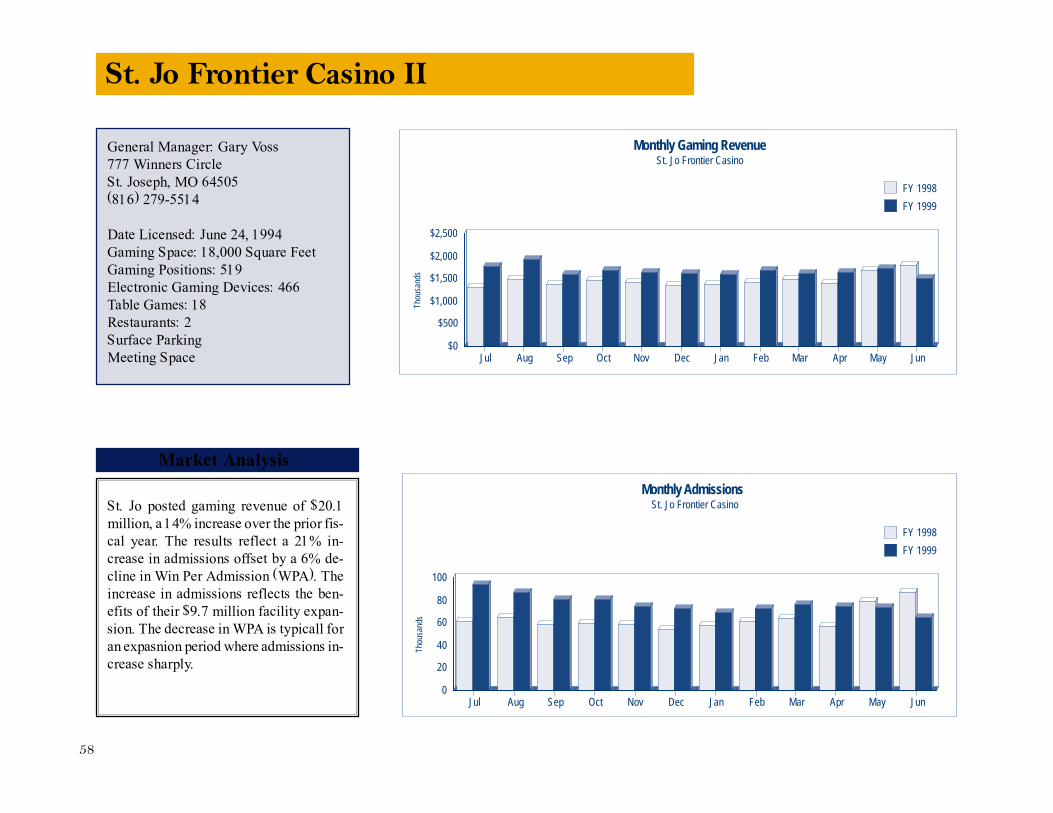
58
Jul Aug Sep Oct Nov Dec Jan Feb Mar Apr May Jun0
20
40
60
80
100
Thou
sand
s
FY 1998
FY 1999
Monthly AdmissionsSt. Jo Frontier Casino
Jul Aug Sep Oct Nov Dec Jan Feb Mar Apr May Jun$0
$500
$1,000
$1,500
$2,000
$2,500
Thou
sand
s
FY 1998
FY 1999
Monthly Gaming RevenueSt. Jo Frontier Casino
St. Jo Frontier Casino II
General Manager: Gary Voss777 Winners CircleSt. Joseph, MO 64505(816) 279-5514
Date Licensed: June 24, 1994Gaming Space: 18,000 Square FeetGaming Positions: 519Electronic Gaming Devices: 466Table Games: 18Restaurants: 2Surface ParkingMeeting Space
Market Analysis
St. Jo posted gaming revenue of $20.1million, a 14% increase over the prior fis-cal year. The results reflect a 21% in-crease in admissions offset by a 6% de-cline in Win Per Admission (WPA). Theincrease in admissions reflects the ben-efits of their $9.7 million facility expan-sion. The decrease in WPA is typicall foran expasnion period where admissions in-crease sharply.
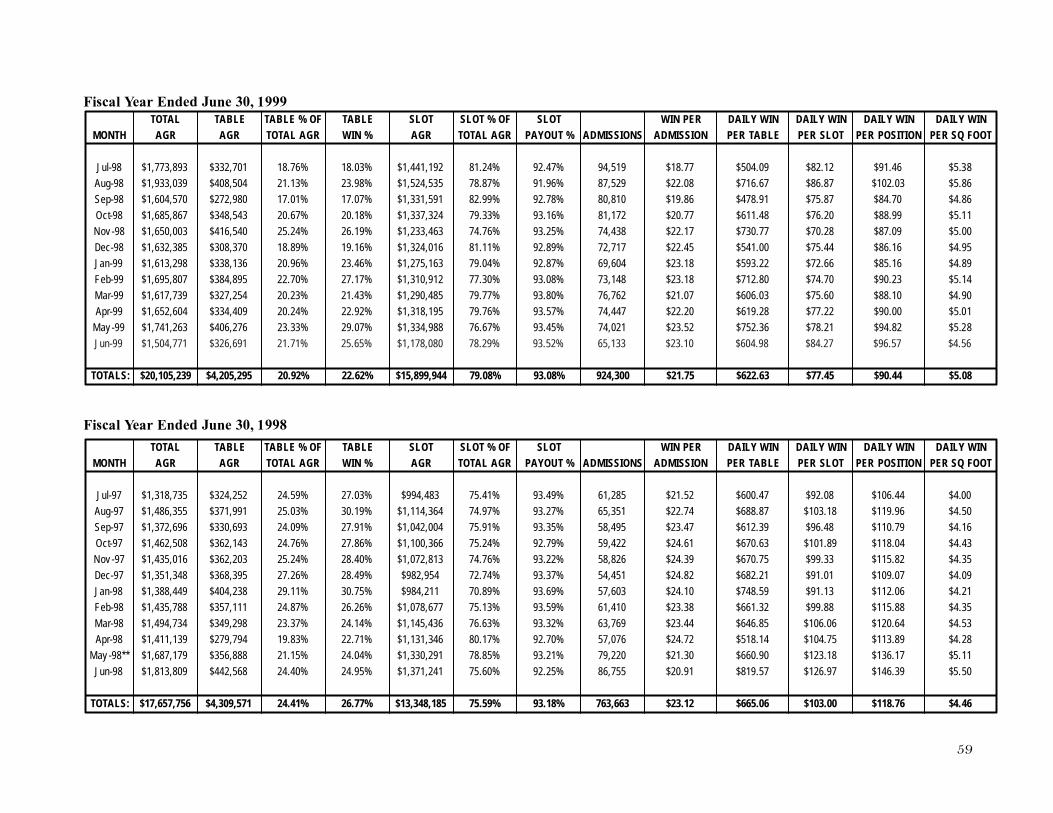
59
4.
5.
5.
4.
3
1
0
2
4.
TELABTLATOTTRGAGRAHTNOM
252324,$5378,31$1,97-luJ
991,1$37355486,,1$g-97Au
693,0$33696372,,1$p-97Se
341,$36250862,4,$197-tOc
20362,3$601435,$1,97-voN
3958,$36348351,,1$97-ceD
2384,$40449388,,1$89-naJ
1117,$35788435,,1$b-98eF
2989,$34734494,1,$r-98aM
497,$27913911,4,$1r-98Ap
15%21.88856,3$917687,$1,**89-yaM
0%4.425682,$44809813,,1$89-nuJ
41%4.21759,30$4,756,756,$17:SLATOT
%EBLATEABLTLATOT LAOTTRGAGRAHTNOM
6718.701332,$3983,77$1,98-luJ
13%1.25048,$40039933,,1$g-98Au
01%7.19802,$27570604,,1$p-98Se
7%6.20345,$34886785,6,$198-tOc
24%25.54016,4$300650,$1,98-voN
9%8.813708,$30385632,,1$98-ceD
96%.021368,$33298613,,1$99-naJ
70%.228954,$38807695,,1$b-99eF
3%2.02254,7$32739617,1,$r-99aM
4%2.20904,$33460452,6,$1r-99Ap
3323.27606,4$632,741$1,99-yaM
%TLOSTOLSEBLATF O %EBLALATOTGRA %NIWRGA LAOT
41%5.748394,9$03%27.%5924.
97.47436114,1,$%1930.03%.52
91.57400042,1,$%9127.09%.42
24%5.7366100,1,$86%27.6%7.24
7.47138,072$1,%04.8224%25.
74.27495$982,%9428.6%2.72
89.07121$984,%7530.1%1.92
1.75776078,1,$%2626.7%8.42
63.67643145,$1,%4124.7%3.32
17%0.8346131,1,$71%22.3%8.19
8.87912,330$1,%40.42
60.57124371,1,$%9524.
575.1858,433,$1%7726.
%TLOSTOLSEBLATF OLATOTGRA %NIWRGA
24%81.192,144,$103%18.%
87.87553524,$1,%8923.
99.28159331,$1,%7017.
33%79.324337,,1$18%20.
7.47634,233$1,9%1.26
11.18601324,1,$%1619.
04.97316275,$1,%4623.
30.77291310,$1,%1727.
77.97548290,1,$%4321.
76%79.19518,3,1$92%22.
676.988,433,$107%9.2%
EP NWITOLSF OONSSIIMDASONSISIMDA %TOUYAPRG A
2521.$52861,9%4.93
47.22$3515,627%3.9%
74.23$4958,535%3.9%
61$24.224,5979%2.9
394.$282658,22%93.6%
28.24$4514,537%93.%
01.$24603,7569%3.9%
83.$23410,1659%93.%3
44.23$7693,632%93.%
72$24.760,5770%2.9
301.$222079,21%93.5%
19.$20755,6825%2.9%
21.23$366,76318%93.%9
EPN WITOLSF OONSSIIMDASONSISIMDA %TOUYAPRG A
7718.$95194,%74.29
80.$22295,7896%91.%
68.$19108,0878%92.%
77$20.721,8116%3.9
71.22$4384,725%93.6%
54.22$7172,789%92.%
81.23$6049,687%92.%
81.23$1483,708%93.%
70.$21762,6780%3.9%
02$22.474,7457%3.9
523.2$21074,%54.937%
N WILYIADN WILYAIDN WILYIADRONITI POSPEROT SLERPELBA TREP
4406.1$082.9$47600.$
969.11$8103.1$878.$68
790.$1184.$96392.$61
40.$118891.01$36.$670
825.11$33.99$5770.$6
079.$1010.$91212.68$
60.2$1131.$91598.74$
885.11$88.$99321.$66
640.12$6006.1$856.64$
98.$113754.01$41.$518
7136.$118.$1230960.$6
93.6$149726.1$579.$81
67.8$1100103.$605.$66
N WILYDAIN WILYAIDN WILYDAIRONITI POSPEROT SLERPELBA TREP
64.$911282.$90504.$
30.2$1078.$86676.71$
7084.$78.$75918.47$
998.$820$76.48.611$
09$87.280.$77730.7$
1686.$44.$75001.$54
1685.$66.$72223.59$
2390.$07.$74802.71$
0188.$06.$75036.$60
000.$922$77.28.619$
28.$942178.$36752.$
LYAIDPER SQ FOOT
$4.00
$4.
$4.
4.$
$4.
$4.
$4.
$4.
$4.
$
$
$
$
LYAIDPER SQ FOOT
$5
$5.
$4.
5$
$5.
$4.
$4.
$5.
$
5$
5$
WIN
50
16
43
35
09
21
35
53
28
11
50
46
WIN
. 8
86
86
. 1
00
95
89
14
90
. 1
. 8
TOTALS: $20,105,239 $4,205,295 20.92% 22.62% $15,899,944 79.08% 93.08% 924,300 $21.75 $622.63 $77.45 $90.44 $5.08
Jun-99 $1,504,771 $326,691 21.71% 25.65% $1,178,080 78.29% 93.52% 65,133 $23.10 $604.98 $84.27 $96.57 $4.56
Fiscal Year Ended June 30, 1999
Fiscal Year Ended June 30, 1998

60
Home Dock Communities� Use of Gaming Funds
POSITIVE IMPACT ON RURAL COMMUNITY.
When the Issue of Riverboat Gaming was introduced to thevoters of The City of Caruthersville the realities of the Project were notbased on moral issues but on economic concerns. At the time of theelections for the passage of legalized Riverboat gaming, the Brown ShoeFactory was closing with over 500 people losing their jobs, and theCaruthersville Shipyard was closing with over 400 employment.
The vision of over 400 good paying jobs and of Revenue for TheCity of Caruthersville, and increased Economic Growth, was a drivingforce for the passage of Riverboat Gaming in Caruthersville.
The City of Caruthersville has 7,958 residents making up ap-proximately one-third of the population of Pemiscot County. In 1994 thePemiscot County unemployment rate was 15.6%. As of March 1st, 1998it was down to 8.1%. This clearly shows that more people are workingand providing a better way of life for their families.
The results of this prosperity for Caruthersville are evident whenyou visit the City. With a $3 Million Dollar initial Development Agree-ment with the City to rebuild two major streets with improved drainage,lighting, and street scape design. With an additional $3 Million for thefirst 3 years of operation of Casino Aztar the City used the funds forRecreation, Streets, Public Safety, and Infrastructure Projects within theCity. This does not include $3.3 Million that has been received from StateGaming Fees.
The City has invested this money into:
� Improved City Streets;
� Parks and Recreation Equipment;
� A New Sports Complex, Scholarship Program;
� Improved Water and Wastewater Systems;
� Fire Truck, Police Cars, Sanitation Equipment;
� Construction Equipment;
� Riverfront loan program for building improvements, andmany other projects.
Along with the Casino Operations we have seen new RetailBusiness Growth with more employment. We have had a new Motel builtthat is now allowing our Tourism Tax Fund to grow and that additionalmoney is being used for Billboards, Banners and Brochures to furtherpromote the City of Caruthersville.
The City now has the Funds available to work on IndustrialGrowth. We now have a new Factory moving into the City with asadditional 65 Employees to be hired. We now have additional funds tocontinue to develop our Industrial Park for future Industrial expansion.
It is clearly evident that Casino Gaming has had a significant andpositive impact on The City of Caruthersville, and the working relation-ship between the City and Casino Aztar has been a perfect marriage forthe betterment of Quality of Life for the Citizens of Caruthersville andalso for Pemiscot County.
SOURCE: City of Caruthersville

61
Gaming Fund Capital Improvements 1999-00Roadways
Street Preservation 72,250Traffic Signal Controller Replacement 250,000Boulevard Reconstruction 800,000
Subtotal: 1,122,250
WalkwaysCity Owned Curbs & Sidewalks 100,000Citywide Sidewalks - Non Assessable 700,000Pedestrian Signal Compliance 332,000
Subtotal: 1,132,000
Public BuildingsKansas City Zoo Buildings and Grounds 430,000Municipal Service Center 1,401,330Public Safety Radio Improvements 700,000
Subtotal: 2,531,330
Economic DevelopmentCity Market Improvements 598,670
Drainage and Flood ControlBlue River Flood Control Improvements 3,345,750
Capital Improvements Total: 8,730,000$
Total Gaming Funds Allocated: 18,197,030$
AdoptedDeferred Maintenance and Year 2000 Compliance 1999-00Police Department
Public Safety Radio Improvements 1,600,000
Fire DepartmentFire Apparatus and Equipment Replacement 1,785,000
Convention and Entertainment CentersARC Storage Facility 204,000
Finance DepartmentPayroll System Hardware 170,000
Information Technology DepartmentY2K Compliant Hardware/Software 117,919
Neighborhood and Community ServicesEquipment Purchases 315,000
Parks and Recreation DepartmentY2K Compliant Equipment Improvements 45,300Equipment Replacement 745,500Street Tree Trimming 500,000
Subtotal: 1,290,800
Environmental ManagementSolid Waste Fleet Replacement 500,000
Department of Public WorksTraffic Signals Y2K Upgrade 94,125Equipment and Software Upgrades (Y2K) 57,000Equipment Replacement 2,851,050Street Sweepers Lease Payments 482,136
Subtotal: 3,484,311
Total Deferred Maintenance and Y2K Compliance: 9,467,030$
City of Kansas City, Missouri
SOURCE: City of Kansas City, Missouri

62
Trf to Utilities $85,832 Know Water Main Replacement - Wiedenmann $55,000
Water Sy stem Improv ements Lay ne Western $13,234 Iron/Jasper/Clark - Water Main Replacement $199,158
18th @ Sw ift Parking Lot $16,441 Dagg Park Fence/Lighting $60,622
Fuel Tank Remov al $13,190 Sew er Main Camera $8,545
Demolition Contracts Deco $781,988 Storm Drainage/Erie - Fay ette-26th $555,740
Community Center Design $285,436 Reling San Sw ers 26-28 How ell $938,985
Community Activ ity Center $1,055,048 Street Barn Reroof $195,801
Curb/Sidew alk Installation $14,822 Bedford Station Rebuild $402,364
Replace Sidew alks $21,420 Grocery Store $159,169
Dow ntow n Light/Sidew alk Pav ing $1,906,152 Library Addition $49,167
Iron Street Water Main Replacement $117,801 Fire Station Training Room $16,426
Caboose Park $32,717 Bullet Proof Vests $12,500
Chouteau Double Sided Sign $2,200 Police Garage $19,967
Reserv por Water Main Repair $17,910 Recy cling Equipment $12,456
Bud Keckler/Carol Estes $33,668 Reader Board $2,560
Dow ntow n Beautification $18,656 Emergency Well Head Operation $22,976
26th Street Station Improv ement $103,615 Snake Saturday Parade $49,785
I-35/210 Ramp Signal $1,044 Barbeque/Funfest $6,851
Aerial Ladder Truck $669,226 Festiv al Shelter at Park $100,000
Parking Lot Resurfacing Updike Pav ing Corp. $53,689 Cerner Sidew alk $16,286
SUB-TOTAL $5,244,089 TOTAL $8,128,447
City of Maryland HeightsUse of Gaming Revenues
Earth City Expressway Funding 4,200,000 AnnuallyStreet slab replacement program 1,000,000 AnnuallyPolice department expanded operations 1,000,000 AnnuallyReserve Fund 700,000 AnnuallyFinance department 80,000 AnnuallyPublic Relations Staff 40,000 AnnuallyPlanning Staff 40,000 AnnuallyConvention /Tourism contract 75,000 Annually
Capital Projects Smiley Road Upgrade 950,000 1999Fee Fee Road Widening near Westport 826,100 1999Fee Fee Road Improvement near Midland 1,200,000 1999Edgeworth Roadway Improvements Engineering 130,000 1999Ameling Bridge Replacement 327,000 1999Public Works Facility Acquisition 440,000 1999Eldon/Hathaway Roadway Improvement 225,000 1999Midland Ave Upgrade - Engineering 137,000 1999Millwell Drive Extension 620,000 1999
1999 Total $11,990,100
CITY OF MARYLAND HEIGHTS
CITY OF NORTH KANSAS CITY
SOURCE: City of Maryland Heights
SOURCE: City of North Kansas City
63
Argosy Casino has fulfilled all of the terms of its original agreementwith the City of Riverside including payments of $5,000,000 in advancerent and a $1,000,000 grant for the construction of a city park. Theoriginal agreement also provided for a $600,000 grant for the construc-tion of a nine hole golf course. This portion of the agreement wasmutually terminated and the money was returned to the MissouriGaming Company.The following outlines city projects that have already been completedthrough the use of riverboat gaming funds:� An overall Master Plan for development of the City
� A Master Plan for development of the new city park
� Riverbank stabilization and improvements to Renner-BrennerHistorical Site Park
� $3 million for the construction of a Community Center andswimming pool ,which opened May 30, 1998
� $1 million for the construction of a Public Works MaintenanceBuilding to house the Street Department
� Creation of a Public Works Department
� $1.3 million used to retire outstanding sanitary sewer bonds
� $5.3 million committed to construction of the L-385 floodprotection levee
� $250,000 for purchase of a new fire truck and upgrading existingfire equipment
� $3 million for construction of E.H. Young Riverfront Park to beopen in September 1998
� $3 million committed to major street widening, bridge replace-ment, two intersection replacements and improvement of NWGateway Street
� $3 million in street projects already completed or to be completedin Fall, 1998
� $3 million in street projects to begin June 1998 and to becompleted by May 1999
� $1.5 million committed to building a new post office facility
� $3.5 million committed to the design and construction of a new CityHall facility
� A $150,000 payment from Argosy Casino, along with a $150,000payment from the City of Riverside, to Platte County to retireoutstanding bonds on Platte Purchase Bridge to allow MoDOT toaccept the bridge into their system so that $7 million in deck repairsand painting could be completed which allowed the bridge to remainopen
� $75,000 paid into Compulsive Gamblers Fund
� Contracts have been awarded to three engineering firms to designand complete street projects for the remainder of the city streets inRiverside.
SOURCE: City of Riverside
City of Riverside

64
DESCRIPTION FY 98-99 FY 99-00 DESCRIPTION FY 98-99 FY 99-00Stormwater Projects: Parks:Debt Serv ice - Stormw ater Bonds $847,000 $855,000 Eco-Park Projects $300,000
Miscellaneous Stormw ater Projects $798,000 $455,400 Shafer Park Improv ements $50,000 $30,000
Jet Rodder/Catch Basin Cleaner $95,000 Soccer Fields - Wapelhorst Park $150,000
Engineering $154,000 Land Acquisition $621,000
Street Projects: Tourism:Street Surface Repairs $80,000 Carpet Replacement $35,000
Alley Maintenance $70,000 Goldenrod Mooring Project $480,000
Fox Hill Project $399,000
I-70/Haw ksnest Ov erpass $1,700,000 $300,000 Economic Development/Redevelopment:Pralle Rd. Reconstruction - Eng $150,000 $1,350,000 Economic Dev elopment Fund $338,000 $305,400
Building Maintenance: Arena Project $300,000 $300,000
City Hall Interior & Ex terior Renov ations $30,000 $29,000
Ex terior Facelift - City Hall Building $100,000 Water:Police Department:Personnel Costs $559,500 $373,000 Water Pollution Control:Radio Sy stem Replacement $93,000 Debt Serv ice - Sew er Bonds $700,000 $600,000
Ex pand Police Facility $130,000
TOTAL $11,090,900 $9,158,800
City of St. Charles
SOURCE: City of St. Charles

65
FY95 FY96 FY97 FY98 FY99
Fest ival/Celebrations $15,000 $30,000 $65,000
Public Safety
Police Vest/Radar Training $27,500 $66,013 $25,277 $27,055
Police Cars $550,923 $401,499 $296,558
Downtown Cleanup Program $11,000 $118,930 $91,942
City Hall Renovat ion $9,540
Civic Center Electric/Balustrade Renovation $28,000 $39,029
Parking Lot Repairs $67,000
Downtow n Sidewalks $102,772 $14,513
Riverfront Park $161,191
Recreational Complex $288,500
Francis Street Improvements $302,656 $18,841
Mcarthur Driv e Improvements $48,741 $575,189 $3,763
Projects For Better Neighborhoods $7,500 $39,549 $8,030
Legal Claims $312,500
Professional;Serv ices
Chamber Marketing Programs $2,500 $25,000 $20,000
Vehicles Equipment $6,763 $5,088 $4,619
All American Cities $10,000 $365,700
Community Intervention Program $280,000
Computer Network $28,000
City Employ ee Wellness Program $78,000
Communication Center Computer Upgrade $5,000
Fourth May ors Summit
Totals: $583,191 $1,295,895 $813,648 $1,074,425 $827,522
Infrastructure
City of St. Joseph
SOURCE: City of St. Joseph

66
2% AGR Tax: Allocated to support police patrols, fire marine unit supplies and conduct public safety related capital improvements on the riverfront
Admission Fee: Allocated to the City's Capital Fund. These funds are budgeted eachyear for items such as arterial street paving, bridge repair, rolling stock replacement, public building improvements, etc.
Port Authority Lease (2% of AGR): In addition to gaming taxes, this revenue is in the form of a lease paymentpaid to the Port Authority. These funds are generally appropriated for for furthering housing and economic development efforts of the St. LouisDevelopment Corporation (SLDC).
FY96 FY97 FY98 FY99b FY00bPublic SafetyRiverfront Street Lighting Improvements 0 600,000 300,000 260,000 300,000Riverfront Street Improvements 1,202,777 600,000 325,000 260,000 300,000Police Patrols 631,876 618,692 527,185 497,721 497,721Fire Department Marine Unit Supplies 450 34,033 13,308 25,000 25,000Compulsive Gamblers' Fund 50,000 0 25,000 25,000 25,000
Subtotal 1,885,103 1,852,725 1,190,493 1,067,721 1,147,721Capital ImprovementsCapital Fund Contribution 6,778,000 3,000,000 2,800,000 2,800,000 3,000,000
Subtotal 6,778,000 3,000,000 2,800,000 2,800,000 3,000,000Economic DevelopmentSLDC Economic Development 2,440,487 252,269 140,000 1,200,000 1,200,000SLDC Housing Programs 0 1,000,000 1,000,000 0 0
Subtotal 2,440,487 1,252,269 1,140,000 1,200,000 1,200,000
Total $11,103,590 $6,104,994 $5,130,493 $5,067,721 $5,347,721
Note: FY96 was first year in which revenues from gaming were appropriated andincludes cumulative revenues from FY95.
CITY OF ST. LOUIS
SOURCE: City of St. Louis