mississippi’s conservation reserve program · college of forest resources mississippi state...
TRANSCRIPT

College of Forest ResourcesMississ ippi State Univers i ty
Forest and Wildlife Research Center
Mississippi’s Conservation Reserve ProgramCP33 - Habitat Buffers for Upland Birds
Final Report, 2006–2010
Mississippi Bird Monitoring and Evaluation Plan

Mississippi’s Conservation Reserve Program
Lindsey C. SingletonResearch Associate
Department of Wildlife, Fisheries and AquacultureMississippi State University
Kristine EvansResearch Associate
Department of Wildlife, Fisheries and AquacultureMississippi State University
Wes BurgerAssociate Director
Forest and Wildlife Research CenterMississippi Agricultural and Forestry Experiment Station
Mississippi State University
Rick Hamrick Small Game Program Leader
Mississippi Department of Wildlife, Fisheries, and Parks
Dave GodwinSmall Game and Turkey Programs Coordinator
Mississippi Department of Wildlife, Fisheries, and Parks
CP33 - Habitat Buffers for Upland Birds
Mississippi Bird Monitoring and Evaluation Plan
2006 – 2010 Final Report

Northern bobwhite quail (hereafter, bobwhite) populations have been declining since 1966 as a result of loss of quality habitat. The Northern Bobwhite Conservation Initiative (NBCI), a range-wide, habitat-based restoration plan, was developed by the National Bobwhite Technical Committee (NBTC) in response to bobwhite population status. In 2004 the USDA-Farm Service Agency (FSA) approved a new Conservation Reserve Program (CRP) continuous sign up practice, CP33 – Habitat Buffers for Upland Birds, to help address the habitat goals identified in the NBCI. CP33 is designed to benefit bobwhite and other grassland songbirds by providing idle native herbaceous habitat in agricultural systems. Because CP33 was specifically designed to benefit wildlife, the FSA requested that states containing acreage implement a monitoring program to evaluate bobwhite and grassland bird population response. Members of the NBTC advocated the development of a coordinated large-scale monitoring plan across all states allocated acreage. Subsequently, the “CP33 - Habitat Buffers for Upland Birds Monitoring Protocol” was developed (Burger et al. 2006) and monitoring of bird populations and buffer vegetation community took place from 2006-2008 on a sample of fields in 14 participating states that were allocated the majority of CP33 acreage. Mississippi State University, cooperating with the Mississippi Department of Wildlife, Fisheries, and Parks, Mississippi USDA-FSA, and Mississippi USDA-Natural Resources Conservation Service (NRCS), was responsible for implementing Mississippi’s CP33 monitoring program. Through the program, substantial conservation benefits to bobwhite and other early successional avian species have been observed and recorded. In 2009 the Association of Fish and Wildlife Agencies (AFWA) provided additional financial support for the national CP-33 monitoring program through a multi-state conservation grant of the Sport Fish and Wildlife Restoration Program, extending the program an additional 3 years during contract years 4-6 (2009-2011). The extension of the monitoring program, called “Phase II” requires the continuation of breeding season bird monitoring as well as the additional evaluation of mid-contract management (MCM) activities and the effects of these activities on bird and buffer vegetation communities. Breeding season bird surveys were conducted during June 2006 - 2010, on a sample of 40 paired CP-33 and non-buffered fields. Data analyses were conducted using conventional distance sampling to generate density estimates. We characterized vegetation structure and
community within 10, 1-m2 sampling plots within each CP33 buffer. We also evaluated mid-contract management and other disturbance activities through landowner inquiry and in-field assessments. Avian species richness was greatest at CP33 sites in 2006, 2007, and 2008, and at non-buffered sites in 2009 and 2010. Most species analyzed responded positively to the establishment of CP33 habitat buffers. Bobwhite breeding season densities were on average 950% more abundant on CP33 buffered fields relative to non-buffered fields. Dickcissel were on average 325% more abundant on CP33 sites relative to non-buffered sites. Indigo bunting exhibited high densities in both CP33 and non-buffered sites; however, densities were slightly greater at CP33 buffered sites. Eastern meadowlark densities were slightly greater at CP33 sites in 2006, 2007, and 2010 and lower at CP33 sites in 2008 and 2009 compared to non-buffered fields. Field sparrow densities were slightly greater in CP33 fields in 2006 and significantly greater in 2007 - 2010. Common yellowthroat were more abundant on CP33 buffered fields relative to non-buffered fields, but response varied among years. Yellow-breasted chat densities were slightly greater in 2006 and 2007 but were significantly greater in 2008, 2009, and 2010. Mourning dove densities varied across all five years of sampling exhibiting a slightly greater density on CP33 buffered fields in 2006, a significantly greater density on CP33 fields in 2007 and 2008, and slightly greater densities on non-buffered fields in 2009 and 2010. The vegetation community varied throughout the four years of sampling and among managed and unmanaged buffers. Across all buffers, NWSG and forbs dominated the vegetation community; however some exotics and woody species did persist. By 2010, 75% of all buffers had been affected by mid-contract management activities. These activities included disking, burning, mowing, or a combination. NWSG and forbs did not exhibit greater coverage following management; however, legumes exhibited greater coverage in buffers that had been managed. Exotic grass coverage was consistently greater in unmanaged buffers and woody species coverage was similar between managed and unmanaged buffers. Through the monitoring program, CP33 habitat buffers have been shown to benefit early successional avian species of conservation concern by providing quality early successional habitat in agricultural landscapes. However, these early successional buffers need to be managed to maintain the benefits.
Executive Summary

Introduction .....................................................................................................................................................................................................................................................1
Methods ..............................................................................................................................................................................................................................................................3 Experimental Design...........................................................................................................................................................................................................................3 Breeding Season Counts ...................................................................................................................................................................................................................3 Vegetation Structure and Community ....................................................................................................................................................................................3 Mid-contract Management Activities ......................................................................................................................................................................................4 Data Analysis...........................................................................................................................................................................................................................................4
Results ..................................................................................................................................................................................................................................................................5 Avian Community ...............................................................................................................................................................................................................................5 Vegetation Community ....................................................................................................................................................................................................................5
Discussion ..........................................................................................................................................................................................................................................................7
Acknowledgements ......................................................................................................................................................................................................................................8
Literature Cited ...............................................................................................................................................................................................................................................9
List of Figures
Figure 1. Distribution of Mississippi’s CP33 active enrollment acreage by county, February 2011 (USDA 2011a).. ...............................1
Figure 2. Distribution of CP33 bird monitoring points in Mississippi.. ...........................................................................................................................3
Figure 3. Northern bobwhite breeding season density with 95% confidence intervals on non-buffered and CP33 sites in Mississippi, June 2006-2010 ................................................................................................................................................................................................................... 10
Figure 4. Dickcissel breeding season density with 95% confidence intervals on non-buffered and CP33 sites in Mississippi, June 2006-2010........................................................................................................................................................................................................................................................ 10
Figure 5. Indigo bunting breeding season density with 95% confidence intervals on non-buffered and CP33 sites in Mississippi, June 2006-2010. ............................................................................................................................................................................................................................................ 10
Figure 6. Eastern meadowlark breeding season density with 95% confidence intervals on non-buffered and CP33 sites in Mississippi, June 2006-2010. .................................................................................................................................................................................................................. 10
Figure 7. Field sparrow breeding season density with 95% confidence intervals on non-buffered and CP33 sites in Mississippi, June 2006-2010 ............................................................................................................................................................................................................................................. 11
Figure 8. Common yellowthroat breeding season density with 95% confidence intervals on non-buffered and CP33 sites in Mississippi, June 2006-2010 ................................................................................................................................................................................................................... 11
Table of Contents

Figure 9. Yellow-breasted chat breeding season density with 95% confidence intervals on non-buffered and CP33 sites in Mississippi, June 2006-2010. .................................................................................................................................................................................................................. 11
Figure 10. Mourning dove breeding season density with 95% confidence intervals on non-buffered and CP33 sites in Mississippi, June 2006-2010. .................................................................................................................................................................................................................. 11
Figure 11. Mean percent coverage of native and exotic grass species, forbs, legumes, woody species, litter, and bareground across all CP33 buffers for 2006, 2007, 2008, 2009, and 2010 ............................................................................................................................................. 12
Figure 12. Mean percent coverage of native and exotic grass species, forbs, legumes, woody species, litter, and bareground for unmanaged and managed CP33 buffers in 2006, 2007, 2008, 2009, and 2010.......................................................................................................... 12
Figure 13. CP33 upland habitat buffer located in Clay County, Mississippi during the first growing season (2006). ........................ 13
Figure 14. CP33 upland habitat buffer located in Clay County, Mississippi during the second growing season (2007) .................. 13
Figure 15. CP33 upland habitat buffer located in Clay County, Mississippi during the third growing season (2008)...................... 14
Figure 16. CP33 upland habitat buffer located in Clay County, Mississippi during the fourth growing season (2009) ................... 14
Figure 17. Percent of CP33 buffers sampled that were/were not affected by mid-contract management activities in Mississippi from 2009-2010 (left) and type of management activity implemented across those CP33 buffers managed (right) ....................... 15
List of Tables
Table 1. Density (male birds/acre), 95% confidence intervals (CI), and effect sizes of breeding bird species at non-buffered and CP33 sites in 2006, 2007, 2008, 2009, and 2010. ......................................................................................................................................................................... 16
Table 2. Mean percent coverage of native and exotic grass species, forbs, legumes, and woody species, litter, and bareground for 2006, 2007, 2008, 2009, and 2010 ....................................................................................................................................................................................................... 18
Table 3. Mean percent coverage of native and exotic grass species, forbs, legumes, and woody species, litter, and bareground for managed and unmanaged CP33 buffers in 2006, 2007, 2008, 2009, and 2010.......................................................................................................... 19
AppendicesAppendix A. Cumulative counts of birds (calling males) detected during breeding season counts at control and CP33 sites in 2006, 2007, 2008, 2009, and 2010 ....................................................................................................................................................................................................... 20
Table of Contents
This report was funded by the Multistate Conservation Grant Program (Grant MS M-1-T), a program
supported with funds from the Wildlife and Sport Fish Restoration Program and jointly managed by the
Association of Fish and Wildlife Agencies and the U.S. Fish and Wildlife Service, 2006.

Bird Monitoring and Evaluation Plan 2010 Annual Report1
Northern bobwhite (hereafter bobwhite) populations have declined at an alarming rate throughout their range, exhibiting a 4% annual loss since 1980 (Sauer et al. 2011). This decline has been a result of large-scale loss and degradation of habitat due to changes in land use such as monoculture farming, intensive timber production, reforestation, urbanization, and the elimination of fire. Furthermore, these changes in land use have affected other species of birds. Nearly 50% of grassland and 40% of scrub-successional bird species have also exhibited significant population declines (Sauer et al. 2011).
The National Bobwhite Conservation Initiative (NBCI; Dimmick et al. 2000, NBTC 2011) is a range-wide, habitat-based restoration plan developed by the Southeast Quail Study Group Technical Committee of the Southeastern Association of Fish and Wildlife Agencies (SEAFWA) and revised by the National Bobwhite Technical Committee (NBTC) in 2011. The NBCI is predicated on the assumption that creation of sufficient amounts of early successional, native plant communities in working forest and agricultural landscapes will increase, or at minimum stabilize, declining bobwhite populations. Ultimately, the goal is to produce sustainable populations for quality recreational hunting opportunities. The 2011 NBCI revision identifies spatially explicit opportunities and impediments for habitat and population restoration. Within Mississippi, 5.5-million acres are dedicated to cropland (USDA 2011b), of which 1.3-million acres have been identified as medium-high potential for bobwhite restoration through field and field margin native herbaceous restoration. Farmbill conservation programs provide a vehicle for implementation of habitat-creating conservation practices on private working lands.
In 2004, the USDA-Farm Service Agency (FSA) approved one of the first Conservation Practice targeted to enhance wildlife habitat in agricultural landscapes. The continuous sign up practice, Conservation Practice – 33 (CP33), Habitat Buffer for Upland Birds, was specifically designed to address the conservation needs of bobwhite and other upland bird species. CP33 is designed to benefit bobwhite and other grassland songbirds by providing idle native herbaceous habitat in agricultural landscapes
for nesting, brood-rearing, winter, and foraging habitat. The CP33 practice provides a significant opportunity to establish quality habitat in agricultural systems while providing economic incentives to producers for conservation.
CP33 requires the establishment and maintenance of 30- to 120-foot native, herbaceous buffers along crop field margins for a contract period of 10 years. Cropland intended for CP33 must meet all standard CRP cropping history and eligibility criteria and must be “suitably located and adaptable to the establishment of wildlife habitat for quail and other upland bird species” (USDA 2004). Buffers may be planted using an adapted native warm-season grass (NWSG), forb, and legume mix or established through
Figure 1. Distribution of Mississippi’s CP33 active enrollment acreage by county, February 2011 (USDA 2011a).
Introduction

2Bird Monitoring and Evaluation Plan 2010 Annual Report
natural regeneration. A small shrub/tree component (≤10% of buffer area) is allowed and recommended. Mid-contract management (MCM) is required on a rotational basis to maintain the seral stage needed to meet bobwhite life history requirements. Vegetation must be disturbed through light disking, prescribed burning, selective herbicide, or other prescribed methods as approved to set back natural succession, minimize woody encroachment, and expose food seeds (USDA 2004).
In 2004, the FSA allocated 250,000 acres among 35 states within the bobwhite range (USDA 2004). In 2010, the FSA increased the national acreage cap to 350,000 acres (USDA 2010) due to the demand for and success of the CP33 practice. However, CP33 acreage allocation for Mississippi and several other states was reduced. Mississippi’s CP33 acreage allocation was reduced from 9,400 acres to 3,400 acres in 2010. Currently, 2,230.9 acres are enrolled in 22 counties (Figure 1; USDA 2011a). Because CP33 was specifically designed to benefit bobwhite, the FSA mandated that states allocated CP33 acreage implement a monitoring program to evaluate bobwhite and grassland bird population response to CP33 buffers (USDA 2004). Members of the NBTC saw the unique opportunity to evaluate programmatic effects of a CRP practice across the bobwhite range and advocated for the development of a coordinated monitoring plan across state boundaries. Subsequently, the National CP33 Monitoring Program was developed and implemented using the “CP33-Habitat Buffers for Upland Birds Monitoring Protocol” (Burger
et al. 2006). Monitoring of bird populations and buffer vegetation communities took place during 2006 – 2008 on a sample of fields in 14 participating states that were allocated the majority of CP33 acreage. Mississippi State University, cooperating with the Mississippi Department of Wildlife, Fisheries, and Parks, Mississippi USDA-FSA, and Mississippi USDA-Natural Resources Conservation Service (NRCS), was responsible for implementing Mississippi’s CP33 monitoring program. Through the program, substantial conservation benefits to bobwhite and other early successional avian species have been documented.
In 2009 the Association of Fish and Wildlife Agencies (AFWA) provided additional financial support for the national CP33 monitoring program through a multi-state conservation grant of the Sport Fish and Wildlife Restoration Program, extending the program an additional 3 years during contract years 4-6 (2009-2011). The extension of the monitoring program, called “Phase II” requires the continuation of breeding season bird monitoring as well as the additional evaluation of MCM activities and the effects of these activities on the avian and vegetation communities. The objectives of the Phase II, 3-year monitoring program include: (1) satisfying the FSA’s required wildlife monitoring component of CP33; and (2) evaluating the programmatic effects of CP33 and MCM activities on bobwhite and grassland bird populations in Mississippi.
Introduction
CP33 is designed to benefit bobwhite and other grassland songbirds by providing idle native herbaceous habitat in agricultural landscapes…

Bird Monitoring and Evaluation Plan 2010 Annual Report3
Experimental Design A random sample (n = 50) of Mississippi’s CP33
contracts was selected from the FSA CRP contract database. From these contracts, 40 CP33 fields were randomly selected in 9 counties within the state (Calhoun, Chickasaw, Clay, Coahoma, Itawamba, Monroe, Newton, Prentiss, and Union counties; Figure 2) for avian and vegetation sampling. A similarly cropped, non-buffered field (control) located >1 km and <3 km from each CP33 field (treatment), was also surveyed for comparison. All fields were sampled from 2006 – 2010 during the breeding season to determine field-level effects of CP33 implementation on bird populations.
Breeding Season Counts The NBTC in cooperation with Partners in Flight
developed a list of obligate or facultative grassland priority bird species of conservation concern to be included in the monitoring program. These species included bobwhite, dickcissel, eastern kingbird, eastern meadowlark, and indigo bunting. In addition to priority species, the presence and abundance of all species observed was documented. We conducted breeding season surveys according to the “CP33 – Habitat Buffers for Upland Birds Monitoring Protocol” (Burger et al. 2006) and “CP33 – Habitat Buffers for Upland Birds Monitoring Protocol Phase II: Evaluating Mid-contract Management” (Burger et al. 2009) during June, 2006 – 2010. 10-minute point count surveys were conducted during peak calling activity between sunrise and three hours post-sunrise. Distance sampling techniques were used to generate detection probabilities and more accurate population density estimates. Uniquely identifiable calling or observed male birds were recorded once at their initial observed/perceived location by species, distance band (0 - 25 m, 25 - 50 m, 50 - 100 m, 100 - 250 m, 250 - 500 m, and >500 m), and time interval (1 - 3 minutes, 4 - 5 minutes, and 6 - 10 minutes). Surveys were not conducted in instances of high wind (>6.5km/hr), >75% cloud cover, or precipitation. Paired CP33 buffered and non-buffered survey points were surveyed simultaneously by separate observers to ensure similar weather conditions, and
observers alternated between CP33 and non-buffered points between visits within a single season. Two replicate surveys were conducted during 2006 - 2008 and three replicate surveys were conducted during 2009 - 2010.
Vegetation Structure and Community We characterized vegetation structure and community
within 10, 1-m2 sampling plots using a Daubenmire-type sampling frame within each CP33 buffer in which avian call counts were conducted (Daubenmire 1959). We sampled vegetation within these plots during all 5 years of avian
Methods
Figure 2. Distribution of CP33 bird monitoring points in Mississippi.
4Bird Monitoring and Evaluation Plan 2010 Annual Report
community monitoring to document changes over time. Within each plot, we recorded percent coverage of native and exotic grass species, forbs, legumes, woody species, litter, and bare ground to evaluate native warm-season grass/forb/legume establishment and quantify habitat composition and structure. Buffer width was also recorded at each transect point. Other metrics were recorded to evaluate the overall status and establishment of each buffer. These metrics included percent of entire buffer in native, exotic, and woody cover, and percent and description of non-approved activities.
Mid-contract Management Activities MCM activities are important when monitoring a
changing vegetation community over time and to evaluate bird response in relation to these management activities. Through landowner inquiry and in-field assessments, we estimated percent of buffer managed and determined type of management performed. During the in-field assessment, management was also delineated on an aerial photograph to more accurately calculate area metrics by year and MCM type.
Data AnalysisWe analyzed call count data for all priority bird
species, excluding eastern kingbird, using conventional distance sampling or multiple-covariate distance sampling engines in program DISTANCE (Thomas et al. 2010) to generate estimates of density (breeding season males/acre) on CP33 and non-buffered fields in Mississippi in 2006, 2007, 2008, 2009, and 2010. The eastern kingbird exhibited an inadequate number of detections to obtain accurate density estimates. However several other non-priority species were encountered in sufficient numbers to calculate density and were included in the analysis. These
species included the common yellowthroat, field sparrow, mourning dove, and yellow-breasted chat.
Because vegetation structure of field borders could potentially influence detection probability, we compared pooled global detection functions with detection functions stratified by treatment (CP33 vs. non-buffered fields). We truncated species-level data at distances where detection probability was less than 0.1. We used model selection via Akaike’s Information Criteria to evaluate and compare the fit of 3 key-function models (uniform, half-normal, and hazard rate) for both global and stratified detection functions with and without the addition of covariates (Bird Conservation Region, year, county, observer, time of survey, and weather variables) and adjustment terms (simple polynomial, hermite polynomial, and cosine). Species-specific density estimates (D) were compared using simple effect sizes (DCP33 – Dnon-buffered) and relative effect sizes (((DCP33 – Dnon-buffered)/ Dnon-buffered)×100). 95% confidence intervals were calculated for each density estimate and significance of difference between CP33 and non-buffered estimates was determined by the intersection or lack thereof of these confidence intervals. Breeding season estimates reported in this summary may differ from those reported in previous annual reports because the additional data from the 2010 breeding season counts allowed for the application of more robust models and the acquisition of more precise estimates.
For vegetation data analysis we estimated mean percent cover of native and exotic grass species, forb, legume, woody, litter, and bare ground for 2006, 2007, 2008, 2009, and 2010. We also estimated percent of buffers and percent of each individual buffer affected by MCM and non-compliance activities along with assessing type of management performed.
Methods
Bird Monitoring and Evaluation Plan 2010 Annual Report5
Avian Community Species richness was greater at CP33 sites in 2006, 2007,
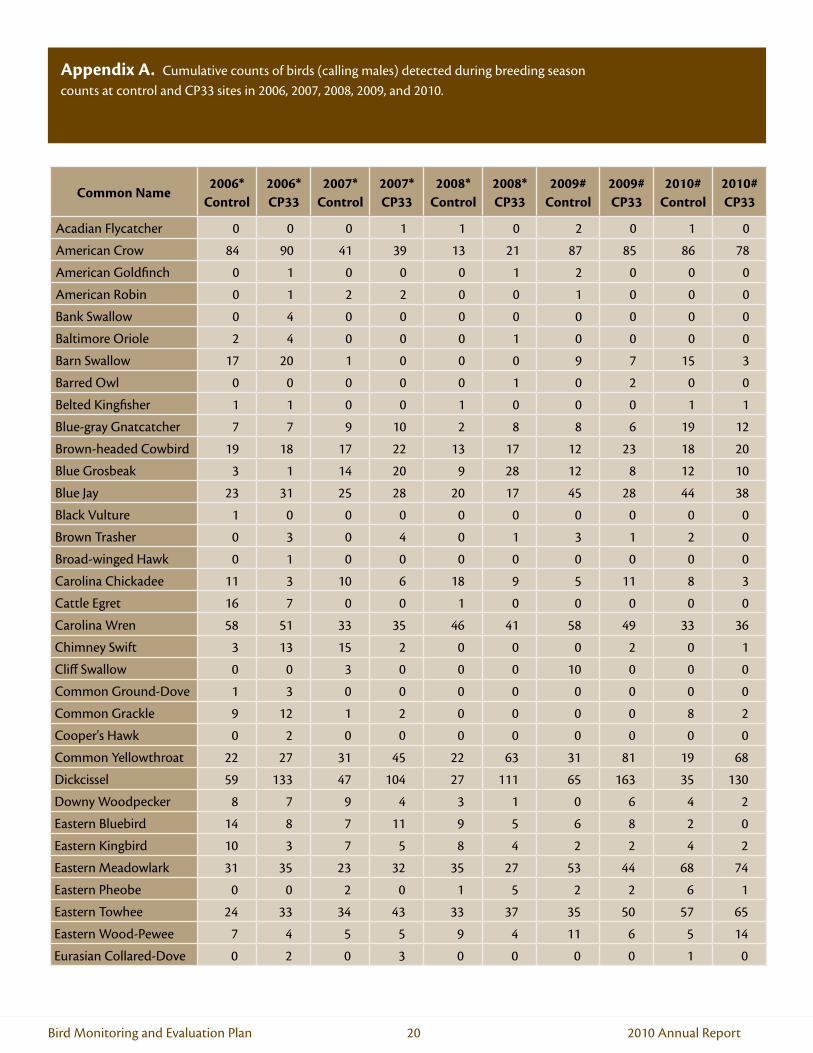
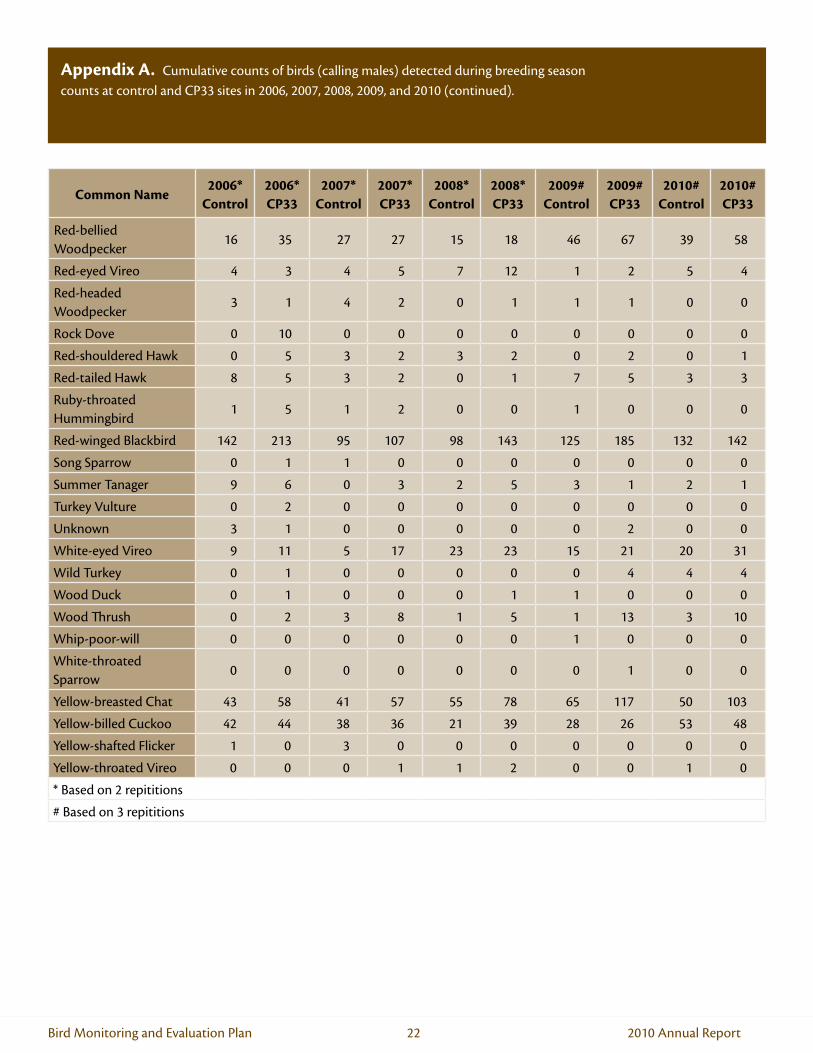
and 2008, but was greater at non-buffered sites in 2009 and 2010. Across the 2006 - 2010 breeding seasons, we observed 77 total species at non-buffered sites and 82 total species at CP33 sites. We observed 52 and 67 different species at non-buffered and CP33 sites, respectively, during the 2006 breeding season; 50 and 54 different species at non-buffered and CP33 sites, respectively, during the 2007 breeding season; 50 and 55 different species at non-buffered and CP33 sites, respectively, during the 2008 breeding season; 52 and 47 different species at non-buffered and CP33 sites, respectively, during the 2009 breeding season; and 53 and 45 different species at non-buffered and CP33 sites, respectively, during the 2010 breeding season. Appendix A summarizes the relative abundance of breeding bird species detected between non-buffered and CP33 sites throughout the 5 years of sampling.
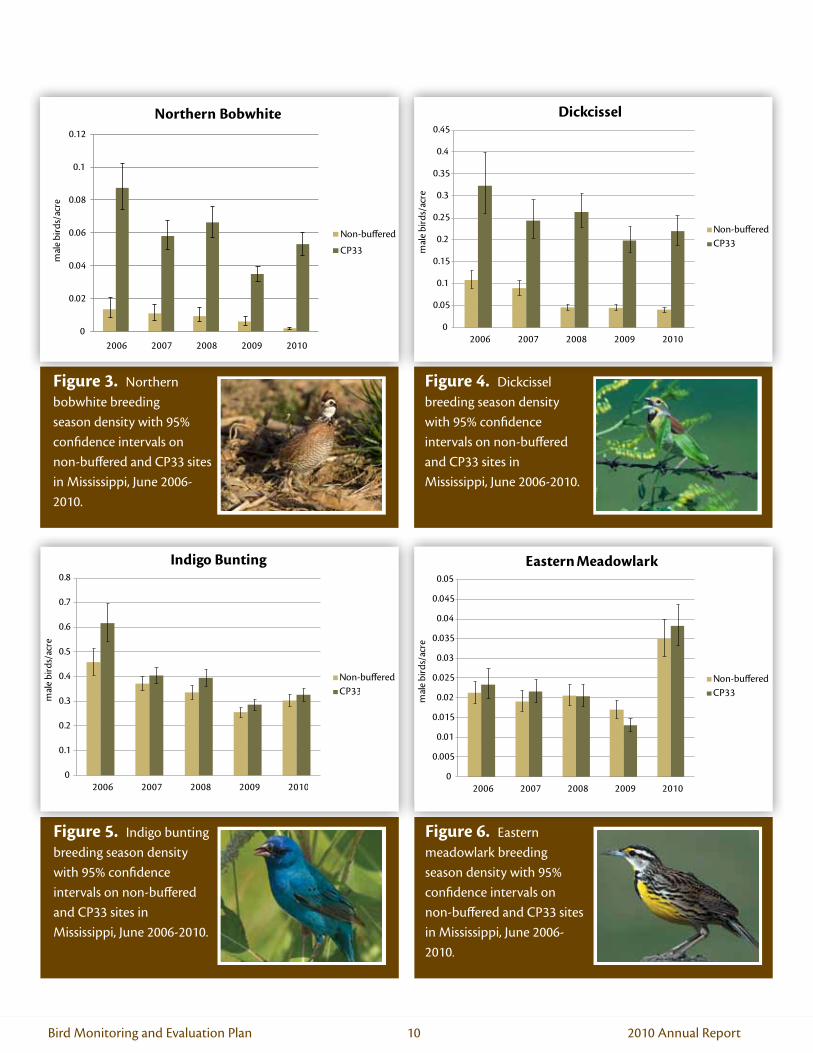
Most priority avian species exhibited higher densities around CP33-buffered fields relative to non-buffered fields (all densities are referenced in Table 1). Bobwhite exhibited significantly greater densities around CP33-buffered fields relative to non-buffered fields with an effect size ranging from 0.03 male birds/acre in 2009 to 0.07 male birds/acre in 2006 (Figure 3). They were on average 950% more abundant on CP33 buffered fields relative to non-buffered fields and exhibited a 2,700% greater density on CP33 sites in 2010. Dickcissel also seemed to benefit from the establishment of CP33 buffers. Dickcissel exhibited significantly greater densities on CP33-buffered fields relative to non-buffered fields with an effect size ranging 0.15 male birds/acre in 2007 and 2009 to 0.22 male birds/acre in 2006 and 2008 (Figure 4). They were on average 325% more abundant on CP33 sites relative to non-buffered sites. Indigo bunting exhibited high densities in both CP33 and non-buffered sites; however, densities were slightly greater at CP33 sites (Figure 5). Relative effect size ranged from an 8% greater density in 2010 to a 35% greater density in 2006. Eastern meadowlark density was only slightly greater at CP33 sites in 2006, 2007, and 2010, with relative affect sizes of 10%, 13%, and 9%, respectively. Eastern meadowlarks exhibited lower densities on CP33-buffered fields in 2008 and 2009 compared to non-buffered fields with relative effect sizes of -0.7% and -23%, respectively (Figure 6).
Most non-priority species analyzed exhibited greater densities in landscapes containing CP33-buffered fields. Field sparrow density was slightly greater in CP33 fields in 2006 and significantly greater in 2007, 2008, 2009, and 2010 (Figure 7). Effect size ranged from 0.01 male birds/acre in 2006 to 0.02 male birds/acre in 2008. Field sparrow densities were 21%, 43%, 391%, 102%, and 138% greater on CP33-buffered fields relative to non-buffered fields in 2006, 2007, 2008, 2009, and 2010, respectively. Common yellowthroat densities were slightly greater on CP33-buffered fields in 2006 and 2007, but were significantly greater on CP33 fields in 2008, 2009, and 2010 (Figure 8). Relative effect size was 30% in 2006, 7% in 2007, 227% in 2008, 160% in 2009, and 261% in 2010. Yellow-breasted chat densities were slightly greater in 2006 and 2007, but were significantly greater in 2008, 2009, and 2010 with an average effect size of 0.047 male birds/acre (Figure 9). Yellow-breasted chat densities were 61%, 65%, 79%, 145%, and 214% greater on CP33-buffered fields relative to non-buffered fields in 2006, 2007, 2008, 2009, and 2010, respectively. Mourning dove densities varied across all five years of sampling (Figure 10). They exhibited a slightly greater density on CP33-buffered fields in 2006 (26% greater density), a significantly greater density on CP33 fields in 2007 and 2008 (74% and 55% greater densities, respectively) and slightly greater densities on non-buffered fields in 2009 and 2010 (-27% and -23% greater densities, respectively).
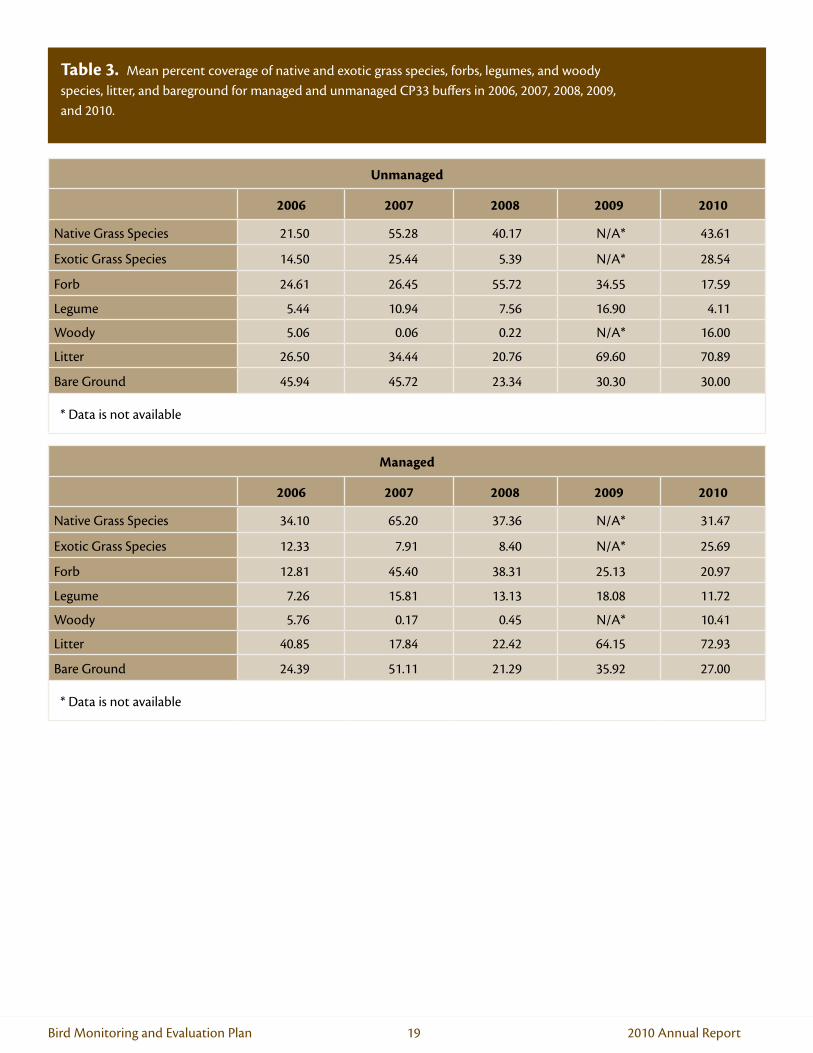
Vegetation community The vegetation community varied throughout the five
years of sampling and among managed and unmanaged buffers (results are reported in Tables 2 and 3 and illustrated in Figures 11 and 12). Across all buffers, NWSG and forbs dominated the vegetation community. NWSG coverage peaked in 2007 at an average 63% and averaged 41% across all five years (NWSG estimate was not available for 2009). Forb coverage peaked in 2008 at an average 42% and averaged 30% across all five years of sampling. Percent coverage of legumes and woody species were consistent across all five years of sampling exhibiting an average coverage of 12% and 4%, respectively. Exotic grass species peaked in 2010 at 26% coverage and averaged 15% coverage across all five years of sampling. Bare ground coverage was also consistent
Results

6Bird Monitoring and Evaluation Plan 2010 Annual Report
throughout the five years of sampling averaging 33%. Litter averaged 27% coverage from 2006 - 2008 and peaked in 2009 and 2010 at 65% and 73%, respectively. Figures 13, 14, 15, and 16 illustrate the changes in vegetation following the first 4 growing seasons prior to management.
CP33 contracts were initiated in 2005, therefore mid-contract management activities could have been implemented as early as Fall 2007/Spring 2008. By 2009, 45% of the CP33 buffers in our sample were managed and by 2010, 75% of all buffers in our sample were managed. Of these managed buffers, an average 86% of each was affected by different MCM activities (Figure 17). MCM activities included disking, burning, disking/burning, and mowing (mowing, except in preparation for disking is not an approved MCM activity). Excluding mowing activities, an average 63% of all buffers were managed and an average 88% of each buffer managed was affected by MCM activities by Spring 2010.
NWSG and forbs did not exhibit greater coverage following management; however, legumes exhibited greater coverage in buffers that had been managed. NWSGs exhibited an average 40% and 42% coverage across all five years of
sampling in unmanaged and managed buffers, respectively. Forbs exhibited an average 32% and 29% coverage across all five years of sampling in unmanaged and managed buffers, respectively. Legumes exhibited an average 9% and 13% coverage across all five years of sampling in unmanaged and managed buffers, respectively. Coverage of exotic grass species was consistently greater in unmanaged buffers with an average of 19% and 14% coverage across all five years of sampling in unmanaged and managed buffers, respectively. Woody species coverage was very similar between managed and unmanaged buffers each year. Coverage was minimal in 2006 - 2009, but peaked in 2010 at 16% and 10% in unmanaged and managed buffers, respectively. Litter and bare ground coverage varied greatly among years and between managed and unmanaged buffers.
Results

Bird Monitoring and Evaluation Plan 2010 Annual Report7
Discussion
Through the CP33 monitoring program, CP33 has been shown to provide early successional habitat beneficial to many grassland and scrub-successional bird species in agricultural landscapes. Bobwhites have exhibited significantly greater population densities in landscapes where CP33 buffers have been established. In 2010, typical agricultural landscapes with little native herbaceous cover supported an average breeding season male bobwhite density of 1 bobwhite/526 acres, whereas landscapes containing CP33 buffers supported an average male bobwhite density of 1 bobwhite/19 acres. Furthermore, CP33 fields supported an average fall density of 1 covey/52 acres or 1 bobwhite/4 acres assuming an average covey size of 12 birds (Singleton 2009). Because the CP33 was designed to address the conservation needs of bobwhite, the question remains whether observed effect sizes contribute to meeting the population recovery goals of the NBCI, specifically the Mississippi NBCI step-down plan. The Mississippi NBCI step-down plan identified the goal of restoring fall bobwhite densities on acreage deemed suitable for bobwhite habitat to 1 bobwhite/2.9 acres. The plan also identified short-term goals that may be more realistically achievable over a period of 5 to 10 years. This short-term goal is to restore fall bobwhite densities on acreage deemed suitable for bobwhite habitat to 1 bobwhite/5.7 acres. Landscapes containing CP33 buffers supported fall bobwhite densities that surpassed the Mississippi NBCI short-term goals. This demonstrates that the MS NBCI short-term goals are achievable with a single conservation practice and further exemplifies the value of CP33 habitat buffers. With strategic habitat conservation, the strategic implementation of CP33 in conjunction with other conservation management practices, landscapes containing CP33 upland habitat buffers have the potential to support bobwhite densities that surpass the long-term goals.
Many other early successional/scrub successional species have also benefited from CP33 buffer establishment. Some of these species are suffering similar population trajectories as bobwhite. Species such as dickcissel, field sparrow, common yellowthroat, and yellow-breasted chat have exhibited significantly greater population densities in landscapes where CP33 buffers have been
established. Field sparrow populations have declined >50% throughout the Southeastern Coastal Plain region and is a species of regional conservation concern according to Partner’s In Flight species assessment database (PIF 2011). Common yellowthroat populations have declined 15 - 49% throughout the region and dickcissel is a species of continental conservation concern (PIF 2011). CP33 buffers are valuable in that they provide a regionally scarce habitat in an otherwise common landscape.
The National CP33 Monitoring Program presented a unique opportunity to monitor response to CP33 buffers across multiple years allowing for the evaluation of bird response following buffer succession and management. Differences in densities from typical agricultural landscapes to those containing CP33 buffers in 2006 - 2010 illustrate that positive effects of buffers are sustained for bobwhite and some grassland/scrub successional bird species up to 5 years following establishment. Response will continue to be monitored through the 6th year following establishment.
Not all species exhibited significantly greater densities on CP33-buffered fields (e.g., indigo bunting). Some exhibited variable densities across years (e.g., mourning dove) and some exhibited negligible responses (e.g., eastern meadowlark). This suggests there are clear differences in habitat needs across the grassland and scrub-successional bird “guilds”. Different species of birds within similar guilds may have variable needs for vegetation composition and structure and habitat patch size. Therefore, implementing a single management strategy or conservation practice may not be the ultimate solution for all species. This also illustrates the importance of strategic habitat conservation and implementing a suite of conservation programs and practices creating a mosaic of habitat types across the landscape.
Through natural successional processes, herbaceous communities tend towards woody and hardwood dominated stands. Periodic disturbance is required to maintain buffers in herbaceous cover. Therefore, through Notice-479, the FSA required the periodic maintenance of CP33 buffers through disking and/or prescribed fire. Phase II of the program continued to focus on monitoring breeding bird populations along

8Bird Monitoring and Evaluation Plan 2010 Annual Report
with evaluating mid-contract management effects on the avian and vegetation communities. By 2009, 45% of the CP33 buffers participating in the monitoring program were managed, and by 2010, 75% of the CP33 buffers had been managed. Disking and prescribed fire were common practices implemented; however, mowing, a non-approved activity, did occur on a small percentage of buffers. Differences in the vegetation communities between managed and unmanaged buffers were observed, and effects of management produced interesting and variable affects. As expected legume coverage increased, and exotic grass coverage decreased following management; however, native grass and forb coverage did not increase. Also unexpectedly, woody species and litter coverage did not decrease and bare ground did not increase following management. CP33 buffers were still dominated with native grasses and forbs, and this was reflected
in the response of the bird community. Mid-contract management activities and effects will continue to be monitored during the 2011 growing season.
Through the monitoring program, CP33 habitat buffers have been shown to benefit early successional avian species, many of which are of conservation concern. Mississippi’s short-term bobwhite population restoration goals are achievable through this single conservation program. However, since the program’s initiation on October 4, 2004, only 2,230.9 acres of the 3,400 acres allotted to Mississippi have been enrolled throughout 22 counties. Given the demonstrable economic and environmental benefits of CP33, the remaining 1,200 acres of available CP33 in Mississippi present an opportunity for bobwhite and grassland songbird population restoration not yet realized. The primary challenges with CP33 seemingly relate to program delivery, not practice efficacy.
Discussion
Acknowledgements
Our sincere thanks go to all of the cooperators who graciously allowed us access to their property in order to conduct this research. Thanks go to the numerous personnel in the USDA-Farm Service Agency and USDA-Natural Resource Conservation Service Agency county offices who assisted with logistical support. We appreciate the efforts of numerous technicians and agency personnel in carrying out the breeding season and fall surveys. Without their hard work, this research could not have been successful. Funding for the Mississippi CP33 monitoring program was provided by grants from the Mississippi Department of Wildlife, Fisheries, and Parks, and the Association of Fish and Wildlife Agencies Sport Fish and Wildlife Restoration Program.

Bird Monitoring and Evaluation Plan 2010 Annual Report9
Literature Cited
Burger, L. W., M. D. Smith, R. Hamrick, B. Palmer, and S. Wellendorf. 2006. CP33 – habitat buffers for upland birds monitoring protocol. Southeast Quail Study Group and Southeast Partners in Flight miscellaneous publication.
Burger, L. W., S. K. Riffell, K. O. Evans. 2009. CP33 – habitat buffers for upland birds monitoring protocol, phase II: evaluating mid-contract management. Mississippi State University miscellaneous publication.
Daubenmire R. 1959. A canopy-coverage method of vegetational analysis. Northwest Science 33:43-64.
Dimmick, R. W., M. J. Gudlin, and D. F. McKenzie. 2002. The northern bobwhite conservation initiative. Miscellaneous publication of the Southeastern Association of Fish and Wildlife Agencies, South Carolina. 96pp.
[NBTC] The National Bobwhite Technical Committee. 2011. Palmer, W.E., T.M. Terhune, and D.F. McKenzie (eds). The National Bobwhite Conservation Initiative: A range-wide plan for recovering bobwhites. National Bobwhite Technical Committee Technical Publication, ver. 2.0, Knoxville, TN.
[PIF] Partners In Flight. 2011. Species assessment database bird conservation region 27. PIF home page. <http://www.partnersinflight.org>. Accessed 27 April 2011.
Sauer, J. R., J. E. Hines, and J. E. Fallon, K. L. Pardieck, D. J. Ziolkowski, Jr., and W. A. Link. 2011. The North American Breeding Bird Survey, Results and Analysis 1966-2009. Version 3.23.2011. USGS Patuxent Wildlife Research Center, Laurel, MD.
Singleton, L.C., K. Evans, W. Burger, R. Hamrick, and D. Godwin. 2009. Mississippi’s Conservation Reserve Program – CP33-Habitat Buffers for Upland Birds 2006-2009 Annual Report. Miscellaneous Publication, Mississippi State University. Annual Report.
Thomas, L., S. T. Buckland, E. A. Rexstad, J. L. Laake, S. Strindberg, S. L. Hedley, J. R. B. Bishop, T. A. Marques, and K. P. Burnham. 2010. Distance software: design and analysis of distance sampling surveys for estimating population size. Journal of Applied Ecology 47:5-14.
[USDA] USDA Farm Service Agency. 2004. Practice CP33 habitat buffers for upland wildlife. Farm Service Agency, Notice CRP-479, Washington, D.C., USA.
[USDA] USDA Farm Service Agency. 2010. FY 2010 Acreage Allocations for CP33, CP37, and CP38. Farm Service Agency, Notice CRP-654, Washington, D.C., USA.
[USDA] USDA Farm Service Agency. 2011a. Summary of active contracts by program year by state: CRP-monthly contracts report, March 2011. <https://arcticocean.sc.egov.usda.gov/CRPReport/monthly_report.do?method=selectState&report=ActiveContractsSummaryByProgramYearNational&report_month=March-2011>. Accessed 3 March 2011.
[USDA] USDA National Agricultural Statistics Service. 2011b. 2007 Census of Agriculture: Quick Stats, Mississippi. <http://quickstats.nass.usda.gov/results/AD8488F5-DAE1-3CAF-A585-83C142CCB89F>. Accessed 28 April 2011.
10Bird Monitoring and Evaluation Plan 2010 Annual Report
0
0.02
0.04
0.06
0.08
0.1
0.12
2006 2007 2008 2009 2010
mal
e bi
rds/
acre
Northern Bobwhite
Non-buffered
CP33
Figure 4. Dickcissel breeding season density with 95% confidence intervals on non-buffered and CP33 sites in Mississippi, June 2006-2010.
Figure 3. Northern bobwhite breeding season density with 95% confidence intervals on non-buffered and CP33 sites in Mississippi, June 2006-2010.
0
0.05
0.1
0.15
0.2
0.25
0.3
0.35
0.4
0.45
2006 2007 2008 2009 2010
mal
e bi
rds/
acre
Dickcissel
Non-bufferedCP33
0
0.1
0.2
0.3
0.4
0.5
0.6
0.7
0.8
2006 2007 2008 2009 2010
mal
e bi
rds/
acre
Indigo Bunting
Non-bufferedCP33
0
0.005
0.01
0.015
0.02
0.025
0.03
0.035
0.04
0.045
0.05
2006 2007 2008 2009 2010
mal
e bi
rds/
acre
Eastern Meadowlark
Non-bufferedCP33
Figure 6. Eastern meadowlark breeding season density with 95% confidence intervals on non-buffered and CP33 sites in Mississippi, June 2006-2010.
Figure 5. Indigo bunting breeding season density with 95% confidence intervals on non-buffered and CP33 sites in Mississippi, June 2006-2010.

Bird Monitoring and Evaluation Plan 2010 Annual Report11
0
0.005
0.01
0.015
0.02
0.025
0.03
0.035
0.04
0.045
2006 2007 2008 2009 2010
mal
e bi
rds/
acre
Field Sparrow
Non-bufferedCP33
0
0.02
0.04
0.06
0.08
0.1
0.12
0.14
0.16
2006 2007 2008 2009 2010
mal
e bi
rds/
acre
Common Yellowthroat
Non-bufferedCP33
0
0.02
0.04
0.06
0.08
0.1
0.12
0.14
0.16
0.18
0.2
2006 2007 2008 2009 2010
mal
e bi
rds/
acre
Yellow-Breasted Chat
Non-bufferedCP33
0
0.02
0.04
0.06
0.08
0.1
0.12
0.14
0.16
2006 2007 2008 2009 2010
mal
e bi
rds/
acre
Mourning Dove
Non-bufferedCP33
Figure 7. Field sparrow breeding season density with 95% confidence intervals on non-buffered and CP33 sites in Mississippi, June 2006-2010.
Figure 8. Common yellowthroat breeding season density with 95% confidence intervals on non-buffered and CP33 sites in Mississippi, June 2006-2010.
Figure 9. Yellow-breasted chat breeding season density with 95% confidence intervals on non-buffered and CP33 sites in Mississippi, June 2006-2010.
Figure 10. Mourning dove breeding season density with 95% confidence intervals on non-buffered and CP33 sites in Mississippi, June 2006-2010.

12Bird Monitoring and Evaluation Plan 2010 Annual Report
Figure 11. Mean percent coverage of native and exotic grass species, forbs, legumes, woody species, litter, and bareground across all CP33 buffers for 2006, 2007, 2008, 2009, and 2010.
0
10
20
30
40
50
60
70
80
NWSG Forbs Legumes Exotics Woody Litter Bare
Ground
Perc
ent
Buffer Vegetation Community
2006
2007
2008
2009
2010
Bare Ground
LitterWoodyExoticsLegumesForbs
Managed
NWSGBare Ground
LitterWoodyExoticsLegumesForbs
Unmanaged
NWSG0
10
20
30
40
50
60
70
80
Perc
ent
Buffer Vegetation Community for Unmanaged and Managed CP33 Buffers
2006
2007
2008
2009
2010
Figure 12. Mean percent coverage of native and exotic grass species, forbs, legumes, woody species, litter, and bareground for unmanaged and managed CP33 buffers in 2006, 2007, 2008, 2009, and 2010.

Bird Monitoring and Evaluation Plan 2010 Annual Report13
Figure 14. CP33 upland habitat buffer located in Clay County, Mississippi during the second growing season (2007).
Figure 13. CP33 upland habitat buffer located in Clay County, Mississippi during the first growing season (2006).

14Bird Monitoring and Evaluation Plan 2010 Annual Report
Figure 15. CP33 upland habitat buffer located in Clay County, Mississippi during the third growing season (2008).
Figure 16. CP33 upland habitat buffer located in Clay County, Mississippi during the fourth growing season (2009).

Bird Monitoring and Evaluation Plan 2010 Annual Report15
Figure 17. Percent of CP33 buffers sampled that were/were not affected by mid-contract management activities in Mississippi from 2009-2010 (left) and type of management activity implemented across those CP33 buffers managed (right).
Managed 75%
Unmanaged25%
MCM Assessment
Disked30%
Burned36%
Disked & Burned
17%
Mowed17%

16Bird Monitoring and Evaluation Plan 2010 Annual Report
2006
Non-Buffered CP33
Species Density CI Density CI Effect Size
Northern Bobwhite 0.0136 (0.0088, 0.0210) 0.0874 (0.0746, 0.1023) 0.0738
Dickcissel 0.1082 (0.0896, 0.1306) 0.3229 (0.2609, 0.3996) 0.2147
Indigo Bunting 0.4580 (0.4073, 0.5149) 0.6161 (0.5437, 0.6980) 0.1581
Eastern Meadowlark 0.0213 (0.0186, 0.0243) 0.0234 (0.0200, 0.0275) 0.0022
Common Yellowthroat 0.0365 (0.0323, 0.0412) 0.0474 (0.0419, 0.0537) 0.0109
Field Sparrow 0.0279 (0.0228, 0.0342) 0.0338 (0.0276, 0.0414) 0.0059
Mourning Dove 0.0941 (0.0724, 0.1224) 0.1184 (0.1013, 0.1384) 0.0243
Yellow-breasted Chat 0.0598 (0.0487, 0.0734) 0.0964 (0.0682, 0.1362) 0.0366
Table 1. Density (male birds/acre), 95% confidence intervals (CI), and effect sizes of breeding bird species at non-buffered and CP33 sites in 2006, 2007, 2008, 2009, and 2010.
2007
Non-Buffered CP33
Species Density CI Density CI Effect Size
Northern Bobwhite 0.0109 (0.0070, 0.0169) 0.0583 (0.0503, 0.0674) 0.0474
Dickcissel 0.0894 (0.0743, 0.1075) 0.2428 (0.2017, 0.2924) 0.1534
Indigo Bunting 0.3724 (0.3449, 0.4021) 0.4046 (0.3716, 0.4406) 0.0322
Eastern Meadowlark 0.0191 (0.0167, 0.0219) 0.0216 (0.0190, 0.0247) 0.0025
Common Yellowthroat 0.0629 (0.0556, 0.0711) 0.0672 (0.0599, 0.0754) 0.0043
Field Sparrow 0.0185 (0.0159, 0.0215) 0.0264 (0.0231, 0.0302) 0.0079
Mourning Dove 0.0621 (0.0485, 0.0797) 0.1081 (0.0927, 0.1261) 0.0460
Yellow-breasted Chat 0.0503 (0.0418, 0.0605) 0.0831 (0.0595, 0.1162) 0.0329

2008
Non-Buffered CP33
Species Density CI Density CI Effect Size
Northern Bobwhite 0.0096 (0.0062, 0.0148) 0.0663 (0.0575, 0.0765) 0.0567
Dickcissel 0.0461 (0.0395, 0.0539) 0.2635 (0.2272, 0.3056) 0.2174
Indigo Bunting 0.3365 (0.3088, 0.3666) 0.3944 (0.3625, 0.4292) 0.0579
Eastern Meadowlark 0.0206 (0.0180, 0.0235) 0.0205 (0.0178, 0.0235) -0.0001
Common Yellowthroat 0.0370 (0.0329, 0.0416) 0.1210 (0.1072, 0.1365) 0.0840
Field Sparrow 0.0051 (0.0046, 0.0058) 0.0253 (0.0223, 0.0286) 0.0201
Mourning Dove 0.0426 (0.0334, 0.0544) 0.0661 (0.0576, 0.0758) 0.0235
Yellow-breasted Chat 0.0739 (0.0614, 0.0889) 0.1325 (0.0946, 0.1855) 0.0586
2009
Non-Buffered CP33
Species Density CI Density CI Effect Size
Northern Bobwhite 0.0060 (0.0039, 0.0093) 0.0350 (0.0309, 0.0397) 0.0290
Dickcissel 0.0453 (0.0387, 0.0529) 0.1985 (0.1711, 0.2304) 0.1533
Indigo Bunting 0.2555 (0.2364, 0.2761) 0.2870 (0.2650, 0.3108) 0.0315
Eastern Meadowlark 0.0170 (0.0149, 0.0195) 0.0130 (0.0114, 0.0149) -0.0040
Common Yellowthroat 0.0290 (0.0256, 0.0328) 0.0755 (0.0673, 0.0846) 0.0464
Field Sparrow 0.0121 (0.0106, 0.0139) 0.0244 (0.0212, 0.0281) 0.0123
Mourning Dove 0.0559 (0.0439, 0.0712) 0.0407 (0.0354, 0.0467) -0.0153
Yellow-breasted Chat 0.0248 (0.0207, 0.0298) 0.0609 (0.0436, 0.0853) 0.0361
2010
Non-Buffered CP33
Species Density CI Density CI Effect Size
Northern Bobwhite 0.0019 (0.0012, 0.0029) 0.0530 (0.0464, 0.0604) 0.0511
Dickcissel 0.0402 (0.0344, 0.0469) 0.2197 (0.1880, 0.2567) 0.1795
Indigo Bunting 0.3025 (0.2791, 0.3278) 0.3258 (0.2988, 0.3552) 0.0233
Eastern Meadowlark 0.0350 (0.0306, 0.0400) 0.0383 (0.0334, 0.0439) 0.0033
Common Yellowthroat 0.0247 (0.0221, 0.0276) 0.0892 (0.0795, 0.1001) 0.0645
Field Sparrow 0.0119 (0.0106, 0.0135) 0.0285 (0.0253, 0.0321) 0.0165
Mourning Dove 0.0668 (0.0525, 0.0851) 0.0513 (0.0449, 0.0586) -0.0155
Yellow-breasted Chat 0.0327 (0.0273, 0.0392) 0.1029 (0.0736, 0.1438) 0.0701
Table 1. Density (male birds/acre), 95% confidence intervals (CI), and effect sizes of breeding bird species at non-buffered and CP33 sites in 2006, 2007, 2008, 2009, and 2010 (continued).

18Bird Monitoring and Evaluation Plan 2010 Annual Report
2006 2007 2008 2009 2010
Native Grass Species 30.49 62.89 38.00 N/A* 34.07
Exotic Grass Species 12.53 11.99 7.71 N/A* 26.30
Forb 16.62 40.98 42.33 27.84 20.24
Legume 6.62 14.68 11.85 17.35 10.09
Woody 5.43 0.14 0.40 N/A* 11.73
Litter 36.58 21.71 22.04 65.40 72.49
Bare Ground 30.36 49.86 21.76 34.63 27.64
* Data is not available
Table 2. Mean percent coverage of native and exotic grass species, forbs, legumes, and woody species, litter, and bareground for 2006, 2007, 2008, 2009, and 2010.
Bird Monitoring and Evaluation Plan 2010 Annual Report19
Unmanaged
2006 2007 2008 2009 2010
Native Grass Species 21.50 55.28 40.17 N/A* 43.61
Exotic Grass Species 14.50 25.44 5.39 N/A* 28.54
Forb 24.61 26.45 55.72 34.55 17.59
Legume 5.44 10.94 7.56 16.90 4.11
Woody 5.06 0.06 0.22 N/A* 16.00
Litter 26.50 34.44 20.76 69.60 70.89
Bare Ground 45.94 45.72 23.34 30.30 30.00
* Data is not available
Table 3. Mean percent coverage of native and exotic grass species, forbs, legumes, and woody species, litter, and bareground for managed and unmanaged CP33 buffers in 2006, 2007, 2008, 2009, and 2010.
Managed
2006 2007 2008 2009 2010
Native Grass Species 34.10 65.20 37.36 N/A* 31.47
Exotic Grass Species 12.33 7.91 8.40 N/A* 25.69
Forb 12.81 45.40 38.31 25.13 20.97
Legume 7.26 15.81 13.13 18.08 11.72
Woody 5.76 0.17 0.45 N/A* 10.41
Litter 40.85 17.84 22.42 64.15 72.93
Bare Ground 24.39 51.11 21.29 35.92 27.00
* Data is not available
20Bird Monitoring and Evaluation Plan 2010 Annual Report
Appendix A. Cumulative counts of birds (calling males) detected during breeding season counts at control and CP33 sites in 2006, 2007, 2008, 2009, and 2010.
Common Name2006*
Control2006* CP33
2007* Control
2007* CP33
2008* Control
2008* CP33
2009# Control
2009# CP33
2010# Control
2010# CP33
Acadian Flycatcher 0 0 0 1 1 0 2 0 1 0
American Crow 84 90 41 39 13 21 87 85 86 78
American Goldfinch 0 1 0 0 0 1 2 0 0 0
American Robin 0 1 2 2 0 0 1 0 0 0
Bank Swallow 0 4 0 0 0 0 0 0 0 0
Baltimore Oriole 2 4 0 0 0 1 0 0 0 0
Barn Swallow 17 20 1 0 0 0 9 7 15 3
Barred Owl 0 0 0 0 0 1 0 2 0 0
Belted Kingfisher 1 1 0 0 1 0 0 0 1 1
Blue-gray Gnatcatcher 7 7 9 10 2 8 8 6 19 12
Brown-headed Cowbird 19 18 17 22 13 17 12 23 18 20
Blue Grosbeak 3 1 14 20 9 28 12 8 12 10
Blue Jay 23 31 25 28 20 17 45 28 44 38
Black Vulture 1 0 0 0 0 0 0 0 0 0
Brown Trasher 0 3 0 4 0 1 3 1 2 0
Broad-winged Hawk 0 1 0 0 0 0 0 0 0 0
Carolina Chickadee 11 3 10 6 18 9 5 11 8 3
Cattle Egret 16 7 0 0 1 0 0 0 0 0
Carolina Wren 58 51 33 35 46 41 58 49 33 36
Chimney Swift 3 13 15 2 0 0 0 2 0 1
Cliff Swallow 0 0 3 0 0 0 10 0 0 0
Common Ground-Dove 1 3 0 0 0 0 0 0 0 0
Common Grackle 9 12 1 2 0 0 0 0 8 2
Cooper's Hawk 0 2 0 0 0 0 0 0 0 0
Common Yellowthroat 22 27 31 45 22 63 31 81 19 68
Dickcissel 59 133 47 104 27 111 65 163 35 130
Downy Woodpecker 8 7 9 4 3 1 0 6 4 2
Eastern Bluebird 14 8 7 11 9 5 6 8 2 0
Eastern Kingbird 10 3 7 5 8 4 2 2 4 2
Eastern Meadowlark 31 35 23 32 35 27 53 44 68 74
Eastern Pheobe 0 0 2 0 1 5 2 2 6 1
Eastern Towhee 24 33 34 43 33 37 35 50 57 65
Eastern Wood-Pewee 7 4 5 5 9 4 11 6 5 14
Eurasian Collared-Dove 0 2 0 3 0 0 0 0 1 0

Bird Monitoring and Evaluation Plan 2010 Annual Report21
Common Name2006*
Control2006* CP33
2007* Control
2007* CP33
2008* Control
2008* CP33
2009# Control
2009# CP33
2010# Control
2010# CP33
Eastern Tufted Titmouse
18 18 23 23 32 38 47 31 36 39
European Starling 2 3 0 0 0 0 0 0 0 0
Fish Crow 0 1 0 0 0 0 1 0 0 0
Field Sparrow 40 48 22 37 16 39 49 91 39 65
Grasshopper Sparrow 5 2 3 0 3 1 2 0 12 0
Gray Catbird 0 2 0 1 2 1 1 0 0 0
Great Blue Heron 8 5 0 0 5 0 3 0 2 1
Great-crested Flycatcher 0 0 4 6 2 4 0 0 1 0
Great-horned Owl 0 0 0 1 1 0 0 0 0 0
Green Heron 0 1 0 0 0 3 0 0 0 0
Hairy Woodpecker 0 1 2 1 0 0 0 0 3 6
Horned Lark 19 23 14 17 31 9 6 3 12 6
Hooded Warbler 0 0 0 0 1 1 2 0 1 0
Indigo Bunting 206 249 154 163 141 159 223 243 188 193
Kentucky Warbler 0 0 0 0 0 1 0 2 3 0
Killdeer 43 30 24 23 24 12 70 48 44 25
Lark Sparrow 0 0 0 0 3 0 0 0 0 0
Little Blue Heron 0 1 0 0 0 0 0 0 0 0
Loggerhead Shrike 2 0 0 2 2 3 0 0 0 0
Mallard 0 0 1 1 0 0 0 0 0 0
Mourning Dove 66 85 39 70 28 54 96 112 84 78
Northern Bobwhite 61 126 47 87 37 96 58 100 29 101
Northern Cardinal 109 116 100 102 117 115 127 144 176 181
Northern Harrier 1 0 0 0 0 0 0 0 0 0
Northern Mockingbird 40 71 27 26 25 41 35 25 40 25
Northern Parula 0 0 0 0 1 2 0 0 0 0
Northern Rough-winged Swallow
0 2 0 0 0 0 0 0 0 0
Orchard Oriole 1 0 1 5 2 6 3 1 4 9
Painted Bunting 0 0 0 2 0 1 0 0 0 0
Pine Warbler 0 0 0 0 2 2 1 0 1 1
Pileated Woodpecker 3 8 4 3 2 2 2 1 1 4
Prairie Warbler 0 0 0 1 0 2 0 1 0 0
Purple Martin 8 10 3 1 0 0 3 0 3 0
Appendix A. Cumulative counts of birds (calling males) detected during breeding season counts at control and CP33 sites in 2006, 2007, 2008, 2009, and 2010 (continued).
22Bird Monitoring and Evaluation Plan 2010 Annual Report
Common Name2006*
Control2006* CP33
2007* Control
2007* CP33
2008* Control
2008* CP33
2009# Control
2009# CP33
2010# Control
2010# CP33
Red-bellied Woodpecker
16 35 27 27 15 18 46 67 39 58
Red-eyed Vireo 4 3 4 5 7 12 1 2 5 4
Red-headed Woodpecker
3 1 4 2 0 1 1 1 0 0
Rock Dove 0 10 0 0 0 0 0 0 0 0
Red-shouldered Hawk 0 5 3 2 3 2 0 2 0 1
Red-tailed Hawk 8 5 3 2 0 1 7 5 3 3
Ruby-throated Hummingbird
1 5 1 2 0 0 1 0 0 0
Red-winged Blackbird 142 213 95 107 98 143 125 185 132 142
Song Sparrow 0 1 1 0 0 0 0 0 0 0
Summer Tanager 9 6 0 3 2 5 3 1 2 1
Turkey Vulture 0 2 0 0 0 0 0 0 0 0
Unknown 3 1 0 0 0 0 0 2 0 0
White-eyed Vireo 9 11 5 17 23 23 15 21 20 31
Wild Turkey 0 1 0 0 0 0 0 4 4 4
Wood Duck 0 1 0 0 0 1 1 0 0 0
Wood Thrush 0 2 3 8 1 5 1 13 3 10
Whip-poor-will 0 0 0 0 0 0 1 0 0 0
White-throated Sparrow
0 0 0 0 0 0 0 1 0 0
Yellow-breasted Chat 43 58 41 57 55 78 65 117 50 103
Yellow-billed Cuckoo 42 44 38 36 21 39 28 26 53 48
Yellow-shafted Flicker 1 0 3 0 0 0 0 0 0 0
Yellow-throated Vireo 0 0 0 1 1 2 0 0 1 0
* Based on 2 repititions
# Based on 3 repititions
Appendix A. Cumulative counts of birds (calling males) detected during breeding season counts at control and CP33 sites in 2006, 2007, 2008, 2009, and 2010 (continued).

College of Forest ResourcesMississ ippi State Univers i ty
Forest and Wildlife Research Center