missing link between technical analysis and algorithmic trading · · 2017-03-15statistics:...
TRANSCRIPT
Statistics: Missing Link between Technical Analysis and Algorithmic Trading
Manish Jalan MD & CEO Samssara Capital Technologies LLP, Mumbai, India
MARCH, 2017
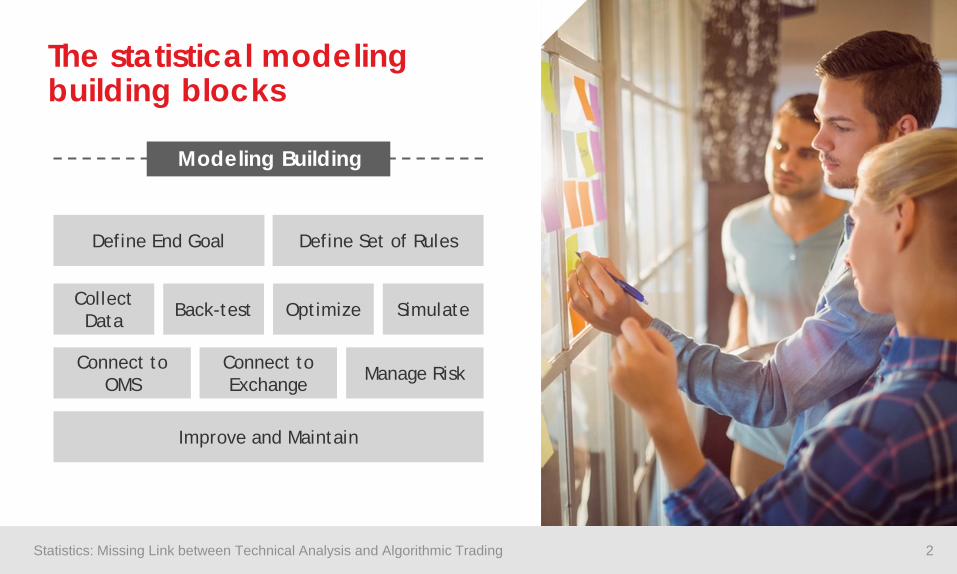
The statistical modeling building blocks
Define End Goal Define Set of Rules
Collect Data Back-test Optimize Simulate
Connect to OMS
Connect to Exchange Manage Risk
Improve and Maintain
Modeling Building
2 Statistics: Missing Link between Technical Analysis and Algorithmic Trading

Why Mathematics & Statistics?
Pure Technical Models
Moderate ROI when model is working
Large draw-downs when model stops
Long stretch of continuous bleeding in returns
User might lose confidence
Technical & Statistical Models
Superior ROI when model is working
Flattish ROI when model stops
Shorter stretch of continuous flattish period
User can diversify and make multi-models
3 Statistics: Missing Link between Technical Analysis and Algorithmic Trading
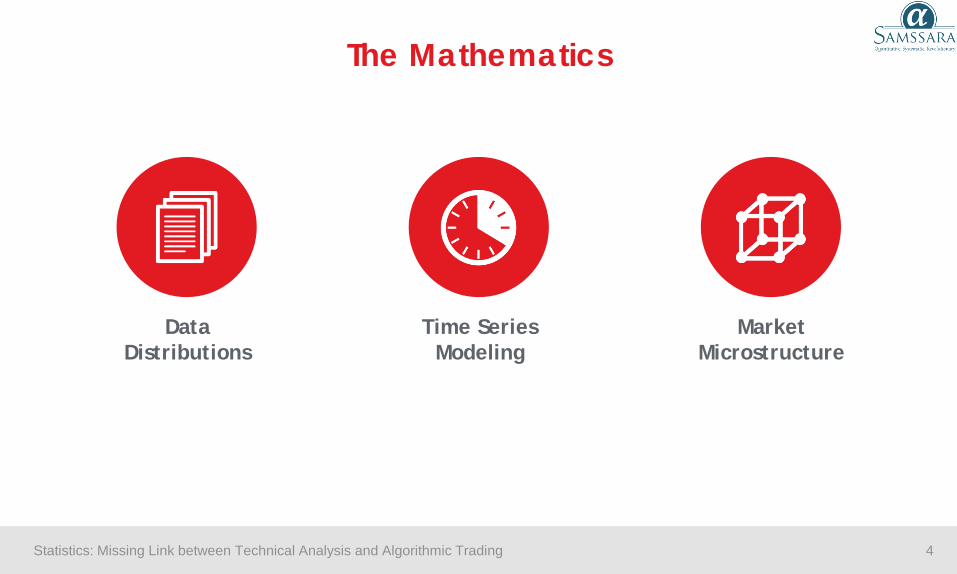
The Mathematics
Data Distributions
Time Series Modeling
Market Microstructure
4 Statistics: Missing Link between Technical Analysis and Algorithmic Trading

The Volatility
5
2
1
1 ( )n
ii
xn
σ µ=
= −∑
Volatility Is deviation from mean
in daily, 5 min, 10 min etc.
5 Statistics: Missing Link between Technical Analysis and Algorithmic Trading
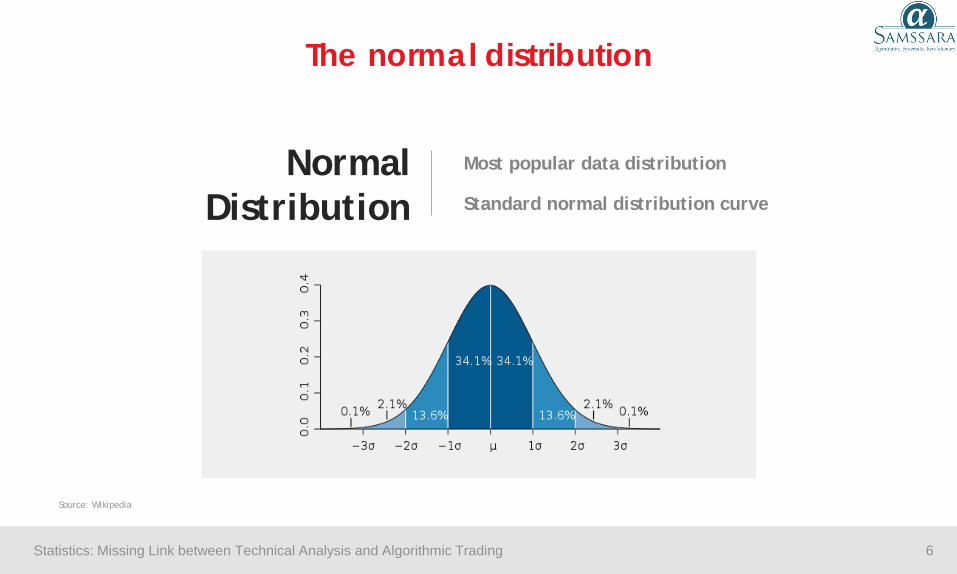
The normal distribution
Normal Distribution
Most popular data distribution
Standard normal distribution curve
Source: Wikipedia
6 Statistics: Missing Link between Technical Analysis and Algorithmic Trading
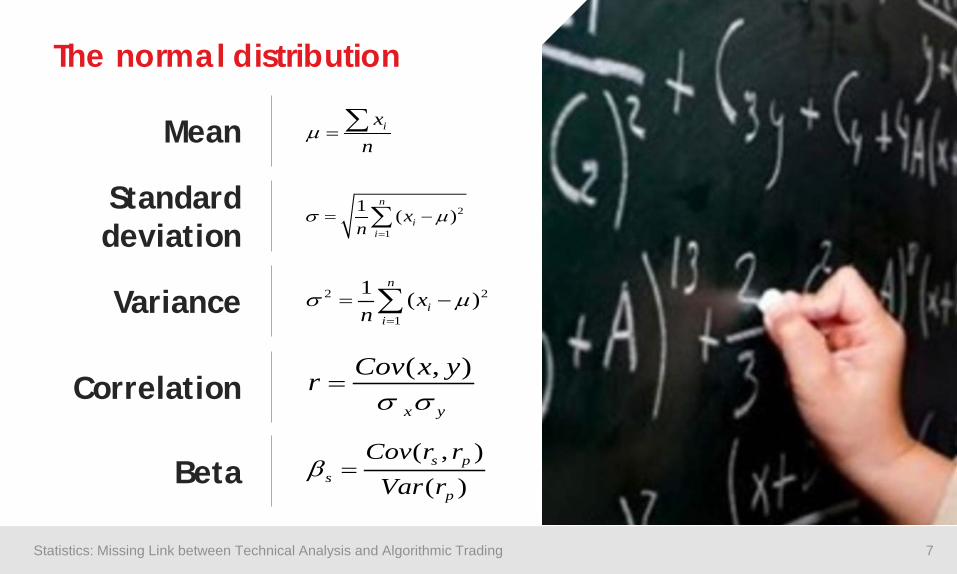
Mean ixn
µ = ∑
Standard deviation
2
1
1 ( )n
ii
xn
σ µ=
= −∑
Variance 2 2
1
1 ( )n
ii
xn
σ µ=
= −∑
Correlation ( , )
x y
Cov x yrσ σ
=
Beta ( , )( )s p
sp
Cov r rVar r
β =
The normal distribution
7 Statistics: Missing Link between Technical Analysis and Algorithmic Trading
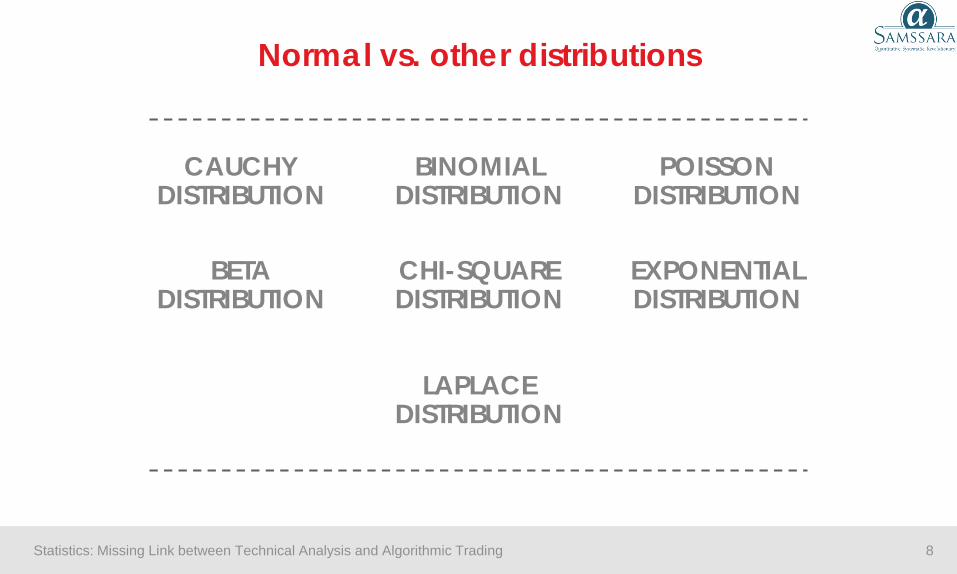
Normal vs. other distributions
CAUCHY DISTRIBUTION
BETA DISTRIBUTION
BINOMIAL DISTRIBUTION
CHI-SQUARE DISTRIBUTION
LAPLACE DISTRIBUTION
POISSON DISTRIBUTION
EXPONENTIAL DISTRIBUTION
8 Statistics: Missing Link between Technical Analysis and Algorithmic Trading
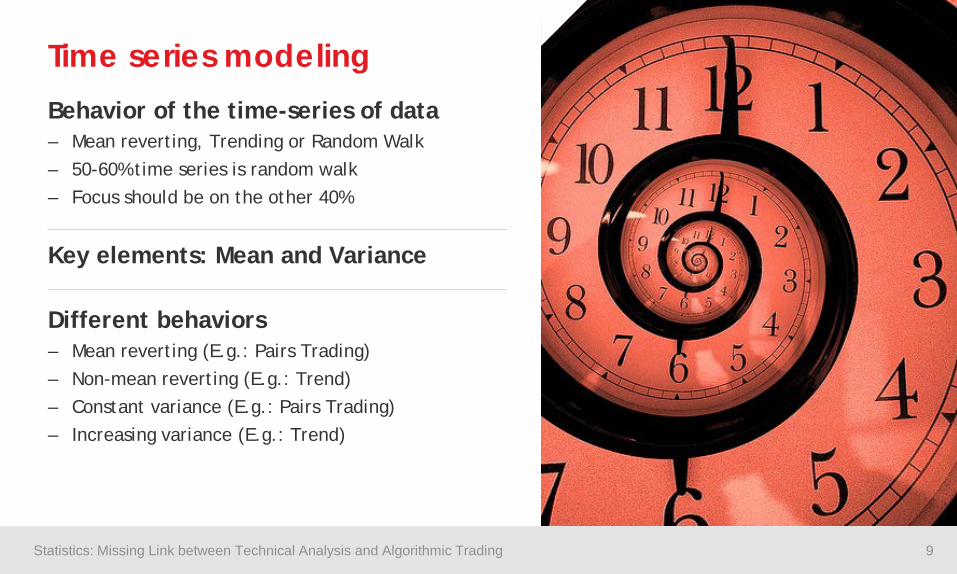
Behavior of the time-series of data – Mean reverting, Trending or Random Walk – 50-60% time series is random walk – Focus should be on the other 40%
Key elements: Mean and Variance
Different behaviors – Mean reverting (E.g.: Pairs Trading) – Non-mean reverting (E.g.: Trend) – Constant variance (E.g.: Pairs Trading) – Increasing variance (E.g.: Trend)
Time series modeling
9 Statistics: Missing Link between Technical Analysis and Algorithmic Trading
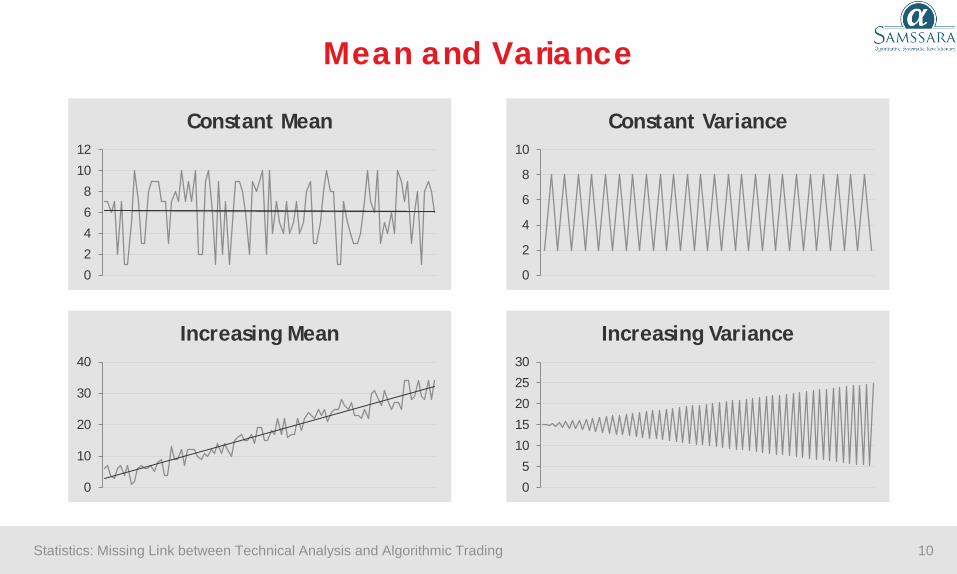
Mean and Variance
0
2
4
6
8
10
12
Constant Mean
0
2
4
6
8
10
Constant Variance
0
10
20
30
40
Increasing Mean
0
5
10
15
20
25
30
Increasing Variance
10 Statistics: Missing Link between Technical Analysis and Algorithmic Trading
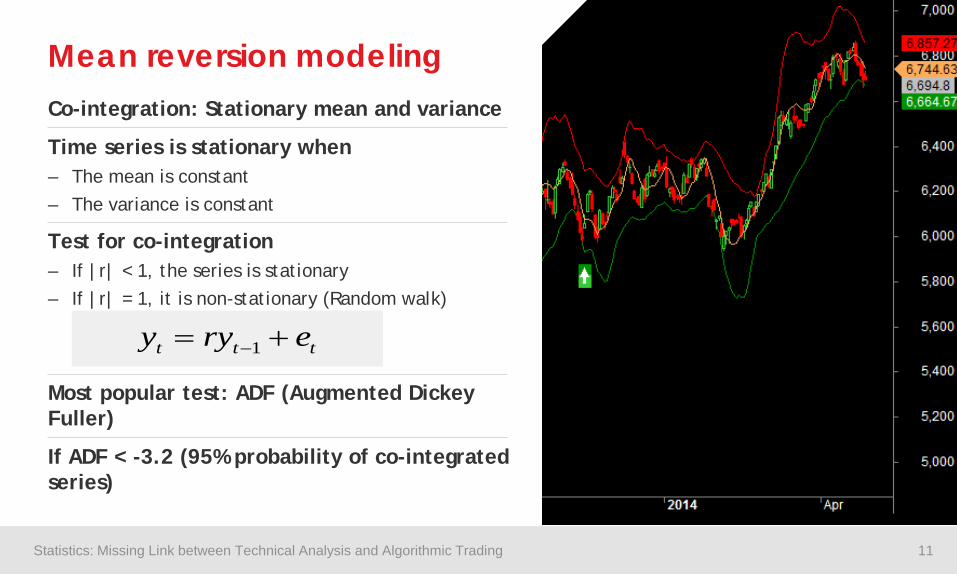
Mean reversion modeling Co-integration: Stationary mean and variance
Time series is stationary when – The mean is constant – The variance is constant
Test for co-integration – If |r| < 1, the series is stationary – If |r| = 1, it is non-stationary (Random walk)
Most popular test: ADF (Augmented Dickey Fuller)
If ADF < -3.2 (95% probability of co-integrated series)
1t t ty ry e−= +
11 Statistics: Missing Link between Technical Analysis and Algorithmic Trading

Variance Ratio Test: Test for variance alone
Useful when mean is varying w.r.t to the time
Ornstein-Uhlenbeck Process: Test for mean reversion alone
Useful when only mean reversion rate matters
Generic time series modeling
( )( )( )
k t
t
Variance rVR kk Variance r
∆
∆
=×
( )t t tdx x dt dWθ µ σ= − +
12 Statistics: Missing Link between Technical Analysis and Algorithmic Trading

0.00%2.00%4.00%6.00%8.00%
10.00%12.00%14.00%16.00%18.00%20.00%
0 10 20 30 40 50
Gro
wth
P/E Ratio
Cluster analysis and PCA Grouping of similar data and pattern
Useful in factor modeling
PCA: To identify principal component
13 Statistics: Missing Link between Technical Analysis and Algorithmic Trading

Regression
-0.2
-0.15
-0.1
-0.05
0
0.05
0.1
0.15
0.2
-0.2 -0.15 -0.1 -0.05 0 0.05 0.1 0.15 0.2 0.25
2
0.6590.720
y xR=
=
Useful in identifying alpha-generating factors
y mx c= +
14 Statistics: Missing Link between Technical Analysis and Algorithmic Trading

1001.50 13 1001.00 19 1000.50 2 1000.00 17 999.50 9
999.00 10 998.50 4 998.00 16 998.00 7 998.00
Last Traded Price
Bid-Ask Spread
Price Ask Qty Bid Qty
Used in UHFT, HFT, Agency Trading
Market microstructure
15 Statistics: Missing Link between Technical Analysis and Algorithmic Trading
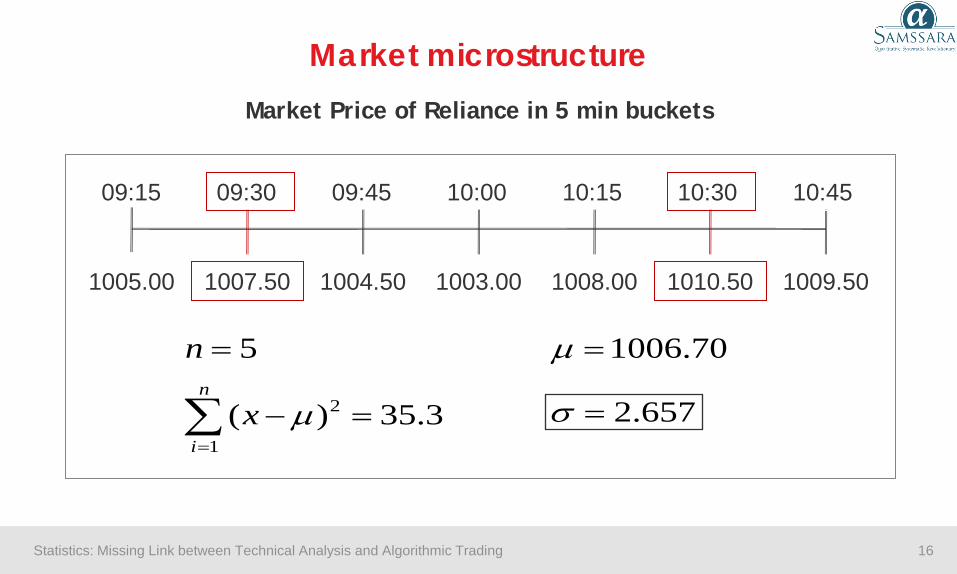
Market microstructure
09:15 09:30 09:45 10:00 10:45 10:30 10:15
1005.00 1007.50 1004.50 1003.00 1008.00 1010.50 1009.50
5n = 1006.70µ =
2
1( ) 35.3
n
ix µ
=
− =∑ 2.657σ =
Market Price of Reliance in 5 min buckets
16 Statistics: Missing Link between Technical Analysis and Algorithmic Trading
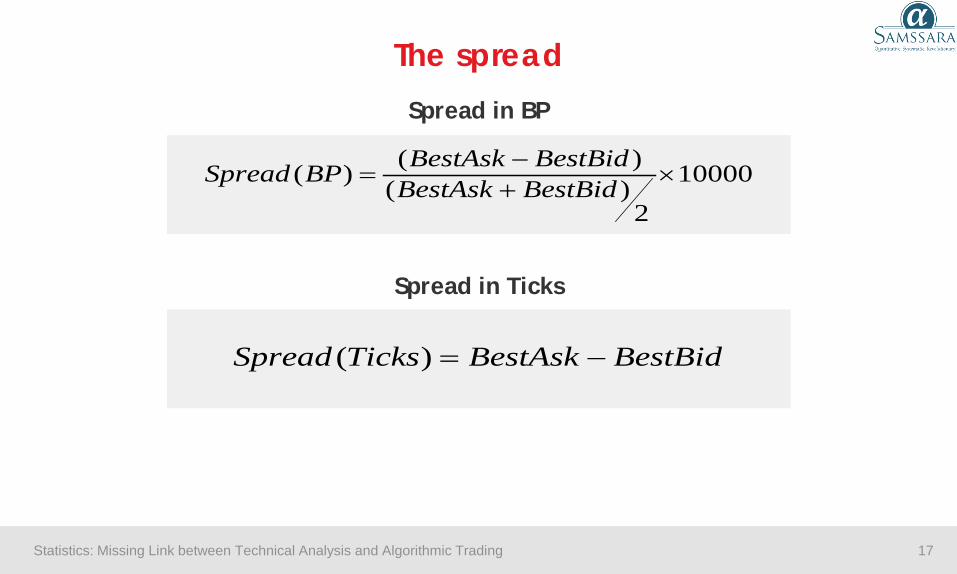
The spread
( )Spread Ticks BestAsk BestBid= −
( )( ) 10000( )2
BestAsk BestBidSpread BP BestAsk BestBid−
= ×+
Spread in BP
Spread in Ticks
17 Statistics: Missing Link between Technical Analysis and Algorithmic Trading
0.00%
1.00%
2.00%
3.00%
4.00%
5.00%
6.00%
7.00%
09:00 09:50 10:40 11:30 12:20 13:10 14:00 14:50
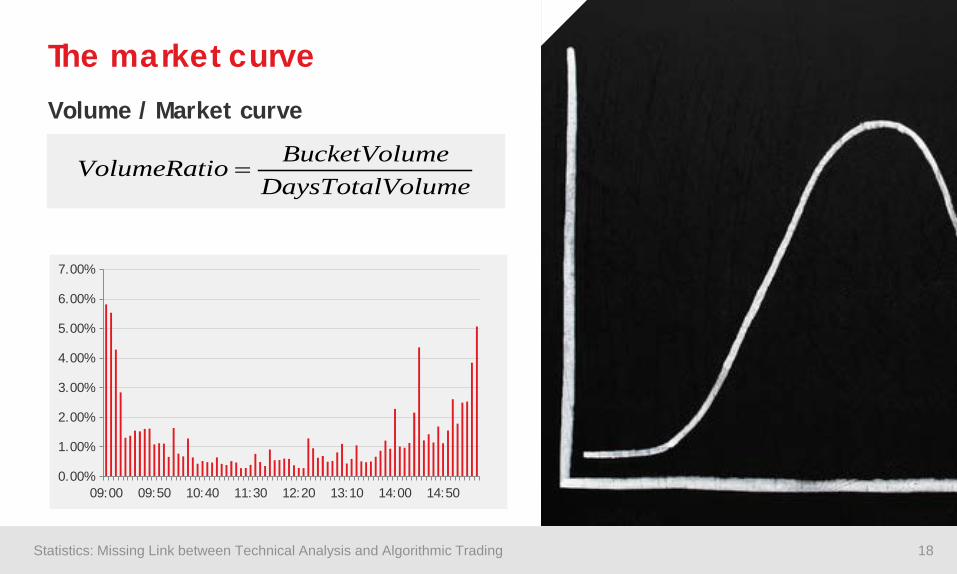
The market curve Volume / Market curve
BucketVolumeVolumeRatioDaysTotalVolume
=
18 Statistics: Missing Link between Technical Analysis and Algorithmic Trading
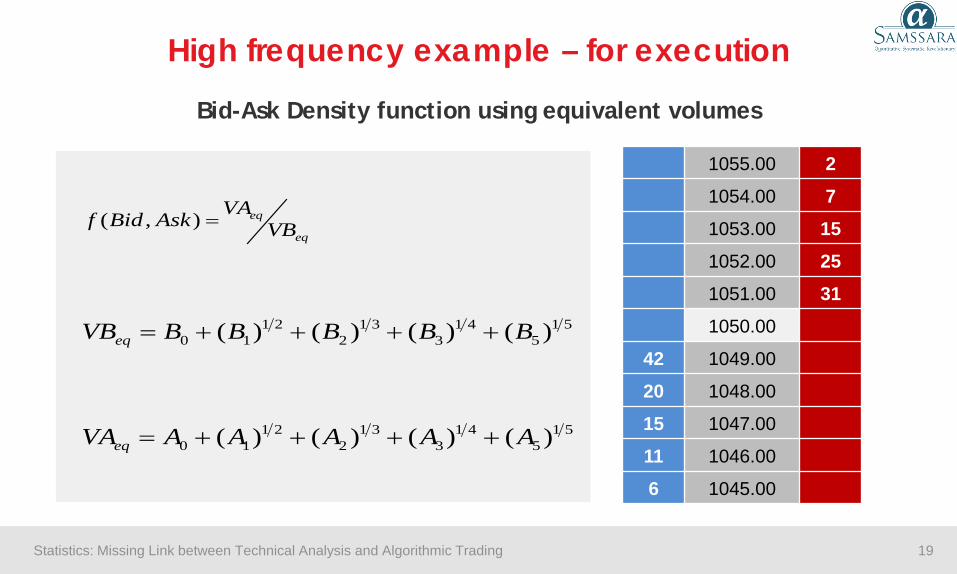
1055.00 2 1054.00 7 1053.00 15 1052.00 25 1051.00 31 1050.00
42 1049.00 20 1048.00 15 1047.00 11 1046.00 6 1045.00
1 2 1 3 1 4 1 50 1 2 3 5( ) ( ) ( ) ( )eqVB B B B B B= + + + +
1 2 1 3 1 4 1 50 1 2 3 5( ) ( ) ( ) ( )eqVA A A A A A= + + + +
( , ) eq
eq
VAf Bid Ask VB=
High frequency example – for execution
Bid-Ask Density function using equivalent volumes
19 Statistics: Missing Link between Technical Analysis and Algorithmic Trading

High frequency example
Short Term Upward Momentum
10:00:00 10:00:30 10:01:00
Trades hitting the Bid
Trades lifted on the Offer
10:01:30
20 Statistics: Missing Link between Technical Analysis and Algorithmic Trading

21
Conclusion
Statistical modeling can help you reduce draw-downs in technical analysis
Statistics can help filter for high probability trades
Statistics can enhance the returns on capital deployed
Technical analysis can be used for entry / exits and statistics can be used for filtering those entries and exits
Statistics can help you re-fine your stop losses and portfolio optimization
Statistics can help in making trade execution better and reduce slippages per trade
Statistics: Missing Link between Technical Analysis and Algorithmic Trading

22
Recommended referrals
Prop trading
• Statistical Arbitrage: Algorithmic Trading Insights and Techniques by Andrew Pole
• High-Frequency Trading: A Guide to Algorithmic Strategies and Trading Systems by Irene Aldridge
• The Encyclopedia of Trading Strategies by Jeffrey Owen and Donna McCormick
Agency trading
• Algorithmic Trading and DMA: An introduction to direct access trading strategies by Barry Johnson
• Quantitative Trading: How to Build Your Own Algorithmic Trading Business by Ernset P. Chan
Web forums
Wilmott forum: www.wilmott.com Nuclear Phynance: www.nuclearphynance.com
Statistics: Missing Link between Technical Analysis and Algorithmic Trading

23
Manish Jalan MD & CEO Samssara Capital Technologies LLP, Mumbai, India

Interactive Brokers LLC is a member NYSE, FINRA and SIPC. Hedge Funds are highly speculative and investors may lose their entire investment. Supporting documentation for any claims and statistical information will be provided upon request. [1] According to the Barron’s 2016 online broker review. [2] Based on independent measurements by the Transaction Auditing Group, Inc., (TAG). For additional information see, ibkr.com/info
IB Account Offerings
• Lowest Margin Rates and Commissions • Security Financing real-time depth of
availability and rates protect against buy-ins and recalls.
• Safety of Assets strong balance sheet, large relative equity capital, client fund protection
• Innovative trading technology trade in over 100 market centers in 24 countries, direct market access to stocks, options, futures, forex, bonds, ETFs and CFDs from a single account
• Speed of Execution and Risk Management
IB API Your application, our trading system.
Build a complete trading application that connects to our advanced order routing and trading system using our IB Application Programming Interface (API).
Investors’ Marketplace Connect with an established consultant for custom solutions.
To find out more contact Ankit Shah, Interactive Brokers +91 (22) 6128 9836 [email protected] Follow IB Quant on LinkedIn: https://www.linkedin.com/company/ib-quant
Interactive Brokers APIs – an Innovative Approach to Trading, Portfolio Optimization and Financial Data Mining