missing food, missing data? a critical review of global ...€¦ · missing food, missing data? a...
TRANSCRIPT
Missing Food, Missing Data? A Critical Review of Global Food Lossesand Food Waste DataLi Xue,†,‡ Gang Liu,*,§ Julian Parfitt,∥ Xiaojie Liu,† Erica Van Herpen,⊥ Åsa Stenmarck,#
Clementine O’Connor,@ Karin Ostergren,∇ and Shengkui Cheng†
†Institute of Geographic Sciences and Natural Resources Research, Chinese Academy of Sciences, 100101 Beijing, China‡University of Chinese Academy of Sciences, 100049 Beijing, China§SDU Life Cycle Engineering, Department of Chemical Engineering, Biotechnology, and Environmental Technology, University ofSouthern Denmark, 5230 Odense, Denmark∥Anthesis Group, Oxford OX4 1RE, United Kingdom⊥Marketing and Consumer Behavior Group, Wageningen University, Wageningen 6708 PB, The Netherlands#IVL Swedish Environmental Research Institute, 114 27 Stockholm, Sweden@World Resources Institute, Washington, DC 20002, United States∇RISE Bioscience and Materials, Agrifood and Bioscience, 223 70 Lund, Sweden
*S Supporting Information
ABSTRACT: Food losses and food waste (FLW) have become a global concern in recentyears and emerge as a priority in the global and national political agenda (e.g., with Target12.3 in the new United Nations Sustainable Development Goals). A good understandingof the availability and quality of global FLW data is a prerequisite for tracking progress onreduction targets, analyzing environmental impacts, and exploring mitigation strategies forFLW. There has been a growing body of literature on FLW quantification in the past years;however, significant challenges remain, such as data inconsistency and a narrow temporal,geographical, and food supply chain coverage. In this paper, we examined 202 publicationswhich reported FLW data for 84 countries and 52 individual years from 1933 to 2014. Wefound that most existing publications are conducted for a few industrialized countries (e.g.,the United Kingdom and the United States), and over half of them are based only onsecondary data, which signals high uncertainties in the existing global FLW database.Despite these uncertainties, existing data indicate that per-capita food waste in thehousehold increases with an increase of per-capita GDP. We believe that more consistent,in-depth, and primary-data-based studies, especially for emerging economies, are badly needed to better inform relevant policy onFLW reduction and environmental impacts mitigation.
1. INTRODUCTION
Food losses and food waste (FLW) occur throughout the foodchain from farm to fork. FLW has become a worldwide concernin recent years and is widely identified as a key barrier to globalsustainability due to its adverse impacts on food security,1
natural resources2 (e.g., land, water, and energy), environment3
(e.g., greenhouse gas emissions), and human health4 (e.g., toxicemissions from incineration). Consequently, reduction of FLWemerges as a priority on the global and national politicalagenda. For example, the United Nations have adopted aspecific target in the recently released Sustainable DevelopmentGoals (SDG) to halve per-capita global food waste at the retailand consumer levels and reduce food losses along productionand supply chains by 2030 (Target 12.3).5 The EuropeanUnion6 and the United States7 have consequently adopted thistarget, and the African Union’s 2014 Malabo Declaration alsoincludes a commitment “to halve the current levels of post-harvest losses by the year 2025.”8
In response to the increasing public concerns and politicalattention on FLW, the past decades have seen a growing bodyof literature on the quantification of FLW across the foodsupply chains at global, regional, and national levels. Forexample, the Food and Agriculture Organization (FAO) of theUnited Nations estimated that roughly one-third of foodproduced for human consumption (or 1.3 billion tons) was lostor wasted globally.9 The carbon and water footprint of thissignificant amount of FLW were estimated to be 4.4 gigatons(or 8% of the world’s total) of CO2 equivalent
10 and 250 km3
of blue water,2 respectively. It would also mean 1.4 billionhectares (or 28% of the world’s total) of agriculture land useand an economic cost of about 750 million U.S. dollars (USD),
Received: January 23, 2017Revised: May 3, 2017Accepted: May 11, 2017Published: May 11, 2017
Critical Review
pubs.acs.org/est
© XXXX American Chemical Society A DOI: 10.1021/acs.est.7b00401Environ. Sci. Technol. XXXX, XXX, XXX−XXX

which equals the GDP of Turkey.2 Many other studies at theregional or individual country levels have also highlighted asimilar large scale of FLW (though not always directlycomparable) and its profound impacts on food security,environment, and economic development. For example, theEU-28 generate approximately 100 million tons of FLWannually in which households contribute the most (45%).11 Asto its member states, the U.K. households alone wasted about7.2 million tons of food in 2012, over 60% of which wasidentified as avoidable.12 The amount of food thrown awayfrom households in Finland, Denmark, Norway, and Swedenaccount for 30%, 23%, 20%, and 10−20% of food bought,respectively.13 Roughly 1/3 of the edible calories produced inSwitzerland is wasted, and the household is the largestcontributor.14 Other industrialized countries show a similartrend too. For example, the per-capita FLW in the UnitedStates increased by about 50% from 1979 to 2003.15 Over 4.2million tons of FLW is disposed to landfill in Australia everyyear, costing over 10.5 billion USD only in waste-disposalcharges.16 About 27 billion USD of food is wasted throughoutthe food supply chains in Canada annually, equivalent to 40%of all food produced and 2% of Canada’s GDP.17
A few national agencies and intergovernmental organizationshave been working on FLW quantification continuously overthe past decades. In particular, the FAO has released severalinfluential reports on FLW quantification on a global level.2,9,18
The United States Department of Agriculture EconomicResearch Service (USDA-ERS) has created the Loss-AdjustedFood Availability Data Series since 1997, reporting over 200commodities by three stages (farm to retail, retail, andconsumer) of losses in terms of quantities, values, andcalories.19−23 The Waste and Resources Action Programme(WRAP) has issued a range of reports on FLW in the supplychain, household, and food service in the United Kingdomsince 2007.12,24−30
More recently, stakeholders from academia, industry, andgovernmental and nongovernmental organizations have startedto join efforts in research projects and working groups for FLWquantification and method standardization. For example, theEuropean Commission funded projects “Food Use for SocialInnovation by Optimising Waste Prevention Strategies(FUSIONS)” (2012−2016) and “Resource Efficient Foodand dRink for the Entire Supply cHain (REFRESH)” (2015−2019) have issued a series of publications, covering variousaspects of FLW definition, quantification, and mitigation andvalorization strategies.12,31−34 In June 2016, a partnership ofleading international organizations (e.g., World ResourcesInstitute, FAO, WRAP, United Nations Environment Pro-gramme, and World Business Council for Sustainable Develop-ment) launched a first-ever global standard to measure FLW.35
Despite these growing efforts on the quantification of FLWand standardization of methodologies, several researchers havealso raised concerns on the data deficiency and inconsistencyand called for better and more measurements on FLW.36−38 Insummary, we argue that the existing global FLW data sufferfrom the following major gaps.
• Their spatial coverage is narrow. Most existing studies onFLW are conducted in industrialized countries. Forexample, there are numerous publications quantifyingFLW in the United States39−61 and Sweden;62−76 on thecontrary, only a handful of studies illustrate FLW in low-income countries, such as Nepal,77 the Philippines,78
Egypt,79,80 and countries undergoing rapid dietarytransition, such as China, Brazil, and India.81
• There is an unbalanced focus on the different stagesalong the food supply chain. There are a large number ofstudies on food waste at the retailing and consumerlevels23,39,44,48,49,58,82−85 (mainly in industrialized coun-tries, e.g., the United States), while there are fewerstudies addressing the immediate postharvest losses(mainly in a few developing countries, e.g., India86,87
and Vietnam88).• Some available data are outdated but are still used. Due
to lack of more recent data, researchers have to fall backon older data. For example, data of the 1980s and 1990sfrom the same reference were used in two publications(published in 2005 and 2010, respectively) as the currentpostharvest FLW of fresh fruits and vegetables in Egyptand Venezuela.78,79
• There is inadequate first-hand data and a number ofstudies have to rely on data derived from literature. Forexample, many studies have frequently quoted datareported in the 2011 FAO report,53,89−93 which may notbe representative or accurate for some countries andcommodities37 (e.g., household food waste data in Asiaand Africa do not have a single measured data point inthis report). Data in the African Postharvest LossesInformation System (APHLIS) have also been widelyused for postharvest FLW analyses elsewhere.49,94−96
• The system boundary and methods as well as definitionof FLW used vary in different studies, which makesystematic comparison and verification of FLW databetween countries, stages, and commodities oftendifficult. Thus, any extrapolation based on the existingdata and discussion on relationship between FLW andrelated socioeconomic, environmental, and technologicalaspects would also be uncertain.
A good and clear understanding of the availability and qualityof global FLW data is of particular importance. First, it is aprerequisite of benchmark progress toward the global SDGTarget 12.3 and national FLW reduction targets and ofassessing the effectiveness of interventions. Second, it wouldhelp to raise awareness, explore mitigation strategies, andprioritize efforts on FLW prevention and reduction. Third,better data would enable verification and comparison betweencountries, food supply chains, and commodities and thus helpidentify patterns and driving factors of FLW generation. Fourth,it provides a necessary basis for further analysis of the social,economic, and environmental impacts of FLW.In this paper, we aim to provide a critical overview of all the
existing FLW data in the current literature. We will assess theiravailability, quality, methods of measurement, and discuss theirpatterns and implications for future work. A spreadsheetdatabase containing all the collected FLW data is supplementedin the Supporting Information, which we believe provides afundamental physical database for further analyses on environ-mental impacts and appropriate mitigation strategies of FLW.We aim to answer the following questions in this review:
• What are the bibliometric characteristics of existingliterature on FLW quantification?
• What are the methods used for FLW measurement, andwhat are their advantages and disadvantages?
Environmental Science & Technology Critical Review
DOI: 10.1021/acs.est.7b00401Environ. Sci. Technol. XXXX, XXX, XXX−XXX
B

• What are the patterns of FLW generation amongcountries, food supply chains, and commodities andover time?
• What are the implications for further research in thefuture?
2. MATERIALS AND METHODS2.1. System Definition. Food Losses and Food Waste.
FLW occurs at each stage throughout the food supply chain.Distinctions between the terms food losses and food waste,edible and inedible food waste, and avoidable and nonavoidablefood waste are sometimes made in the literature. Thesedistinctions were not quantitatively considered in ourcomparison due to lack of consistencies and transparencies inthe reviewed literature. For example, many studies differentiatefood loss and food waste according to the FAO,97 which definesfood loss as “the decrease in quantity or quality of food” andfood waste as part of food loss that “has been left to spoil orexpire as a result of negligence by the actor (predominantly, butnot exclusively, the final consumer)”. Food waste is usuallyconnected to deliberate discarding or alternative (nonfood) useof food (e.g., animal feed) that is safe and nutritious for humanconsumption. The reviewed data do not allow us to distinguishbetween food loss and waste; thus, in this paper, we use FLWto refer to the combined amount of food loss and waste.Food Supply Chain. FLW can be related to six main
processes as shown in Figure 1 (note that not all stages are
relevant to all products; for example, fresh vegetables may besupplied directly to market). We further categorized FLW asthree types: farm losses and waste (during agriculturalproduction and harvesting), postharvest losses and waste(during postharvest handling and storage, manufacturing,distribution, and retailing), and consumer waste (both in-household and out-of-home).
Food Commodity Groups. A total of 10 groups of foodcommodities were defined according to the classification usedby the FAO and characteristics of the data in the literature: (1)cereal and cereal products (e.g., wheat, maize, and rice); (2)roots and tubers (e.g., potatoes, sweet potatoes, and cassava);(3) oilseeds and pulses (e.g., peanuts, soybeans, and olives); (4)fruits; (5) vegetables; (6) meat; (7) fish and seafood; (8) dairyproducts; (9) eggs; and (10) others or not specified.
Geographical and Temporal Boundary. We included all ofthe reported FLW data at the global, regional, and nationallevels and from as early as possible until December 2015 in theliterature. The countries were grouped as medium/high-incomecountries and low-income countries (see Table S2) based onper-capita GDP and the grouping principle of FAO.9
2.2. Literature Selection. To ensure a broad coverage ofliterature containing FLW data, both Web of Science andGoogle Scholar were used in the literature search. In addition,we also explored the “grey literature”, i.e., reports prepared byacademic institutions, industrial associations, and governmentaland nongovernmental organizations, considering their signifi-cant amount in recent years. “Food waste” or “food losses”were used as keywords in the search of titles of publications,and only articles published in English by December 2015 werefiltered (more details in section 1 of the SupportingInformation).To further ensure the relevance of the selected publications,
we reviewed the abstracts, keywords, and method details of allthe publications to screen out articles that contained data (e.g.,weight and monetary values) on FLW for at least one foodcommodity, one food supply stage, and one region or country.Finally, 202 publications form the body of literature that wereviewed and examined in depth in this analysis.
2.3. Data Extraction and Treatment. The compiled FLWdata were measured by different metrics, e.g., by physicalweight, calorific value, or by monetary value. They were alsoreported in several ways: (i) single values, (ii) values in a range,or (iii) mean value or mean values with a variation. Thesevalues were either in absolute terms or as percentages. All ofthese differences were considered in our extraction of data fromthe literature (details are shown in the Supporting Informa-tion).Whenever possible, comparison and trend analysis of data by
physical weight (in terms of both percentage and absolutevalues) were conducted across countries and over time and byfood commodity. To facilitate the comparison, original datawere further processed as follows:
• If the original data points were reported in a range, thearithmetic averages were first determined based on theminimum and maximum values. Furthermore, globalmedian values were generated and used in thecomparison of per-capita farm FLW and postharvestFLW among different food commodities because medianvalues are not strongly affected by extreme values(compared to average values) and thus might be more-representative in the comparison. Consumer waste wasusually reported as the weight of cooked food, which waskept in the database and comparison.
• The values reported as the total amount of FLW in aregion or country were divided by their correspondingpopulation in the same year, for the convenience ofcomparison on a per-capita level. When the year ofestimation was not specified, 2 years before the year of
Figure 1. Food supply chain for FLW used in this review. Note thatwe put “waste” alongside “losses” for the farm and postharvest stagesbecause some of the losses in these stages are arguably “wasteful” andavoidable, which makes it difficult to distinguish between loss andwaste.
Environmental Science & Technology Critical Review
DOI: 10.1021/acs.est.7b00401Environ. Sci. Technol. XXXX, XXX, XXX−XXX
C
publication was assumed as a reference for populationand per-capita GDP. Population statistics and GDP data(in current USD) were obtained from the World Bank.
• We introduced a food losses and food waste rate(FLWR) for each food supply stage, which was definedas the proportion of FLW at each stage of the foodsupply chain to the amount of total food initiallyproduced (reference flow, corresponding to a fictiveoutput of 100% of the amount produced). FLWR wascalculated by considering the proportion of FLW acrosseach single stage (see Figure 1), as shown below:
∏= − ≥−
=
r r iFLWR (1 )( 2)i ii
j
j1
1
where ri represents the proportion of FLW at the stage to becalculated (between 0 and 1), and rj represents the proportionof FLW at the previous stages of the food supply chain. Notethat the FLWRs are additive, while the proportion of FLW ateach stage (r) are not additive because the mass flow issuccessively decreasing. For the reference stage (i = 2) the r(i−1)is set to 0. The proportion of FLW at individual stages, r, wasderived from the reviewed literature (either directly or bydividing the quantity of FLW reported in the literature by totalproduction reported in the FAOSTAT).
3. RESULTS AND DISCUSSION3.1. Bibliometric Analysis of Literature on FLW
Quantification. Type of Publications. The 202 reviewedpublications were composed of 5 types: peer-reviewed journal
articles (53.5%), reports (35.6%), PhD and master theses(5.9%), conference proceedings (3.0%), and book chapters(2.0%). The 108 journal articles were published in 69 differentjournals, covering a wide range of disciplines, and about 45% ofthem were published in 10 journals (in descending order interms of number of published articles), i.e., Waste Management(15.7%), Waste Management & Research (7.4%), Resources,Conservation and Recycling (5.6%), Food Policy (4.6%),Journal of Cleaner Production (2.8%), Environmental Science& Technology (1.9%), Journal of Industrial Ecology (1.9%),Journal of Environmental Management (1.9%), EnvironmentalScience & Policy (1.9%), and Sustainability (1.9%).
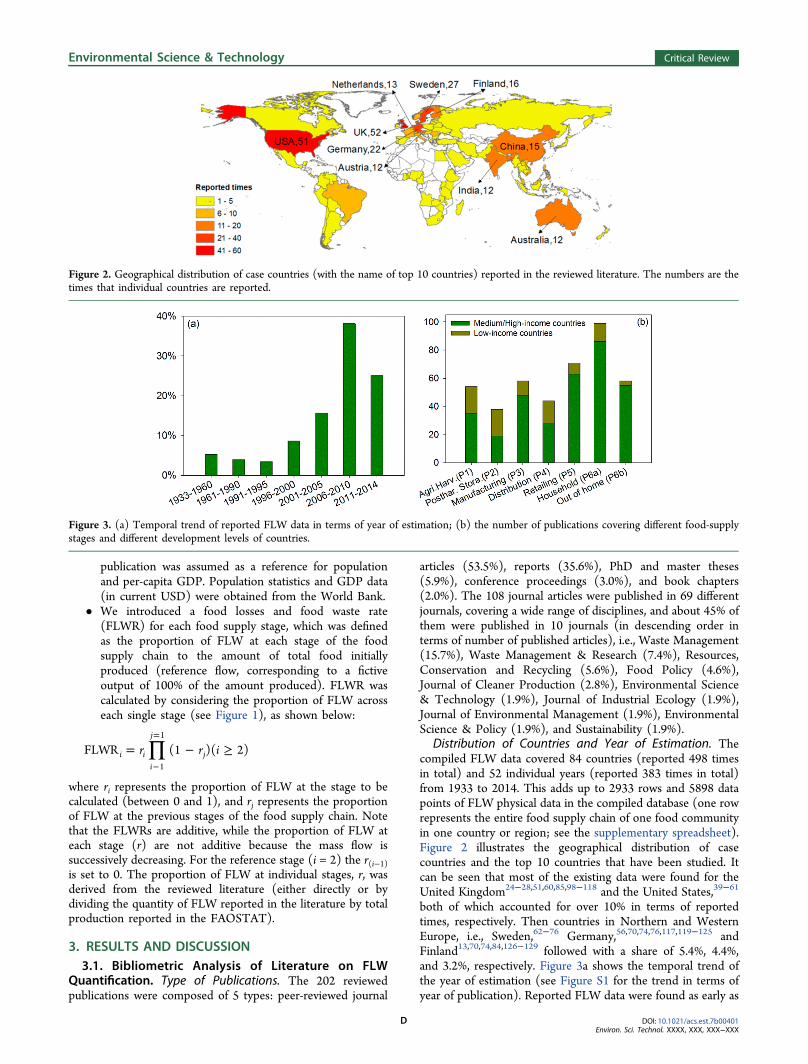
Distribution of Countries and Year of Estimation. Thecompiled FLW data covered 84 countries (reported 498 timesin total) and 52 individual years (reported 383 times in total)from 1933 to 2014. This adds up to 2933 rows and 5898 datapoints of FLW physical data in the compiled database (one rowrepresents the entire food supply chain of one food communityin one country or region; see the supplementary spreadsheet).Figure 2 illustrates the geographical distribution of casecountries and the top 10 countries that have been studied. Itcan be seen that most of the existing data were found for theUnited Kingdom24−28,51,60,85,98−118 and the United States,39−61
both of which accounted for over 10% in terms of reportedtimes, respectively. Then countries in Northern and WesternEurope, i.e., Sweden,62−76 Germany,56,70,74,76,117,119−125 andFinland13,70,74,84,126−129 followed with a share of 5.4%, 4.4%,and 3.2%, respectively. Figure 3a shows the temporal trend ofthe year of estimation (see Figure S1 for the trend in terms ofyear of publication). Reported FLW data were found as early as
Figure 2. Geographical distribution of case countries (with the name of top 10 countries) reported in the reviewed literature. The numbers are thetimes that individual countries are reported.
Figure 3. (a) Temporal trend of reported FLW data in terms of year of estimation; (b) the number of publications covering different food-supplystages and different development levels of countries.
Environmental Science & Technology Critical Review
DOI: 10.1021/acs.est.7b00401Environ. Sci. Technol. XXXX, XXX, XXX−XXX
D
1933, and then the number stayed steady and low until 1995.After 1995, the number went up considerably and over 60%was seen in the past decade (38.1% from 2006 to 2010 and25.1% from 2011 to 2014).Data Coverage along the Food Supply Chain and across
Countries. Figure 3b illustrates the number of publicationscovering different food supply stages and development levels ofcountries (medium- and high-income countries versus low-income countries). It can be seen that most of the studies haveincluded the retailing and consumption stages. Household wascovered in almost half (49%) of all the publications, followedby the retailing stage (35%). However, only a small share(18%−30%) of publications covered the stages betweenagricultural production and distribution (agricultural produc-tion: 26.7%; postharvest handling and storage: 18.8%;manufacturing: 28.7%; and distribution: 21.8%).The number of publications on FLW amount of medium-
and high-income countries was substantially higher than that oflow-income countries throughout the food supply chain exceptfor the postharvest handling and storage stage, for which thenumber of publications was the same for both. Publicationscovering the retailing and consumption stages were mostly
found for the medium- and high-income countries, with veryfew data sources in developing and emerging countries. Low-income countries showed a clear focus in the early and middlefood-supply stages (especially agricultural production andpostharvest handling and storage).
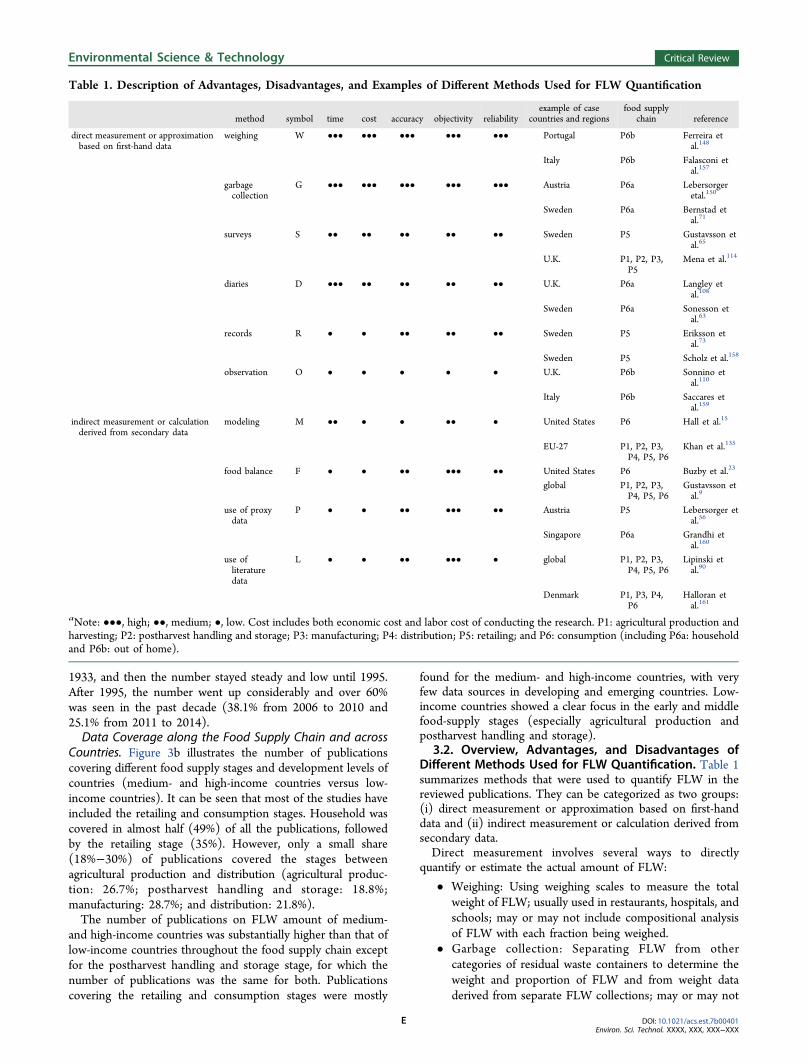
3.2. Overview, Advantages, and Disadvantages ofDifferent Methods Used for FLW Quantification. Table 1summarizes methods that were used to quantify FLW in thereviewed publications. They can be categorized as two groups:(i) direct measurement or approximation based on first-handdata and (ii) indirect measurement or calculation derived fromsecondary data.Direct measurement involves several ways to directly
quantify or estimate the actual amount of FLW:
• Weighing: Using weighing scales to measure the totalweight of FLW; usually used in restaurants, hospitals, andschools; may or may not include compositional analysisof FLW with each fraction being weighed.
• Garbage collection: Separating FLW from othercategories of residual waste containers to determine theweight and proportion of FLW and from weight dataderived from separate FLW collections; may or may not
Table 1. Description of Advantages, Disadvantages, and Examples of Different Methods Used for FLW Quantification
method symbol time cost accuracy objectivity reliabilityexample of case
countries and regionsfood supply
chain reference
direct measurement or approximationbased on first-hand data
weighing W ••• ••• ••• ••• ••• Portugal P6b Ferreira etal.148
Italy P6b Falasconi etal.157
garbagecollection
G ••• ••• ••• ••• ••• Austria P6a Lebersorgeretal.150
Sweden P6a Bernstad etal.71
surveys S •• •• •• •• •• Sweden P5 Gustavsson etal.65
U.K. P1, P2, P3,P5
Mena et al.114
diaries D ••• •• •• •• •• U.K. P6a Langley etal.108
Sweden P6a Sonesson etal.63
records R • • •• •• •• Sweden P5 Eriksson etal.73
Sweden P5 Scholz et al.158
observation O • • • • • U.K. P6b Sonnino etal.110
Italy P6b Saccares etal.159
indirect measurement or calculationderived from secondary data
modeling M •• • • •• • United States P6 Hall et al.15
EU-27 P1, P2, P3,P4, P5, P6
Khan et al.135
food balance F • • •• ••• •• United States P6 Buzby et al.23
global P1, P2, P3,P4, P5, P6
Gustavsson etal.9
use of proxydata
P • • •• ••• •• Austria P5 Lebersorger etal.56
Singapore P6a Grandhi etal.160
use ofliteraturedata
L • • •• ••• • global P1, P2, P3,P4, P5, P6
Lipinski etal.90
Denmark P1, P3, P4,P6
Halloran etal.161
aNote: •••, high; ••, medium; •, low. Cost includes both economic cost and labor cost of conducting the research. P1: agricultural production andharvesting; P2: postharvest handling and storage; P3: manufacturing; P4: distribution; P5: retailing; and P6: consumption (including P6a: householdand P6b: out of home).
Environmental Science & Technology Critical Review
DOI: 10.1021/acs.est.7b00401Environ. Sci. Technol. XXXX, XXX, XXX−XXX
E
include compositional analysis of FLW. It can becollected from the curb130 or collected by householdsat home and handed over to researchers.99,131
• Surveys: Collecting information regarding people’sperceptions or behaviors on FLW through questionnairesthat are answered by a large number of individuals andface-to-face interview of key stakeholders in this field. Inthese surveys, people can be asked to directly estimatethe amount of food waste in their household, e.g., innumber of portions,107 or to estimate the percentage offood items bought into the household that goes towaste.132 Visual tools have sometimes been used to helppeople indicate the amount of food waste.133
• Diaries: Gathering data via keeping a daily record on theamount and types of FLW for a period of time;commonly used for households and commercial kitchens.Households are sometimes provided with weighing scalesto measure the weight of food waste.128,134
• Records: Determining the amount of FLW via theroutinely collected information that is not initially usedfor FLW record (e.g., warehouse record books, point ofsales data, data from food manufacture regulatorysources); usually used for the retailing stage and foodmanufacture (especially supermarkets and larger foodbusinesses).
• Observation: Using scales with several points to evaluatefood leftover by visual method or by counting thenumber of items to assess the volume of FLW.
Indirect measurement includes methods derived fromexisting data of various secondary sources:
• Modeling: Using mathematical models based on factorsthat affect the generation of FLW to calculate the amountof FLW.
• Food balance: Calculating FLW by using a food balancesheet (e.g., from FAOSTAT) or human metabolism (e.g.,relating body weight to the amount of food eaten) basedon inputs, outputs, and stocks along the food supplychain.
• Use of proxy data: Inferring quantities of FLW by usingdata from companies or statistical agencies (mostly usedfor scaling data to produce aggregated FLW estimates).
• Use of literature data: Directly using data from literatureor calculating the amount of FLW based on the datareported in other publications.
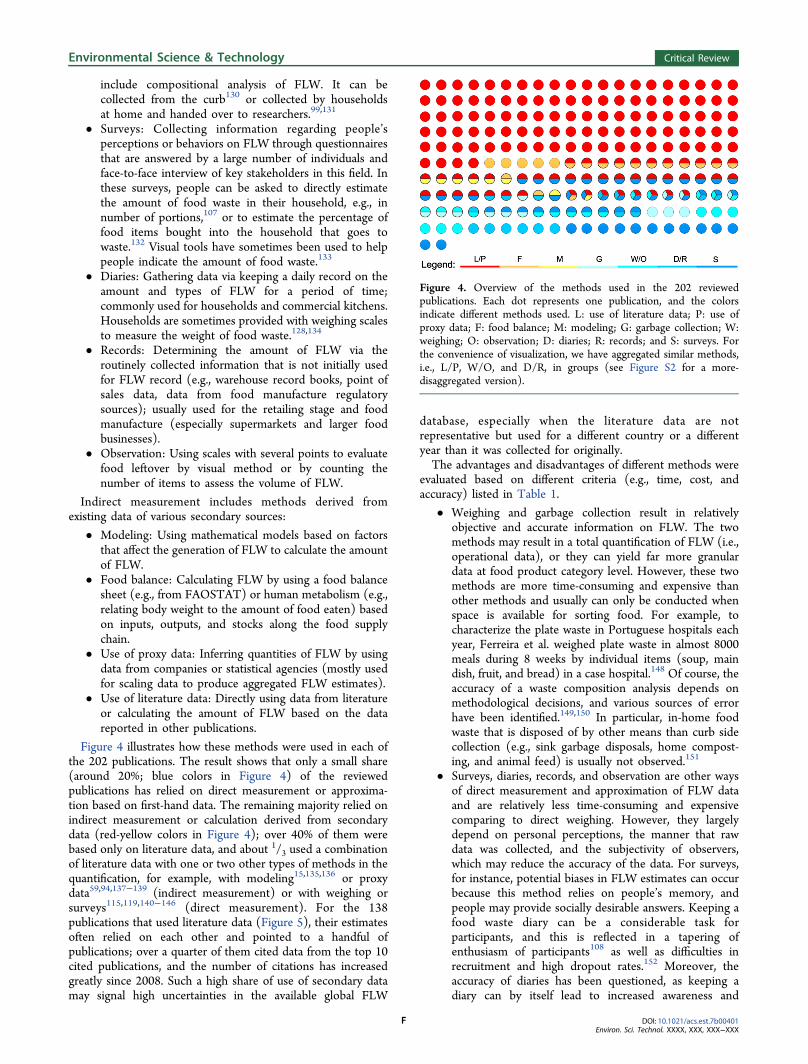
Figure 4 illustrates how these methods were used in each ofthe 202 publications. The result shows that only a small share(around 20%; blue colors in Figure 4) of the reviewedpublications has relied on direct measurement or approxima-tion based on first-hand data. The remaining majority relied onindirect measurement or calculation derived from secondarydata (red-yellow colors in Figure 4); over 40% of them werebased only on literature data, and about 1/3 used a combinationof literature data with one or two other types of methods in thequantification, for example, with modeling15,135,136 or proxydata59,94,137−139 (indirect measurement) or with weighing orsurveys115,119,140−146 (direct measurement). For the 138publications that used literature data (Figure 5), their estimatesoften relied on each other and pointed to a handful ofpublications; over a quarter of them cited data from the top 10cited publications, and the number of citations has increasedgreatly since 2008. Such a high share of use of secondary datamay signal high uncertainties in the available global FLW
database, especially when the literature data are notrepresentative but used for a different country or a differentyear than it was collected for originally.The advantages and disadvantages of different methods were
evaluated based on different criteria (e.g., time, cost, andaccuracy) listed in Table 1.
• Weighing and garbage collection result in relativelyobjective and accurate information on FLW. The twomethods may result in a total quantification of FLW (i.e.,operational data), or they can yield far more granulardata at food product category level. However, these twomethods are more time-consuming and expensive thanother methods and usually can only be conducted whenspace is available for sorting food. For example, tocharacterize the plate waste in Portuguese hospitals eachyear, Ferreira et al. weighed plate waste in almost 8000meals during 8 weeks by individual items (soup, maindish, fruit, and bread) in a case hospital.148 Of course, theaccuracy of a waste composition analysis depends onmethodological decisions, and various sources of errorhave been identified.149,150 In particular, in-home foodwaste that is disposed of by other means than curb sidecollection (e.g., sink garbage disposals, home compost-ing, and animal feed) is usually not observed.151
• Surveys, diaries, records, and observation are other waysof direct measurement and approximation of FLW dataand are relatively less time-consuming and expensivecomparing to direct weighing. However, they largelydepend on personal perceptions, the manner that rawdata was collected, and the subjectivity of observers,which may reduce the accuracy of the data. For surveys,for instance, potential biases in FLW estimates can occurbecause this method relies on people’s memory, andpeople may provide socially desirable answers. Keeping afood waste diary can be a considerable task forparticipants, and this is reflected in a tapering ofenthusiasm of participants108 as well as difficulties inrecruitment and high dropout rates.152 Moreover, theaccuracy of diaries has been questioned, as keeping adiary can by itself lead to increased awareness and
Figure 4. Overview of the methods used in the 202 reviewedpublications. Each dot represents one publication, and the colorsindicate different methods used. L: use of literature data; P: use ofproxy data; F: food balance; M: modeling; G: garbage collection; W:weighing; O: observation; D: diaries; R: records; and S: surveys. Forthe convenience of visualization, we have aggregated similar methods,i.e., L/P, W/O, and D/R, in groups (see Figure S2 for a more-disaggregated version).
Environmental Science & Technology Critical Review
DOI: 10.1021/acs.est.7b00401Environ. Sci. Technol. XXXX, XXX, XXX−XXX
F

behavioral change.108,134,152 For observation, it requiresless time than weighing but varies in accuracy andreliability. For example, Hanks and colleagues comparedthree types of observation measurements (quarter-waste,half-waste, and photograph) in a school cafeteria setting,and they found that on-site visual methods outperformedphotographs in inter-rater and intermethod reliability.153
• Indirect measurement or calculation derived fromsecondary data is more widely used due to their lowcost and high feasibility. However, these methods usuallybear higher uncertainty. For example, results frommodeling are heavily affected by the choice of modelparameters and their relationship with the quantities ofFLW. The accuracy of the food balance method dependsprimarily on the quality and comprehensiveness of thefood balance sheet data. The use of proxy data andliterature data is the easiest among all methods, but itsaccuracy depends ultimately on the quality andrepresentativeness of the source data that is used.
Arguably, no direct or indirect measurements can be all-satisfactory by themselves. The direct measurements, despitethe advantage, are commonly performed in a certaincommunity or city and a certain stage of the food supplychains involving limited number of participants, resulting in aninevitable issue of lack of representativeness (especiallyproblematic for big countries like China and the UnitedStates). The indirect measurements, on the contrary, canprovide an overall picture for the whole country or region and
for different stages. One way to go forward could be anintegrated approach of coupling direct with indirect measure-ments: statistics-based estimation of FLW at the national andregional levels to determine the magnitude of the problem(more for policy-making and strategy-setting) and first-handmeasurements at the ground level plus in-depth examination ofFLW drivers and affecting factors so as to design effectiveintervention steps.The choice of method has critical influences on the
determined amount of FLW, which sometimes leads to datadiscrepancy in the reviewed publications. For example,EUROSTAT reported that about 5.7 million tons of FLWwere generated from the manufacturing sector in Italy in2006,147 while another model-based study estimated 1.9 milliontons for the sector.74 The reason for such a significantdifference is that the two publications were based on differentdata sources and assumptions. The former included both FLWand byproducts that were reused and recycled, while the latterone depended on the loss share of the manufacturing stage andmethodologies reported by FAO.9,154 As another example,Zhou reported that the wasted amount of wheat, maize, andvegetables were 4.2, 4.9 and, 4.3 million tons in the early 1980sin China, respectively,155 whereas Smil estimated the wastedquantity of these three food types as 1.9, 2.0, and 10.9 milliontons, respectively.156 This discrepancy can be explained by thefact that the data source of the former publication was theFAOSTAT food balance sheet, whereas the latter was based on
Figure 5. Citation network of the 138 publications that used literature data. Each dot represents a publication. The size of the dot indicates thenumber of citations, and the arrow represents the direction of citation. The dots in white on the right denote publications outside the citationnetwork. The top 10 cited publications are 1, Kantor et al., 1997;41 2a, WRAP, 2009;26 2b, Gustavsson et al., 2011;9 3a, WRAP, 2008;25 3b, Monieret al., 2010;147 3c, Buzby and Hyman, 2012;52 4a, Kader, 2005;79 4b, Kranert et al., 2012;121 5a, Buzby et al., 2009;20 and 5b, Langley et al., 2010.108
Environmental Science & Technology Critical Review
DOI: 10.1021/acs.est.7b00401Environ. Sci. Technol. XXXX, XXX, XXX−XXX
G
various literature data and assumed cereal waste at 4% andvegetable waste at 10%.3.3. Statistical Analysis of FLW Data. Farm Losses and
Waste. In general, farm FLW in agricultural production in low-income countries is higher than that in medium- and high-income countries because the former countries usually have lessadvanced technology and infrastructure in harvest processing.For example, it was estimated that FLW during agriculturalproduction accounts for 13% of the total FLW along the wholesupply chain in Canada,93 whereas this stage made up thelargest share (26%) of the overall FLW in South Africa.162
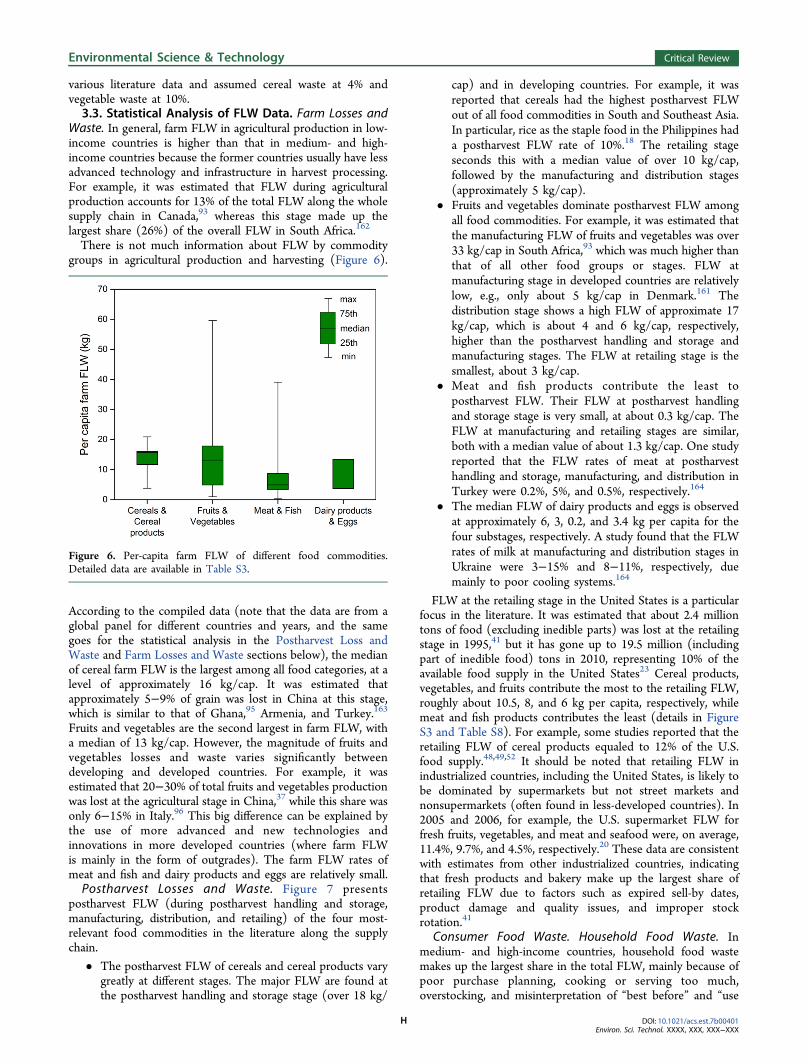
There is not much information about FLW by commoditygroups in agricultural production and harvesting (Figure 6).
According to the compiled data (note that the data are from aglobal panel for different countries and years, and the samegoes for the statistical analysis in the Postharvest Loss andWaste and Farm Losses and Waste sections below), the medianof cereal farm FLW is the largest among all food categories, at alevel of approximately 16 kg/cap. It was estimated thatapproximately 5−9% of grain was lost in China at this stage,which is similar to that of Ghana,95 Armenia, and Turkey.163
Fruits and vegetables are the second largest in farm FLW, witha median of 13 kg/cap. However, the magnitude of fruits andvegetables losses and waste varies significantly betweendeveloping and developed countries. For example, it wasestimated that 20−30% of total fruits and vegetables productionwas lost at the agricultural stage in China,37 while this share wasonly 6−15% in Italy.96 This big difference can be explained bythe use of more advanced and new technologies andinnovations in more developed countries (where farm FLWis mainly in the form of outgrades). The farm FLW rates ofmeat and fish and dairy products and eggs are relatively small.Postharvest Losses and Waste. Figure 7 presents
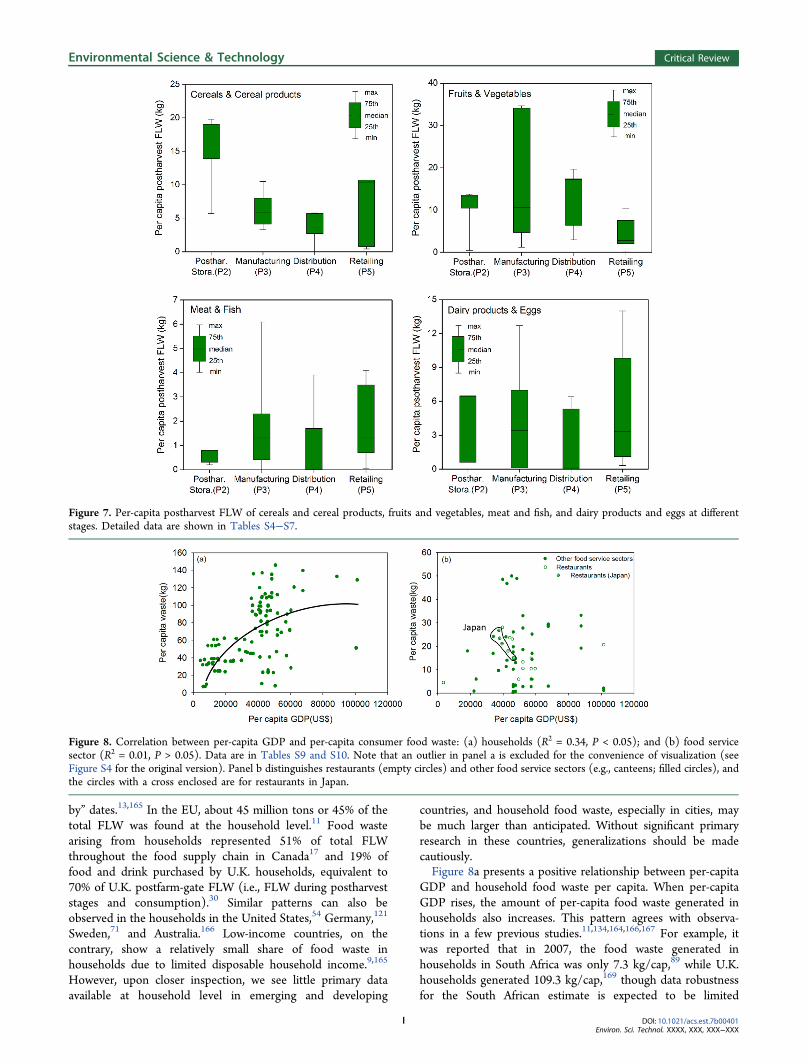
postharvest FLW (during postharvest handling and storage,manufacturing, distribution, and retailing) of the four most-relevant food commodities in the literature along the supplychain.
• The postharvest FLW of cereals and cereal products varygreatly at different stages. The major FLW are found atthe postharvest handling and storage stage (over 18 kg/
cap) and in developing countries. For example, it wasreported that cereals had the highest postharvest FLWout of all food commodities in South and Southeast Asia.In particular, rice as the staple food in the Philippines hada postharvest FLW rate of 10%.18 The retailing stageseconds this with a median value of over 10 kg/cap,followed by the manufacturing and distribution stages(approximately 5 kg/cap).
• Fruits and vegetables dominate postharvest FLW amongall food commodities. For example, it was estimated thatthe manufacturing FLW of fruits and vegetables was over33 kg/cap in South Africa,93 which was much higher thanthat of all other food groups or stages. FLW atmanufacturing stage in developed countries are relativelylow, e.g., only about 5 kg/cap in Denmark.161 Thedistribution stage shows a high FLW of approximate 17kg/cap, which is about 4 and 6 kg/cap, respectively,higher than the postharvest handling and storage andmanufacturing stages. The FLW at retailing stage is thesmallest, about 3 kg/cap.
• Meat and fish products contribute the least topostharvest FLW. Their FLW at postharvest handlingand storage stage is very small, at about 0.3 kg/cap. TheFLW at manufacturing and retailing stages are similar,both with a median value of about 1.3 kg/cap. One studyreported that the FLW rates of meat at postharvesthandling and storage, manufacturing, and distribution inTurkey were 0.2%, 5%, and 0.5%, respectively.164
• The median FLW of dairy products and eggs is observedat approximately 6, 3, 0.2, and 3.4 kg per capita for thefour substages, respectively. A study found that the FLWrates of milk at manufacturing and distribution stages inUkraine were 3−15% and 8−11%, respectively, duemainly to poor cooling systems.164
FLW at the retailing stage in the United States is a particularfocus in the literature. It was estimated that about 2.4 milliontons of food (excluding inedible parts) was lost at the retailingstage in 1995,41 but it has gone up to 19.5 million (includingpart of inedible food) tons in 2010, representing 10% of theavailable food supply in the United States23 Cereal products,vegetables, and fruits contribute the most to the retailing FLW,roughly about 10.5, 8, and 6 kg per capita, respectively, whilemeat and fish products contributes the least (details in FigureS3 and Table S8). For example, some studies reported that theretailing FLW of cereal products equaled to 12% of the U.S.food supply.48,49,52 It should be noted that retailing FLW inindustrialized countries, including the United States, is likely tobe dominated by supermarkets but not street markets andnonsupermarkets (often found in less-developed countries). In2005 and 2006, for example, the U.S. supermarket FLW forfresh fruits, vegetables, and meat and seafood were, on average,11.4%, 9.7%, and 4.5%, respectively.20 These data are consistentwith estimates from other industrialized countries, indicatingthat fresh products and bakery make up the largest share ofretailing FLW due to factors such as expired sell-by dates,product damage and quality issues, and improper stockrotation.41
Consumer Food Waste. Household Food Waste. Inmedium- and high-income countries, household food wastemakes up the largest share in the total FLW, mainly because ofpoor purchase planning, cooking or serving too much,overstocking, and misinterpretation of “best before” and “use
Figure 6. Per-capita farm FLW of different food commodities.Detailed data are available in Table S3.
Environmental Science & Technology Critical Review
DOI: 10.1021/acs.est.7b00401Environ. Sci. Technol. XXXX, XXX, XXX−XXX
H
by” dates.13,165 In the EU, about 45 million tons or 45% of thetotal FLW was found at the household level.11 Food wastearising from households represented 51% of total FLWthroughout the food supply chain in Canada17 and 19% offood and drink purchased by U.K. households, equivalent to70% of U.K. postfarm-gate FLW (i.e., FLW during postharveststages and consumption).30 Similar patterns can also beobserved in the households in the United States,54 Germany,121
Sweden,71 and Australia.166 Low-income countries, on thecontrary, show a relatively small share of food waste inhouseholds due to limited disposable household income.9,165
However, upon closer inspection, we see little primary dataavailable at household level in emerging and developing
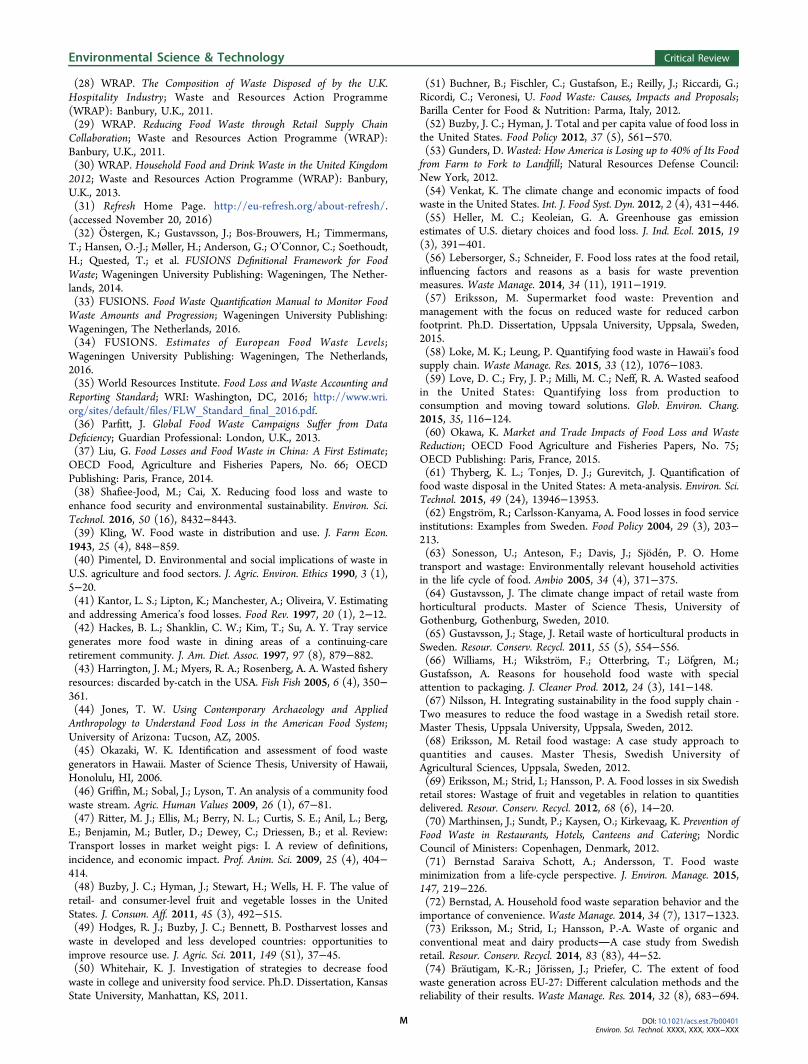
countries, and household food waste, especially in cities, maybe much larger than anticipated. Without significant primaryresearch in these countries, generalizations should be madecautiously.Figure 8a presents a positive relationship between per-capita
GDP and household food waste per capita. When per-capitaGDP rises, the amount of per-capita food waste generated inhouseholds also increases. This pattern agrees with observa-tions in a few previous studies.11,134,164,166,167 For example, itwas reported that in 2007, the food waste generated inhouseholds in South Africa was only 7.3 kg/cap,89 while U.K.households generated 109.3 kg/cap,169 though data robustnessfor the South African estimate is expected to be limited
Figure 7. Per-capita postharvest FLW of cereals and cereal products, fruits and vegetables, meat and fish, and dairy products and eggs at differentstages. Detailed data are shown in Tables S4−S7.
Figure 8. Correlation between per-capita GDP and per-capita consumer food waste: (a) households (R2 = 0.34, P < 0.05); and (b) food servicesector (R2 = 0.01, P > 0.05). Data are in Tables S9 and S10. Note that an outlier in panel a is excluded for the convenience of visualization (seeFigure S4 for the original version). Panel b distinguishes restaurants (empty circles) and other food service sectors (e.g., canteens; filled circles), andthe circles with a cross enclosed are for restaurants in Japan.
Environmental Science & Technology Critical Review
DOI: 10.1021/acs.est.7b00401Environ. Sci. Technol. XXXX, XXX, XXX−XXX
I

(extrapolated from Sub-Saharan estimates, which are lesswealthy and industrialized than South Africa).However, it is interesting to observe that, when per-capita
GDP gets higher than a certain level (roughly 50 000 USD),per-capita food waste generation tends to level off. This mightreflect the increasing awareness of the public, food wasteprevention campaigns, stricter regulation (e.g., clearer labelingand longer shelf life), and effect of market mechanisms (e.g.,increasing cost of food purchase and food waste disposal). Forexample, campaigns such as “Zero Waste” and “Love FoodHate Waste” have been taken against food waste inAustralia168,170 and the United Kingdom.26,171 This may alsorelate to higher consumption of prepared meals and lesscooking from scratch (which may transfer food waste fromhousehold kitchen to food manufacturing to some extent) inmore-affluent countries and the fact that waste generation dataare based on the management of waste (which is generallymuch higher in more-affluent countries).Out-of-Home Food Waste. A number of studies have
estimated how much food has been wasted away from home,i.e., in the food service industry, which is defined as a sectorresponsible for preparing or serving food outside home,85,129
including, for example, restaurants,62,126,129,145,172 can-teens,126,161 schools,19,46,157,173−175 hospitals,45,101,110,148,159
care centers,42,129 military institutions,82 transport hubs, andin-flight catering.80,176
The research on food waste in the food service sector hasmostly been conducted in industrialized countries. For example,it was estimated that 0.92 million tons of food was wasted inthe food service outlets each year in the United Kingdom(equivalent to 17% of all meals served), 75% of which wasavoidable.85 In Germany, the food service sector accounted for17% (the second largest source) of total FLW along the supplychain.121 In Finland, 0.075−0.085 million tons of food waswasted in food service, which was the third largest contributorof FLW (20%) following households (35%) and food industry
(27%).126 It should be noted that China, as the largestemerging economy in the world, was also experiencing a highlevel of food waste in the catering and restaurant sector,accounting for about 11−17% of all food served.37
On the whole, food waste per capita at away-from-homeconsumption is lower than that in households (Figure 8b). It isassumed that with higher per-capita GDP and living standards,people tend to consume more food outside the home, whichmay consequently result in a larger amount of food waste dueto various reasons (e.g., oversized dishes and taste). Yet thecorrelation between per-capita GDP and per-capita food wasteout-of-home appears insignificant. The reason may be that thefood service sector is varied and includes both the “for profit”(e.g., restaurant) and “cost” (e.g., care center) parts, leading to amixed pattern of food waste generation. Interestingly,restaurant food waste in Japan shows a declining pattern inrecent years (the circles with a cross in Figure 8b). This may bepartly explained by the impact of the implementation of theFood Recycling Law (which is to reduce food waste generationby introducing specific targets for industry sectors) in Japan inMay 2001, which contributed to a reduction of out-of-homefood waste from 3.1 million tons in 2007 to 1.92 million tons in2012. Accordingly, food waste per capita decreased from 24.22to 15.05 kg in Japan.85
In Figure 9, we take cereals and the United States, China, andSouth Africa as examples of industrialized, emerging, anddeveloping countries to illustrate how the FLWR at differentstages along the supply chain evolves at different developmentlevels of an economy.
• As the United States is a highly industrialized country,there are few data on its FLWR of cereals at postharveststages (it can also be assumed to be low). The FLWR atagricultural production, postharvest handling and storage,manufacturing, and distribution stages in South Africa areall higher than those in China. This reflects the fact thatwith increasing awareness and growing economy, more-
Figure 9. FLWR of cereals along the supply chain in the United States, China, and South Africa. The vertical chart on the left represents per-capitaGDP in current USD in 2015 for these three countries (according to the World Bank). P1: agricultural production and harvesting; P2: postharvesthandling and storage; P3: manufacturing; P4: distribution; P5: retailing; and P6: consumption. N.A. means not available. The reference flow isassumed to be a fictive output of 100% of the amount produced. Due to a lack of FLW percentage for each stage in South Africa, the average amountof waste reported between 2007 and 2009 was divided by the average quantity of production during the same period to calculate the FLWR.
Environmental Science & Technology Critical Review
DOI: 10.1021/acs.est.7b00401Environ. Sci. Technol. XXXX, XXX, XXX−XXX
J

advanced harvesting technologies and more-efficientstorage systems are applied in agricultural production,and improved transportation with large volumes andrelatively low costs are largely used in China.136 This alsoimplies a huge potential of improving the technologiesand infrastructure in less-developed countries as anefficient way to reduce FLW.
• The consumer cereal waste also increases as a countrydevelops and increases its GDP. The FLWR of cereals atconsumption stage in the United States is the highest(15.8%), followed by the retailing stage (12%). In China,with rapid economic development and householdincome increase, the FLWR of cereals at the con-sumption stage has increased in recent years to 6.4%,higher than that of all other stages. As a lower-incomecountry, South Africa shows a low FLWR of cereals atconsumer stage yet (1.1%). It should be noted that,because the production and consumption structure ofcereals (in terms of rice, wheat, maize, other cereals, andbakery products) varies in different countries, it can be afactor behind these differences as well.
3.4. Data Gaps and Recommendations for FutureStudy. Our review suggests that the quantification of FLW hasbecome a research hotspot in recent years, with over 60% ofFLW data reported for the recent decade. Whereas thesegrowing efforts provide an order-of-magnitude understandingof the scale of global FLW and for a few countries (e.g., theUnited States and the United Kingdom) and stages in the foodsupply chain (e.g., household), the extent of FLW in manyother countries and stages remains poorly understood. Theexisting data are also often based on secondary sources (overhalf of the reviewed publications) and outdated or inconsistentdata sources (e.g., due to choice of method). Moreover, in linewith the First Principle of Food Waste proposed by Rathje,134
the potential for waste is expected to increase with continuingurbanization, increasing household income, and growingdemand for more perishable foods. Yet the FLW data gapsand deficiencies are most-significant for those countries andregions that have undergone the most-rapid shifts away fromstarchy staples toward more varied and fresh diets (e.g., Chinaand India).36 Therefore, the existing global FLW data should beused and interpreted with care.To address these data gaps, we highlight the following
directions for future study:
• First, the systems and methodologies for FLWquantification should be standardized, as is alreadyhighlighted in the literature. Important aspects to beconsidered include: the definition of FLW (e.g.,questions regarding avoidable versus unavoidable foodwaste),177 stages of the food supply chain (e.g., differentsegments in distribution and consumption), destinationof FLW (e.g., donation, feed, energy use, or landfill),classification of food commodities and conversion factors(e.g., factor to convert cooked food items to raw foodmaterials), units of measurement (e.g., physical weight orcalories), and the methods of measurement (cf. section3.2 above). This would enable the comparison of existingdata across countries, commodities, and food supplychains, which would further help explore patterns anddriving factors of FLW generation. For example, theEuropean FUSIONS project released a food wastequantification manual32 in 2016; the first global Food
Loss and Waste Protocol35 published in 2016 provides astandard that can be used by any entity (e.g., a country, acompany, a city, or an individual store or food outlet)and should be promoted more widely.
• Second, more data based on direct measurement arebadly needed. Our review shows that only around 20% ofthe existing publications on FLW quantification are basedon first-hand data, and any quotation of unrepresentativedata from literature may lead to high uncertainties.Despite the higher time, labor, and economic cost, morefield work and primary data collection should beencouraged and would help verify existing data, improvethe accuracy and reliability of the data, and fill in the gapsin countries where data are currently not available.
• Third, more attention should be paid to countriesoutside the current focus area (the United States andEurope), especially to big developing and emergingeconomies (e.g., the BRICs: Brazil, Russia, India, China,and South Africa). There is less information regardingFLW in those countries, but the scale may be significant(e.g., a preliminary study37 shows that consumer foodwaste in China is already higher than that of the total ofEU-27). These countries are also experiencing a rapidshift in terms of dietary change, urbanization, andhousehold income increase, and thus, their FLW isexpected to grow in the coming years. The use ofoutdated data may have led to an overestimation ofagricultural FLW and underestimation of consumer foodwaste in developing countries.37,78 Social and culturalcontext are also very important for FLW quantificationand mitigation, which can only be addressed when moredata for specific countries and cultures are available.
• Fourth, more in-depth analyses on FLW at different foodsupply stages should be conducted. Household foodwaste is a clear current focus (covered in almost half ofthe reviewed publications, though almost exclusively indeveloped countries). Research should be expanded tofood supply chains with less data and poorer under-standing, e.g., FLW in other segments during out-of-home consumption (e.g., canteens and restaurants) andpostharvest and retailing in developing countries. Amore-detailed quantification at each stage would alsohelp a better understanding of the driving factors of FLWat different stages.
• Fifth, consistent databases (global, regional, and na-tional) using a common reporting framework on FLWshould be established, maintained, and made available tothe public, with joint efforts from all stakeholders alongthe entire food chain. Such databases would provide abaseline for monitoring the progress of FLW reduction,which is important for tracking progress toward SDGTarget 12.3, and national political targets on FLW.Governmental and nongovernmental organizations suchas UN Environment and FAO and national statisticalagencies should take a stronger leadership in this effort(the data series reported by WRAP and USDA-ERS aregood examples). Companies should be encouraged toreport their FLW regularly (e.g., in their annual corporatesocial responsibility report). In the long run, the“measurable, reportable, and verifiable (MRV)” principlethat is widely acknowledged in greenhouse gas emissionsreduction targets may be appropriate for tracking FLWreduction.
Environmental Science & Technology Critical Review
DOI: 10.1021/acs.est.7b00401Environ. Sci. Technol. XXXX, XXX, XXX−XXX
K

• Last but not least, quantification of FLW is only a firststep; the aim of better data measurement and monitoringis to help better-understand the social, economic, andenvironmental impacts of FLW, identify hotspots whereactions should be prioritized, develop long-termscenarios to inform relevant policy-making, understandwhich policies and strategies have been most-effective atachieving FLW reductions, and contribute overall to thereduction of FLW and the sustainability of the foodsystem. Research focusing on these topics shouldnaturally be conducted in parallel.
■ ASSOCIATED CONTENT*S Supporting InformationThe Supporting Information is available free of charge on theACS Publications website at DOI: 10.1021/acs.est.7b00401.
Additional details on the literature selection. Figuresshowing temporal trends, an overview of methods, per-capita FLW, and experimental relationships. Tablesshowing metadata used in the paper. (PDF)A table showing compiled food losses and food wastedata reported in the reviewed publications (by physicalweight). (XLSX)
■ AUTHOR INFORMATIONCorresponding Author*Phone: 45-65509441; e-mail: [email protected] Liu: 0000-0002-7613-1985NotesThe authors declare no competing financial interest.
■ ACKNOWLEDGMENTSThis work is funded by National Natural Science Foundation ofChina (key program, project no. 71233007), National KeyResearch and Development Plan of China (project no.2016YFE0113100), and the Danish Agency for Science,Technology and Innovation (International Network Pro-gramme, reference nos. 5132-00029B and 6144-00036). Wethank Yao Liu for research assistance.
■ REFERENCES(1) The Economist Intelligence Unit. Food Loss and Its Intersectionwith Food Security; EIU: London, United Kingdom, 2014; http://www.eiu.com/public/topical_report.aspx?campaignid=foodloss14.(2) FAO. Food Wastage Footprint: Impacts on Natural Resources;FAO: Rome, Italy, 2013.(3) Katajajuuri, J. M.; Silvennoinen, K.; Hartikainen, H.; Jalkanen, L.;Koivupuro, H. K.; Reinikainen, A. Food waste in the food chain andrelated climate impacts. In Proceedings of the 8th InternationalConference on Life Cycle Assessment in the Agri-Food Sector (LCA Food2012); Corson, M. S.; van der Werf, H. M. G., Eds.; INRA: Rennes,France, 2012; pp 627−632.(4) Pham, T. P. T.; Kaushik, R.; Parshetti, G. K.; Mahmood, R.;Balasubramanian, R. Food-waste-to-energy conversion technologies:Current status and future directions. Waste Manage. 2015, 38, 399−408.(5) United Nations. United Nations Sustainability Development GoalsHome Page. http://www.un.org/sustainabledevelopment/sustainable-consumption-production/ (accessed November 20, 2016).(6) European Commission Food Safety Home Page; http://ec.europa.eu/food/safety/food_waste/eu_actions_en/ (accessed January11, 2017).
(7) United States Department of Agriculture. USDA and EPA Joinwith Private Sector, Charitable Organizations to Set Nation's First FoodWaste Reduction Goals. https://www.usda.gov/media/press-releases/2015/09/16/usda-and-epa- jo in-pr ivate -sector-char i tab le -organizations-set (accessed November 20, 2016).(8) Lipinski, B.; O’Connor, C.; Hanson, C. SDG Target 12.3 on FoodLoss and Waste: 2016 Progress Report; Champions 12.3: The Hague,The Netherlands, 2016; https://champs123blog.files.wordpress.com/2016/09/sdg-target-12-3-progress-report_2016.pdf.(9) Gustavsson, J.; Cederberg, C.; Sonesson, U.; Otterdijk, R.; vanMeybeck, A. Global Food Losses and Food Waste: Extent, Causes andPrevention; FAO: Rome, Italy, 2011.(10) FAO. Food Wastage Footprint & Climate Change; FAO: Rome,Italy, 2015.(11) FUSIONS. Food Waste Data Set for EU-28; WageningenUniversity Publishing: Wageningen, The Netherlands, 2015.(12) WRAP. Household Food and Drink Waste: A Product Focus;Waste & Resources Action Programme (WRAP): Banbury, U.K.,2014.(13) Gjerris, M.; Gaiani, S. Household food waste in Nordiccountries: Estimations and ethical implications. Nord. J. Appl. Ethics2013, 7 (1), 6−23.(14) Beretta, C.; Stoessel, F.; Baier, U.; Hellweg, S. Quantifying foodlosses and the potential for reduction in Switzerland. Waste Manage.2013, 33 (3), 764−773.(15) Hall, K. D.; Guo, J.; Dore, M.; Chow, C. C. The Progressiveincrease of food waste in America and its environmental impact. PLoSOne 2009, 4 (11), e7940.(16) Verghese, K.; Lewis, H.; Lockrey, S.; Williams, H. The Role ofPackaging in Minimising Food Waste in the Supply Chain of the Future;RMIT University: Melbourne, 2013.(17) Gooch, M.; Felfel, A.; Marenick, N. Food Waste in Canada;Value Chain Management Centre: Oakville, Ontario, 2010.(18) FAO. Mitigation of Food Wastage: Societal Costs and Benefits;FAO: Rome, Italy, 2014.(19) Buzby, J. C.; Guthrie, J. F. Plate Waste in School NutritionPrograms: Final Report to Congress; Economic Research Service EFAN-02-009, United States Department of Agriculture: Washington,DC, 2002.(20) Buzby, J. C.; Wells, H. F.; Axtman, B.; Mickey, J. SupermarketLoss Estimates for Fresh Fruit, Vegetables, Meat, Poultry, and Seafood andTheir Use in the ERS Loss-Adjusted Food Availability Data; EconomicInformation Bulletin Number 44, Economic Research Service; UnitedStates Deparment of Agricuture: Washington, DC, 2009.(21) Muth, M. K.; Karns, S. A.; Nielsen, S. J.; Buzby, J. C.; Wells, H.F. Consumer-Level Food Loss Estimates and Their Use in the ERS Loss-Adjusted Food Availability Data; Technical Bulletin No. 1927,Economic Research Service; United States Department of Agriculture:Washington, DC, 2011.(22) Buzby, J. C.; Wells, H. F.; Aulakh, J. Food Loss: Questions aboutthe Amount and Causes Still Remain; United States Department ofAgriculture: Washington, DC, 2014.(23) Buzby, J. C.; Wells, H. F.; Hyman, J. The Estimated Amount,Value, and Calories of Postharvest Food Losses at the Retail and ConsumerLevels in the United Statess; Economic Information Bulletin, EIB-121;United States Deparment of Agricuture: Washington, DC, 2014.(24) WRAP. Understanding Food Waste - Key Findings of WRAP’sRecent Research on the Nature, Scale And Causes of Household FoodWaste; Waste & Resources Action Programme (WRAP): Banbury,U.K., 2007.(25) WRAP. The Food We Waste; Waste and Resources ActionProgramme (WRAP): Banbury, U.K., 2008.(26) WRAP. Household Food and Drink Waste in the U.K. (2009);Waste and Resources Action Programme (WRAP): Banbury, U.K.,2009.(27) WRAP. New Estimates for Household Food and Drink Waste in theU.K.; Waste and Resources Action Programme (WRAP): Banbury,U.K., 2011.
Environmental Science & Technology Critical Review
DOI: 10.1021/acs.est.7b00401Environ. Sci. Technol. XXXX, XXX, XXX−XXX
L
(28) WRAP. The Composition of Waste Disposed of by the U.K.Hospitality Industry; Waste and Resources Action Programme(WRAP): Banbury, U.K., 2011.(29) WRAP. Reducing Food Waste through Retail Supply ChainCollaboration; Waste and Resources Action Programme (WRAP):Banbury, U.K., 2011.(30) WRAP. Household Food and Drink Waste in the United Kingdom2012; Waste and Resources Action Programme (WRAP): Banbury,U.K., 2013.(31) Refresh Home Page. http://eu-refresh.org/about-refresh/.(accessed November 20, 2016)(32) Ostergen, K.; Gustavsson, J.; Bos-Brouwers, H.; Timmermans,T.; Hansen, O.-J.; Møller, H.; Anderson, G.; O’Connor, C.; Soethoudt,H.; Quested, T.; et al. FUSIONS Definitional Framework for FoodWaste; Wageningen University Publishing: Wageningen, The Nether-lands, 2014.(33) FUSIONS. Food Waste Quantification Manual to Monitor FoodWaste Amounts and Progression; Wageningen University Publishing:Wageningen, The Netherlands, 2016.(34) FUSIONS. Estimates of European Food Waste Levels;Wageningen University Publishing: Wageningen, The Netherlands,2016.(35) World Resources Institute. Food Loss and Waste Accounting andReporting Standard; WRI: Washington, DC, 2016; http://www.wri.org/sites/default/files/FLW_Standard_final_2016.pdf.(36) Parfitt, J. Global Food Waste Campaigns Suffer from DataDeficiency; Guardian Professional: London, U.K., 2013.(37) Liu, G. Food Losses and Food Waste in China: A First Estimate;OECD Food, Agriculture and Fisheries Papers, No. 66; OECDPublishing: Paris, France, 2014.(38) Shafiee-Jood, M.; Cai, X. Reducing food loss and waste toenhance food security and environmental sustainability. Environ. Sci.Technol. 2016, 50 (16), 8432−8443.(39) Kling, W. Food waste in distribution and use. J. Farm Econ.1943, 25 (4), 848−859.(40) Pimentel, D. Environmental and social implications of waste inU.S. agriculture and food sectors. J. Agric. Environ. Ethics 1990, 3 (1),5−20.(41) Kantor, L. S.; Lipton, K.; Manchester, A.; Oliveira, V. Estimatingand addressing America’s food losses. Food Rev. 1997, 20 (1), 2−12.(42) Hackes, B. L.; Shanklin, C. W.; Kim, T.; Su, A. Y. Tray servicegenerates more food waste in dining areas of a continuing-careretirement community. J. Am. Diet. Assoc. 1997, 97 (8), 879−882.(43) Harrington, J. M.; Myers, R. A.; Rosenberg, A. A. Wasted fisheryresources: discarded by-catch in the USA. Fish Fish 2005, 6 (4), 350−361.(44) Jones, T. W. Using Contemporary Archaeology and AppliedAnthropology to Understand Food Loss in the American Food System;University of Arizona: Tucson, AZ, 2005.(45) Okazaki, W. K. Identification and assessment of food wastegenerators in Hawaii. Master of Science Thesis, University of Hawaii,Honolulu, HI, 2006.(46) Griffin, M.; Sobal, J.; Lyson, T. An analysis of a community foodwaste stream. Agric. Human Values 2009, 26 (1), 67−81.(47) Ritter, M. J.; Ellis, M.; Berry, N. L.; Curtis, S. E.; Anil, L.; Berg,E.; Benjamin, M.; Butler, D.; Dewey, C.; Driessen, B.; et al. Review:Transport losses in market weight pigs: I. A review of definitions,incidence, and economic impact. Prof. Anim. Sci. 2009, 25 (4), 404−414.(48) Buzby, J. C.; Hyman, J.; Stewart, H.; Wells, H. F. The value ofretail- and consumer-level fruit and vegetable losses in the UnitedStates. J. Consum. Aff. 2011, 45 (3), 492−515.(49) Hodges, R. J.; Buzby, J. C.; Bennett, B. Postharvest losses andwaste in developed and less developed countries: opportunities toimprove resource use. J. Agric. Sci. 2011, 149 (S1), 37−45.(50) Whitehair, K. J. Investigation of strategies to decrease foodwaste in college and university food service. Ph.D. Dissertation, KansasState University, Manhattan, KS, 2011.
(51) Buchner, B.; Fischler, C.; Gustafson, E.; Reilly, J.; Riccardi, G.;Ricordi, C.; Veronesi, U. Food Waste: Causes, Impacts and Proposals;Barilla Center for Food & Nutrition: Parma, Italy, 2012.(52) Buzby, J. C.; Hyman, J. Total and per capita value of food loss inthe United States. Food Policy 2012, 37 (5), 561−570.(53) Gunders, D.Wasted: How America is Losing up to 40% of Its Foodfrom Farm to Fork to Landfill; Natural Resources Defense Council:New York, 2012.(54) Venkat, K. The climate change and economic impacts of foodwaste in the United States. Int. J. Food Syst. Dyn. 2012, 2 (4), 431−446.(55) Heller, M. C.; Keoleian, G. A. Greenhouse gas emissionestimates of U.S. dietary choices and food loss. J. Ind. Ecol. 2015, 19(3), 391−401.(56) Lebersorger, S.; Schneider, F. Food loss rates at the food retail,influencing factors and reasons as a basis for waste preventionmeasures. Waste Manage. 2014, 34 (11), 1911−1919.(57) Eriksson, M. Supermarket food waste: Prevention andmanagement with the focus on reduced waste for reduced carbonfootprint. Ph.D. Dissertation, Uppsala University, Uppsala, Sweden,2015.(58) Loke, M. K.; Leung, P. Quantifying food waste in Hawaii’s foodsupply chain. Waste Manage. Res. 2015, 33 (12), 1076−1083.(59) Love, D. C.; Fry, J. P.; Milli, M. C.; Neff, R. A. Wasted seafoodin the United States: Quantifying loss from production toconsumption and moving toward solutions. Glob. Environ. Chang.2015, 35, 116−124.(60) Okawa, K. Market and Trade Impacts of Food Loss and WasteReduction; OECD Food Agriculture and Fisheries Papers, No. 75;OECD Publishing: Paris, France, 2015.(61) Thyberg, K. L.; Tonjes, D. J.; Gurevitch, J. Quantification offood waste disposal in the United States: A meta-analysis. Environ. Sci.Technol. 2015, 49 (24), 13946−13953.(62) Engstrom, R.; Carlsson-Kanyama, A. Food losses in food serviceinstitutions: Examples from Sweden. Food Policy 2004, 29 (3), 203−213.(63) Sonesson, U.; Anteson, F.; Davis, J.; Sjoden, P. O. Hometransport and wastage: Environmentally relevant household activitiesin the life cycle of food. Ambio 2005, 34 (4), 371−375.(64) Gustavsson, J. The climate change impact of retail waste fromhorticultural products. Master of Science Thesis, University ofGothenburg, Gothenburg, Sweden, 2010.(65) Gustavsson, J.; Stage, J. Retail waste of horticultural products inSweden. Resour. Conserv. Recycl. 2011, 55 (5), 554−556.(66) Williams, H.; Wikstrom, F.; Otterbring, T.; Lofgren, M.;Gustafsson, A. Reasons for household food waste with specialattention to packaging. J. Cleaner Prod. 2012, 24 (3), 141−148.(67) Nilsson, H. Integrating sustainability in the food supply chain -Two measures to reduce the food wastage in a Swedish retail store.Master Thesis, Uppsala University, Uppsala, Sweden, 2012.(68) Eriksson, M. Retail food wastage: A case study approach toquantities and causes. Master Thesis, Swedish University ofAgricultural Sciences, Uppsala, Sweden, 2012.(69) Eriksson, M.; Strid, I.; Hansson, P. A. Food losses in six Swedishretail stores: Wastage of fruit and vegetables in relation to quantitiesdelivered. Resour. Conserv. Recycl. 2012, 68 (6), 14−20.(70) Marthinsen, J.; Sundt, P.; Kaysen, O.; Kirkevaag, K. Prevention ofFood Waste in Restaurants, Hotels, Canteens and Catering; NordicCouncil of Ministers: Copenhagen, Denmark, 2012.(71) Bernstad Saraiva Schott, A.; Andersson, T. Food wasteminimization from a life-cycle perspective. J. Environ. Manage. 2015,147, 219−226.(72) Bernstad, A. Household food waste separation behavior and theimportance of convenience. Waste Manage. 2014, 34 (7), 1317−1323.(73) Eriksson, M.; Strid, I.; Hansson, P.-A. Waste of organic andconventional meat and dairy productsA case study from Swedishretail. Resour. Conserv. Recycl. 2014, 83 (83), 44−52.(74) Brautigam, K.-R.; Jorissen, J.; Priefer, C. The extent of foodwaste generation across EU-27: Different calculation methods and thereliability of their results. Waste Manage. Res. 2014, 32 (8), 683−694.
Environmental Science & Technology Critical Review
DOI: 10.1021/acs.est.7b00401Environ. Sci. Technol. XXXX, XXX, XXX−XXX
M
(75) Zhou, Z. Food waste in retailing stores in Sweden: A welfaresimulation analysis. Master Thesis, University of Gothenburg,Gothenburg, Sweden, 2014.(76) Filho, W. L.; Kovaleva, M. Food Waste and Sustainable FoodWaste Management in the Baltic Sea Region; Hamburg University ofApplied Sciences: Hamburg, Germany, 2015.(77) Choudhury, M. L. Recent developments in reducing postharvestlosses in the Asia-Pacific region. In Postharvest Management of Fruit andVegetables in the Asia-Pacific Region; Rolle, R. S., Ed.; Asian ProductivityOrganization: Tokyo, Japan, 2006.(78) Parfitt, J.; Barthel, M.; Macnaughton, S. Food waste within foodsupply chains: Quantification and potential for change to 2050. Philos.Trans. R. Soc., B 2010, 365 (1554), 3065−3081.(79) Kader, A. A. Increasing food availability by reducing postharvestlosses of fresh produce. Acta Hortic. 2005, 682, 2169−2175.(80) El-Mobaidh, A. M.; Razek Taha, M. A.; Lassheen, N. K.Classification of in-flight catering wastes in Egypt air flights and itspotential as energy source (chemical approach). Waste Manage. 2006,26 (6), 587−591.(81) Parfitt, J.; Barthel, M. Global Food Waste Reduction: Priorities fora World in Transition; U.K. Government’s Foresight Project on GlobalFood and Farming Futures: London, U.K., 2011.(82) Davies, T.; Konisky, D. M. Environmental Implications of theFoodservice and Food Retail Industries; Resources for the Future:Washington, DC, 2000.(83) Fehr, M.; Romao, D. C. Measurement of fruit and vegetablelosses in Brazil: a case study. Environ. Dev. Sustain. 2001, 3 (3), 253−263.(84) Stenmarck, Å.; Hanssen, O. J.; Silvennoinen, K.; Katajajuuri, J.-M.; Werge, M. Initiatives on Prevention of Food Waste in the Retail andWholesale Trades; Nordic Council of Ministers: Copenhagen, Den-mark, 2011.(85) Parry, A.; Bleazard, P.; Okawa, K. Preventing Food Waste: CaseStudies of Japan and the United Kingdom; OECD Food Agriculture &Fisheries Papers, No. 76; OECD Publishing: Paris, France, 2015.(86) Kachru, R. P.; General, A. D. Status of the Post-Harvest Sector inSouth Asia; Indian Council of Agricultural Research: New Delhi, India,2002; http://www.egfar.org/egfar/lfm/gphi_documents/02_Region_specific_documents/D_Asia_and_the_Pacific_Islands_(APAARI)/02_Background_Documents/01_General_issues/D-1-004-D4_Ph_in_South_Asia.pdf.(87) Gangwar, R. K.; Tyagi, S.; Kumar, V.; Singh, K.; Singh, G. Foodproduction and post harvest losses of food grains in India. Food Sci.Qual. Manag. 2014, 31, 48−53.(88) Naziri, D.; Quaye, W.; Siwoku, B.; Wanlapatit, S.; Viet, T.;Bennett, B. The diversity of postharvest losses in cassava value chainsin selected developing countries. J. Agric. Rural Dev. Trop. Subtrop.2014, 115 (2), 111−123.(89) Oelofse, S. H. H.; Nahman, A. Estimating the magnitude of foodwaste generated in South Africa.Waste Manage. Res. 2013, 31 (1), 80−86.(90) Lipinski, B.; Hanson, C.; Lomax, J.; Kitinoja, L.; Waite, R.;Searchinger, T. Reducing Food Loss and Waste (Creating a SustainableFood Future, Installment Two); World Resources Institute and UnitedNations Environment Programme: Washington, DC, 2013.(91) Springer, N.; Flaherty, R.; Robertson, K. Losses in the Field: AnOpportunity Ripe for Harvesting; BSR: New York, 2013; https://www.bsr.org/reports/BSR_Upstream_Food_Loss.pdf.(92) Kelleher, K. Fishery Green Growth and Waste; FisheriesCommittee, OECD Trade and Agriculture Directorate: Paris, 2013.(93) Nahman, A.; de Lange, W. Costs of food waste along the valuechain: Evidence from South Africa. Waste Manage. 2013, 33 (11),2493−2500.(94) Prusky, D. Reduction of the incidence of postharvest qualitylosses, and future prospects. Food Secur. 2011, 3 (4), 463−474.(95) World Bank. Missing food: The Case of Postharvest Grain Losses inSub-Saharan Africa; The World Bank: Washington, DC, 2011.
(96) Segre, A.; Falasconi, L.; Politano, A.; Vittuari, M.. BackgroundPaper on the Economics of Food Loss and Waste; FAO: Rome, Italy,2014.(97) FAO. Definitional Framework of Food Loss; FAO: Rome, Italy,2014.(98) Cathcart, E. P.; Murray, A. M. T. A Note on the percentage lossof calories as waste on ordinary mixed diets. J. Hyg. 1939, 39 (1), 45−50.(99) Wenlock, R. W.; Buss, D. H.; Derry, B. J.; Dixon, E. J.Household food wastage in Britain. Br. J. Nutr. 1980, 43 (1), 53−70.(100) Edwards, J. S. A.; Nash, A. H. M. The nutritional implicationsof food wastage in hospital food service management. Nutr. Food Sci.1999, 99 (2), 89−98.(101) Barton, A. D.; Beigg, C. L.; Macdonald, I. A.; Allison, S. P.High food wastage and low nutritional intakes in hospital patients.Clin. Nutr. 2000, 19 (6), 445−449.(102) Hyde, K.; Smith, A.; Smith, M.; Henningsson, S. The challengeof waste minimisation in the food and drink industry: a demonstrationproject in East Anglia, UK. J. Cleaner Prod. 2001, 9 (1), 57−64.(103) Garnett, T. Fruit and Vegetables & U.K. Greenhouse GasEmissions: Exploring the Relationship; University of Surrey: Surrey,U.K., 2006.(104) Hogg, D.; Barth, J.; Schleiss, K.; Favoino, E. Dealing with FoodWaste in the U.K.; Waste and Resources Action Programme (WRAP):Banbury, U.K., 2007.(105) Caswell, H. Britain’s battle against food waste. Nutr. Bull. 2008,33 (4), 331−335.(106) Langley, J.; Yoxall, A.; Manson, G.; Lewis, W.; Waterhouse, A.;Thelwall, D.; Thelwall, S.; Parry, A.; Leech, B. The use of uncertaintyanalysis as a food waste estimation tool. Waste Manage. Res. 2009, 27(3), 199−206.(107) Defra. Household Food and Drink Waste Linked to Food andDrink Purchases; Defra: London, U.K., 2010.(108) Langley, J.; Yoxall, A.; Heppell, G.; Rodriguez, E. M.; Bradbury,S.; Lewis, R.; Luxmoore, J.; Hodzic, A.; Rowson, J. Food for thought? A U.K. pilot study testing a methodology for compositionaldomestic food waste analysis. Waste Manag. Res. 2010, 28 (3), 220−227.(109) Sonesson, U.; Davis, J.; Ziegler, F. Food Production andEmissions of Greenhouse Gases: An Overview of the Climate Impact ofDifferent Product Groups; The Swedish Institute for Food andBiotechnology: Gothenburg, Sweden, 2010.(110) Sonnino, R.; McWilliam, S. Food waste, catering practices andpublic procurement: A case study of hospital food systems in Wales.Food Policy 2011, 36 (6), 823−829.(111) Pham, T. M. H. Food waste recycling: An empirical study ofthe effects of selected socio-economic factors and information on foodwaste recycling practices. A case study of Norwich householders.Master of Science Thesis, University of East Anglia, Norwich, U.K.,2011.(112) Escaler, M.; Teng, P. Mind the Gap: Reducing Waste and Lossesin the Food Supply Chain; RSIS Centre for NonTraditional Security(NTS) Studies: Singapore, 2011.(113) Carr, W.; Downing, E. Food Waste in U.K.; House ofCommons: London, U.K., 2014; http://researchbriefings.files.parliament.uk/documents/CBP-7552/CBP-7552.pdf.(114) Mena, C.; Terry, L. A.; Ellram, L.; Williams, A. Causes of wasteacross multi-tier supply networks: Cases in the U.K. food sector. Int. J.Prod. Econ. 2014, 152, 144−158.(115) Rispo, A.; Williams, I. D.; Shaw, P. J. Source segregation andfood waste prevention activities in high-density households in adeprived urban area. Waste Manage. 2015, 44, 15−27.(116) Blanke, M. Challenges of reducing fresh produce waste inEurope: From farm to fork. Agriculture 2015, 5 (3), 389−399.(117) Vanham, D.; Bouraoui, F.; Leip, A.; Grizzetti, B.; Bidoglio, G.Lost water and nitrogen resources due to EU consumer food waste.Environ. Res. Lett. 2015, 10 (8), 084008.
Environmental Science & Technology Critical Review
DOI: 10.1021/acs.est.7b00401Environ. Sci. Technol. XXXX, XXX, XXX−XXX
N

(118) Xu, Z.; Sun, D.-W.; Zhang, Z.; Zhu, Z. Research developmentsin methods to reduce carbon footprint of cooking operations: a review.Trends Food Sci. Technol. 2015, 44 (1), 49−57.(119) Russ, W.; Meyer-Pittroff, R. Utilizing waste products from thefood production and processing industries. Crit. Rev. Food Sci. Nutr.2004, 44 (1), 57−62.(120) Schneider, F. Considerations on Food Losses in Life CycleApproach of Food Supply Chain. Presented at the 3rd InternationalConference on Life Cycle Management, Zurich, Switzerland, August27−29, 2007; pp 27−29.(121) Kranert, M.; Hafner, G.; Barabosz, J.; Schneider, F.;Lebersorger, S.; Scherhaufer, S.; Schuller, H.; Leverenz, D.Determination of Discarded Food and Proposals for a Minimization ofFood Wastage in Germany; Institute for Sanitary Engineering,University of Stuttgart: Stuttgart, Germany, 2012.(122) Federal Ministry of Food Agriculture and ConsumerProtection (BMELV). German government investigates post-harvestlosses; http://www.farming.co.uk/news/article/8431 (accessed May 2,2017).(123) Blanke, M. M. Reducing ethylene levels along the food supplychain - a key to reducing food waste? J. Sci. Food Agric. 2014, 94 (12),2357−2361.(124) Rossaint, S.; Kreyenschmidt, J. Intelligent label − a new way tosupport food waste reduction. Proc. Inst. Civ. Eng.: Waste Resour.Manage. 2015, 168 (2), 63−71.(125) Jorissen, J.; Priefer, C.; Brautigam, K.-R. Food waste generationat household level: Results of a survey among employees of twoEuropean research centers in Italy and Germany. Sustainability 2015, 7(3), 2695−2715.(126) Silvennoinen, K.; Katajajuuri, J. M.; Hartikainen, H.; Jalkanen,L.; Koivupuro, H. K.; Reinikainen, A. Food waste volume andcomposition in the Finnish supply chain: special focus on food servicesector. In Fourth International Symposium on Energy from Biomass andWaste; CISA Publisher: Venice, Italy, 2012.(127) Silvennoinen, K.; Korhonen, O. Food waste volumn andcomposition in Helsinki region households. Presented at the 6thInternational Conference on Life Cycle Management (LCM),Gothenburg, Sweden, August 25−28, 2013; http://conferences.chalmers.se/index.php/LCM/LCM2013/paper/view/716/314.(128) Katajajuuri, J.-M.; Silvennoinen, K.; Hartikainen, H.; Heikkila,L.; Reinikainen, A. Food waste in the Finnish food chain. J. CleanerProd. 2014, 73 (12), 322−329.(129) Silvennoinen, K.; Heikkila, L.; Katajajuuri, J.-M.; Reinikainen,A. Food waste volume and origin: Case studies in the Finnish foodservice sector. Waste Manage. 2015, 46, 140−145.(130) Dennison, G. J.; Dodd, V. A.; Whelan, B. A socio-economicbased survey of household waste characteristics in the city of Dublin,Ireland. II. Waste quantities. Resour. Conserv. Recycl. 1996, 17 (3),245−257.(131) Gutierrez-Barba, B. E.; Ortega-Rubio, A. Household food-waste production and a proposal for its minimization in Mexico. LifeSci. J. 2013, 10 (3), 1772−1783.(132) Stefan, V.; van Herpen, E.; Tudoran, A. A.; Lahteenmaki, L.Avoiding food waste by Romanian consumers: The importance ofplanning and shopping routines. Food Qual. Prefer. 2013, 28 (1), 375−381.(133) Martindale, W. Using consumer surveys to determine foodsustainability. Br. Food J. 2014, 116 (7), 1194−1204.(134) Rathje, W. L.; Murphy, C. Rubbish!: The Archaeology ofGarbage; University of Arizona Press: New York, 2001.(135) Khan, M. Z. A.; Burney, F. A. Forecasting solid wastecomposition An important consideration in resource recovery andrecycling. Resour. Conserv. Recycl. 1989, 3 (1), 1−17.(136) Liu, J.; Lundqvist, J.; Weinberg, J.; Gustafsson, J. Food lossesand waste in China and their implication for water and land. Environ.Sci. Technol. 2013, 47 (18), 10137−10144.(137) Moreno, L. Sustainable Food Management Through the FoodRecover Challenge; Environmental Protection Agency, Washington,
DC, 2011; http://www2.epa.gov/greenchill/sustainable-food-management-through-food-recover-challenge.(138) Gooch, M. Cut Waste, Grow Profit: How to Reduce and ManageFood Waste, Leading to Increased Profitability and EnvironmentalSustainability; Value Chain Management Centre: Oakville, Ontario,2012; http://www.valuechains.ca/usercontent/documents/CutWasteGrowProfitFINALDOCUMENTOct312.pdf.(139) An, Y.; Li, G.; Wu, W.; Huang, J.; He, W.; Zhu, H. Generation,collection and transportation, disposal and recycling of kitchen waste:A case study in Shanghai. Waste Manage. Res. 2014, 32 (3), 245−248.(140) Bala, B. K.; Haque, M. A.; Hossain, A.; Majumdar, S. PostHarvest Loss and Technical Efficiency of Rice, Wheat and MaizeProduction System: Assessment and Measures for Strengthening FoodSecurity; Bangladesh Agricultural University: Mymensingh, Bangladesh,2010.(141) Reardon, T.; Chen, K.; Minten, B.; Adriano, L. The QuietRevolution in Staple Food Value Chains: Enter the Dragon, the Elephant,and the Tiger; Asian Development Bank: Mandaluyong City,Philippines, 2012.(142) Stoner, J. M. S. Applying the concept of sustainableconsumption to seafood: how product loss through post-harvestseafood supply chains undermines seafood sustainability. MasterThesis, Dalhousie University, Halifax, Nova Scotia, 2013.(143) Suthar, S.; Singh, P. Household solid waste generation andcomposition in different family size and socio-economic groups: A casestudy. Sustain. Cities Soc. 2015, 14 (1), 56−63.(144) Kaminski, J.; Christiaensen, L. Post-Harvest Loss in Sub-SaharanAfricaWhat Do Farmers Say?; The World Bank: Washington, DC.2014.(145) Papargyropoulou, E.; Padfield, R.; Rupani, P. F.; Zakaria, Z.Towards sustainable resource and waste management in developingcountries: The role of commercial and food waste in Malaysia. Int. J.Waste Resour. 2014, 4 (3), 2−7.(146) Edjabou, M. E.; Jensen, M. B.; Gotze, R.; Pivnenko, K.;Petersen, C.; Scheutz, C.; Astrup, T. F. Municipal solid wastecomposition: Sampling methodology, statistical analyses, and casestudy evaluation. Waste Manage. 2015, 36, 12−23.(147) Monier, V.; Mudgal, S.; Escalon, V.; O’Connor, C.; Gibon, T.;Anderson, G.; Montoux, H.; Reisinger, H.; Dolley, P.; Ogilvie, S.; et al.Preparatory Study on Food Waste Across EU27; European Commission:Brussels, Belgium, 2010.(148) Dias-Ferreira, C.; Santos, T.; Oliveira, V. Hospital food wasteand environmental and economic indicators - A Portuguese case study.Waste Manage. 2015, 46, 146−154.(149) Lebersorger, S.; Schneider, F. Discussion on the methodologyfor determining food waste in household waste composition studies.Waste Manage. 2011, 31 (9−10), 1924−1933.(150) Dahlen, L.; Lagerkvist, A. Methods for household wastecomposition studies. Waste Manage. 2008, 28 (7), 1100−1112.(151) Parizeau, K.; von Massow, M.; Martin, R. Household-leveldynamics of food waste production and related beliefs, attitudes, andbehaviours in Guelph, Ontario. Waste Manage. 2015, 35, 207−217.(152) Sharp, V.; Giorgi, S.; Wilson, D. C. Methods to monitor andevaluate household waste prevention. Waste Manag. Res. 2010, 28 (3),269−280.(153) Hanks, A. S.; Wansink, B.; Just, D. R. Reliability and accuracyof real-time visualization techniques for measuring school cafeteria traywaste: validating the quarter-waste method. J. Acad. Nutr. Diet. 2014,114 (3), 470−474.(154) Gustavsson, J.; Cederberg, C.; Sonesson, U.; Emanuelsson, A.The Methodology of the FAO Study: “Global Food Losses and Food Waste- Extent, Causes and Prevention”- FAO, 2011; The Swedish Institute forFood and Biotechnology: Gothenburg, Sweden, 2013.(155) Z Zhou, Z.; Tian, W.; Wang, J.; Liu, H. Food ConsumptionTrends in China. Report submitted to the Australian Government;Department of Agriculture, Fisheries and Forestry: Queensland,Australia, 2012; http://www.daff.gov.au/market-access-trade/food-consumption-trends-in-china (accessed December 10, 2012).
Environmental Science & Technology Critical Review
DOI: 10.1021/acs.est.7b00401Environ. Sci. Technol. XXXX, XXX, XXX−XXX
O
(156) Smil, V. China’s food: availability, requirements, composition,prospects. Food Policy 1981, 6 (2), 67−77.(157) Falasconi, L.; Vittuari, M.; Politano, A.; Segre, A. Food waste inschool catering: An Italian case study. Sustainability 2015, 7 (11),14745−14760.(158) Scholz, K.; Eriksson, M.; Strid, I. Carbon footprint ofsupermarket food waste. Resour. Conserv. Recycl. 2015, 94, 56−65.(159) Saccares, S.; Scognamiglio, U.; Moroni, C.; Marani, A.;Calcaterra, V.; Amendola, M.; Civitelli, G.; Cattaruzza, M. S.;Ermenegildi, A.; Morena, V. Evaluation model of plate waste tomonitor food consumption in two different catering settings. Ital. J.Food Saf. 2014, 3 (2), 1−8.(160) Grandhi, B.; Appaiah Singh, J. What a waste! A study of foodwastage behavior in Singapore. J. Food Prod. Mark. 2016, 22, 471−485.(161) Halloran, A.; Clement, J.; Kornum, N.; Bucatariu, C.; Magid, J.Addressing food waste reduction in Denmark. Food Policy 2014, 49,294−301.(162) Spescha, G.; Reutimann, J. Reducing Food Waste - A HiddenOpportunity for Investors; 2013; http://www.inrate.com/Inrate/media/Documents/Sustainability%20Matters/13-01-10-SustainabilityMatters.pdf.(163) Themen, D. Reducing of Food Losses and Waste in Europe andCentral Asia for Improved Food Security and Agrifood Chain Efficiency;FAO: Rome, Italy, 2014.(164) Holm, T. Reduction of FLW in Europe and Central Asia;Synthesis Report prepared for Food and Agriculture Organization ofthe United Nations; Regional Office for Europe and Central Asia(REU): Budapest, Hungary, 2013.(165) Koivupuro, H.-K.; Hartikainen, H.; Silvennoinen, K.;Katajajuuri, J.-M.; Heikintalo, N.; Reinikainen, A.; Jalkanen, L.Influence of socio-demographical, behavioural and attitudinal factorson the amount of avoidable food waste generated in Finnishhouseholds. Int. J. Consum. Stud. 2012, 36 (2), 183−191.(166) Reynolds, C. J.; Mavrakis, V.; Davison, S.; Høj, S. B.; Vlaholias,E.; Sharp, A.; Thompson, K.; Ward, P.; Coveney, J.; Piantadosi, J.;et al. Estimating informal household food waste in developedcountries: The case of Australia. Waste Manage. Res. 2014, 32 (12),1254−1258.(167) Baker, D. Measuring and addressing the ecological impact ofhousehold food waste in Australia. In 16th Biennial AustralianAssociation for Environmental Education Conference − Leading Change:Living for One Planet; AAEE National Conference Committee:Canberra, Australian, 2010; http://www.aaee.org.au/wp-content/uploads2/2009/01/AAEE_2010_Conference_JournalB.pdf#page=26.(168) Thi, N. B. D.; Kumar, G.; Lin, C.-Y. An overview of food wastemanagement in developing countries: Current status and futureperspective. J. Environ. Manage. 2015, 157, 220−229.(169) Lee, P.; Willis, P.; Hollins, O. Waste Arisings in the Supply ofFood and Drink to Households in the U.K.; Waste and Resources ActionProgramme (WRAP): Banbury, U.K., 2010.(170) Zorpas, A. A.; Lasaridi, K. Measuring waste prevention. WasteManage. 2013, 33 (5), 1047−1056.(171) Quested, T. E.; Parry, A. D.; Easteal, S.; Swannell, R. Food anddrink waste from households in the U.K. Nutr. Bull. 2011, 36 (4),460−467.(172) Liwei, G.; Shengkui, C.; Xiaochang, C.; Dan, Z.; Xiaojie, L.; Qi,Q.; Yao, L. An overview of the resources and environmental issuesfrom wasted food in urban catering across China. J. Resour. Ecol. 2013,4 (4), 337−343.(173) Okazaki, W. K.; Turn, S. Q.; Flachsbart, P. G. Characterizationof food waste generators: A Hawaii case study. Waste Manage. 2008,28 (12), 2483−2494.(174) Blomgren, M.; Bylund, J. The connection between the issue offood waste and its collection for biogas: A case study of themunicipality of Stockholm. Master Thesis, Stockholm University,Stockholm, Sweden, 2013.(175) Whitehair, K. J.; Shanklin, C. W.; Brannon, L. A. Writtenmessages improve edible food waste behaviors in a university diningfacility. J. Acad. Nutr. Diet. 2013, 113 (1), 63−69.
(176) Li, X. D.; Poon, C. S.; Lee, S. C.; Chung, S. S.; Luk, F. Wastereduction and recycling strategies for the in-flight services in the airlineindustry. Resour. Conserv. Recycl. 2003, 37 (2), 87−99.(177) Ostergren, K.; Anderson, G.; Easteal, S.; Gustavsson, J.;Hansen, O. J.; Moates, G.; Møller, H.; Politano, A.; Quested, T.;Redlingshofer, B.; et al. Food waste prevention: the challenge ofmaking appropriate definitional and methodological choices forquantifying food waste levels. Presented at the 6th InternationalConference on Life Cycle Management (LCM), Gothenburg, Sweden,August 25−28, 2013.
Environmental Science & Technology Critical Review
DOI: 10.1021/acs.est.7b00401Environ. Sci. Technol. XXXX, XXX, XXX−XXX
P