mirza s. saiyadain, human resources management, tata...
TRANSCRIPT

3. Mirza S. Saiyadain, Human Resources Management, Tata McGraw Hill Publishing Co.,
Ltd., New Delhi, 1988.
4. Dale S. Beach, Personnel Management, McMillan, New York, 1991.
5. Arun Monappa and Mirza Saiyadain, Personnel Management, Tata McGraw Hill
Publishing Co., Ltd., New Delhi, 1991.
6. Asha, S., Psychological Dimensions of Training and Development, HRM Review, ICFAI
University press, Aug. 2007, p.21.
7. Harikumar, K., Learning and Development-Current Trends in IT, HRM Review, ICFAI
University press, Aug. 2007, pp.12-13.
8. Ibid p.13
CHAPTER – 5
PERFORMANCE APPRAISAL
In this chapter opinions of the employees on the
practices relating performance appraisal in the company have
been collected and analyzed.
5.01 Introduction

To survive and to succeed in the market, the business organizations should produce quality
goods, offer services that delight the customers and operate at minimal costs. For making all these
possible an organization should possess human resources that could function efficiently and effectively.
Human resources are valuable resources for any enterprise. They are vital as they possess the required
intelligence to make material, physical and financial resources productive and effective. The human
potential is the crux of organizational effectiveness. Appraising human potential in a scientific and
systematic manner paves way for enhanced corporate performance.1 Hence, after an employee has
been selected, trained and motivated he is apprised of his performance. The performance appraisal is a
process of evaluating an employee performance on a job. It is estimating an employee’s value in terms
of qualities and status.
5.02 Meaning and Definition
Performance appraisal is the most important and indispensable tool for an organization.
Performance appraisal measures the effectiveness of the personnel. Edwin B Flippo defines
performance appraisal as a systematic, periodic and as far as humanly possible an impartial rating of
employee’s excellence in matters pertaining to his present job and potentialities for a job.2
To Maurice, B. Coming performance appraisal means “attempts to recognize and reward for
personnel abilities that an individual brings to his job, measured by the extent to which his output or
quality of his work exceeds the minimum that is fixed as the basic rate of pay”.3
To Yoder Performance Appraisal refers to “the formal procedure used in an organization to
evaluate personalities, contributions and potentials of group members”.4
According to Heyel it is “the process of evaluating the performance and qualification of the
employee in terms of requirements of the job for which he is employed, for the purpose of

administration including placement, selection for promotions, providing financial rewards and other
actions which require differential treatment among the members of the group as distinguished from
actions affecting all members equally.”5
According to Martin Fisher performance appraisal is a process for establishing shared
understanding about what is to be achieved, and an approach for managing and developing people in a
way which increases the probability that it will be achieved in the short or long-term.6
Performance appraisal is a method of evaluating the behavior of employees in the work spot,
normally including both the quantitative and qualitative aspects of job performances.7 In order to find
out whether an employee is worthy of continued employment or not, and if so, whether he should
receive a bonus, a pay rise or a promotion, his performance needs to be evaluated from time to time.8
The object of performance appraisal is to improve the efficiency of an enterprise by attempting to
mobilize the best possible efforts from individuals employed in it.
Performance Appraisal is a procedure to establish a clear understanding of what the
organization strives to achieve and streamline the combined efforts of all the employees so that the
company improves its effectiveness and competitiveness in the market place. It is a systematic
alignment of employee objectives, skills, abilities, efforts with the organization’s strategic objectives to
create a high-performance culture. The emphasis is on improving, learning and developing the career
potential of employees to achieve the overall business objectives. It aims at analyzing the performance
against the set standards, both quantitative and qualitative.
Performance appraisal is a measure of performance of an employee in accomplishing goals and
plans of an organization within a specific period of time. It gives a picture about how an employee is
working in his present job and what are the strong and weak points. Performance appraisal system

provides feedback to the employees on their performance and helps him to take utmost care and
attention, where it deserves.
The process of performance appraisal helps in linking information gathering and decision making
process which provides a basis for judging the effectiveness of personnel subdivisions such as coming as
rightly observed that the overall objective of performance appraisal is to improve efficiency of an
enterprise by attempting to mobilize the best possible efforts from the individuals employed in it.
The performance appraisal system has assumed a new shape and nature in the form of a
two-way communication link between the employees and the employers. Proper communication
between the assessing authority and the employee under appraisal is essential for gathering all
the required information from the employee. A performance appraisal system that is based on a
free and unrestrained approach would generate the preferred data and help organizational
productivity. To achieve the desired objectives performance appraisal system should be realistic
and impartial, with a positive orientation towards remedial steps. Therefore it requires skilful
handling.
5.03 Need for Performance Appraisal
People differ in their abilities and their aptitudes. There is always some difference between the
quality and quantity of the same work on the same job being done by two different people. Therefore,
performance appraisal is necessary to understand each employee’s abilities, competencies and relative
merit and worth for the organization. Performance appraisal rates the employees in terms of their
performance.
Performance appraisal helps to rate the performance of the employees and evaluate their
contribution towards the organizational goals. If the process of performance appraisals is formal and

properly structured, it helps the employees to clearly understand their roles and responsibilities and
give direction to the individual’s performance. It helps to align the individual performances with the
organizational goals and also review their performance.
Performance appraisal takes into account the past performance of the employees and focuses
on the improvement of the future performance of the employees. Its aim is to measure what an
employee does.9
It is a power tool to calibrate, refine and reward the performance of the employee. It helps to
analyze his achievements and evaluate his contribution towards the achievements of the overall
organizational goals.
5.04 Benefits of Appraisal10
Appraisal offers a valuable opportunity to focus on work activities and goals, to identify
and correct existing problems, and to encourage better future performance. Thus the performance
of the whole organization is enhanced. However benefits of performance appraisal can be
summarized as follows.
a) Motivation and Satisfaction: Performance appraisal can have a profound effect on
levels of employee motivation and satisfaction - for better as well as for worse.
Performance appraisal provides employees with recognition for their work efforts. The
existence of an appraisal program indicates to an employee that the organization is
genuinely interested in their individual performance and development, which can have a
positive influence on the individual's sense of worth, commitment and belonging.
b) Training and Development: Performance appraisal offers an excellent opportunity -
perhaps the best that will ever occur - for a supervisor and subordinate to recognize and

agree upon individual training and development needs. Performance appraisal can make
the need for training by an employee's work performance, the presence or absence of
work skills, by linking it clearly to performance outcomes and future career aspirations.
c) Recruitment and Induction: Appraisal data can be used to monitor the success of the
organization's recruitment and induction practices. Appraisal data can also be used to
monitor the effectiveness of changes in recruitment strategies.
d) Employee Evaluation: Evaluation is a major objective of performance appraisal.
Performance appraisal is the process of examining and evaluating the performance of an
individual. The need to evaluate employees is to encourage and develop them.
e) Career planning and Development: Performance feedback guides career decisions about
specific paths one should investigate.
f) Compensation adjustments: Performance evaluations help decision makers determine who
should receive pay raises and who should not. Many firms grant part or all of their pay increases
and bonuses based upon merit, which is determined mostly through performance appraisals.
g) Placement decisions: Promotions, transfers, and demotions are usually based on past or
anticipated performance.
5.05 Process of Performance Appraisal11
Performance Appraisal process consists of the following stages.
a) Establishing Performance Standards: The first step in the process of performance appraisal is
setting up of the standards which will be used as the base to compare the actual performance of

the employees. The standards set should be clear, easily understandable and in measurable
terms.
b) Communicating the Standards: Once the standards are set, it is the responsibility of the
management to communicate the standards to all the employees of the organization. The
employees should be informed and the standards should be clearly explained to them. This
helps them in understanding their roles and to know what exactly is expected from them. The
standards should also be communicated to the appraisers or the evaluators.
c) Measuring the Actual Performance: The next step in the process of performance appraisal is
measuring the actual performance of the employees that is the work done by the employees
during the specified period of time. It is a continuous process which involves monitoring the
performance throughout the year. This stage requires the careful selection of the appropriate
techniques of measurement, taking care that personal bias does not affect the outcome of the
process.
d) Comparing the Actual with the Desired Performance: The actual performance is compared with
the desired or the standard performance. The comparison helps to know the deviations in the
performance of the employees from the standards set. The result can show the actual
performance being more than the desired performance or, the actual performance being less
than the desired performance depicting a negative deviation in the organizational performance.
e) Discussing Results: The results of the appraisal are to be communicated and discussed with the
employees on one-to-one basis. The results, the problems and the possible solutions are
discussed with the aim of problem solving and reaching consensus. The feedback should be
given with a positive attitude as this can have an effect on the employees’ future performance.

The purpose of the meeting should be to solve the problems faced and motivate the employees
to perform better.
f) Decision Making: The last step of the process is to take decisions which can be taken either to
improve the performance of the employees, take the required corrective actions, or the related
HR decisions like rewards, promotions, demotions, transfers etc.
5.06 Organizational Performance and Performance Appraisal12:
Performance appraisal process is one of the central pillars of the performance management
which is directly related to the organizational performance and has a direct impact on it. Employee
performance ultimately affects the organizational performance and objectives. Apart from the direct
benefits to the organisation, appraisals contribute to employee satisfaction, which in turn leads to
improved performance.
For an organization to be effective, the goals, the standards and the action plans need to be
planned well in advance. Thus, performance appraisal facilitates the achievement of organizational
goals. It also facilitates the optimal use of the organizational resources.
Performance appraisal is the strength of performance management, which in turn affects the
organizational performance. It helps to identify and overcome the problems faced by the employees in
their work.
5.07 Methods of Performance Appraisal13
a) Essay Appraisal Method: This traditional form of appraisal, also known as “Free Form method”
involves a description of the performance of an employee by his superior. The description is an
evaluation of the performance of any individual based on the facts and often includes examples
and evidences to support the information.

b) Straight Ranking Method: This is one of the oldest and simplest techniques of performance
appraisal. In this method, the appraiser ranks the employees from the best to the poorest on
the basis of their overall performance. It is quite useful for a comparative evaluation.
c) Paired Comparison: This is a better technique of comparison than the straight ranking method.
This method compares each employee with all others in the group, one at a time. After all the
comparisons on the basis of the overall comparisons, the employees are given the final rankings.
d) Critical Incidents Methods: In this method of performance appraisal, the evaluator rates the
employee on the basis of critical events and how the employee behaved during those incidents.
It includes both negative and positive points.
e) Field Review: In this method, a senior member of the HR department or a training officer
discusses and interviews the supervisors to evaluate and rate their respective subordinates. A
major drawback of this method is that it is a very time consuming method. But this method
helps to reduce the superiors’ personal bias.
f) Checklist Method: The rater is given a checklist of the descriptions of the behavior of the
employees on the job. The checklist contains a list of statements on the basis of which the rater
describes on-the-job performance of the employees.
g) Graphic Rating Scale: In this method, an employee’s quality and quantity of work is assessed in
a graphic scale indicating different degrees of a particular trait. The factors taken into
consideration include both the personal characteristics and characteristics related to on-the-job
performance of the employees.

h) Forced Distribution: To eliminate the element of bias from the rater’s ratings, the evaluator is
asked to distribute the employees in some fixed categories of ratings on a normal distribution
curve. The rater chooses the appropriate fit for the categories on his own discretion.
Modern methods:
a) Assessment Centres14: An assessment centre typically involves the use of methods like
social/informal events, tests and exercises, assignments being given to a group of employees to
assess their competencies to take higher responsibilities in the future. Generally, employees are
given an assignment similar to the job they would be expected to perform if promoted. The
trained evaluators observe and evaluate employees as they perform the assigned jobs and are
evaluated on job related characteristics. The major competencies that are judged in assessment
centres are interpersonal skills, intellectual capability, planning and organizing capabilities,
motivation, career orientation etc. Assessment centres are also an effective way to determine
the training and development needs of the targeted employees.
b) Behaviorally Anchored Rating Scales: Behaviorally Anchored Rating Scales (BARS) is a relatively
new technique which combines the graphic rating scale and critical incidents method. It consists
of predetermined critical areas of job performance or sets of behavioral statements describing
important job performance qualities as good or bad (for eg. the qualities like inter-personal
relationships, adaptability and reliability, job knowledge etc). These statements are developed
from critical incidents. In this method, an employee’s actual job behavior is judged against the
desired behaviour by recording and comparing the behaviour with BARS. Developing and
practicing BARS requires expert knowledge.
c) Human Resource Accounting Method: Human resources are valuable assets for every
organization. Human resource accounting method tries to find the relative worth of these assets

in terms of monetary units. In this method the performance appraisal of the employees is
judged in terms of cost and contribution of the employees. The cost of employees include all the
expenses incurred on them like their compensation, recruitment and selection costs, induction
and training costs etc whereas their contribution includes the total value added (in monetary
terms). The difference between the cost and the contribution will be the performance of the
employees.
d) 360 degree feedback, also known as 'multi-rater feedback', is the most comprehensive appraisal
where the feedback about the employees’ performance comes from all the sources that come in
contact with the employee on his job.
e) Management by Objectives: In this performance appraisal method the supervisor and the
employee get together to set objectives in quantifiable terms. The appraisal method has worked
to eliminate communication problems by the establishment of regular meetings, emphasizing
results, and by being an ongoing process where new objectives have been established and old
objectives had been modified as necessary in light of changed conditions.
5.08 Performance Appraisals in IT industry
The approach to performance appraisal was generally to combine both development
objectives and reward. However to some extent both these aspects were compromised by the
pressure to retain and the need to achieve maximum revenue from employees.
The IT companies have taken the lead in implementing 180 degree and 360 degree
appraisals. The appraisal by subordinates is considered a very important input especially for
project managers. Several companies have a 360 degree appraisal done once in two to three years
and not every year.

Many companies did appraisals more often than on an annual basis. Appraisals at the end of a
project/module and often twice a year were commonly reported. The reason was the need felt to
review performance from a feedback point of view more often especially in the initial years. The process
was also an important input to building a skills inventory that was necessary for project allocation.
5.09 Performance Appraisal System in SUBEX
According to the company's current policy, appraisal will be done every six months once by
setting the KRA (key result areas) for maximum rating 5. The number of KARs differs from team to team.
Along with that competencies will be rated for 5.
5.10 Responses of the Respondents to the Statements on Performance Appraisal
With this background, to collect the opinions on various aspects of the performance appraisal
prevailing in Subex Limited, thirteen statements have been given in the questionnaire. Responses have
been structured on a five point scale. The responses of the respondents have been analyzed statement-
wise under three variables namely educational qualifications, gender and designation and presented in
the following tables.
The responses have been structured on a five point scale and weights have been assigned in the
following manner.
Responses Weights
Fully Satisfied/ Strongly Agree 5
Satisfied/ Agree 4

Undecided 3
Dissatisfied/ Disagree 2
Highly dissatisfied/ Strongly Disagree 1
Weighted Average Score (WAS) Interpretation
1.00-1.99 Very Low
2.00-2.99 Low
3.00-3.99 High
4.00-5.00 Very High
The least favourable response is assigned 1 and the most favourable response is assigned 5.
Weighted Average Scores (WAS) are calculated as stated earlier. Thus minimum weighted average is 1
and maximum is 5. If Weighted Average Score (WAS) is 1.00 to 1.99 indicates ‘very low level of
agreement or satisfaction’, 2.00 to 2.99 indicates ‘low level agreement or satisfaction’, 3.00 to 3.99
indicates ‘high level of agreement or satisfaction’ and 4 to 5 indicates ‘very high level agreement or
satisfaction’.
To highlight the performance appraisal practices in the SUBEX LIMITED opinions of the selected
employees on various appraisal procedures and practices have been collected and analysed in the
following pages. For the purpose as many as thirteen statements/questions have been framed. The
responses so collected are presented in tables and weighted average scores have been calculated. The
responses have been analyzed by educational qualifications, gender and designation.
Table: 5.01

Educational Qualification-, Gender-, and Designation-Wise Analysis of the Responses to the Question
“Do You have Clear Knowledge About the Criteria Adopted for Performance Appraisal in Your
Company?”
Variables No. of the Respondents
Yes No Total
Edu
cati
on
B.E./B.Tech. 88
(85.44)
15
(14.56)
103
(100)
M.C.A./ M.Tech. 97
(84.35)
18
(15.65)
115
(100)
Gen
der
Male 105
(85.36)
18
(14.63)
123
(100)
Female 80
(84.21)
15
(15.79)
95
(100)
Des
ign
atio
n
Trainee/
Software Engineer
33
(80.49)
8
(19.51)
41
(100)
System Analyst 113
(90.40)
12
(9.60)
125
(100)
Project Leader/
Manager
39
(75.00)
13
(25.00)
52
(100)
Total 185
(84.86)
33
(15.14)
218
(100)
Source: Field Survey
Note: Figures in the parentheses are the percentages on row totals.
Table 5.01 shows educational qualification-, gender-, and designation-wise analysis of the
responses to the question “do you have clear knowledge about the criteria adopted for performance

appraisal in your company?” Education-wise analysis of the responses shows that 85.44 percent of the
B.E./B.Tech. qualified respondents and 84.35 per cent of the M.C.A./M.Tech. qualified respondents;
85.36 per cent of the male respondents and 84.21 per cent of the female respondents; 80.49 per cent of
the trainees/software engineers, 90.40 per cent of the system analysts and 75.00 per cent of the project
leaders/managers say that they have clear knowledge about the criteria adopted for performance
appraisal in the company. On the whole 84.86 per cent of the respondents have clear knowledge about
the criteria adopted for performance appraisal in the company. From this it can be concluded that a
great majority of the respondents have clear knowledge of the criteria adopted for performance
appraisal in the company. Performance appraisal criteria should be known by all the employees
irrespective of education, gender and designation. Hence the company should try to increase awareness
among the employees.
Table: 5.02
Awareness of the Respondents Regarding the Person Making Performance Appraisal
Variables
No. of the Respondents
HR Manager Dept Head Immediate
Superior
All of the
above Total
Edu
cati
on
B.E/ B.Tech. 46
(44.66)
6
(5.82)
51
(49.51)
0
(0.00)
103
(100)
M.C.A./ M.Tech. 46
(40.00)
7
(6.09)
61
(53.04)
1
(0.87)
115
(100)
Gen
der
Male 56
(45.53)
6
(4.88)
60
(48.78)
1
(0.81)
123
(100)
Female 36
(37.89)
7
(7.37)
52
(54.74)
0
(0.00)
95
(100)

D
esig
nat
ion
Trainee/ Software
Engineer
16
(39.02)
1
(0.06)
24
(58.54)
0
(0.00)
41
(100)
System Analyst 60
(48.00)
12
(9.60)
52
(41.60)
1
(0.80)
125
(100)
Project Leader /
Manager
16
(30.77)
0
(0.00)
36
(69.23)
0
(0.00)
52
(100)
Total 92
(42.20)
13
(5.96)
112
(51.38)
1
(0.46)
218
(100)
Source: Field Survey
Note: Figures in the parentheses are the percentages on row totals.
Table 5.02 shows awareness of the respondents regarding the person making performance
appraisal. Performance is generally appraised by human resources manager, department head or
immediate superior.
Majority of the respondents irrespective of education, gender and designation (except system
analysts) say that immediate supervisor appraises the performance. About 40 per cent of the
respondents are of the opinion that performance is appraised by HR manager. A meager 5.96 per cent of
the respondents opine that department head appraises the performance. Only one respondent is under
the impression that all the three – HR Manager, Dept. Head and Immediate Superior – appraise the
performance.
Differences in the opinions may be due to differences in the perceptions, experiences and
awareness based on their positions, placements and education. In this case all are well educated. Some
though educated may not be interested in knowing things.

Performance appraisal can be done by themselves (self appraisal), by the superiors, by the peers
and by the subordinates depending upon the method they use in the organization. However, knowledge
relating to the person or persons appraising the performance of the employees in the organization is not
either adequate or not the same among the selected employees.
Table: 5.03
Educational Qualification-, Gender-, and Designation-Wise Analysis of the Responses to the Question
“How Frequently Appraisal is Done?”
Variables
No. of the Respondents
Once in Three
Months
Once in Six
Months
Once in a Year Total
Edu
cati
on
B.E./ B.Tech. 0
(0.00)
99
(96.12)
4
(3.88)
103
(100)
M.C.A. / M.Tech. 1
(0.87)
103
(89.57)
11
(9.56)
115
(100)
Gen
der
Male 1
(0.81)
109
(88.62)
13
(10.57)
123
(100)
Female 0
(0.00)
93
(97.89)
2
(2.11)
95
(100)
Des
ign
atio
n
Trainee /
Software Engineer
1
(2.44)
34
(82.92)
6
(14.63)
41
(100)
System Analyst 0
(0.00)
124
(99.20)
1
(0.80)
125
(100)
Project Leader /
Manager
0
(0.00)
44
(84.62)
8
(15.38)
52
(100)

Total 1
(0.46)
202
(92.66)
15
(6.88)
218
(100)
Source: Field Survey
Note: Figures in the parentheses are the percentages on row totals.
Table 5.03 shows education-wise, gender-wise and designation-wise analysis of the responses to
the question, “how frequently appraisal is done?” The responses structured are once in three months,
once in six months and once in a year. As many as 96.12 per cent of the engineering graduates and
89.57 per cent of the masters of computer applications and technology are of the opinion that appraisal
is done once in six months.
Gender-wise analysis of the responses show that 88.62 per cent of the male respondents and
97.89 per cent of the female respondents are of the opinion that appraisal is done once in six months.
As less as 2.11 per cent of the female respondents and 10.57 per cent of the male respondents say that
appraisal is done once in a year.
As many as 99.20 per cent of system analysts, 84.62 per cent of the project leaders and
managers, 82.92 per cent of the trainees/software engineers are of the opinion that appraisal is done
once in six months. Only one trainee respondent thinks that appraisal is done once in three months. This
is quite unusual. About 15 per cent of the trainees/software engineers, 15.38 per cent of the project
leaders/managers, and 0.80 per cent of system analysts believe that appraisal is done once in a year.
On the whole 92.66 per cent of the respondents opine that appraisal is done once in six months,
6.88 per cent of the respondents think that appraisal is done once in a year and only one thinks that
appraisal is done once in three months. From this it can be understood appraisal is done once in six
months in the organization.

Table: 5.04
Educational Qualification-, Gender-, and Designation-Wise Analysis of the Responses to the Statement
that “Performance Appraisal is Linked to….:”
Variables
No. of the Respondents
Training and
Development
Reward and
Promotion Both Total
Edu
cati
on
B.E./ B.Tech. 1
(0.97)
22
(21.36)
80
(77.67)
103
(100)
M.C.A. / M.Tech. 1
(0.87)
19
(16.52)
95
(82.61)
115
(100)
Gen
der
Male 2
(1.63)
27
(21.95)
94
(76.42)
123
(100)
Female 0
(0.00)
14
(14.74)
81
(85.26)
95
(100)
Des
ign
atio
n
Trainee /
Software Engineer
1
(2.44)
4
(9.76)
36
(87.80)
41
(100)
System Analyst 1
(0.80)
34
(27.20)
90
(72.00)
125
(100)
Project Leader /
Manager
0
(0.00)
3
(5.77)
49
(94.23)
52
(100)
Total 2
(0.92)
41
(18.81)
175
(80.27)
218
(100)
Source: Field Survey
Note: Figures in the parentheses are the percentages on row totals.

Table 5.04 shows education-wise, gender-wise and designation-wise responses of the selected
employees to the statement that “performance appraisal is linked to…”
As much as 76.42 per cent of the B.E./B.Tech. qualified respondents and 82.61 per cent of the
M.C.A./M.Tech. qualified respondents are of the opinion that ‘performance appraisal is linked to both
training and development, and reward and promotion.
Gender-wise analysis shows that more than 75 per cent of both men and more than 85 per cent
of the women respondents’ performance appraisal is linked to both training and development, and
reward and promotion.
Designation-wise analysis shows that 87.80 per cent of the trainees/software engineers, 72.00
per cent of the system analysts, and 94.23 per cent of the project leaders/managers are of the opinion
that performance appraisal is linked with both training and development, and reward and promotion.
On the whole out of 218 employees of the company selected for the purpose of the study only
two (0.92 per cent) respondents are of the opinion that performance appraisal is linked to training and
development only, 41 (18.81 per cent) respondents think that it is linked to ‘reward and promotion’,
whereas 175 (80.27 per cent) respondents opine that performance appraisal is linked to both ‘training
and development, and reward and promotion…’. From this it can be concluded that performance
appraisal is linked with both training and development, and reward and promotion.
Table: 5.05
Educational Qualification-, Gender-, and Designation-Wise Analysis of the Responses to the Question
that “Do You Get Feedback Useful in Identifying Your Shortcomings?”
Variables No. of the Respondents
Yes No Sometimes Total

Ed
uca
tio
n
B.E./ B.Tech. 59
(57.28)
18
(17.47)
26
(25.24)
103
(100)
M.C.A. / M.Tech. 81
(70.43)
6
(5.22)
28
(24.35)
115
(100)
Gen
der
Male 75
(60.97)
17
(13.82)
31
(25.20)
123
(100)
Female 65
(68.42)
7
(7.37)
23
(24.21)
95
(100)
Des
ign
atio
n
Trainee /
Software Engineer
26
(63.41)
4
(9.76)
11
(26.83)
41
(100)
System Analyst 80
(64.00)
0
(0.00)
31
(24.80)
125
(100)
Project Leader / Manager 34
(65.38)
6
(11.54)
12
(23.08)
52
(100)
Total 140
(64.22)
24
(11.01)
54
(24.77)
218
(100)
Source: Field Survey
Note: Figures in the parentheses are the percentages on row totals.
Employees always need feedback which should be useful. Table 5.05 shows educational
qualification-, gender-, and designation-wise analysis of the responses to the question “do you get
feedback useful in identifying your short comings?” As far as educational qualification is concerned
57.28 per cent of the B.E./ B.Tech. qualified respondents and 70.43 per cent of the M.C.A./M.Tech.
qualified respondents conceded that they get useful feedback. About one-fourth of the respondents
irrespective of educational qualification opine that they sometimes get feedback useful to them.

Remaining respondents think that they do not get feedback, which is useful in identifying their
shortcomings.
Gender-wise analysis of the responses shows that 60.97 per cent of the male respondents and
68.42 per cent of the female respondents are of the opinion that they get feedback useful for identifying
their shortcomings.
Cadre-wise analysis shows that 60 to 67 per cent of the trainees, software engineers and system
analysts are of the opinion that they get feedback useful for identifying their shortcomings. Quite
unusually 65.38 per cent of the project leaders/managers too carry the same opinion. Irrespective of
designation, about one-fourth of the respondents think that sometimes they get feedback useful for
identifying their shortcomings.
On the whole 64.22 per cent of the respondents are of the opinion that they get the feedback
necessary for identifying their shortcomings, almost 25 per cent of the respondents opine that they
sometimes but not always get the feedback which is useful for identifying their shortcomings and the
remaining (11.01 per cent) of the respondents do not think that they get feedback which is useful for
identifying their short comings.
Table: 5.06
Educational Qualification-, Gender-, and Designation-Wise Analysis of Satisfaction with the Criteria of
Performance Appraisal Followed in the Company
Variables
No. of the Respondents
Fully
Satisfied Satisfied
Un-
decided
Dis-
satisfied
Highly Dis-
satisfied Total
Ed
uca
tio
n
B.E./ B.Tech.
9
(8.74)
[45]
---
85
(82.52)
[340]
---
8
(7.77)
[24]
---
1
(0.97)
[2]
---
0
(0.00)
[0]
---
103
(100)
[411]
{3.99}
M.C.A./
M.Tech.
43
(37.39)
[215]
---
65
(56.52)
[260]
---
4
(3.48)
[12]
---
3
(2.61)
[6]
---
0
(0.00)
[0]
---
115
(100)
[493]
{4.29}
Gen
der
Male
27
(21.95)
[135]
---
90
(73.17)
[360]
---
5
(4.06)
[15]
---
1
(0.81)
[2]
---
0
(0.00)
[0]
---
123
(100)
[512]
{4.16}
Female
25
(26.31)
[125]
---
60
(63.16)
[240]
---
7
(7.37)
[21]
---
3
(3.16)
[6]
---
0
(0.00)
[0]
---
95
(100)
[392]
{4.13}
Des
ign
atio
n
Trainee/
Software
Engineer
8
(19.51)
[40]
---
24
(58.54)
[96]
---
8
(19.51)
[24]
---
1
(2.44)
[2]
---
0
(0.00)
[0]
---
41
(100)
[162]
{3.95}
System
Analyst
24
(19.20)
[120]
---
98
(78.40)
[392]
---
2
(1.60)
[6]
---
1
(0.80)
[2]
---
0
(0.00)
[0]
---
125
(100)
[520]
{4.16}

Project
Leader/
Manager
20
(38.46)
[100]
---
28
(53.85)
[112]
---
2
(3.85)
[6]
---
2
(3.85)
[4]
---
0
(0.00)
[0]
---
52
(100)
[222]
{4.27}
Total
52
(23.85)
[260]
---
150
(68.81)
[600]
---
12
(5.50)
[36]
---
4
(1.83)
[8]
---
0
(0.00)
[0]
---
218
(100)
[904]
{4.15}
Source: Field Survey
Note: 1. Figures in the parentheses are the percentages on row totals.
2. Figures in the square brackets are the weighted scores.
3. Figures in the flower brackets are the weighted average scores.
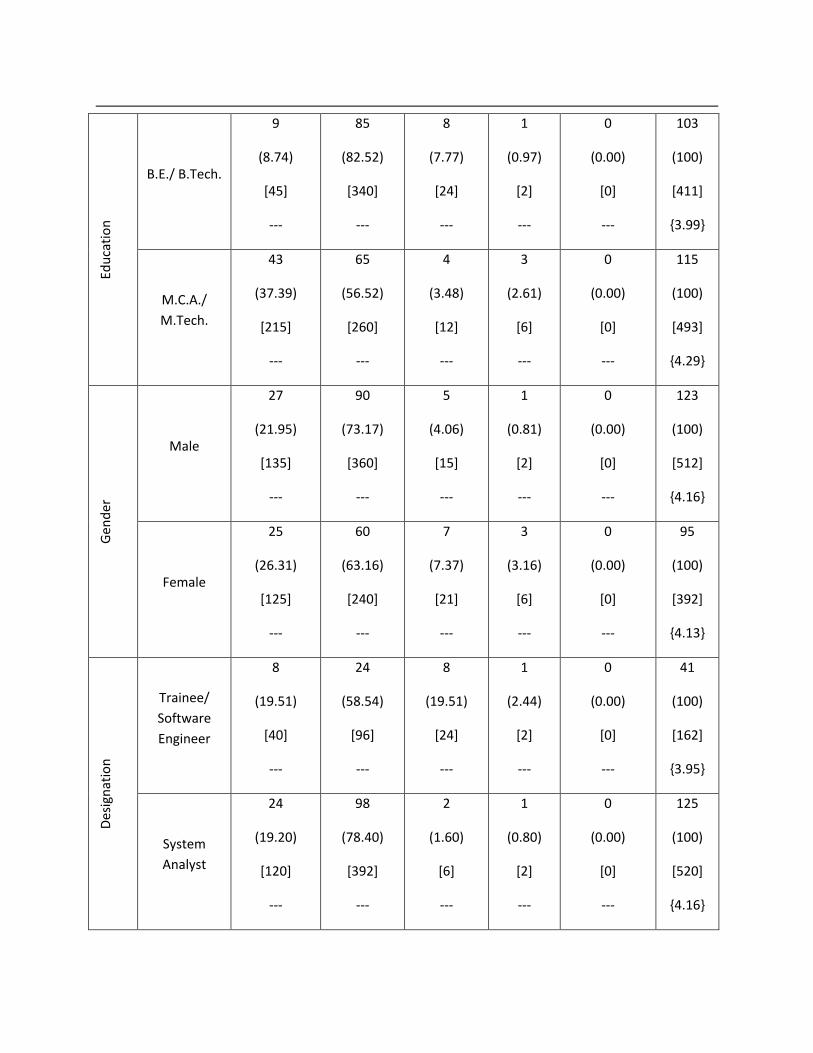
Employees’ satisfaction with the ‘criteria of performance appraisal’ followed in the company
were collected and reported in table 5.06. Out of 103 B.E./ B.Tech. qualified employees nine (8.74 per
cent) strongly agree, 85 (82.52 per cent) simply agree, eight (7.77 per cent) are undecided and one (0.97
per cent) is not satisfied. Out of 115 M.C.A./M.Tech. qualified respondents 43 (37.39 per cent) are fully
satisfied, 65 (56.52 per cent) are satisfied, four (3.48 per cent) are undecided and three (2.61 per cent)
are not satisfied. Weighted average scores of the M.C.A/M.Tech. qualified respondents is 4.29 thus
representing a ‘very high level’ of satisfaction, whereas weighted average score of B.E./ B.Tech. qualified
is 3.99. It represents a ‘high level’ of satisfaction.
Gender-wise analysis shows that 27 (21.95 per cent) men and 25 (26.31 per cent) women are
fully satisfied, 90 (73.17 per cent) men and 60 (63.16 per cent) women are satisfied, five (4.06 per cent)
men and seven (7.37 per cent) women are undecided, one (0.81 per cent) man and three (3.16 per cent)

women are dissatisfied, and nobody is highly dissatisfied. Calculated weighted average scores show a
‘high level’ of satisfaction.
Designation-wise analysis shows that, 8 (19.51 per cent) trainees/software engineers, 24 (19.20
per cent) system analysts, 20 (38.46 per cent) project leaders/project managers are highly satisfied.
Twenty four (58.54 per cent) trainees/software engineers, 98 (78.40 per cent) system analysts, 28 (53.85
per cent) project leaders/managers are simply satisfied. Eight (19.51 per cent) trainees/software
engineers, two (1.60 per cent) system analysts, and two (3.85 per cent) project leaders/managers are
undecided. One (2.44 per cent) software engineer, one (0.80 per cent) systems analyst, and two (3.85
per cent) project leaders/managers are dissatisfied. Nobody is highly dissatisfied. Weighted average
scores of all the three categories of the respondents show a very high level of satisfaction.
Table: 5.07
Educational Qualification-, Gender-, and Designation-Wise Analysis of the Responses to the Question
that “Is Your Job Responsibility Well Defined?”
Variables No. of the Respondents
Yes No Total
Edu
cati
on
B.E./B.Tech. 95
(92.23)
8
(7.77)
103
(100)
M.C.A./M.Tech. 109
(94.78)
6
(5.22)
115
(100)
Gen
der
Male 118
(95.93)
5
(4.07)
123
(100)
Female 86
(90.53)
9
(9.47)
95
(100)

D
esig
nat
ion
Trainee/
Software Engineer
34
(82.93)
7
(17.07)
41
(100)
System Analyst 118
(94.4)
7
(5.60)
125
(100)
Project Leader/
Manager
52
(100)
0
(0.00)
52
(100)
Total 204
(93.58)
14
(6.42)
218
(100)
Source: Field Survey
Note: Figures in the parentheses are the percentages on row totals.
Table 5.07 shows educational qualification-, gender-, and designation-wise analysis of the
responses to the question that “Is your job responsibility well defined?”
Out of 103 B.E./B.Tech. qualified respondents 95 (92.23 per cent) accept that their job
responsibility has been well defined, whereas 8 (7.77 per cent) members do not think that their job
responsibility has been well defined. Of the 115 M.C.A./M.Tech. qualified respondents as many as 109
(94.78 per cent) members agree and six members do not agree with the statement.
Gender-wise analysis shows that 118 (95.93 per cent) men and 86 (90.53 per cent) women
agree with the statement that their jobs are well defined, whereas five (4.07 per cent) men and nine
(9.47 per cent) women do not agree with the statement that their job responsibilities are well defined.
Designation-wise analysis shows that 34 (82.93 per cent) trainees/software engineers, 118
(94.40 per cent) system analysts, 52 (100 per cent) project leaders/managers agree with the statement
and others do not agree. Out of 218 selected employees 93.58 per cent of the employees agree that
their job responsibility is well defined whereas just 6.42 per cent of the respondents do not agree with
the statement.

Table: 5.08
Educational Qualification-, Gender-, and Designation-Wise Analysis of the Responses to the Statement
that “Career Paths are Laid Down for Every Employee with Opportunities Clearly Specified”
Variables
No. of the Respondents
Strongly
Agree Agree Neutral Disagree
Strongly
Disagree Total
Edu
cati
on
B.E./ B.Tech.
24
(23.30)
[120]
---
37
(35.92)
[148]
---
22
(21.34)
[66]
---
20
(19.42)
[40]
---
0
(0.00)
[0]
---
103
(100)
[374]
{3.63}
M.C.A./
M.Tech.
36
(31.30)
[180]
---
34
(29.57)
[136]
---
26
(22.61)
[78]
---
18
(15.65)
[36]
---
1
(0.87)
[1]
---
115
(100)
[431]
{3.75}
Gen
der
Male
33
(26.83)
[165]
---
46
(37.39)
[184]
---
28
(22.76)
[84]
---
15
(12.19)
[30]
---
1
(0.81)
[1]
---
123
(100)
[464]
{3.77}
Female
27
(28.42)
[135]
---
25
(26.31)
[100]
---
20
(21.05)
[60]
---
23
(24.21)
[46]
---
0
(0.00)
[0]
---
95
(100)
[341]
{3.59}
D
esig
nat
ion
Trainee/
Software
Engineer
6
(14.63)
[30]
---
24
(58.54)
[96]
---
8
(19.51)
[24]
---
3
(7.31)
[6]
---
0
(0.00)
[0]
---
41
(100)
[156]
{3.80}
System
Analyst
44
(35.20)
[220]
---
26
(20.80)
[104]
---
25
(20.00)
[75]
---
29
(23.20)
[58]
---
1
(0.80)
[1]
---
125
(100)
[458]
{3.66}
Project
Leader/
Manager
10
(19.23)
[50]
---
21
(40.38)
[84]
---
15
(28.85)
[45]
---
6
(11.54)
[12]
---
0
(0.00)
[0]
---
52
(100)
[191]
{3.67}
Total
60
(27.52)
[300]
---
71
(32.57)
[284]
---
48
(22.02)
[144]
---
38
(17.43)
[76]
---
1
(0.46)
[1]
---
218
(100)
[805]
{3.69}
Source: Field Survey
Note: 1. Figures in the parentheses are the percentages on row totals.
2. Figures in the square brackets are the weighted scores.
3. Figures in the flower brackets are the weighted average scores.
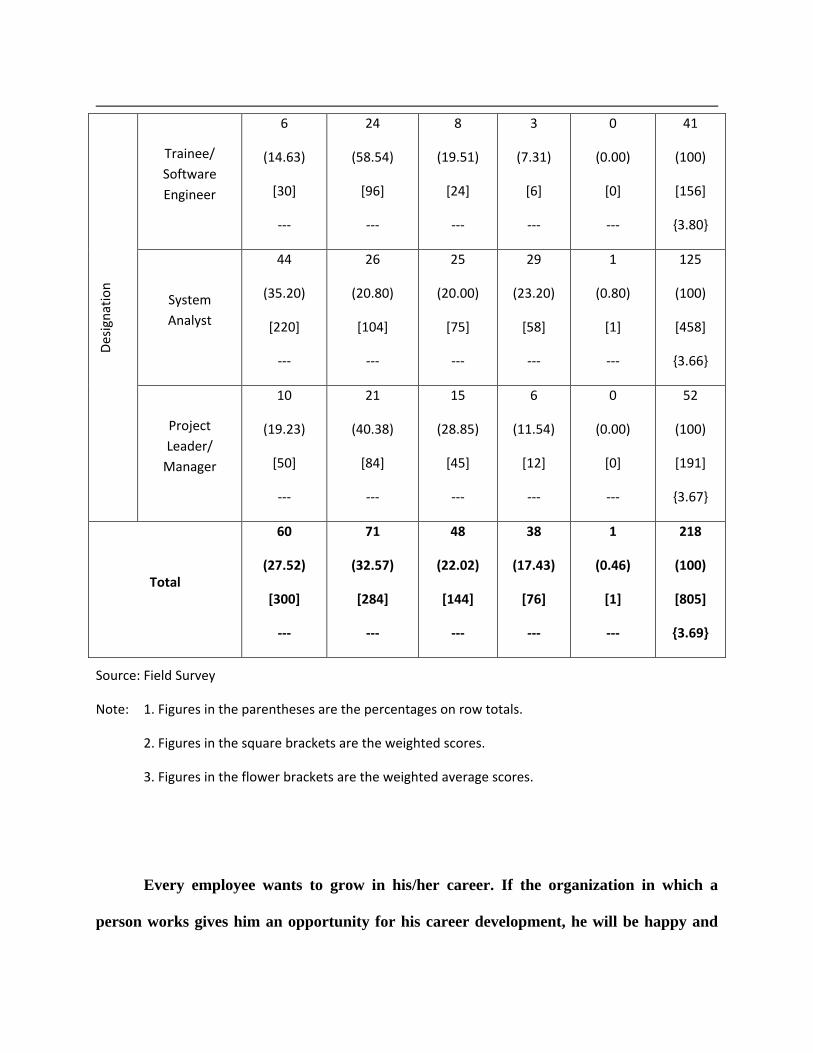
Every employee wants to grow in his/her career. If the organization in which a
person works gives him an opportunity for his career development, he will be happy and

will work hard, to improve his efficiency for the benefit of the organization. To what extent
the company is successful in creating opportunities to its employees for their development
was studied and the results are reported in table 5.08.
Education-wise analysis shows that out of 103 B.E./B.Tech. qualified respondents 24 (23.30 per
cent) strongly agree, 37 (35.92 per cent) simply agree, 22 (21.34 per cent) are undecided, 20 (19.42 per
cent) disagree and none strongly disagree. Out of 115..M.C.A./M.Tech. qualified respondents 36 (31.30
per cent) strongly agree, 34 (29.57 per cent) just agree, 26 (22.61 per cent) are undecided, 18 (15.65 per
cent) disagree and only one (0.57 per cent) strongly disagrees with the statement.
Gender-wise analysis shows that, 33 (26.83 per cent) men and 27 (28.42 per cent) women
strongly agree, 46 (37.39 per cent) men and 25 (26.31 per cent) women simply agree, 28 (22.76 per
cent) men and 20 (21.05 per cent) women are undecided, 15 (12.19 per cent) and 23 (24.21 per cent)
women disagree and only one (0.81 per cent) male respondent strongly disagrees with the statement
that “career paths are laid down for every employee with opportunities clearly specified”.
Designation-wise analysis shows that six (14.63 per cent) trainees/software engineers, 44 (35.20
per cent) system analysts, 10 (19.23 per cent) project leaders/managers strongly agree with the
statement that “career paths are laid down for every employee with opportunities clearly specified.”
More than one-half (58.54 per cent) of the trainees/software engineers, slightly more than one-fifth
(20.80 per cent) of the system analysts, 40.38 per cent of the project leaders/managers simply agree
with the statement. About one-fifth of the trainees/software engineers, exactly one-fifth of the system
analysts, 28.85 per cent of the project leaders/managers could not say anything affirmatively as to
whether they agree with the statement or not. Three (7.31 per cent) trainees/software engineers, 29
(23.20 per cent) system analysts and six (11.54 per cent) project leaders/managers disagree with the
statement. Only one systems analyst strongly disagrees with the statement. Weighted average scores of
the responses of all categories of the respondents fall between 3 and 4, thus representing a high degree
of concurrence with the statement.
On the whole out of 218 selected employees 60 (27.52 per cent) employees strongly agree, 71
(32.57 per cent) employees simply agree, 48 (22.02 per cent) respondents could not say anything in
affirmative, 38 (17.43 per cent) employees disagree and one (0.46 per cent) employee strongly disagrees
with the statement. The weighted average score of the responses of all the respondents, for the given
statement is 3.69 which indicates that they are well in agreement with the statement.
From this it can be understood that majority of the employees are of the opinion that “career
paths are laid down for every employee with opportunities clearly specified” in the organization.
Table: 5.09
Analysis of the Responses to the Statement that “Every Employee is Empowered and Has the
Autonomy to Plan, Organize and Do His Work.”
Variables
No. of the Respondents
Strongly Agree Agree Neutral Disagree Strongly
Disagree Total
Edu
cati
on
B.E./ B.Tech.
8
(7.77)
[40]
---
45
(43.69)
[180]
---
6
(5.82)
[18]
---
44
(42.72)
[88]
---
0
(0.00)
[0]
---
103
(100)
[326]
{3.16}
M.C.A./ M.Tech.
40
(34.78)
[200]
---
41
(35.65)
[164]
---
6
(5.22)
[18]
---
28
(24.35)
[56]
---
0
(0.00)
[0]
---
115
(100)
[438]
{3.81}

G
end
er
Male
23
(18.69)
[115]
---
58
(47.15)
[232]
---
5
(4.06)
[15]
---
37
(30.08)
[74]
---
0
(0.00)
[0]
---
123
(100)
[436]
{3.54}
Female
25
(26.31)
[125]
---
28
(29.47)
[112]
---
7
(7.37)
[21]
---
35
(36.84)
[70]
---
0
(0.00)
[0]
---
95
(100)
[328]
{3.45}
Des
ign
atio
n
Trainee/
Software
Engineer
5
(12.20)
[25]
---
21
(51.22)
[84]
---
5
(12.20)
[15]
---
10
(24.39)
[20]
---
0
(0.00)
[0]
---
41
(100)
[144]
{3.51}
System Analyst
25
(20.00)
[125]
---
45
(36.00)
[180]
---
1
(0.80)
[3]
---
54
(43.20)
[108]
---
0
(0.00)
[0]
---
125
(100)
[416]
{3.33}
Project Leaders/
Managers
24
(46.15)
[120]
---
25
(48.08)
[80]
---
6
(11.54)
[18]
---
8
(15.38)
[16]
---
0
(0.00)
[0]
---
52
(100)
[234]
{4.50}
Total
48
(22.02)
[240]
---
86
(39.45)
[344]
---
12
(5.50)
[36]
---
72
(33.03)
[144]
---
0
(0.00)
[0]
---
218
(100)
[764]
{3.50}
Source: Field Survey

Note: 1. Figures in the parentheses are the percentages on row totals.
2. Figures in the square brackets are the weighted scores.
3. Figures in the flower brackets are the weighted average scores.
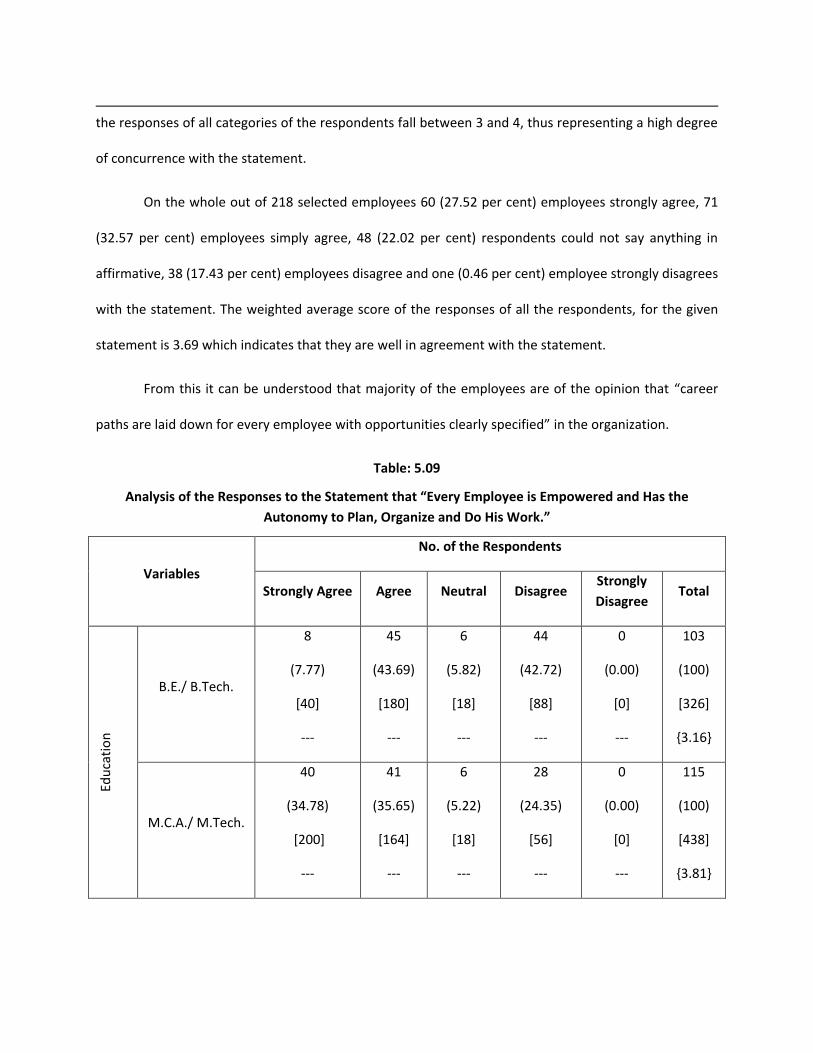
Table 5.09 shows educational qualification-, gender-, and designation-wise analysis of the
responses to the statement that “every employee is empowered and has the autonomy to plan,
organize and do his work.” Autonomy helps to develop a genuine interest in work, widens vision and
relates work with others in the organization. Employee gets sense of pride and evolves certain basic
values by himself. It leads to self-motivation and self-discipline.
Education-wise analysis shows that out of 103 B.E./B.Tech. qualified respondents eight (7.77 per
cent) respondents strongly agree, 45 (43.69 per cent) respondents simply agree, six (5.82 per cent)
respondents are undecided, 44 (42.72 per cent) respondents disagree and none strongly disagree with
the statement. Out of 115 M.C.A./M.Tech. qualified respondents 40 (34.78 per cent) respondents
strongly agree, 41 (35.65 per cent) respondents just agree, six (5.22 per cent) respondents are
undecided, 28 (24.35 per cent) respondents disagree and none strongly disagree with the statement.
Gender-wise analysis shows that, 23 (18.69 per cent) men and 25 (26.31 per cent) women
strongly agree, 58 (47.15 per cent) men and 28 (29.47 per cent) women simply agree, five (4.06 per
cent) men and 7 (7.37 per cent) women are undecided, 37 (30.08 per cent) men and 35 (36.84 per cent)
women disagree with the statement that “every employee is empowered and has the autonomy to plan,
organize and do his/her work”.
Designation-wise analysis shows that five (12.20 per cent) trainees/software engineers, 25
(20.00 per cent) system analysts, and 24 (46.15 per cent) project leaders/ managers strongly agree with
the statement that “every employee is empowered and has the autonomy to plan, organize and do
his/her work.”

Twenty one (51.22 per cent) trainees/software engineers, 45 (36.00 per cent) system analysts,
and 25 (48.08 per cent) project leaders/managers simply agree with the statement. Five (12.20 per cent)
trainees/software engineers, one (0.80 per cent) systems analyst, and six (11.54 per cent) project
leaders/managers could not say whether they agree with the statement or not. Ten (24.39 per cent)
trainees/software engineers, 54 (43.20 per cent) system analysts and eight (15.38 per cent) project
leaders/managers disagree with the statement. Nobody expressed strong disagreement with the
statement. Calculated weighted average scores of responses of the selected project leader/manager
designates show a very high agreement with the statement. Weighted average scores of the others also
show a ‘high’ agreement with the statement.
On the whole out of 218 selected employees 48 (22.02 per cent) employees strongly agree, 86
(39.45 per cent) employees agree, 12 (5.50 per cent) employees are undecided, and 72 (33.03 per cent)
employees disagree with the statement. The WAS for the given statement is 3.50 which indicates that
they are well in agreement with the statement.
From this it can be understood that majority of the employees are of the opinion that “career
paths are laid down for every employee with opportunities clearly specified” in the organization.
Table: 5.10
Analysis of the Responses to the Statement that “Employees regularly receive feedback about their
potential for higher level jobs”
Variables
No. of the Respondents
Strongly Agree Agree Neutral Disagree Strongly
Disagree Total

Ed
uca
tio
n
B.E./ B.Tech.
8
(7.77)
[40]
---
43
(41.75)
[172]
---
17
(16.50)
[51]
---
35
(33.98)
[70]
---
0
(0.00)
[0]
---
103
(100)
[333]
{3.23}
M.C.A./
M.Tech.
35
(30.43)
[175]
---
45
(39.13)
180]
---
14
(12.17)
[42]
---
21
(18.26)
[42]
---
0
(0.00)
[0]
---
115
(100)
[439]
{3.82}
Gen
der
Male
21
(17.07)
[105]
---
46
(37.39)
[184]
---
21
(17.07)
[63]
---
35
(28.45)
[70]
---
0
(0.00)
[0]
---
123
(100)
[422]
{3.43}
Female
22
(23.16)
[110]
---
42
(44.21)
[168]
---
10
(10.53)
[30]
---
21
(22.10)
[42]
---
0
(0.00)
[0]
---
95
(100)
[350]
{3.68}
Des
ign
atio
n
Trainee/
Software
Engineer
5
(12.20)
[25]
---
25
(60.98)
[100]
---
3
(7.32)
[9]
---
8
(19.51)
[16]
---
0
(0.00)
[0]
---
41
(100)
[154]
{3.76}
System
Analyst
25
(20.00)
[125]
---
48
(38.40)
[192]
---
17
(13.60)
[51]
---
35
(28.00)
[70]
---
0
(0.00)
[0]
---
125
(100)
[438]
{3.50}

Project
Leader/
Manager
13
(25.00)
[65]
---
15
(28.85)
[60]
---
11
(21.15)
[33]
---
13
(25.00)
[26]
---
0
(0.00)
[0]
---
52
(100)
[184]
{3.54}
Total
43
(19.72)
[215]
---
88
(40.37)
[352]
---
31
(14.22)
[93]
---
56
(25.69)
[112]
---
0
(0.00)
[0]
---
218
(100)
[772]
{3.54}
Source: Field Survey
Note: 1. Figures in the parentheses are the percentages on row totals.
2. Figures in the square brackets are the weighted scores.
3. Figures in the flower brackets are the weighted average scores.
Table 5.10 shows educational qualification-, gender-, and designation-wise analysis of the
responses to the statement that “employees regularly receive feedback about their potential for higher
level jobs”. To develop the human resources in the organization, continuous feedback should be
provided to the employees about their strengths and weaknesses. With the help of the feedback one
can get to know about their present capabilities and workout the needed things to achieve the desired
position. So, the companies should help employees by providing continuous feedback on their strengths
and weaknesses.
Education-wise analysis shows that out of 103 B.E./B.Tech. qualified respondents eight (7.77 per
cent) respondents strongly agree, 43 (41.75 per cent) respondents simply agree, 17 (16.50 per cent)
respondents are undecided and 35 (33.98 per cent) respondents disagree. Out of 115 M.C.A./M.Tech.
qualified respondents, 35 (30.43 per cent) respondents strongly agree, 45 (39.13 per cent) respondents
just agree, 14 (12.17 per cent) are undecided, and 21 (18.26 per cent) respondents disagree with the

statement. Weighted average scores of both technical graduates and postgraduates show a high degree
of agreement with the statement.
Gender-wise analysis shows that 21 (17.07 per cent) men and 22 (23.16 per cent) women
strongly agree, 46 (37.39 per cent) men and 42 (44.21 per cent) women simply agree, 21 (17.07 per
cent) men and ten (10.53 per cent) women are undecided, and 35 (28.45 per cent) men 21 (22.10 per
cent) women disagree with the statement that “employees regularly receive feedback about their
potential for higher level jobs”. Weighted average scores show a high degree of agreement with the
statement.
Designation-wise analysis shows that five (12.20 per cent) trainees/software engineers, 25
(20.00 per cent) system analysts, and 13 (25.00 per cent) project leaders/ managers strongly agree with
the statement that “employees regularly receive feedback about their potential for higher level jobs.”
Twenty five (60.98 per cent) trainees/software engineers, 48 (38.40 per cent) system analysts, and 15
(28.85 per cent) project leaders/managers simply agree with the statement. Three (7.32 per cent)
trainees/software engineers, 17 (13.60 per cent) system analysts, and 11 (21.15 per cent) project
leaders/managers could not say whether they agree with the statement or not. Eight (19.51 per cent)
trainees/software engineers, 35 (28.00 per cent) system analysts and 13 (25.00 per cent) project
leaders/managers disagree with the statement. Nobody expressed strong disagreement with the
statement. Calculated weighted scores of the responses show a agreement with the statement
irrespective of designation.
On the whole 43 (19.72 per cent) of the selected employees strongly agree, 88 (40.37 per cent)
of the selected employees simply agree, 31 (14.22 per cent) of the selected employees stay neutral, and
56 (25.69 per cent) of the selected employees disagree with the statement. However nobody strongly
disagree with the statement. The WAS for the given statement is 3.54 thus indicating a high level of

agreement with the statement. From this it can be understood that majority of the employees are of the
opinion that “employees regularly receive feedback about their potential for higher level jobs”.
Table: 5.11
Educational Qualification-, Gender-, and Designation-Wise Analysis of the Responses to the Statement
that “The Performance Appraisal Provides an Opportunity for Self Review & Reflection”
Variables
No. of the Respondents
Strongly Agree Agree Neutral Disagree Strongly
Disagree Total
Edu
cati
on
B.E./ B.Tech.
7
(6.79)
[35]
---
38
(36.89)
[152]
---
31
(30.09)
[93]
---
27
(26.21)
[54]
---
0
(0.00)
[0]
---
103
(100)
[334]
{3.24}
M.C.A./
M.Tech.
33
(28.70)
[165]
---
34
(29.57)
[136]
---
12
(10.43)
[36]
---
36
(31.30)
[72]
---
0
(0.00)
[0]
---
115
(100)
[409]
{3.56}
Gen
der
Male
19
(15.45)
[95]
---
45
(36.58)
[180]
---
23
(18.69)
[69]
---
36
(29.27)
[72]
---
0
(0.00)
[0]
---
123
(100)
[416]
{3.38}
Female
21
(22.10)
[105]
---
27
(28.42)
[108]
---
20
(21.05)
[60]
---
27
(28.42)
[54]
---
0
(0.00)
[0]
---
95
(100)
[327]
{3.44}

D
esig
nat
ion
Trainee/
Software
Engineer
7
(17.07)
[35]
---
22
(53.66)
[88]
---
4
(9.76)
[12]
---
8
(19.51)
[16]
---
0
(0.00)
[0]
---
41
(100)
[151]
{3.68}
System
Analyst
24
(19.20)
[120]
---
23
(18.40)
[92]
---
37
(29.60)
[111]
---
41
(32.80)
[82]
---
0
(0.00)
[0]
---
125
(100)
[405]
{3.24}
Project
Leader/
Manager
9
(17.31)
[45]
---
27
(51.92)
[108]
---
2
(3.85)
[6]
---
14
(26.92)
[28]
---
0
(0.00)
[0]
---
52
(100)
[187]
{3.60}
Total
40
(18.35)
[200]
---
72
(33.03)
[288]
---
43
(19.72)
[129]
---
63
(28.89)
[126]
---
0
(0.00)
[0]
---
218
(100)
[743]
{3.40}
Source: Field Survey
Note: 1. Figures in the parentheses are the percentages on row totals.
2. Figures in the square brackets are the weighted scores.
3. Figures in the flower brackets are the weighted average scores.
Self appraisal is a good practice in performance appraisal. To know whether it is practiced in the
organization or not, the responses of the selected employees have been collected, analyzed and
presented in the table 5.11.

Education-wise analysis shows that out of 103 B.E./B.Tech. qualified employees seven (6.79 per
cent) respondents strongly agree, 38 (36.89 per cent) respondents simply agree, 31 (30.09 per cent)
respondents are undecided and 27 (26.21 per cent) respondents disagree. Out of 115 M.C.A./M.Tech.
qualified respondents 33 (28.70 per cent) respondents strongly agree, 34 (29.57 per cent) respondents
just agree, 12 (10.43 per cent) respondents are undecided, and 36 (31.30 per cent) respondents disagree
with the statement. Weighted average scores show a high degree of agreement with the statement
(WAS between 3 and 4). However postgraduates agree more with the statement than the graduates.
Gender-wise analysis shows that 19 (15.45 per cent) male respondents and 21 (22.10 per cent)
female respondents strongly agree with the statement, 45 (36.58 per cent) male respondents and 27
(28.42 per cent) female respondents simply agree with the statement, 23 (18.69 per cent) male
respondents and 20 (21.05 per cent) female respondents are undecided, 36 (29.27 per cent) male
respondents and 27 (28.42 per cent) female respondents disagree with the statement. Calculated
weighted average scores of both male and female respondents show a high degree of agreement with
the statement (WAS 3 to 4).
Designation-wise analysis shows that seven (17.07 per cent) trainees/software engineers, 24
(19.20 per cent) system analysts, nine (17.31 per cent) project leaders/ managers strongly agree with
the statement that “the performance appraisal provides an opportunity for self review and reflection.”
Twenty two (53.66 per cent) trainees/software engineers, 23 (18.40 per cent) system analysts, 27 (51.92
per cent) project leaders/managers just agree with the statement. Four (9.76 per cent)
trainees/software engineers, 37 (29.60 per cent) system analysts, and two (3.85 per cent) project
leaders/managers are neutral. Eight (19.51 per cent) selected trainees/software engineers, 41 (32.80
per cent) system analysts and 14 (26.92 per cent) project leaders/managers disagree with the
statement. It is noteworthy that nobody strongly disagrees with the statement. Weighted average

scores of the responses of all categories of the respondents show a high degree of agreement with the
statement.
On the whole 40 (18.35 per cent) of the selected employees strongly agree, 72 (33.03 per cent)
of the selected employees agree, 43 (19.72 per cent) of the selected employees stay neutral, and 63
(28.89 per cent) of the selected employees disagree with the statement. Nobody strongly disagrees with
the statement. The WAS for the given statement is 3.40 thus indicating a ‘high’ level of agreement with
the statement.
From this it can be understood that majority of the employees are of the opinion that “the
performance appraisal provides an opportunity for self review and reflection”.
Table: 5.12
Educational Qualification-, Gender-, and Designation-Wise Analysis of the Responses to the Statement
that “The Appraisal System Provides for a Frank Discussion for Both the Appraiser and the Appraised.”
Variables
No. of the Respondents
Strongly
Agree Agree Neutral Disagree
Strongly
Disagree Total
Edu
cati
on
B.E./ B.Tech.
8
(7.77)
[40]
---
56
(54.37)
[224]
---
25
(24.27)
[75]
---
14
(13.59)
[28]
---
0
(0.00)
[0]
---
103
(100)
[367]
{3.56}
M.C.A./ M.Tech.
37
(32.17)
[185]
---
51
(44.35)
[204]
---
19
(16.52)
[57]
---
8
(6.96)
[16]
---
0
(0.00)
[0]
---
115
(100)
[462]
{4.02}

G
end
er
Male
19
(15.45)
[95]
---
64
(52.03)
[256]
---
27
(21.95)
[81]
---
13
(10.57)
[26]
---
0
(0.00)
[0]
---
123
(100)
[458]
{3.72}
Female
26
(27.37)
[130]
---
43
(45.26)
[172]
---
17
(17.89)
[51]
---
9
(9.47)
[18]
---
0
(0.00)
[0]
---
95
(100)
[371]
{3.90}
Des
ign
atio
n
Trainee/
Software Engineer
5
(12.20)
[25]
---
28
(68.29)
[112]
---
4
(9.76)
[12]
---
4
(9.76)
[8]
---
0
(0.00)
[0]
---
41
(100)
[157]
{3.83}
System Analyst
24
(19.20)
[120]
---
59
(47.20)
[236]
---
36
(28.80)
[108]
---
6
(4.80)
[12]
---
0
(0.00)
[0]
---
125
(100)
[476]
{3.81}
Project Leader/
Manager
16
(30.77)
[80]
---
20
(38.46)
[80]
---
4
(7.69)
[12]
---
12
(23.08)
[24]
---
0
(0.00)
[0]
---
52
(100)
[196]
{3.77}
Total
45
(20.64)
[225]
---
107
(49.08)
[428]
---
44
(20.18)
[132]
---
22
(10.09)
[44]
---
0
(0.00)
[0]
---
218
(100)
[829]
{3.80}
Source: Field Survey

Note: 1. Figures in the parentheses are the percentages on row totals.
2. Figures in the square brackets are the weighted scores.
3. Figures in the flower brackets are the weighted average scores.
Table 5.12 shows educational qualification-, gender-, and designation-wise analysis of the
responses to the statement that “the appraisal system provides for a frank discussion for both the
appraiser and the appraised.”
Education-wise analysis shows that out of 103 B.E./B.Tech. qualified employees eight (7.77 per
cent) strongly agree, 56 (54.37 per cent) agree, 25 (24.27 per cent) are undecided and 14 (13.59 per
cent) disagree with the statement. Out of 115 M.C.A./M.Tech. qualified respondents 37 (32.46 per cent)
strongly agree, 51 (44.74 per cent) agree, 19 (16.67 per cent) are undecided, and eight (7.02 per cent)
disagree with the statement. Calculated weighted average scores indicate that, the level of agreement
technical graduates, with the statement is high, whereas the level of agreement of the postgraduates
with the statement is very high.
Gender-wise analysis shows that 19 (15.45 per cent) men and 26 (27.37 per cent) women
strongly agree, 64 (52.03 per cent) men and 43 (45.26 per cent) women agree, 27 (21.95 per cent) men
and 17 (17.89 per cent) women are undecided, 13 (10.57 per cent) men nine (9.47 per cent) women
disagree with the statement that “the appraisal system provides for a frank discussion for both the
appraiser and the appraised”. Weighted average scores of the responses of both men and women show
a high level of agreement with the statement.
Designation-wise analysis of the responses shows that five (12.20 per cent) trainees/software
engineers, 24 (19.20 per cent) system analysts, and 16 (30.77 per cent) project leaders/managers
strongly agree with the statement that “the appraisal system provides for a frank discussion for both the
appraiser and the appraised.” Twenty eight (68.29 per cent) trainees/software engineers, 59 (47.20 per

cent) system analysts, and 20 (38.46 per cent) project leaders/managers just agree with the statement.
Four (9.76 per cent) trainees/software engineers, 36 (28.80 per cent) system analysts, and four (7.69 per
cent) project leaders/managers are neutral. Four of the selected trainees/software engineers, six (4.80
per cent) system analysts, 12 (23.08 per cent) project leaders/managers disagree with the statement.
Nobody strongly disagrees with the statement. In this case also calculated weighted average scores of
responses of the selected employees, irrespective of designation show a high level of agreement.
On the whole 45 (20.64 per cent) of the selected employees strongly agree, 107 (49.08 per cent)
of the selected employees agree, 44 (20.18 per cent) of the selected employees stay neutral, and 22
(10.09 per cent) of the selected employees disagree with the statement. Nobody strongly disagrees with
the statement. The WAS for the given statement is 3.80 thus indicating a ‘high’ level of agreement with
the statement.
From this it can be understood that majority of the employees are of the opinion that “the
appraisal system provides for a frank discussion for both the appraiser and the appraised.”
Conclusion
Performance appraisal is a very important aspect of human resource management. Performance
appraisal is used for validating the recruitment sources and selection methods used, for reward
allocation, for granting pay hikes, for giving promotions and for identifying the developmental needs. In
short performance appraisal is a process of managing and developing people. Performance appraisal can
also mean a comprehensive process that encompasses planning for future performance, tracking
performance as it occurs, and rating performance at the end of a review period. In short it is linked with
each and every other aspect of human resource management. Hence knowing the performance
appraisal practices, employee opinions about different aspects of performance appraisal system would

help in improving the system. The above discussion helps in identifying the system in existence and the
merits and demerits thereof.
References:
1. Dr. V.V. Subrahmanya Sarma, G. Jaya, L. Munindar Rao, R. Shirisha, Potential Appraisal
System – An Emerging Approach to Organisational Development, HRM Review, Sept., 2004,
pp. 59-67.
2. Gurpinder Kaur and Jaslin Kaur, Performance Appraisal- An Indispensable Management Tool,
HRD Times, Sept., 2001.
3. Ibid
4. Ibid
5. R.S.Dwivedi, Managing Human Resources—Personnnel Management in Indian Enterprises,
6. Fisher Martin, Performance Appraisals, Kogan Page limited, London, 1996,
7. Coming, M.W., Theory and Practice of Personnel Management, William Heinemann Ltd.,
London, 1972, pp. 111-112.
8. Michael, R Correll and Frank, E. Kuzits, Personnel, Charles E Merril Publishing Co., London,
1982, p.237.
9. http://appraisals.nakurihub.com/
10. William B. Werther, JR. and Keith Davis, Human Resources and Personnel Management,
McGraw-Hill International Editions, Fourth Edition,
11. http://www.performance-appraisal.com/benefits.htm

12. www. Performance-appraisal.com
13. http://appraisals,nakurihub.com
14. http://appraisals.nakurihub.com/modern-method.html
CHAPTER - 6
PROMOTION POLICY
In this chapter meaning and purpose promotion,
different bases for promotion and promotion policy have
been discussed. Number of promotions received by the
respondents; perceptions of the respondents on availability
of promotion opportunities in the company, bases for
promotion, satisfaction with existing promotion policy in
the company; clarity, transparency and fairness in the
company’s promotion policies have been analyzed on the