mirvac group annual report
TRANSCRIPT

MIRVA
C GRO
UP A
NN
UA
L REPO
RT 2015
MIR
VAC
PRO
PERT
Y T
RUST
AN
NU
AL
REP
ORT
201
5
REPORT 2015
MIRVAC GROUPANNUAL REPORT

MIRVAC GROUP ANNUAL REPORT 2015
Mirvac Group Annual Report
Mirvac Group comprises Mirvac Limited (ABN 92 003 280 699) and its controlled entities (including Mirvac Property Trust (ARSN 086 780 645) and its controlled entities).
Contents Page
Directors’ report 01Remuneration report 11Auditor’s independence declaration 31Financial statements 32Directors’ declaration 97Independent auditor’s report to the members of Mirvac Limited 98Securityholder information 100Glossary of acronyms 101Directory 102
For the year ended 30 June 2015

MIRVAC GROUP ANNUAL REPORT 2015 01
The Directors of Mirvac Limited present their report, together with the consolidated report of Mirvac Group (“Mirvac” or “Group”) for the year ended 30 June 2015. Mirvac comprises Mirvac Limited (“parent entity” or “company”) and its controlled entities, which includes Mirvac Property Trust (“MPT” or “Trust”) and its controlled entities.
DirectorsThe following persons were Directors of Mirvac Limited during the whole of the year and up to the date of this report, unless otherwise stated:
— John Mulcahy
— Susan Lloyd-Hurwitz
— Christine Bartlett (appointed 1 December 2014)
— Peter Hawkins
— Samantha Mostyn (appointed 1 March 2015)
— James M. Millar AM
— John Peters
— Elana Rubin.
Principal activitiesThe principal continuing activities of Mirvac consist of real estate investment, development and investment management. Mirvac has two core divisions: Investment (comprising MPT) and Development (comprising residential and commercial development).
There are also two business units, Mirvac Investment Management which comprises third party capital management (Mirvac Capital (“Capital”)); and the property asset management business (Mirvac Asset Management (“MAM”)).
Dividends/distributionsDividends/distributions paid to stapled securityholders during the year were as follows:
2015 2014 $m $m
June 2014 half yearly dividends/distributions paid on 28 August 2014: 4.60 cents per stapled security (“CPSS”) 169.8June 2013 half yearly dividends/distributions paid on 26 July 2013: 4.50 CPSS 164.9December 2014 half yearly dividends/distributions paid on 26 February 2015: 4.50 CPSS 166.4December 2013 half yearly dividends/distributions paid on 27 February 2014: 4.40 CPSS 161.3
Total dividends/distributions paid 336.2 326.2
The June 2015 half yearly dividend/distribution of 4.90 CPSS totalling $181.2m is payable on 26 August 2015.
Dividends/distributions paid and payable by Mirvac for the year ended 30 June 2015 totalled $347.6m, being 9.40 CPSS (2014: $331.1m — 9.00 CPSS). The payments for the year ended 30 June 2015 and the previous year were distributions made by the Trust.
Operating and financial reviewThe statutory profit after tax attributable to the stapled securityholders of Mirvac for the year ended 30 June 2015 was $609.9m (2014: $447.3m). The operating profit (profit before specific non-cash and significant items) was $454.8 (2014: $437.8m) which is within the market guidance provided previously. Operating profit is a financial measure which is not prescribed by Australian Accounting Standards (“AAS”) and represents the profit under AAS adjusted for specific non-cash items and significant items. The Directors consider operating profit to reflect the core earnings of the Group.
The following table summarises key reconciling items between statutory profit after tax attributable to the stapled securityholders of Mirvac and operating profit. The operating profit information in the table has not been subject to any specific audit procedures by the Group’s auditor but has been extracted from note 1 to the accompanying financial statements for the year ended 30 June 2015, which have been subject to audit; refer to pages 98 and 99 for the auditor’s report on the financial statements.
Directors’ report

MIRVAC GROUP ANNUAL REPORT 201502
Directors’ report
Operating and financial review / continued 2015 2014 $m $m
Profit attributable to the stapled securityholders of Mirvac 609.9 447.3
Specific non-cash itemsNet gain on fair value of investment properties and investment properties under construction (“IPUC”) (140.8) (48.8)Net loss on fair value of derivative financial instruments and associated foreign exchange movements 1 10.0 15.8Security based payments (“SBP“) expense 2 5.6 6.5Depreciation of owner-occupied properties (“OOP”) 3 6.1 5.9Straight-lining of lease revenue 4 (5.3) (12.2)Amortisation of lease fitout incentives 3 9.3 10.3Net gain on fair value of investment properties, derivatives and other specific non-cash items included in share of net profit of joint ventures and associates (“JVA”) 5 (29.8) (19.6)
Significant itemsImpairment of loans, investments and inventories (0.2) (1.2)Restructuring costs 2, 6 6.8 —Impairment of goodwill — 24.5Net (gain)/loss from sale of non-aligned assets 7 (16.1) 6.0
Tax effectTax effect of non-cash and significant adjustments 8 (0.7) 3.3
Operating profit (profit before specific non-cash and significant items) 454.8 437.8
1) Total of Gain and Loss on fair value of derivative financial instruments and Foreign exchange loss in the consolidated statement of comprehensive income (“SoCI”).2) Included within Employee benefits expenses in the consolidated SoCI.3) Included within Depreciation and amortisation expenses in the consolidated SoCI.4) Included within Investment properties rental revenue in the consolidated SoCI.5) Included within Share of net profit of JVA accounted for using the equity method in the consolidated SoCI.6) Included within Other expenses in the consolidated SoCI.7) Included within Net gain on sale of assets in the consolidated SoCI.8) Included in Income tax expense in the consolidated SoCI.9) Excludes specific non-cash items, significant items and related taxation.10) Net debt (at foreign exchange hedged rate) excluding leases/(total tangible assets — cash).11) NTA per stapled security, based on ordinary securities including Employee Incentive Scheme (“EIS”) securities.12) Pre-transaction costs.13) The sale price is calculated on the basis of rents determined under the PwC Agreement for Lease, Wilson and MPT car parking leases, and the target net
annual rents for the residual unlet space.
Financial, capital management and operational highlightsKey financial highlights for the year ended 30 June 2015:
— profit attributable to the stapled securityholders of Mirvac increased to $609.9m from $447.3m (June 2014);
— operating profit after tax of $454.8m 9 (June 2014: $437.8m), representing 12.3 cents per stapled security (“CPSS”);
— operating cash inflow of $412.7m, which is consistent with the prior year;
— gearing remained within the Group’s target range of 20.0 to 30.0 per cent at 24.3 per cent 10;
— distributions of $347.6m, representing 9.40 CPSS; and
— net tangible assets (“NTA”) 11 per stapled security of $1.74, up from $1.66 (June 2014).
Key capital management highlights for the year ended 30 June 2015:
— maintained strong liquidity with $539.6m of cash and undrawn committed bank facilities held and with no debt maturities until September 2016;
— reduced average borrowing costs to 5.2 per cent per annum (including margins and line fees), while maintaining weighted average debt maturity at 4.3 years;
— restructured the Group’s revolving syndicated bank loan on more favourable terms and reduced the amount of debt maturing in any one year. The facility now totals $1,400.0m (June 2014: $1,388.0m), with $200.0m maturing in FY17, $350.0m maturing in FY18, $300.0m maturing in FY19, $300.0m maturing in FY20 and $250.0m maturing in FY21; and
— continued to comfortably meet all debt covenants.
Key operational highlights for the year ended 30 June 2015:
— acquired $527.0m 12 of key strategic assets in the Investment portfolio, including Birkenhead Point Outlet Centre, Sydney NSW and a portfolio of industrial assets from Altis Real Estate Equity Partnership Fund No. 1 (“Altis”);
— acquired $412.8m of future residential development projects in key locations, and acquired Leighton Properties Pty Limited’s 50.0 per cent interest in the Green Square Consortium;
— entered into an agreement with unlisted property fund manager ISPT Pty Ltd (“ISPT”) for the sale of a 50.0 per cent interest in 2 Riverside Quay, Melbourne VIC, for a total consideration of $106.0m 13. ISPT will fund 50.0 per cent of the total development costs throughout the construction period;
— disposed of seven assets, comprising five office assets and two retail assets for a combined total of $406.7m. This follows the disposal of seven assets sold to an affiliate of Blackstone Real Estate Asia (“Blackstone”) in July 2014, in addition to a 50.0 per cent interest in 275 Kent Street, Sydney NSW, as outlined in the FY14 Annual Report;

MIRVAC GROUP ANNUAL REPORT 2015 03
Financial, capital management and operational highlights / continued— entered into an exclusive dealing period with financial-
services provider, Westpac, to finalise documentation for a new lease agreement at 275 Kent Street, Sydney NSW;
— maintained strong portfolio occupancy of 96.5 per cent within the Investment portfolio 1;
— leased 127,858 square metres (9.2 per cent of total net lettable area) within the Investment portfolio;
— settled 2,271 residential lots, in line with target of greater than 2,200 lots;
— achieved strong levels of residential exchanged pre-sales contracts of $1,987.2m 2; and
— achieved 5.1 Star NABERS average energy rating across the office portfolio.
Outlook 3
Momentum in Australia’s property markets continues to be divergent across sector and geography, as the economy continues to rebalance away from very strong levels of mining-led growth. Low interest rates are expected to remain supportive over FY16, and together with a projected low Australian dollar, economic growth is expected to gradually improve, remaining strongest in New South Wales and Victoria. Mirvac’s deliberate weighting to New South Wales and Victoria means that it is well positioned to perform across business cycles. Mirvac’s mix of passive and active capital will also ensure it continues to provide stable income and growth to the Group.
Mirvac will remain focused on prudently managing its capital position by monitoring and accessing diversified sources of capital, including equity, domestic and international debt and wholesale capital. This focus will help to ensure Mirvac can continue to meet its strategic objectives without increasing its overall capital management risk profile.
Divisional highlightsInvestmentAt 30 June 2015, Investment (comprising MPT and a small number of assets held by the Company) had $7,517.7m 4 invested capital across 59 5 direct property assets, covering the office, retail and industrial sectors, as well as investments in car parks, a hotel and other funds managed by Mirvac.
The split of invested capital across each sector was:
— office: 54.6 per cent;
— retail: 28.5 per cent;
— industrial: 8.8 per cent; and
— other: 8.1 per cent 6.
For the 12 months to 30 June 2015, Investment’s statutory profit before tax was $593.2m (June 2014: $438.1m), driven by an uplift in property revaluations, and its operating profit before tax was $418.3m, supported by acquisitions and lower borrowing costs, offset by the disposal of assets and a 50.0 per cent interest in 275 Kent Street, Sydney at the beginning of the financial year. Investment’s earnings continued to be secured by a strong weighted average lease expiry (“WALE”) profile of 4.5 years 7, 92.8 per cent of FY15 rent reviews being linked or fixed to the Consumer Price Index (“CPI”), and 65.7 per cent of revenue being derived from multinational, ASX listed and government tenants.
Key operational highlights for Investment for the year ended 30 June 2015:
— achieved 2.6 per cent like-for-like net operating income growth;
— maintained high occupancy at 96.5 per cent 8;
— total investment property revaluations provided a net uplift of $146.2m 9 (or 2.3 per cent) over the previous book value for the 12 months to 30 June 2015. On a like-for-like basis (excluding IPUC, acquisitions and disposals), the net uplift was $136.2m (or 2.4 per cent);
— acquired Birkenhead Point Outlet Centre, Sydney NSW, including an adjoining car parking facility and marina, for a total consideration of $310.0m;
— acquired a portfolio of four industrial assets from Altis for a total consideration of $213.9m, in line with Mirvac’s strategy to acquire quality assets in key locations;
— disposed of seven assets, comprising five office assets and two retail assets, for a combined total of $406.7m. This follows the disposal of seven assets which were sold to Blackstone in July 2014, in addition to a 50.0 per cent interest in 275 Kent Street, Sydney NSW, as outlined in the FY14 Annual Report;
— entered into an exclusive dealing period with Westpac to finalise documentation for a new lease agreement at 275 Kent Street, Sydney NSW;
— completed 437 leasing deals over 127,858 square metres of net lettable area (9.2 per cent of total net lettable area); and
— key development highlights are outlined in the Commercial highlights section in this report. Key leasing achievements for assets under development included:
> 200 George Street, Sydney NSW: increased pre-leasing to 81.0 per cent following the announcement that Mirvac would relocate its Sydney head office to this new commercial development. Mirvac will occupy 5,703 square metres across five floors of the tower for a ten-year term. Anchor tenant, EY, has pre-committed to approximately 66.0 per cent of office space;
> Orion Springfield Central, Springfield QLD: progressed with the leasing of the Stage 2 expansion of approximately 32,000 square metres, with 75.2 per cent 10 leased (up from 59.2 per cent at 30 June 2014);
> Harold Park Tramsheds, Sydney NSW: progressed with leasing for over 6,000 square metres of retail space, which will include a supermarket, market style food halls, boutique retailers, cafés, restaurants and a gymnasium on completion. The project was 58.7 per cent leased as at 30 June 2015; and
> Stanhope Village, Stanhope Gardens NSW: achieved practical completion of the Stage 4 expansion in March 2015, ahead of schedule and 100.0 per cent leased on completion.
1) By area, excludes indirect property investments, and includes 8 Chifley Square, Sydney NSW.2) Adjusted for Mirvac’s share of joint venture associates and Mirvac managed funds.3) These future looking statements should be read in conjunction with future releases to the ASX.4) Includes IPUC, indirect property investments and 8 Chifley Square, Sydney NSW.5) Includes 8 Chifley Square, Sydney NSW. Although not a direct property asset, it is treated as an investment accounted for using the equity method for
statutory reporting.6) Includes IPUC, indirect property investments, car park assets and hotel.7) By income, includes 8 Chifley Square, Sydney NSW and excludes indirect property investments.8) By area, includes 8 Chifley Square, Sydney NSW and excludes indirect property investments.9) After adjustment for OOP, the net uplift was $140.8m, including IPUC.10) As at 31 July 2015.

MIRVAC GROUP ANNUAL REPORT 201504
Directors’ report
For the year ended 30 June 2015, MIM recorded a statutory profit before tax of $5.1m (June 2014: $5.8m) and an operating profit before tax of $4.5m.
At 30 June 2015, Capital managed three wholesale funds: Mirvac Wholesale Residential Development Partnership, Tucker Box Hotel Group and JF Infrastructure Yield Fund; as well as two retail funds: Mirvac Development Fund — Seascapes and Mirvac Development Fund — Meadow Springs.
Capital also acted as investment manager for the Australian Office Alliance (“Alliance”). The initial asset in the Alliance, 699 Bourke Street, Melbourne, reached practical completion in April 2015 and is 100.0 per cent leased to AGL.
Prior to 3 December 2014, MIM was also responsible for the ASX listed Mirvac Industrial Trust (ASX: MIX). On 3 December 2014, Mirvac announced that all MIX units were transferred to AustFunding Pty Limited, a subsidiary of the Goldman Sachs Group Inc., as part of the Scheme Implementation Agreement that was entered into on 19 September 2014.
MAM provides asset management services primarily for the MPT portfolio. MAM currently manages 61 properties.
Outlook 1
Capital remains focused on establishing investment partnerships with strategically aligned domestic and international institutional investors to coinvest alongside Mirvac in office, industrial, retail and residential assets and development projects. MAM will also continue to provide asset management services in accordance with growth in the MPT and Capital portfolios and in assets owned by third parties where there are common interests.
DevelopmentMirvac’s Development business unit operates across national product lines consisting of Residential (comprising Masterplanned Communities and Apartments) and Commercial.
At 30 June 2015, Development had $1,579.3m of invested capital.
For the year ended 30 June 2015, Development’s statutory profit before tax was $126.6m (June 2014: $112.0m) and its operating profit before tax was $126.6m.
ResidentialThe business unit continued to deliver quality residential product in the Group’s core metropolitan markets, with new release projects targeted at the right price points and right locations. Key highlights across Masterplanned Communities and Apartments:
Masterplanned Communities— Elizabeth Hills and Elizabeth Point NSW: 100.0 per cent of
released lots sold across both projects;
— Alex Avenue NSW: continued strong sales with 83.4 per cent of released lots pre-sold (267 settled and exchanged contracts);
— Googong NSW: continued strong sales with 93.1 per cent of released lots pre-sold (944 settled and exchanged contracts);
— Tullamore, Doncaster VIC: achieved strong sales with 96.9 per cent of released lots pre-sold (189 exchanged contracts);
— Woodlea, Rockbank VIC: achieved strong sales with 100.0 per cent of released lots pre-sold (265 exchanged contracts);
— Jack Road, Cheltenham VIC: achieved strong sales with 87.0 per cent of released lots pre-sold (47 exchanged contracts);
— Harcrest, Melbourne VIC: continued strong sales with 99.6 per cent of total released lots sold (815 exchanged contracts); and
— Greystone Terraces, Everton Park QLD: achieved solid sales with 58.3 per cent of released lots pre-sold (21 exchanged contracts).
Divisional highlights / continuedThe Group demonstrated its ability to create world-class, sustainable workplaces through a continued focus on sustainability, with key highlights including:
— a 5.1 Star NABERS average energy rating across the office portfolio;
— 8 Chifley Square, Sydney NSW achieved a 6 Star Green Star As-Built v2 rating;
— 200 George Street, Sydney NSW awarded a 6 Star Green Star — Office Design v3 rating;
— 23 Furzer Street, Phillip ACT achieved the first 6.0 Star NABERS energy rating for a major office building without the use of GreenPower. The property has reduced energy consumption by 32.4 per cent since 2011. The asset boasts Mirvac’s first large scale solar photovoltaic system, with an 80 kilowatt solar array, which will see a reduction of approximately 100 tonnes of greenhouse gas emissions per annum; and
— received the NSW Green Globes 10-year Sustainability Award for demonstrating long-term environmental achievements and successful program delivery and outcomes between 2004 and 2014.
Outlook 1
Global economic activity continues to be mixed, with conditions continuing to improve in the US, sluggish improvement in Europe and Japan and cooling growth in China. Domestically, the economy has recorded slightly below-trend growth, impacted by significant falls in commodity prices and a slow-down of investment in the resource sector. However, a low Australian dollar, a sustained period of low interest rates and strong investor demand for prime assets are providing support for activity in the office, retail and industrial sectors. The office portfolio, with a solid occupancy, embedded rental increases, quality tenant covenants and a strong weighting to Australia’s largest office markets, Sydney and Melbourne, continues to be well positioned. Conditions in the retail sector have been divergent throughout Australia, with mixed levels of consumer confidence and soft household income growth. Despite this, Mirvac’s retail assets, predominantly situated in metropolitan locations, should continue to benefit from their exposure to solid catchments in urban markets, particularly Sydney where 67.3 per cent 2 of the portfolio is located and where retail sales have been robust. Tenant demand for industrial assets in New South Wales has been moderate over the past year and broadly meeting the levels of new supply. The industrial portfolio, with minimal vacancy and a long WALE of 7.6 years 3, continues to provide steady income to the Group.
Overall, the Investment remains focused on providing secure passive income to the Group, with key areas of focus including:
— improving the quality of the portfolio via non-aligned asset sales and creating new product to be held for the long term;
— extracting the benefit of the Group’s demonstrated competitive advantage in the office sector by creating innovative, collaborative and flexible workplaces for the future;
— maintaining a focus on the key markets of Sydney and Melbourne in the office and industrial sectors; and
— focusing on quality retail assets located in key urban markets and unlocking value through the retail development pipeline.
Investment ManagementMirvac Investment Management (“MIM”) comprises two business activities for segment reporting purposes, including third party capital management (Mirvac Capital (“Capital”)) and property asset management (Mirvac Asset Management (“MAM”)).
1) These future looking statements should be read in conjunction with future releases to the ASX.2) By book value.3) By income.

MIRVAC GROUP ANNUAL REPORT 2015 05
State based lot settlements by product for the year ended 30 June 2015 were as follows:
Masterplanned State Communities Apartments Total
NSW 770 482 1,252QLD 252 13 265VIC 186 184 370WA 375 9 384
Total 1,583 688 2,271
CommercialMirvac’s commercial development activities include office, retail and industrial projects. For the year ended 30 June 2015, Mirvac’s office development pipeline had an end value of $3,223.3m on a 100.0 per cent ownership basis.
Key leasing highlights for Commercial for the year ended 30 June 2015 were outlined in the Investment highlights section of this Report. Key development milestones were:
— 200 George Street, Sydney NSW: demolition and excavation works complete with the concrete core at Level 36 and the concrete slabs at Level 32. The project remains on track, with completion expected in FY16. The office tower has been awarded a 6.0 Star Green Star — Office Design v3 rating, and is targeting a 5.0 Star NABERS energy rating and a 6.0 Star Green Star rating;
— 699 Bourke Street, Melbourne VIC: reached practical completion in April 2015, with fit-out works complete and major tenant, AGL, moving into the building in June 2015. The A-grade building with premium-grade services has achieved a 6.0 Star Green Star — Office Design v2 rating, demonstrating world leadership in sustainable design, and is targeting a 5.0 Star NABERS energy rating;
— 2 Riverside Quay, Melbourne VIC: commenced construction in July 2014, with completion expected in FY17. A 5.0 Stars NABERS energy rating and a 5.0 Star Green Star Office Design rating are being targeted;
— Treasury Building, Perth WA: completed the structural core for the final level of the building in March 2015, with completion anticipated for the first half of FY16. The A-grade office tower located on the landmark site of the Old Treasury building is expected to achieve a 4.5 Star NABERS energy rating and 5.0 Star Green Star rating;
— Orion Springfield Central, Springfield QLD: construction progressed on the Stage 2 expansion, which will add approximately 32,000 square metres. The project will introduce a Coles, Target, Event Cinemas and additional specialty stores and commercial suites to an expanded town centre, and is due for completion in the second half of FY16;
— Harold Park Tramsheds, Sydney NSW: commenced construction in November 2014 for over 6,000 square metres of retail space, which will include a supermarket, market style food halls, boutique retailers, cafés, restaurants and a gymnasium on completion. Mirvac has dedicated 500 square metres of community space to Sydney Council on completion, due in the second half of FY16;
— Stanhope Village, Stanhope Gardens NSW: achieved practical completion of the Stage 4 expansion in March 2015 ; and
— Kawana Shopping World, Buddina QLD: achieved practical completion of Stage 4 in July 2014, incorporating a new ALDI supermarket and over 60 specialty stores, expanding the centre by approximately 9,000 square metres.
Divisional highlights / continuedApartments— Bondi, Sydney NSW: achieved strong sales with 100.0 per cent
of 190 total lots pre-sold;
— Green Square, Sydney NSW: achieved strong sales with 100.0 per cent of Stage 1, Ebsworth and Stage 2, Ebsworth No.8 pre-sold (174 and 64 exchanged contracts respectively), and 98.9 per cent of Ovo pre-sold (221 exchanged contracts);
— Harold Park, Sydney NSW: achieved strong sales with 65.7 per cent of the first release of the final stage, Vance, pre-sold (71 exchanged contracts);
— Yarra’s Edge, Docklands VIC: commenced construction on Forge apartments and Wharf’s Entrance terraces following pre-sales of 63.2 per cent (144 exchanged contracts) and 83.3 per cent (15 exchanged contracts) respectively;
— Waterfront, Unison QLD: achieved 83.3 per cent of pre-sales for Stage 1 (120 exchanged contracts) with construction progressing to schedule, and achieved 71.2 per cent of pre-sales for Stage 2 (104 exchanged contracts), with early construction works currently underway; and
— Art House, South Brisbane QLD: secured 78.2 per cent pre-sales for Stage 1 (147 exchanged contracts), with construction commencing in July 2015.
In addition to the strong sales momentum, Mirvac completed the englobo sale of provisioned projects Precinct 8 at Gainsborough Green, QLD and a portion of Glenfield Panorama.
For the year ended 30 June 2015, Development’s residential pipeline totalled 33,064 lots which was supplemented by the acquisition of a number of key projects that will contribute significantly to Development’s future earnings, including:
— Greenbank QLD: acquisition of a masterplanned community site in Brisbane’s south-west growth corridor with the potential to deliver approximately 3,300 lots;
— Marsden Park North NSW: entered into a project delivery agreement to develop a masterplanned community site within Sydney’s north-west growth centre, with the potential to deliver over 1,200 lots;
— Gledswood Hills NSW: acquisition of a masterplanned community site with the potential to deliver approximately 570 lots;
— St Leonards, Sydney NSW: acquisition of a mixed-use development site in Sydney’s North Shore, with the potential for approximately 500 apartments and approximately 7,500 square metres of commercial space;
— Sydney Olympic Park, Homebush NSW: entered into a project delivery agreement to develop an apartment site in Sydney’s iconic Olympic Park precinct, with the potential to deliver over 400 lots;
— Claremont on the Park, Claremont WA: acquisition of an apartment site in the urban renewal area of Claremont Oval, with the potential to deliver approximately 230 lots;
— Georges Cove Marina, Moorebank NSW: entered into a project delivery agreement to develop a masterplanned community site located within Sydney’s south-west growth precinct with the potential to deliver approximately 180 homes;
— Jack Road, Cheltenham VIC: acquisition of a masterplanned community site in the bayside suburb of Cheltenham, with the potential to deliver approximately 180 lots; and
— Darien Street, Bridgeman Downs QLD: acquisition of a masterplanned community site with the potential to deliver approximately 120 land lots.
For the year ended 30 June 2015, Development settled 2,271 residential lots and had secured future income of $1,987.2m 1 through residential exchange pre-sales contracts.
1) Adjusted for Mirvac’s share of joint venture associates and Mirvac managed funds.

MIRVAC GROUP ANNUAL REPORT 201506
Directors’ report
Divisional risksAt a divisional level, the key risks faced which have the potential to affect the achievement of the financial prospects for the Group include:
— Office: as detailed in the outlook section for Investment, demand for office space remains challenging across the markets in which the Group operates. This has the potential to impact on the Group’s performance given that office assets represent 54.6 per cent 2 of the Investment portfolio. The office portfolio, comprising solid occupancy of 94.0 per cent 3, a WALE of 4.3 years 4 and like-for-like rent growth of 2.6 per cent, demonstrates Mirvac’s ability to maintain a strong and robust portfolio through the cycles of demand. The Group seeks to manage uncertainty around commercial office demand in a number of ways including substantial pre-letting of commercial developments in advance of construction, and by partially selling down commercial developments in advance of completion;
— Retail: as detailed in the outlook section for Investment, retail sales growth was divergent throughout Australia in FY15. Despite encouraging signs in some markets, the impact of recent below-trend retail sales growth has placed pressure on retailers. With 28.5 per cent of MPT’s portfolio represented by retail assets, Mirvac is focused on continually refreshing its retail assets (via refurbishment, redevelopment or tenant remixing) to adapt to changing market dynamics. Furthermore, Mirvac maintains a focus on key metropolitan markets, and a diversified tenancy mix, where no single specialty retailer contributes greater than 1.6 per cent of the total portfolio’s gross rent;
— Industrial: as detailed in the outlook section for Investment, continuing investor demand for prime-grade industrial assets in key locations is resulting in compressed capitalisation rates, weighting predominately towards the stronger markets of Sydney and Melbourne. Mirvac continues to focus on properties with long lease terms and secure cash flow profiles that will benefit from the increase in investor demand and continue to provide steady returns; and
— Residential: as detailed in the outlook section for Development, Australia’s residential market varies from state to state (and within states) with growth in some markets expected to eclipse a more moderate performance in others. Despite the breadth of market, the Development division remains focused on the right product in the right location, diversifying risk across residential sub-markets, across Australia and between Masterplanned Communities and Apartments. Weighting to key growth markets such as New South Wales further mitigates this risk, as do pre-sales.
Divisional highlights / continuedOutlook 1
The outlook for capital city residential markets remains mixed by location, however, a sustained low interest rate environment remains supportive for all markets. Construction of new dwellings is generally running at a strong pace in the major capital cities, although concentration is divergent by location. All major states have recorded solid levels of population growth, although this has slowed from a very strong pace in Queensland and Western Australia. New South Wales, and Sydney in particular, is benefiting from stronger levels of population and economic growth over the past three years. Demand for modern, higher density living supported by amenity and infrastructure is expected to continue, particularly in the south-eastern states.
Development remains focused on:
— continuing to improve key metrics including return on invested capital (targeting 12.0 per cent by FY17) and maintaining solid gross margins;
— strategically restocking the development pipeline with focus and discipline;
— maintaining a high level of pre-sales to mitigate future earning risks; and
— delivering the $3.2 billion commercial development pipeline.
RisksAs a property group involved in real estate investment, residential and commercial development and investment management, Mirvac faces a number of risks throughout the business cycle which have the potential to affect the Group’s achievement of its targeted financial outcomes. The Group’s objective is to ensure those risks are identified and appropriate strategies are implemented to control or otherwise manage the impact of those risks. Mirvac’s risk management framework is integrated with its day-to-day business processes and is supported by a dedicated Group Risk function. Further information on the Group’s risk management framework is detailed in the Corporate Governance statement which is available on Mirvac’s website: www.mirvac.com/about/corporate-governance.
Group risksFor the year ended 30 June 2015, the Group continued to review both internal and external risks which have the potential to affect the Group’s targeted financial outcomes and to implement strategies to minimise their impact. Further information on the material risks identified for each of the sectors is outlined below. At a Group level, Mirvac faces certain risks to achieving of its financial outcomes; these risks are the types of risks typical for an Australian property group. These may include debt refinancing and compliance with debt covenants, compliance with health, safety and environment regulations as well as broader economic conditions.
1) These future looking statements should be read in conjunction with future releases to the ASX.2) By invested capital within the Investment division. This includes 472 Pacific Highway and 486 Pacific Highway, St Leonards NSW. Excluding these office assets,
the office portfolio represents 53.9 per cent of the Investment portfolio.3) By area, includes 8 Chifley Square, Sydney NSW.4) By income, includes 8 Chifley Square, Sydney NSW.

MIRVAC GROUP ANNUAL REPORT 2015 07
Environmental regulationsMirvac and its business operations are subject to compliance with both Federal and state environment protection legislation, and the Board is satisfied that adequate systems are in place for Mirvac’s compliance with the applicable legislation.
Within Mirvac’s health, safety and environment performance reporting systems, including internal and external audits and inspections, Mirvac has not experienced any incidents that have resulted in any significant harm to the environment. There have been no infringement notices issued for minor environmental incidents during the reporting period.
A key initiative to reduce greenhouse gas emissions was a commitment to achieve an average 4.7 Star NABERS Energy rating on applicable office buildings by July 2014. The Investment division achieved this target in December 2013, with the office portfolio now achieving 5.1 Stars. This has resulted in reduced operating costs, improved environmental performance, demonstrating excellent energy operational and management practices, and high efficiency systems and equipment.
The new Mirvac sustainability strategy, ‘This Changes Everything’, sets short term targets for the whole portfolio to reduce carbon emissions by 20 per cent and increase energy generation to 1MW by 2018. This plan also includes a long term mission to be Net Positive for energy and water by 2030, whilst achieving zero waste to landfill in the same period.
Mirvac is required under the National Greenhouse and Energy Reporting Act 2007 to report annually on greenhouse gas emissions, reductions, removals and offsets, and energy consumption and production figures.
The Federal Government has introduced into Parliament legislation that terminates the Energy Efficiency Opportunities Program and so removes the mandatory requirement for large energy using businesses to assess opportunities to improve energy efficiency and to report publicly on the outcomes of those assessments. The Federal Government has recently repealed the carbon tax, we will thereby approximately reduce our energy bill by 10.0 per cent. The carbon tax will be replaced by direct action, details of which are still being finalised.
Mirvac is also subject to the commercial Building Energy Efficiency Disclosure Act 2010. This involves the disclosure of energy efficiency-related information at the point of sale or lease of office space greater than 2,000 square metres.

MIRVAC GROUP ANNUAL REPORT 201508
Directors’ report
Information on DirectorsDirectors’ experience and areas of special responsibilitiesThe members of the Mirvac Board and their qualifications, experience and responsibilities are set out below:
John MulcahyPhD (Civil Engineering), FIEAust, MAICD Independent Non-Executive Chair
Chair of the Nomination CommitteeMember of the Audit, Risk and Compliance CommitteeMember of the Human Resources Committee
John Mulcahy was appointed a Non-Executive Director of Mirvac on 19 November 2009 and the Independent Non-Executive Chair on 14 November 2013. John has more than 28 years of leadership experience in financial services and property investment. John is the former Managing Director and Chief Executive Officer of Suncorp-Metway Limited. Prior to joining Suncorp-Metway, John held a number of senior executive roles at Commonwealth Bank, including Group Executive, Investment and Insurance Services. He also held a number of senior roles during his 14 years at Lend Lease Corporation, including Chief Executive Officer, Lend Lease Property Investment and Chief Executive Officer, Civil and Civic.
John is currently a Non-Executive Director of ALS Limited (formerly Campbell Brothers Limited) (appointed February 2012), Coffey International Limited (appointed September 2009 and as Chair in November 2010) and GWA Group Limited (appointed November 2010). John is also a Director of The Shore Foundation Limited and the Great Barrier Reef Foundation and a former Guardian of the Future Fund Board of Guardians (2006 until April 2015).
Susan Lloyd-HurwitzBA (Hons), MBA (Dist)Chief Executive Officer & Managing Director (“CEO/MD”)Executive
Susan Lloyd-Hurwitz was appointed CEO/MD on 15 August 2012 and a Director of Mirvac Board on 5 November 2012. Prior to this appointment, Susan was Managing Director at LaSalle Investment Management, where she was responsible for the core investment accounts and funds business lines in the European region, as well as the operation of the business. Susan has also held senior executive positions at MGPA, Macquarie Group and Lend Lease Corporation, working in Australia, the US and Europe.
Susan has been involved in the real estate funds management industry for over 25 years, with extensive experience in fund and portfolio management in both the direct and indirect markets, fund development, mergers and acquisitions, dispositions, research and business strategy.
Susan is also President of INSEAD Australasian Council, a Director of the Green Building Council of Australia and a member of the UWS Foundation Council which supports the University of Western Sydney in its development and contribution to Greater Western Sydney.
Christine BartlettBSc, MAICDIndependent Non-Executive
Member of the Audit, Risk and Compliance Committee
Christine was appointed a Non-Executive Director of Mirvac on 1 December 2014. She is currently a Non-Executive Director of GBST Holdings Ltd (appointed June 2015) and a Director of The Smith Family. Christine is a member of the Minter Ellison Advisory Council, the UNSW Australian School of Business Advisory Council and the Australian Institute of Company Directors. Previously she has been a director of PropertyLook, National Nominees Ltd and Deputy Chairman of the Australian Custodial Services Association.
Christine is an experienced CEO and senior executive with extensive line management experience gained through roles with IBM, Jones Lang LaSalle and National Australia Bank Limited. Her executive career has included Australian, regional and global responsibilities based in Australia, the USA and Japan. Christine brings a commercial perspective especially in the areas of financial discipline, identifying risk, complex project management, execution of strategy, fostering innovation and taking advantage of new emerging technologies.
Christine holds a Bachelor of Science from the University of Sydney and has completed senior executive management programs at INSEAD.
Peter HawkinsBCA (Hons), FAICD, SFFin, FAIM, ACA (NZ) Independent Non-Executive
Chair of the Human Resources CommitteeMember of the Audit, Risk and Compliance CommitteeMember of the Nomination Committee
Peter Hawkins was appointed a Non-Executive Director of Mirvac on 19 January 2006, following his retirement from ANZ after a career of 34 years. Prior to his retirement, Peter was Group Managing Director, Group Strategic Development, responsible for the expansion and shaping of ANZ’s businesses, mergers, acquisitions and divestments and for overseeing its strategic cost agenda.
Peter was a member of ANZ’s Group Leadership Team and sat on the boards of Esanda Limited, ING Australia Limited and ING (NZ) Limited, the funds management and life insurance joint ventures between ANZ and ING Group. He was previously Group Managing Director, Personal Financial Services, as well as holding a number of other senior positions during his career with ANZ. Peter was also a Director of BHP (NZ) Steel Limited from 1990 to 1991 and Visa Inc. from 2008 to 2011.
Peter is currently a Non-Executive Director of Westpac Banking Corporation (appointed December 2008), MG Responsible Entity Limited, the responsible entity for MG Unit Trust (appointed April 2015 and listed in July 2015), Murray Goulburn Co-operative Co. Limited, Clayton Utz and Liberty Financial Pty Ltd, and a former Non-Executive Director of Treasury Corporation of Victoria.
John Mulcahy Susan Lloyd-Hurwitz Christine Bartlett Peter Hawkins

MIRVAC GROUP ANNUAL REPORT 2015 09
Information on Directors / continuedJames M. Millar AMBCom, FCA, FAICD Independent Non-Executive
Chair of the Audit, Risk and Compliance CommitteeMember of the Nomination Committee
James M. Millar was appointed a Non-Executive Director of Mirvac on 19 November 2009. He is the former Chief Executive Officer of Ernst & Young (“EY”) in the Oceania Region, and was a director on their global board.
James commenced his career in the Insolvency & Reconstruction practice at EY, conducting some of the largest corporate workouts of the early 1990s. He has qualifications in both business and accounting.
James is a Non-Executive Director of Fairfax Media Limited (appointed July 2012), Helloworld Limited (appointed September 2010) and Macquarie Radio Network Limited (appointed April 2015). He is Chair of both the Export Finance and Insurance Corporation (appointed December 2014) and Forestry Corporation NSW (appointed March 2013).
James serves a number of charities where he is the Chair of The Smith Family, and is a Trustee of the Australian Cancer Research Foundation and the Vincent Fairfax Family Foundation. He is a former Chair of Fantastic Holdings Limited (from May 2012 until June 2014).
Samantha MostynBA, LLB Independent Non-Executive
Member of the Human Resources Committee
Samantha Mostyn was appointed a Non-Executive Director of Mirvac on 1 March 2015. Samantha is a Non-Executive Director and corporate advisor and is currently a Non-Executive Director of Virgin Australia Holdings Limited (appointed September 2010), Transurban Holdings Limited (appointed December 2010) and Cover-More Group Limited (appointed December 2013). She is also a Director on an Australian APRA regulated Citibank Subsidiary Board. Samantha also serves on the Climate Council, Climate Works Australia, the Advisory Board of the Crawford School of Government and Economics at the Australian National University and is the President of the Australian Council for International Development. She is Deputy Chair of the Diversity Council of Australia, and has served as an AFL Commissioner since 2005. Her other current board appointments include the Australia Council for the Arts, Australian Volunteers International, the GO Foundation and Carriageworks.
Previously, Samantha has served as a Director of the Sydney Theatre Company, a Commissioner with the National Mental Health Commission, and has held senior executive positions at IAG, Optus and Cable & Wireless Plc.
John PetersBArch, AdvDipBCM, GAICD Independent Non-Executive
Member of the Human Resources Committee
John Peters was appointed a Non-Executive Director of Mirvac on 17 November 2011.
John brings to the Board over 40 years’ experience in architectural design, project management, property development and property management.
For the last 20 years, John has been the principal of a private property development company focused on substantial mixed use developments and redevelopments in South East Queensland. During this period, he has also consulted to various investors and other financial stakeholders in several Queensland development projects.
Prior to this, John was with Lend Lease Corporation for 14 years, where he was Queensland Manager Lend Lease Development, and Director, Lend Lease Commercial.
Elana RubinBA (Hons), MA, FFin, FAICD, FAIM Independent Non-Executive
Member of the Audit, Risk and Compliance CommitteeMember of the Nomination Committee
Elana Rubin was appointed a Non-Executive Director of Mirvac on 11 November 2010 and has extensive experience in property and financial services. Elana is a Director of several NAB life insurance and asset management subsidiaries and a Director of Touchcorp Limited (appointed January 2015), Transurban Queensland (previously Queensland Motorways Holding Pty Limited) and the Victorian Funds Management Corporation. She is also a member of the Qualitas Properties Advisory Board, Committee for Melbourne and the Victorian Council of the Australian Institute of Company Directors.
Elana is the former Chair of AustralianSuper (July 2007 to April 2013), one of Australia’s leading superannuation funds, having been on the board since 2006. She was a Director of Victorian WorkCover Authority (December 2001 to February 2012) and Chair from 2006. She was also a Director of Mirvac Funds Management Limited, the responsible entity and trustee for Mirvac’s listed and unlisted funds, from November 2013 to February 2015.
Elana was previously a Non-Executive Director of TAL Life Limited (formerly Tower Australia Limited) (from November 2007 to April 2013) and has been a Director on a number of listed companies and other entities including Bravura Solutions Ltd. Elana is a former member of the Federal Government’s Infrastructure Australia Council (from May 2011 to September 2014).
James M. Millar AM Samantha Mostyn Elana RubinJohn Peters

MIRVAC GROUP ANNUAL REPORT 201510
Directors’ report
Natalie Allen (resigned 26 June 2015)BEc, LLB, GAICD
Natalie Allen was appointed Company Secretary on 21 January 2013. Natalie joined Mirvac as Group General Counsel in August 2012, and has more than 16 years of legal experience in real estate and equity capital markets. Prior to joining Mirvac, Natalie was the Group General Counsel and Company Secretary at Charter Hall Group, and before this was General Counsel and Company Secretary for a number of listed and unlisted entities within Macquarie’s Real Estate Funds division. Natalie is a solicitor of the Supreme Court of NSW, a member of the State Bar of California and a graduate of the Australian Institute of Company Directors. Natalie resigned as Company Secretary on 26 June 2015.
Information on Directors / continuedCompany SecretariesSean WardBEc, BComm, FGIA, FFin
Sean Ward was appointed Company Secretary on 23 August 2013. Sean joined Mirvac as Group Company Secretary in April 2013 and has more than 15 years’ corporate experience. Prior to joining Mirvac, Sean was the Head of Subsidiaries at Westpac Banking Corporation, providing company secretarial support for all of Westpac’s listed and unlisted entities and before this was a Senior Companies Advisor at ASX Limited. Sean is also currently studying for a Master of Business Administration with the Australian Graduate School of Management.
Meetings of DirectorsThe number of meetings of the Board of Directors and of each standing Board committee, of which the relevant Director was a member, held during the year ended 30 June 2015 and the number of meetings attended by each Director are detailed below:
Audit, Risk and Human Compliance Resources Board Committee Committee Nomination Board Committee 1 (“ARCC”) (“HRC”) CommitteeDirector A B A B A B A B A B
John Mulcahy 15 15 2 2 6 6 5 5 2 2Susan Lloyd-Hurwitz 15 15 3 3 — — — — — —Christine Bartlett 2 9 9 — — 4 4 — — — —Peter Hawkins 15 15 — — 6 6 5 5 2 2Samantha Mostyn 3 5 5 — — — — 2 2 — —James M. Millar AM 14 15 — — 6 6 3 3 2 2John Peters 15 15 1 1 2 2 2 2 — —Elana Rubin 4 13 13 — — 6 6 — — 2 2
1) Committees of the Board established to deal with particular purposes during the year.2) Christine Bartlett was appointed as a Director on 1 December 2014.3) Samantha Mostyn was appointed as a Director on 1 March 2015.4) Elana Rubin did not attend two Board meetings due to a potential conflict of interest.
A) Indicates the number of meetings attended during the period the Director was a member of the Board or Committee.B) Indicates the number of meetings held during the period the Director was a member of the Board or Committee
(excluding meetings not attended due to a potential conflict of interest).

MIRVAC GROUP ANNUAL REPORT 2015 11
Remuneration report Contents Page
1 Introduction — key questions 112 Who is covered by this report 123 Summary of FY15 remuneration 134 Our people 135 Our remuneration strategy and the link to business strategy 146 Actual remuneration earned in FY15 157 Executive KMP remuneration at Mirvac 168 Business and executive remuneration outcomes 169 Mirvac’s approach to executive remuneration 1910 How remuneration is structured 2011 LTI grants in FY15 2312 Total remuneration in FY15 2413 Service agreements for the Executive KMP 2414 Non-Executive Directors’ remuneration 2415 Legacy remuneration arrangements 2616 Additional required disclosures 26
Please see page 29 for definitions of terms used in this remuneration report.
1 Introduction — key questions
Key questions Mirvac approach Further info
Remuneration in 2015
1) How is Mirvac’s performance reflected in this year’s remuneration outcomes?
Mirvac’s remuneration outcomes are strongly linked to the delivery of sustainable securityholder value over the short and long term. Increased corporate earnings and high performance across non-financial measures have resulted in above target performance on our balanced scorecard and a corresponding higher than usual payout of short-term incentives (“STI”).
However, vesting of our long-term incentive (“LTI”) awards will be substantially lower than in FY14, largely as a result of impairment losses in our residential property business during FY13 which reduced our return on equity. The LTI outcome reflects our commitment to ensuring executives’ remuneration reflects the achievement of sustainable value for securityholders.
Section 5Page 14
2) What changes have been made to the remuneration structure in FY15?
The only changes to our remuneration approach this year were to increase the Non-Executive Director (“NED”) fee pool (as approved by securityholders at the 2014 AGM) and to simplify the fee structure for Non-Executive Directors. Individual NED fee levels remain in line with FY14. No changes have been made to the executive remuneration structure.
Section 14Page 24
3) Are any changes planned for FY16?
The only change planned for FY16 is an increase to the threshold and stretch performance levels for LTI awards. The threshold level for ROIC is proposed to rise from 7.5 per cent to 8 per cent, and the stretch from 9 per cent to 10 per cent. The increase reflects Mirvac’s expectations for returns through the cycle, and over the longer term. The TSR measure for LTI awards remains unchanged.
Section 10Page 20
Remuneration framework
4) Where does Mirvac’s remuneration sit against the market?
Fixed and variable pay are both aimed at the market median, with remuneration opportunities for outstanding performance extending up to the 75th percentile of the market.
Section 9Page 19
5) What proportion of remuneration is “at risk”?
The majority of Executive KMP’s remuneration is based on performance, and is therefore at risk.
Section 7Page 16
6) Are there any clawback provisions for incentives?
Yes. If there is a material financial misstatement, any unvested LTI or deferred STI awards can be clawed back.
Section 10Page 20
7) What is Mirvac’s minimum securityholding requirement?
The CEO/MD must maintain a minimum securityholding of 100 per cent of fixed remuneration. Other Executives must hold 50 per cent of their fixed remuneration. Non-Executive Directors must hold 25,000 securities.
Section 9Page 19,
Section 14Page 24
Short-term incentives (“STI”)
8) Are any STI payments deferred?
Yes, 25 per cent of STIs are awarded as rights over Mirvac securities, half of which vest in one year and half in two years. If the Executive leaves Mirvac before the vesting period ends, the rights do not vest and are cancelled.
Section 7Page 16
9) Are STI payments capped?
Yes, an Executive can earn a maximum of double their STI target. Section 10Page 20

MIRVAC GROUP ANNUAL REPORT 201512
Directors’ report
Remuneration report / continuedKey questions Mirvac approach Further info
Long-term incentives (“LTI”)
10) What are the performance measures that determine if the LTI grants vest?
Half of the LTI awards are based on relative TSR. The other half was based on ROE for the FY13 LTI award, and ROIC for awards made in subsequent years.
Section 10Page 20
11) Does the LTI have re-testing?
No, there is no re-testing. Section 10Page 20
12) Are dividends/distributions paid on unvested LTI awards?
No dividends/distributions are paid on unvested LTI awards. This ensures that Executives are only rewarded when performance hurdles have been achieved at the end of the performance period.
Section 10Page 20
13) Is the size of LTI grants increased in light of performance conditions?
No. LTI grant amounts are not increased to reflect the performance conditions necessary for vesting.
Section 10Page 20
14) Can LTI participants hedge their unvested LTI?
No. Section 10Page 20
15) Does Mirvac buy securities or issue new securities for share-based awards?
For deferred STI awards, securities are purchased on-market. For LTI awards, the Board decides whether to issue new securities or buy them on-market.
Section 10Page 20
16) Does Mirvac issue share options?
No.
Executive agreements
17) What’s the maximum an executive can receive on termination?
Executive KMP termination entitlements are limited to 12 months’ fixed remuneration. Section 13Page 24
2 Who is covered by this report?This report covers the key management personnel (“KMP”) of Mirvac, who are the people responsible for determining and executing Mirvac’s strategy. This includes both the Executive KMP (including the CEO/MD, the Chief Financial Officer (“CFO”) and heads of business units who sit on the Executive Leadership Team) as well as Non Executive Directors.
There were seven Executive KMP in FY15, compared to the five that were disclosed in FY14, as a result of changes to the Executive Leadership Team structure during FY15. There have also been two changes to Non-Executive Directors. For the year ended 30 June 2015, the KMP were:
KMP Position Term as KMP
Non-Executive DirectorsJohn Mulcahy Chair Full YearChristine Bartlett Director (appointed 1 December 2014) Part YearPeter Hawkins Director Full YearJames M. Millar AM Director Full YearSamantha Mostyn Director (appointed 1 March 2015) Part YearJohn Peters Director Full YearElana Rubin Director Full Year
Executive KMPSusan Lloyd-Hurwitz CEO/MD Full YearAndrew Butler Group Executive, Office & Industrial Full YearJohn Carfi Group Executive, Residential Development Full YearBrett Draffen Chief Investment Officer Full YearShane Gannon CFO Full YearSusan MacDonald Group Executive, Retail Full YearDavid Rolls Group Executive, Commercial Development Full Year
The information provided in this Remuneration report has been audited as required by section 308(3C) of the Corporations Act 2001.

MIRVAC GROUP ANNUAL REPORT 2015 13
Remuneration report / continued3 Summary of FY15 remunerationStrong revenue and profit growth over the past year are reflected in above-target STI payouts. However, write-downs have reduced our return on equity over the last three years, resulting in reduced LTI vesting.
Fixed remuneration Fixed remuneration increasesThe responsibilities of Brett Draffen and Susan MacDonald were increased in the restructure on 1 July 2014. As a result, their fixed remuneration was also increased.
CEO/MD remuneration Remuneration changes for CEO/MDThe CEO/MD’s fixed remuneration was not increased during FY15 as it remained competitive with the market. Total remuneration for the CEO/MD in the table in section 6 increased from $2.8m to $3.9m in FY15, due a larger STI outcome, and the partial vesting of the FY13 LTI award.
STI Increased STI payoutsStrong results across all operating metrics resulted in increased STI payouts.
The FY15 STI pool was 137% of target in FY15 (up from 110% in FY14), driven by— operating earnings increasing to $454.8m from $437.8m— ROIC performance improving to 9.0% from 7.8%— achieving target for all 12 non-financial measures.
As a result, average STI payouts for Executive KMP increased from 116% of target in FY14 to 140% in FY15.
LTI Vesting at 36.5%, reflecting below-target ROE and above-target TSRVesting of LTI grants is dependent on achieving target on ROE and TSR over a three year period. This year’s vesting was impacted by below-target ROE performance, largely due to impairments recognised in the performance period. This resulted in none of the awards relating to the ROE hurdle vesting.
TSR performance was above threshold but below maximum, resulting in 73% of the awards subject to the TSR hurdle vesting.
As a result, 36.5% of overall LTI awards vested.
Non-Executive Director fees
Non-Executive Director fee pool increased after approval at the 2014 AGMAn increase in the maximum aggregate Non-Executive Director annual remuneration from $1.95m to $2.25m was approved at the 2014 AGM.
Non-Executive Director fee structure simplifiedThe individual committee member fees have been replaced with a single fee of $18,000 per annum for serving on one or more Board committees. The previous fees paid to the Chairs of the ARCC and the HRC have been replaced with a fee of $30,000 per annum, which is in addition to the committee fee. Individual NED fee levels remain in line with FY14.
4 Our peopleAt Mirvac, we believe that creating the right workplace culture will help us to attract, retain and motivate talented individuals.
At Mirvac, our remuneration strategy is one element of our overall people strategy, designed to create a distinctive culture that helps us attract, grow, engage and retain high-quality employees.
In FY15, our people strategy focused on diversity, inclusion and innovation, as we strove to create an environment that encourages the unique talents and experiences of our people.
Initiatives included the creation of a flexible work program that will underpin our transition to our new headquarters in 2016; the introduction of an innovative new induction process to introduce new starters to our culture and organisation; and our sponsorship of the Equilibrium Man Challenge, a micro-documentary that follows a group of men moving to flexible working arrangements. Mirvac’s innovation program, Hatch, also trained 45 Innovation Champions to act as advocates of innovation throughout the company — driving behaviours, and embedding cultural change at the front line.
Mirvac’s efforts to create an inclusive and innovative culture are reflected in the achievement of a ‘Best Employer’ status based on our employee engagement survey with AonHewitt, and recognition by the Workplace Gender Equality Agency as an ‘Employer of Choice for Gender Equality’. We are also particularly proud of the fact that the Mirvac Board achieved 50/50 gender representation in FY15.
Our remuneration strategy — for our executives, and for our people — supports our people strategy by rewarding high performance that supports our distinctive culture.

MIRVAC GROUP ANNUAL REPORT 201514
Directors’ report
Remuneration report / continued5 Our remuneration strategy and the link to business strategyAt Mirvac, our remuneration is linked to the drivers of our business strategy, helping to create sustainable value for shareholders.
Mirvac’s remuneration strategy is designed to support and reinforce its business strategy. The at-risk components of remuneration are tied to measures that reflect the successful execution of our business strategy in both the short and long term.
LTI vesting outcome in FY15 = 36.5% of target
CEO/MD STI outcome in FY15 = 164% of target
Average STI in FY15 for other eligible Senior Executives = 136% of target
Relative Total Shareholder Return (“TSR”)Measures the performance of Mirvac securities over time, relative to other entities in a comparison group.Return on Equity (“ROE”)Measures Mirvac’s profitability relative to securityholders’ investment in the Group.
Customer / investorsatisfaction measures:Measures include retail customer and office tenant satisfaction surveys, as well as residential customer satisfaction surveys.
People measures:Measures include talent turnover, diversity targets, and succession planning targets.
HSE&S leadership measures:Measures include Lost Time Injury Frequency Rate, timely incident reporting, and sustainability targets.
Operating earningsReflects how much revenue the business has generated for the year, less operating costs.Return on Invested Capital (“ROIC”)Measures Mirvac’s profitability relative to its total assets. It is calculated by dividing the company’s annual earnings by its total assets.
From FY13 – FY15— Mirvac’s TSR was
ranked at the 62nd percentile relative to its comparison group.
— Mirvac’s average annual ROE is 6.7%
In FY15— Operating earnings
were $454.8m, up 4% from $437.8m in FY14
— ROIC was 9.0% up from 7.8% in FY14.
In FY15— Mirvac achieved
12 out of the 12 non-financial targets.
Customer and investor satisfactionProvide customers and investors an experience that delivers excellence, consistently exceeds expectations and engenders loyalty.
Capital efficiency and financial performanceDeliver top 3 AREIT returns.
High performing people and cultureHave an engaged and motivated workforce with superior skills and capabilities.
HSE&S leadershipBe recognised as a leader in sustainability. Provide workplaces free from harm and supported by a culture where safety remains an absolute priority.
Our strategic drivers...
See section 8, page 16 for additional details
See section 8, page 16 for additional details
See section 8, page 16 for additional details
Are reflected in STI performance measures...
And LTI performance measures...
So Mirvac’s actual performance...
Directly affects what executives are paid

MIRVAC GROUP ANNUAL REPORT 2015 15
Remuneration report / continued6 Actual remuneration earned in FY15This year’s remuneration reflected our ongoing commitment to paying for performance. Strong FY15 business performance resulted in increased STI payouts, but LTI vesting was substantially lower than FY14.
The following table sets out the actual value of the remuneration earned by Executive KMP members during the year. The figures in this table are different from those shown in the accounting table in section 12 because that table includes an apportioned accounting value for all unvested LTI grants during the year (some of which remain subject to satisfaction of performance and service conditions and may not ultimately vest). The table below, on the other hand, shows the LTI value based on the awards that actually vested as a result of performance in FY15.
The table below presents:
— Fixed remuneration;
— Cash STI: the non-deferred portion of STI payments to be made in September 2015 in recognition of performance during FY15;
— Deferred STI realised: the value of the deferred STI from prior years that was realised in FY15; and
— LTI: the value to the participant during FY15 of performance rights whose performance period ended 30 June 2015.
Actual remuneration paid in FY15 Deferred Fixed Cash STI Employee Termination remuneration STI realised LTI loans 1 benefits Other 2 Total Executive KMP Year $ $ $ $ $ $ $ $
Susan Lloyd-Hurwitz 2015 1,500,000 1,381,641 212,926 767,963 — — 24,046 3,886,576 2014 1,500,000 1,160,156 — — — — 134,938 2,795,094
Andrew Butler 2015 700,000 550,200 76,313 337 — — 10,977 1,337,827 2014 700,000 415,800 — 14,163 600,159 — 319,418 2,049,540
John Carfi 3 2015 700,000 481,425 — 21,051 — — 11,353 1,213,829
Brett Draffen 2015 950,000 933,375 118,829 331,872 — — 15,368 2,349,444 2014 900,000 647,460 — 817,353 581,835 — 464,702 3,411,350
Shane Gannon 2015 900,000 707,400 67,149 — — — 234,685 4 1,909,234 2014 527,962 365,878 — — — — 355,614 1,249,454
Susan MacDonald 3 2015 700,000 481,425 — 379,836 — — 11,353 1,572,614
David Rolls 3 2015 700,000 481,425 — — — — 11,353 1,192,778
1) Amount reported includes amounts forgiven during the year, imputed interest and related fringe benefits tax (“FBT”).2) Includes long service leave accrued during the year.3) Appointed to a KMP position effective 1 July 2014.4) Includes a payment of $220,000 as part compensation for the STI and LTI entitlements he forfeited on resigning from his previous employer.

MIRVAC GROUP ANNUAL REPORT 201516
Directors’ report
Remuneration report / continued7 Executive KMP remuneration at MirvacMirvac’s executive remuneration approach is strongly performance focused.A significant proportion of executive remuneration is based on sustained performance, aligned with the business strategy.
Our executive remuneration is:
1) Performance based: more than 60 per cent of total remuneration is “at-risk”;
2) Equity focused: almost half the CEO/MD’s total remuneration is paid in equity and a third of other Executive KMP members total remuneration is paid in equity;
3) Increases ownership: Executive KMP members are required to hold securities of a minimum value of 50 per cent of their fixed remuneration, and the CEO/MD is required to hold 100 per cent; and
4) Multi-year focused: 50 per cent of STI deferral is subject to a one-year holding lock and the remaining 50 per cent to a two-year holding lock. LTI performance is measured over a three year period.
The graphs below set out the remuneration structure and mix for the CEO/MD and other Executive KMP members at Mirvac.
Fixed remuneration31%
Fixed remuneration40%
Target STI23%
Target STI30%
Max LTI46%
Max LTI30%
CEO/MD
Other Executive KMP
PERFORMANCE DEPENDENT
PERFORMANCE DEPENDENT
Deferred 6%
Deferred 7.5%
Cash17%
Cash22.5%
50% deferred for 12 months50% deferred for 24 months
Subject to clawback
50% deferred for 12 months50% deferred for 24 months
Subject to clawback
Granted as performance rights with performance measured over a
three year period. Subject to clawback
Granted as performance rights with performance measured over a
three year period. Subject to clawback
TSR (50% of award)23%
TSR (50% of award)15%
ROIC (50% of award)23%
ROIC (50% of award)15%
8 Business and executive remuneration outcomesSTI and LTI outcomes reflect and reward the strong results across all measures of performance in FY15.
a) How the Group’s performance has translated into STI awards
FY15 performance was strong, with both operating earnings and ROIC significantly higher than FY14. The Group’s STI scorecard of 137 per cent (of a potential 150 per cent) reflects this achievement.
Mirvac’s financial performance directly affects the STI awards in two ways:
— the STI has a gateway requirement of Group operating earnings being at least 90 per cent of target; and
— the Group’s STI scorecard has two financial measures, each worth 35 per cent of the total pool: operating earnings and ROIC.
The following graph shows how the average STI outcome for all employees has been closely tied to performance on these two measures since FY11. The increase in STI outcome for FY15 reflected Mirvac achieving stretch targets for the non-financial measures, in addition to the strong performance on the financial measures.
Financial performance vs average STI outcome
40
60
80
100
160% of target
120
140
FY15FY11 FY12 FY13 FY14
Operating earnings ROIC Average STI

MIRVAC GROUP ANNUAL REPORT 2015 17
Remuneration report / continuedFinancial performance in each case is expressed as a percentage of the business target set for the year, while the STI outcome represents the average STI award to participants that year as a percentage of target.
b) STI awards in FY15The diagram below sets out Mirvac’s performance and the resulting STI outcomes:
Once the Group and Individual STI scores are determined, an individual’s STI award is calculated as follows:
Gateway achieved (over 90% of target operating earnings achieved)
HRC approved a Group STI score of 137% of target (from a maximum potential pool of 150% of target)FY15 STI pool = $29.2 million (6.4% of Mirvac’s operating earnings)
Each participant is awarded an individual STI score between zero and 135% of their STI target.Scores are based on an assessment of their personal performance for the year against
objectives linked to Mirvac’s strategic drivers
Fixedremuneration
IndividualSTI target
GroupSTI score(0-150%)
IndividualSTI score(0-135%)
Individual STI award
(capped at 200%of target)
Operating earnings (weighting = 35%)
Target 100%Threshold 75%
% of plan awarded = 112%
ROIC (weighting = 35%) % of plan awarded = 150%
Non-financial measures (weighting = 30%) % of plan awarded = 150%
Stretch 150%
Executive KMP STI awards in FY15The following table shows the actual STI outcomes for each of the Executive KMP for FY15.
STI target STI max Actual STI % of fixed % of fixed Actual STI STI forfeited (total) remuneration remuneration % max % max $
Susan Lloyd-Hurwitz 75 150 82 18 1,842,188Andrew Butler 80 160 66 34 733,600John Carfi 70 140 66 34 641,900Brett Draffen 80 160 82 18 1,244,500Shane Gannon 80 160 66 34 943,200Susan MacDonald 70 140 66 34 641,900David Rolls 70 140 66 34 641,900
c) How the Group’s performance has translated into LTI awardsThe three years to 30 June 2015 saw varied performance levels. The Group’s TSR was above the median of the comparator group, reflecting our focus on above-market, sustainable growth. This solid result is reflected in the vesting of 73 per cent of the FY13 award relating to TSR.
The Group did not meet the threshold performance hurdle on ROE, largely due to impairments announced during the three-year performance period. As a result, the 50 per cent of the FY13 award that related to ROE will not vest.
Mirvac’s financial performance directly affects the vesting of the LTI awards:
— half of the LTI is subject to a relative TSR performance measure; and
— the remaining half is subject to ROE (for grants made up to and including FY13) and ROIC (for grants made from FY14 onwards).

MIRVAC GROUP ANNUAL REPORT 201518
Directors’ report
Remuneration report / continuedThe diagram below sets out the Group’s performance and the resulting LTI outcomes for the Executive KMP.
None of the performance rights linked to the ROE measure vested
FY13 LTI grants made to eligible participants and TSR and ROE performance hurdles are set
30 June 2015: three year performance period ends for the FY13 grants and performance is measured for TSR and ROE
73% of the performance rights linked to the TSR measure vested
36.5% Vesting of the total FY13 LTI award
Mirvac’s share price & distributions over the last five years
0
100
50
$350m
200
150
300
250
0
0.5
$2.0
1.0
1.5
FY15FY11 FY12 FY13 FY14
Distributions paid ($m) Security price at 30 June ($)
Mirvac TSR (1 July 2012 – 30 June 2015)
0%
20%
40%
60%
120%
100%
80%
30 Jun 12 30 Jun 13 30 Jun 14 30 Jun 15
MGR 25th Percentile 50th Percentile 75th Percentile
Mirvac’s ROE performance over the three years
0
12
RO
E
6Threshold = 7
Stretch = 11
FY13 FY14 FY15 3 yearaverage
2.9
7.4
9.9
6.7
Mirvac achieved a TSR of 85 per cent over the three year performance period, which positioned it at the 62nd percentile relative to the entities in the comparison group
ROE performance
Mirvac’s ROE has fluctuated over the last three years:
— FY13 did not meet the threshold;
— FY14 exceeded the threshold; and
— FY15 exceeded the threshold.
Mirvac’s average annual ROE over the three year performance period was 6.7 per cent, resulting in below threshold performance.

MIRVAC GROUP ANNUAL REPORT 2015 19
Remuneration report / continuedExecutive KMP vesting outcomes in FY15The performance outcomes resulted in the following individual vesting results:
Rights granted in FY13 Rights vested in FY15 Rights forfeited in FY15 % of % of Executive KMP Number Value ($) 1 total grant Number Value ($) 1 total grant Number Value ($) 1
Susan Lloyd-Hurwitz 1,137,300 816,013 36.5 415,144 297,845 63.5 722,186 518,168John Carfi 30,367 21,788 36.5 11,083 7,953 63.5 19,284 13,835Brett Draffen 489,800 351,432 36.5 178,777 128,273 63.5 311,023 223,159Susan MacDonald 127,131 91,216 36.5 46,402 33,294 63.5 80,729 57,922
1) Value of the grant has been estimated based on the fair value as calculated at the time of the grant.
Executive KMP vesting outcomes for the past three yearsA summary of vesting under Mirvac’s performance-hurdled equity grants that have vested in the last three years is shown in the following table:
Grant year Performance hurdle Test date Vested Lapsed
FY11 TSR 30 June 2013 0% 100%FY12 TSR and ROE 30 June 2014 77% 23%FY13 TSR and ROE 30 June 2015 36.5% 63.5%
9 Mirvac’s approach to executive remunerationThe Board, Human Resources Committee, advisors and management work closely to apply our remuneration principles and ensure our strategy supports sustainable securityholder value.
Mirvac’s remuneration strategy is designed to attract, motivate and retain the individuals who are best equipped to successfully execute the business strategy.
a) How remuneration decisions are madeRoles and responsibilities
Human Resources Committee› Four independent NED members› Advises Board on remuneration strategy› Specific recommendations on
Director remuneration› Approves KMP terms of employment
Remuneration principles› Align and contribute to Mirvac’s key strategic business objectives and desired
business outcomes› Align the interests of employees with those of securityholders› Assist Mirvac in attracting and retaining the employees required to execute the business strategy› Support Mirvac’s desired performance-based culture› Encompass the concept of pay parity and be fair and equitable› Be simple and easily understood
With advice from
Based on
BoardOversees remuneration

MIRVAC GROUP ANNUAL REPORT 201520
Directors’ report
Targeted market positioningFixed remuneration at Mirvac is positioned at the median (50th percentile), with flexibility based on:
— the criticality of the role to successful execution of the business strategy;
— assessment of employee performance/potential; and
— the employee’s experience level.
Target total remuneration is comprised of fixed remuneration, STI and LTI and is positioned at the median (50th percentile) with the opportunity to earn total remuneration up to the upper quartile (75th percentile) in the event that both the individual and the business achieve stretch targets.
Minimum securityholding guidelinesExecutive KMP members are expected to establish and maintain a securityholding to the value of 100 per cent of fixed remuneration for the CEO/MD and 50 per cent of fixed remuneration for all other Executive KMP members.
Executive KMP members have five years to build up their securityholding to the suggested level. As at 30 June 2015, progress towards the minimum securityholding guidelines for each continuing Executive KMP member was as follows:
Value of security- Minimum holding as security- Date at 30 June holding Executive securityholding 2015 guideline KMP member to be attained $ $
Susan Lloyd-Hurwitz November 2017 100,744 1,500,000Andrew Butler July 2017 86,288 350,000John Carfi July 2019 345,678 350,000Brett Draffen July 2017 1,620,961 475,000Shane Gannon December 2018 — 450,000Susan MacDonald July 2019 211,638 350,000David Rolls July 2019 — 350,000
10 How remuneration is structuredOur executive remuneration is focused on execution of business strategy. We provide market-competitive remuneration and reward for performance that delivers strategic outcomes.
a) Fixed remuneration: how does it work?Fixed remuneration acts as a base-level reward for a competent level of performance. It includes cash, compulsory superannuation and any salary-sacrificed items (including FBT). The following factors are taken into account when setting fixed remuneration levels at Mirvac:
— the size and complexity of the role;
— role accountabilities;
— skills and experience of the individual; and
— market pay levels for comparable roles.
The opportunity value for the at-risk components of remuneration is determined by reference to fixed remuneration, so Mirvac is conscious that any adjustments to fixed remuneration have a flow-on impact on potential STI and LTI awards.
Remuneration report / continuedExpert input from management and external advisorsThe HRC has appointed Ernst & Young as its external remuneration advisor. Ernst & Young provides both information on current market practice and independent input into key remuneration decisions.
Ernst & Young’s terms of engagement include specific measures designed to protect its independence. To effectively perform its role, Ernst & Young needs to interact with members of Mirvac management, particularly those in the Human Resources team. However, to ensure independence, members of Mirvac’s management are precluded from requesting services that would be considered to be a ‘remuneration recommendation’ as defined by the Corporations Amendment (Improving Accountability on Director and Executive Remuneration) Act 2011.
During the year ended 30 June 2015, Ernst & Young provided the HRC with:
— guidance in the review and design of executive remuneration strategy;
— assistance in drafting of remuneration disclosures;
— relative TSR performance calculations; and
— market remuneration information which was used as an input to the annual review of the KMP and other selected Executives’ remuneration.
No remuneration recommendations were provided by Ernst & Young or any other advisor during the year.
b) Market positioningMirvac has adopted a market positioning strategy designed to attract and retain talented employees, and to reward them for delivering strong performance. The market positioning strategy also supports fair and equitable outcomes between employees.
Definition of marketWhen determining the relevant market for each role, Mirvac considers the companies from which it sources talent, and to whom it could potentially lose talent.
For business roles:— the primary comparison group is the Australian Real Estate
Investment Trust (“A-REIT”) sector, plus Lend Lease and Aveo Group; and
— the secondary comparison group is a general industry comparison group with a similar market capitalisation (50-200 per cent of Mirvac’s 12 month average market capitalisation).
For corporate roles:— the primary comparison group is a general industry
comparison group with a similar market capitalisation (50-200 per cent of Mirvac’s 12 month average market capitalisation) to reflect the greater transferability of skills.
Where disclosed data is unavailable, Mirvac relies on published remuneration surveys covering relevant industries and the broader market.

MIRVAC GROUP ANNUAL REPORT 2015 21
Remuneration report / continuedb) STI: how does it work?
Purpose Motivate and reward employees for contributing to the delivery of annual business performance.
Eligibility All permanent Mirvac employees employed on the award date are eligible to participate in the STI plan.
Pool Group operating earnings must be at least 90 per cent of target before any STI payments are made.
The size of the STI pool is then determined based on Group performance against a balanced scorecard of measures linked to Mirvac’s strategic drivers.
Awards A target opportunity is set for each individual, which will be earned if Group and individual performance is on target. Actual STI awards can range from zero to double the target opportunity, depending on Group and individual performance, but is capped at a maximum of 200 per cent of target.
Performance measures Performance is assessed against both Group and individual performance. Individual performance measures are set based on the specific responsibilities of each role. There are three Group performance measures: two financial measures (with a combined weighting of 70 per cent) and a scorecard of non-financial measures (with a combined weighting of 30 per cent), they are as follows:
Category Measure Rationale for using
Financial Operating earnings Reflects the underlying performance of Mirvac’s core business operations and represents a key driver of securityholder value.
ROIC Reflects how efficiently Mirvac is using its assets to generate earnings.
Non-financial Customer and investor satisfaction
Represents how well Mirvac is meeting the expectations of key external stakeholders.
High performing people and culture
There is a strong correlation between high levels of employee engagement and total securityholder return.
HSE&S leadership Mirvac is committed to providing a safe workplace for all of its employees and to ensuring its activities do not have an adverse impact on the environment.
The targets for the non-financial individual measures are not disclosed as some are commercially sensitive. The measures are quantitative in nature and recurring targets will typically increase each year.
Performance schedule For each performance measure on the Group STI scorecard, a threshold, plan and stretch goal is set at the start of the financial year.
The Group STI score for each performance level is calculated according to the following schedule:
Performance level Group STI score % target
<Threshold 0
Threshold 75
Plan 100
Stretch 150
> Stretch 150
A sliding scale operates between threshold and plan, and between plan and stretch.
Deferral For Executives:
— 25 per cent of any STI award is deferred into rights over Mirvac securities (granted on the same date as the cash payment is made) and
— 75 per cent is paid as cash.
The rights vest in two tranches: 50 per cent after 1 year and 50 per cent after two years.
If the deferred rights vest, entitlements will be satisfied by the purchase of existing securities on-market.
Executives are expected to retain the resulting securities they receive until they satisfy the minimum securityholding guidelines.
Termination/forfeiture The deferred portion of an STI award is forfeited if an employee resigns or is dismissed for performance reasons prior to the vesting date.
Unvested deferred STI awards may be retained if an employee leaves due to circumstances such as retirement, redundancy, agreed transfer to an investment partner, or total and permanent disablement or death.
Clawback policy Mirvac has in place an incentive clawback policy for Executive KMP members and other Executives capable of influencing the results of the Group. The policy gives the HRC the ability to claw back incentives in the event of a material financial misstatement. The clawback provisions apply to unvested STI and LTI awards received after the introduction of the policy in February 2013.
Hedging Consistent with the Corporations Act 2001, participants are prohibited from hedging their unvested performance rights.

MIRVAC GROUP ANNUAL REPORT 201522
Directors’ report
Remuneration report / continuedc) LTI: how does it work?
Purpose The purpose of LTI at Mirvac is to:
— assist in attracting and retaining the required executive talent;
— focus executive attention on driving sustainable long term growth; and
— align the interests of executives with those of securityholders.
Eligibility LTI grants are generally restricted to those Executives who are most able to influence securityholder value. Non-Executive Directors are not eligible to participate in the LTI plan.
Instrument Awards under this plan are made in the form of performance rights. A performance right is a right to acquire one fully paid Mirvac security provided a specified performance hurdle is met.
No dividends/distributions are paid on unvested LTI awards. This ensures that Executives are only rewarded when performance hurdles have been achieved at the end of the performance period.
Grant value The maximum LTI opportunities during FY15 were equivalent to 150 per cent of fixed remuneration for the CEO/MD and 50 — 90 per cent of fixed remuneration for other Executive KMP.
Grant price The grant price for a performance right is calculated as the average security price for the month leading up to grant, discounted for dividends and distributions not paid during the three year performance period. The grant price is not reduced based on performance conditions.
Performance period Performance is measured over a three year period. For the FY15 grant, performance will be measured from 1 July 2014 to 30 June 2017.
Performance hurdles The HRC reviews the performance conditions annually to determine the appropriate hurdles based on Mirvac’s strategy and prevailing market practice. Two performance measures apply to the LTI grants made during FY15:
Relative TSR (50 per cent of the LTI allocation)Relative TSR is used because it is an objective measure of securityholder value creation and is widely understood and accepted by the various key stakeholders.
Mirvac’s TSR performance is measured relative to that of a comparison group consisting of Mirvac’s primary market competitors: the constituents of the S&P/ASX 200 A-REIT Index, Lend Lease Corporation Limited and Aveo Group.
ROIC (50 per cent of the LTI allocation)ROIC is used because it is aligned to Mirvac’s strategic drivers, in particular financial performance and capital efficiency.
ROIC is calculated by taking the average of the three annual ROIC figures (which are calculated as adjusted earnings of a financial year divided by average monthly operating assets for the financial year).
These adjustments are made to ensure that rewards reflect management’s contribution to Mirvac’s long term performance.
In FY16, it is proposed that the threshold and stretch performance levels for ROIC be increased, to reflect Mirvac’s expectations for returns through the cycle, and over the longer term.
Vesting schedule Relative TSR ROIC
Performance levelRelative TSR (percentile)
Percentage of TSR-tested rights to vest
Average annual ROIC (%)
Percentage of ROIC-tested rights to vest
<Threshold <50th Nil < 7.5 Nil
Threshold 50th 50 7.5 (FY16: 8) 50
Threshold — maximum
50th to 75th Pro-rata between 50 and 100
7.5 to 9 (FY16: 8 to 10)
Pro-rata between 50 and 100
Maximum 75th and above 100 9 (FY16: 10) and above
100
Vesting/ delivery The performance rights can only be exercised if and when the performance conditions are achieved. If the performance rights vest, entitlements will be satisfied by, at the Board’s discretion, either an allotment of new securities to participants or by the purchase of existing securities on-market. Performance rights that vest are automatically converted to Mirvac securities. Any performance rights that do not vest at the end of the performance period will lapse. There are no further tests of the performance conditions.
Executive KMP members will be expected to retain the resulting securities until they satisfy the minimum securityholding guidelines.

MIRVAC GROUP ANNUAL REPORT 2015 23
Remuneration report / continuedTermination/forfeiture Resignation or dismissal: all unvested performance rights are forfeited.
Retirement, redundancy, agreed transfer to an investment partner, total and permanent disablement or death: the HRC determines the number of rights which will lapse or are retained, subject to both the original performance period and hurdles.
Change of control event: the HRC determines the number of performance rights that vest, if any, taking into account the performance from the date of grant to the event.
Dilution Dilution that may result from securities being issued under Mirvac’s LTI plan is capped at the limit set out in ASIC Class Order 03/184, which provides that the number of unissued securities under those plans must not exceed five per cent of the total number of securities of that class as at the time of the relevant offer.
Hedging Consistent with the Corporations Act 2001, participants are prohibited from hedging their unvested performance rights.
11 LTI grants in FY15The table below presents the LTI grants made during FY15 and due to vest in 1 July 2017, subject to the performance conditions. Accounting standards require the estimated valuation of the grants recognised over the performance period. The minimum value of the grant is nil if the performance conditions are not met. The maximum value is based on the estimated fair value calculated at the time of the grant and amortised in accordance with the accounting standard requirements.
Fair value per Number of performance Maximum total LTI max as a % of Performance performance right value of grant 2015 fixed remuneration measure rights granted $ $
Susan Lloyd-Hurwitz TSR 730,500 0.60 438,300 ROIC 730,500 0.79 577,095
Total 150 1,461,000 1,015,395
Andrew Butler TSR 204,545 0.60 122,727 ROIC 204,545 0.79 161,591
Total 90 409,090 284,318
John Carfi TSR 204,545 0.60 122,727 ROIC 204,545 0.79 161,591
90 409,090 284,318
Brett Draffen TSR 277,597 0.60 166,558 ROIC 277,597 0.79 219,302
Total 90 555,194 385,860
Shane Gannon TSR 262,987 0.60 157,792 ROIC 262,987 0.79 207,760
Total 90 525,974 365,552
Susan MacDonald TSR 113,636 0.60 68,182 ROIC 113,636 0.79 89,772
50 227,272 157,954
David Rolls TSR 113,636 0.60 68,182 ROIC 113,636 0.79 89,772
Total 50 227,272 157,954
Key inputs used in valuing performance rights granted during FY15 were as follows:
Performance rights Performance rights
Grant date 17 December 2014 Exercise price $nilPerformance hurdles Relative TSR and ROIC Expected life 2.5 yearsPerformance period start 1 July 2014 Volatility 20%Performance testing date 1 July 2017 Risk-free interest rate (per annum) 2.20%Security price at grant date $1.795 Dividend/distribution yield (per annum) 5.0%

MIRVAC GROUP ANNUAL REPORT 201524
Directors’ report
Remuneration report / continued12 Total remuneration in FY15The following table shows the total remuneration for members of the Executive KMP for FY15 and FY14 (including FY14 remuneration details for individuals who are no longer Executive KMP but were included in the FY14 Remuneration Report) calculated in accordance with AAS and, accordingly, it differs from the information presented in the table in section 6. Other Post- long term Total Short term benefits employment Share based payments benefits remuneration
Long Performance Other service related Cash salary Cash Non-cash Employee short term Super Value of Deferred leave remuneration and fees 1 STI 2 benefits 3 loans 4 benefits 5 contributions rights 6 STI (“LSL”) 7 % of total Year $ $ $ $ $ $ $ $ $ $ remuneration
Executive DirectorSusan Lloyd-Hurwitz 2015 1,442,910 1,381,641 38,307 — 10,467 18,783 606,853 244,262 24,046 3,767,269 59 2014 1,443,918 1,160,156 61,682 — 87,500 17,775 640,855 257,813 24,063 3,693,762 56Other Executive KMPAndrew Butler 2015 640,210 550,200 41,006 — — 18,783 99,648 95,185 10,977 1,456,009 51 2014 619,967 415,800 62,258 600,159 309,000 17,775 7,063 92,400 10,418 2,134,840 24John Carfi 8 2015 681,217 481,425 — — — 18,783 107,622 66,865 11,353 1,367,265 48Brett Draffen 2015 922,195 933,375 9,022 — — 18,783 171,934 158,860 15,368 2,229,537 57 2014 872,446 647,460 9,779 581,835 450,000 17,775 329,951 143,880 14,702 3,067,828 37Shane Gannon 2015 881,217 707,400 — — 220,000 18,783 177,879 114,765 14,685 2,134,729 47 2014 514,631 365,878 — — 347,038 13,331 56,028 81,306 8,576 1,386,788 36Susan MacDonald 8 2015 681,217 481,425 — — — 18,783 162,456 66,865 11,353 1,422,099 50David Rolls 8 2015 681,217 481,425 — — — 18,783 121,016 66,865 11,353 1,380,659 48
Total 2015 5,930,183 5,016,891 88,335 — 230,467 131,481 1,447,408 813,667 99,135 13,757,567 53 2014 3,450,962 2,589,294 133,719 1,181,994 1,193,538 66,656 1,033,897 575,399 57,759 10,283,218 41
Former Executive KMPJonathan Hannam 2014 522,225 356,400 — — 806 17,775 127,129 79,200 8,703 1,112,238 51
1) Cash salary and fees includes accrued annual leave paid out as part of salary.2) STI payments relate to cash portion of STI awards accrued for the relevant year.3) Non-cash benefits include salary-sacrificed benefits and related FBT where applicable.4) Employee loans are interest free and provided for personal use. Disclosed value includes amounts forgiven during the year, imputed interest and related FBT.5) Includes relocation expenses for the CEO/MD and payments to the CFO as part compensation for the STI and LTI entitlements he forfeited on resigning from
his previous employer.6) Valuation of rights is conducted by an external accounting firm. Negative amounts (if any) relate to forfeiture of some or all participation in equity plans due
to terminations.7) LSL relates to amounts accrued during the year.8) Appointed to a KMP position effective 1 July 2014.
13 Service agreements for the Executive KMPThere were no changes to the service agreements for Executive KMP in FY15.
Each Executive KMP member, including the CEO/MD, has a formal contract, known as a service agreement. These agreements are of a continuing nature and have no set term of service (subject to the termination provisions).
The key terms of the service agreements for the CEO/MD and other Executive KMP members are summarised below:
Notice period Termination Contract term Employee Group payment 1
Susan Lloyd-Hurwitz No fixed term 6 months 6 months 6 monthsOther Executive KMP No fixed term 3 months 3 months 9 months
1) Payable if Mirvac terminates employee with notice, for reasons other than unsatisfactory performance.
14 Non-Executive Directors’ remunerationNon-Executive Directors’ fee arrangements were simplified in FY15, with no change in fee quantum from FY14.
In contrast to Executives’ remuneration, the remuneration of Mirvac’s Non-Executive Directors is not linked to performance. This is consistent with Non-Executive Directors being responsible for objective and independent oversight of the Group.
a) Remuneration strategy and componentsMirvac Limited’s Constitution provides that Non-Executive Directors may determine their own remuneration but the total amount provided to all Directors (not including the CEO/MD and any other Executive Directors) must not exceed the sum agreed by securityholders at a general meeting. The maximum aggregate remuneration of $2.25m per annum was approved by securityholders at the 2014 AGM.
Non-Executive Directors have not received any fees other than those described in this section, and do not receive bonuses or any other incentive payments or retirement benefits.
The Non-Executive Directors are reimbursed for expenses properly incurred in performing their duties as a Director of Mirvac.
Fees for Non-Executive Directors have been simplified for FY15:
— the individual committee member fees have been replaced with a single fee of $18,000 per annum for serving on one or more Board committees.
— the previous fees paid to the Chairs of the ARCC and the HRC have been replaced with a fee of $30,000 per annum which is in addition to the committee fee.

MIRVAC GROUP ANNUAL REPORT 2015 25
Remuneration report / continuedThe schedule of fees for Non-Executive Directors during FY15 is set out in the table below and fees are annual fees, unless otherwise stated:
Board/committee $
Mirvac Limited and Mirvac Funds Limited Board Chair 480,000 1
Mirvac Limited and Mirvac Funds Limited Board member 185,000ARCC and HRC Chair 30,000 2
Committee member 18,000 3
Due Diligence Committee (per diem fee) 4,000
1) Chair fee covers all Board and committee responsibilities.2) The ARCC and HRC Chair fee is in addition to the Committee member fee.3) The single committee fee is paid once for all committee memberships.
b) Total remuneration for Non-Executive Directors Short term Post- benefits employment 1 Cash salary Super and fees contributions Total Year $ $ $
Non-Executive DirectorsJohn Mulcahy 2 2015 461,217 18,783 480,000 2014 393,213 17,775 410,988Christine Bartlett 2015 108,143 10,274 118,417Peter Hawkins 3 2015 214,217 18,783 233,000 2014 261,892 17,775 279,667James M. Millar AM 2015 213,792 18,783 232,575 2014 213,225 17,775 231,000Samantha Mostyn 2015 61,796 5,871 67,667John Peters 2015 170,868 32,132 203,000 2014 171,259 31,741 203,000Elana Rubin 4 2015 252,396 18,271 270,667 2014 233,397 17,628 251,025
Total 2015 1,482,429 122,897 1,605,326 2014 1,272,986 102,694 1,375,680
Former Non-Executive DirectorsMarina Darling 2014 59,497 5,503 65,000James MacKenzie 2014 217,215 10,392 227,607
1) Relates to payments required under superannuation legislation.2) John Mulcahy received an additional $29,524 in FY14 for his service on the Mirvac Capital Partners Limited and Mirvac Funds Management Limited boards.
These fees ceased on his appointment to Mirvac Board Chair on 14 November 2013.3) Peter Hawkins received an additional $46,667 for the period he acted as Mirvac Board Chair during July and August 2013.4) Elana Rubin received an additional $18,000 in FY15 and $48,025 in FY14 for her service on the Mirvac Capital Partners Limited and Mirvac Funds Management
Limited boards.
c) Non-Executive Director minimum securityholding guidelinesIn order to further strengthen the alignment of interests between Non-Executive Directors and securityholders, FY12 saw the introduction of minimum securityholding guidelines.
Under the guidelines, each Non-Executive Director will be required to hold a minimum securityholding of 25,000 Mirvac stapled securities. The securities can be acquired over a two year period.
Date securityholding Number of securities held Non-Executive Director to be attained as at 30 June 2015
John Mulcahy July 2014 25,000Christine Bartlett December 2016 25,000Peter Hawkins July 2014 596,117James M. Millar AM July 2014 40,714Samantha Mostyn March 2017 15,000John Peters July 2014 30,000Elana Rubin July 2014 34,343

MIRVAC GROUP ANNUAL REPORT 201526
Directors’ report
Remuneration report / continued15 Legacy remuneration arrangementsa) Previous LTI plans closed for new grantsMirvac’s LTI plans have changed over time to align with market practice, while continuing to support Mirvac’s business strategy. The following historic LTI plans are no longer used for new LTI grants.
Employee Incentive SchemeThis plan provided loans to purchase Mirvac stapled securities. It is now closed to new participants. The plan will be run down until all loans under it are extinguished. Additional details are available in Mirvac Limited’s 2014 Annual Report.
Loan based Long-Term Incentive PlanThis plan also provided loans to purchase Mirvac stapled securities. It is now closed to new participants. Additional details are available in Mirvac Limited’s 2014 Annual Report. The eight year loan term expired on 14 December 2014. At this point the remaining securities were sold, with the proceeds applied against the outstanding loan balance, and any surplus paid to the participant. A summary of the transaction details for the three senior executive participants is presented in the table below:
Outstanding Net sale Proceeds Number of loan balance proceeds after loan Executive KMP securities $ $ $
Andrew Butler 8,559 14,901 15,238 337John Carfi 10,699 18,513 19,059 546Brett Draffen 21,398 37,029 38,163 1,134
At 30 June 2015, no securities remain on issue under the loan based Long-Term Incentive Plan.
16 Additional required disclosuresa) Equity instruments held by DirectorsParticulars of Directors’ interests in the stapled securities of Mirvac or a related body corporate, are as follows:
Interests in securities of related Director Mirvac stapled securities entities or related body corporate
John Mulcahy (indirect) 25,000 —Susan Lloyd-Hurwitz (direct) 54,456 —— performance rights 4,298,989 —Christine Bartlett (direct) 1 25,000 —Peter Hawkins (direct and indirect) 596,117 —James M. Millar AM (indirect) 40,714 —Samantha Mostyn (direct) 2 15,000 —John Peters (indirect) 30,000 —Elana Rubin (direct) 34,343 —
1) Christine Bartlett was appointed as a Director on 1 December 2014.2) Samantha Mostyn was appointed as a Director on 1 March 2015.
b) Other directorshipsDetails of all directorships of other listed companies held by each Director in the three years immediately before 30 June 2015 are as follows:
Director Company Date appointed Date ceased
John Mulcahy ALS Limited (formerly Campbell Brothers Limited) February 2012 Current Coffey International Limited September 2009 Current GWA Group Limited November 2010 Current
Susan Lloyd-Hurwitz Nil
Christine Bartlett GBST Holdings Ltd June 2015 Current
Peter Hawkins MG Responsible Entity Limited 1 April 2015 Current Westpac Banking Corporation December 2008 Current
James M. Millar AM Fairfax Media Limited July 2012 Current Fantastic Holdings Limited May 2012 June 2014 Helloworld Limited September 2010 Current
Samantha Mostyn Cover-More Group Limited December 2013 Current Transurban Holdings Limited December 2010 Current Virgin Australia Holdings Limited September 2010 Current
John Peters Nil
Elana Rubin Touchcorp Limited January 2015 Current
1) Peter Hawkins is a Director of MG Responsible Entity Limited, the responsible entity of MG Unit Trust which was listed on the ASX on 3 July 2015.

MIRVAC GROUP ANNUAL REPORT 2015 27
Remuneration report / continuedc) Other benefitsFees paid by Mirvac for Directors’ and Officers’ liability insurance are not itemised for each Director as their disclosure would breach the terms of the policy.
Executives and Directors (including Non-Executive Directors) are entitled to participate in arrangements available to directly purchase Mirvac developed residential property, on the same terms and conditions as for other employees within the Group.
d) Past financial performanceThe table below provides summary information on the Group’s earnings and securityholders’ wealth for the five years to 30 June 2015:
FY15 FY14 FY13 FY12 FY11
Profit attributable to the stapled securityholders of Mirvac ($m) 609.9 447.3 139.9 416.1 182.3Operating profit ($m) 454.8 437.8 377.6 366.3 358.5Distributions paid ($m) 336.2 326.2 225.9 280.2 270.2Security price at 30 June ($) 1.85 1.79 1.61 1.28 1.25Operating earnings per stapled security (“EPS”) — diluted (cents) 12.3 11.9 10.9 10.7 10.5Statutory EPS — basic (cents) 16.5 12.2 4.1 12.2 5.4
e) Equity instrument disclosures relating to KMPi) Security holdingsThe number of ordinary securities in Mirvac held during the year by each Director and other KMP, including their personally-related parties, is set out below.
Balance Balance 1 July Changes 1 30 June
2015Non-Executive DirectorsJohn Mulcahy 25,000 — 25,000Christine Bartlett — 25,000 25,000Peter Hawkins 596,117 — 596,117James M. Millar AM 40,714 — 40,714Samantha Mostyn — 15,000 15,000John Peters 30,000 — 30,000Elana Rubin 25,917 8,426 34,343
Executive KMPSusan Lloyd-Hurwitz 54,456 — 54,456Andrew Butler 170,025 (602) 169,423John Carfi — 248,036 248,036Brett Draffen 516,929 437,789 954,718Shane Gannon — — —Susan MacDonald — 114,399 114,399David Rolls — — —
1) Changes include additions/disposals resulting from first or final disclosure of a KMP and vesting of performance rights.
ii) OptionsNo options granted as remuneration were held by KMP during FY15.
iii) Performance rights held during the yearThe number of performance rights in Mirvac held during the year by each Director and other KMP, including their personally-related parties, is set out below:
Balance Rights issued Other Balance Executive KMP 1 July under LTI changes 1 30 June
Susan Lloyd-Hurwitz 2,607,800 1,461,000 230,189 4,298,989Andrew Butler 29,773 409,090 72,166 511,029John Carfi — — 501,379 501,379Brett Draffen 1,431,318 555,194 (467,883) 1,518,629Shane Gannon 223,367 525,974 72,594 821,935Susan MacDonald — — 719,199 719,199David Rolls — — 499,821 499,821
1) Other changes include additions/disposals resulting from first or final disclosure of a KMP and other changes to security-holdings, options and performance rights.

MIRVAC GROUP ANNUAL REPORT 201528
Directors’ report
Remuneration report / continuediv) Performance right movements during the yearDetails of the movement in the number and value of performance rights held by Executive KMP during the year are set out below:
Number Value at Number Value of Number Value of of rights grant date Vesting of rights rights vested of rights rights lapsed Executive KMP Grant date granted ($) date vested ($) 1 lapsed ($) 1
Susan Lloyd-Hurwitz 17 Dec 12 1,137,300 816,013 1 Jul 15 415,114 297,845 722,186 518,168 10 Dec 13 1,470,500 1,106,551 1 Jul 16 — — — — 17 Dec 14 1,461,000 1,015,395 1 Jul 17 — — — —
Total 4,068,800 2,937,959 415,114 297,845 722,186 518,168
Andrew Butler 10 Dec 13 19,439 14,628 1 Jul 16 — — — — 17 Dec 14 409,090 284,318 1 Jul 17 — — — —
Total 428,529 298,946 — — — —
John Carfi 17 Dec 12 30,367 21,788 1 Jul 15 11,083 7,953 19,284 13,835 10 Dec 13 61,922 46,596 1 Jul 16 — — — — 17 Dec 14 409,090 284,318 1 Jul 17 — — — —
Total 501,379 352,702 11,083 7,953 19,284 13,835
Brett Draffen 17 Dec 12 489,800 351,432 1 Jul 15 178,777 128,273 311,023 223,159 10 Dec 13 345,171 259,741 1 Jul 16 — — — — 17 Dec 14 555,194 385,860 1 Jul 17 — — — —
Total 1,390,165 997,033 178,777 128,273 311,023 223,159
Shane Gannon 10 Dec 13 223,367 168,084 1 Jul 16 — — — — 17 Dec 14 525,974 365,552 1 Jul 17 — — — —
Total 749,341 533,636 — — — —
Susan MacDonald 17 Dec 12 127,131 91,216 1 Jul 15 46,402 33,294 80,729 57,922 17 Dec 12 158,914 2 208,177 1 Jul 15 158,914 208,177 — — 10 Dec 13 205,882 154,926 1 Jul 16 — — — — 17 Dec 14 227,272 157,954 1 Jul 17 — — — —
Total 719,199 612,273 205,316 241,471 80,729 57,922
David Rolls 10 Dec 13 272,549 205,093 1 Jul 16 — — — — 17 Dec 14 227,272 157,954 1 Jul 17 — — — —
Total 499,821 363,047 — — — —
1) The calculation of the value of performance rights used the fair value as determined at the time of grant.2) Represents an unhurdled grant of performance rights made prior to her appointment to a KMP position.

MIRVAC GROUP ANNUAL REPORT 2015 29
Remuneration report / continuede) Loans to Directors and other KMPDetails of loans made to Directors and other KMP (including loans granted under the LTIP and EIS), including their personally-related parties, are set out below:
i) Individuals with loans above $100,000 during the year Highest Balance Balance indebtedness 1 July 30 June during the year $ $ $
2015Andrew Butler 317,342 296,389 317,342John Carfi — 173,401 173,401Brett Draffen 286,243 244,953 286,243
603,585 714,743 776,986
No write-downs or provision for impairment for receivables has been recognised in relation to any loans made to Directors or specified executives.
f) Other transactions with KMPThere are a number of transactions between KMP and the Group. The terms and conditions of these transactions are considered to be no more favourable than in similar transactions on an arm’s length basis. On occasions, Directors and other KMP may purchase goods and services from Mirvac. These purchases are on terms and conditions available to Mirvac employees generally. As set out in the Directors’ report, a number of the Directors of Mirvac are also Directors of other companies. On occasions, the Group may purchase goods and services from or supply goods and services to these entities. These transactions are undertaken on normal commercial terms and conditions and the Director or other KMP does not directly influence these transactions.
g) Terms used in this Remuneration reportTerm Meaning
Adjusted earnings Statutory profit/ (loss) after tax excluding: income tax expense and benefits; interest expense; bank and inter-company interest income; fair value of derivatives and exchange differences (FX); and changes in reserves (not including FX reserve).
Clawback Mirvac’s clawback policy gives the HRC the ability to clawback incentives in the event of a material financial misstatement. The clawback provisions apply to unvested STI and LTI awards received after the introduction of the policy in February 2013.
Executives Members of Mirvac’s Executive Leadership Team (including the Executive KMP and other executives).
Executive KMP The KMP that are also part of the Executive Leadership Team (including the CEO/MD, the CFO and other senior executives).
KMP KMP are those people with authority and responsibility for planning, directing and controlling the activities of the entity, directly or indirectly.
Operating assets Closing total assets excluding: cash and cash equivalents; tax assets; derivative financial assets; intercompany assets (that is, inter-company receivables and inter-company loans); shares in subsidiaries; and deferred land payable.
Performance right A right to a Mirvac security at the end of a performance period, subject to the satisfaction of performance measures.
ROIC Adjusted earnings of a financial year divided by average monthly operating assets for the financial year.
TSR Total Shareholder Return measures the percentage growth in a company’s security price together with the value of dividends/distributions received during the period, assuming that all of those dividends/distributions are re-invested into new securities.

MIRVAC GROUP ANNUAL REPORT 201530
Directors’ report
Significant changes in the state of affairsDetails of the state of affairs of the Group are disclosed within the Operating and financial review section.
Matters subsequent to the end of the yearNo other circumstances have arisen since the end of the year which have significantly affected or may significantly affect the operations of Mirvac, the results of those operations, or the state of affairs of Mirvac in future years.
Insurance of officersDuring the year, Mirvac paid a premium for an insurance policy insuring any past, present or future Director, secretary, executive officer or employee of the Group against certain liabilities. In accordance with commercial practice, the insurance policy prohibits disclosure of the nature of the liabilities insured against and the amount of the premium.
Auditor’s independence declarationA copy of the auditor’s independence declaration required under section 307C of the Corporations Act 2001 is set out on page 31.
AuditorPricewaterhouseCoopers continues in office in accordance with section 327 of the Corporations Act 2001.
Rounding of amountsMirvac is an entity of the kind referred to in Class Order 98/100 issued by ASIC, relating to the rounding off of amounts in the financial statements. Amounts in the financial statements have been rounded off to the nearest tenth of a million (“m”) dollars in accordance with that class order.
This statement is made in accordance with a resolution of the Directors.
Susan Lloyd-HurwitzDirector
Sydney13 August 2015
Corporate governance statementMirvac is committed to ensuring that its systems, procedures and practices reflect a high standard of corporate governance. The Directors believe that Mirvac’s corporate governance framework is critical in maintaining high standards of corporate governance and fostering a culture that values ethical behaviour, integrity and respect to protect securityholders’ and other stakeholders’ interests at all times.
During the year ended 30 June 2015, Mirvac’s corporate governance framework was consistent with the third edition of the Corporate Governance Principles and Recommendations released by the ASX Corporate Governance Council.
Mirvac will now publish its Corporate governance statement on its website rather than in its Annual Report. Mirvac’s 2015 Corporate governance statement may be viewed or downloaded at: www.mirvac.com/about/corporate-governance.
Copies of the Group policies referred to in the Corporate governance statement 1 are also posted to Mirvac’s website: www.mirvac.com/about/corporate-governance.
Non-audit servicesMirvac may decide to employ the auditor on assignments additional to their statutory audit duties where the auditor’s expertise and experience with the Group are relevant. Details of the amounts paid or payable to the auditor (PricewaterhouseCoopers) for audit and non-audit services provided during the year ended 30 June 2015 are set out in note 27 to the financial statements.
The Board has considered its position and, in accordance with the advice received from the ARCC, is satisfied that the provision of non-audit services is compatible with the general standard of independence for auditors imposed by the Corporations Act 2001. The Directors are satisfied that the provision of non-audit services by the auditor, as set out in note 27 to the financial statements, did not compromise the auditor independence requirements of the Corporations Act 2001 for the following reasons:
— all non-audit services have been reviewed by the ARCC to ensure they do not affect the impartiality and objectivity of the auditor; and
— none of the services undermines the general principles relating to auditor independence as set out in Accounting Professional & Ethical Standards 110 Code of Ethics for Professional Accountants, including reviewing or auditing the auditor’s own work, acting in a management or a decision-making capacity for the Group, acting as advocate for the Group or jointly sharing economic risk and rewards.
1) Other than the Fraud, Bribery and Corruption Policy and the Political Donations Policy. A summary of these policies is contained in the Code of Conduct which is available on our website at: www.mirvac.com/about/corporate-governance.

MIRVAC GROUP ANNUAL REPORT 2015 31
Auditor’s independence declaration
As lead auditor for the audit of Mirvac Limited for the year ended 30 June 2015, I declare that to the best of my knowledge and belief, there have been:
a) no contraventions of the auditor independence requirements of the Corporations Act 2001 in relation to the audit; and
b) no contraventions of any applicable code of professional conduct in relation to the audit.
Matthew Lunn SydneyPartner 13 August 2015PricewaterhouseCoopers
PricewaterhouseCoopers, ABN 52 780 433 757 Darling Park Tower 2, 201 Sussex Street, GPO BOX 2650, SYDNEY NSW 1171 DX 77 Sydney, Australia T +61 2 8266 0000, F +61 2 8266 9999, www.pwc.com.au
Liability limited by a scheme approved under Professional Standards Legislation

MIRVAC GROUP ANNUAL REPORT 201532
Financial statements
These financial statements cover the financial statements for the consolidated entity consisting of Mirvac Limited and its controlled entities. The financial statements are presented in Australian currency.
Mirvac Limited is a company limited by shares, incorporated and domiciled in Australia. Its registered office and principal place of business are:
Mirvac LimitedLevel 2660 Margaret StreetSydney NSW 2000.
A description of the nature of the consolidated entity’s operations and its principal activities is included in the Directors’ report on pages 01 to 30, both of which are not part of these financial statements.
The financial statements were authorised for issue by the Directors on 13 August 2015. The Directors have the power to amend and reissue the financial statements.
Through the use of the internet, Mirvac has ensured that its corporate reporting is timely and complete. All press releases, financial reports and other information are available in the Investor Relations section on the Group’s website: www.mirvac.com.
Contents Page
Consolidated statement of comprehensive income 33Consolidated statement of financial position 34Consolidated statement of changes in equity 35Consolidated statement of cash flows 36Notes to the consolidated financial statements 37
Note Index
Basis of preparation 37
Results for the year1 Segmental information 372 Revenue from continuing operations and other income 423 Expenses 424 Income tax 435 EPS 45
Operating assets and liabilities6 Investment properties 467 Assets classified as held for sale and discontinued operations 498 PPE 509 Inventories 5110 Financial assets and liabilities 5111 Other non-financial assets and liabilities 53
Capital structure12 Borrowings 5513 Other financial assets and liabilities 5714 Financial risk management 5815 Fair value measurement of financial instruments 62
Group structure16 Investments in JVA entities 6417 Controlled entities and deed of cross guarantee 7118 Parent entity financial information 77
Equity19 Contributed equity 7720 Reserves 7821 Retained earnings 8022 Dividends/distributions 80
Other information23 Contingent liabilities 8024 Commitments 8125 Employee benefits 8126 Related parties 8327 Remuneration of auditors 8528 Notes to the consolidated statement of cash flows 8529 Events occurring after the end of the year 8530 Summary of significant accounting policies 8631 Critical accounting judgements and estimates 94
Directors’ declaration 97Independent auditor’s report to the members of Mirvac Limited 98

MIRVAC GROUP ANNUAL REPORT 2015 33
Consolidated statement of comprehensive incomeFor the year ended 30 June 2015
2015 2014 Note $m $m
Revenue from continuing operations Investment properties rental revenue 6 618.4 650.9Investment management fee revenue 12.9 13.0Development and construction revenue 1,008.2 1,157.6Development management fee revenue 13.5 15.9Interest revenue 2 32.6 22.2Dividends/distributions revenue 0.4 0.5Other revenue 9.6 7.9
Total revenue from continuing operations 1,695.6 1,868.0
Other income Net gain on fair value of investment properties and IPUC 6 140.8 48.8Share of net profit of JVA accounted for using the equity method 16 68.0 46.9Gain on fair value of derivative financial instruments 2 187.6 3.0Net gain on sale of assets 2 59.9 —Foreign exchange gain — 7.5
Total other income 456.3 106.2
Total revenue from continuing operations and other income 2,151.9 1,974.2
Net loss on sale of assets 3 — 6.0Net loss on sale of property, plant and equipment (“PPE”) 0.3 0.2Foreign exchange loss 181.7 —Investment properties expenses 6 142.9 159.2Cost of property development and construction 784.7 940.7Employee benefits expenses 120.9 105.1Depreciation and amortisation expenses 3 30.4 29.6Impairment of goodwill 3 — 24.5Impairment of loans, investments and inventories 3 (0.2) (1.2)Finance costs 3 145.1 144.8Loss on fair value of derivative financial instruments 3 15.9 26.3Selling and marketing expenses 46.1 31.0Other expenses 56.2 47.3
Profit from continuing operations before income tax 627.9 460.7Income tax expense 4 (18.0) (13.4)
Profit for the year 609.9 447.3
Other comprehensive income for the year Items that may be reclassified to profit or loss Exchange differences on translation of foreign operations, net of tax 20(b) 7.7 3.5Items that will not be reclassified to profit or loss Increment/(decrement) on revaluation of OOP 20(b) 9.5 (4.8)Deferred tax on SBP transactions 20(b) — 0.4
Other comprehensive income for the year 17.2 (0.9)
Total comprehensive income for the year 627.1 446.4
Profit for the year attributable to the stapled securityholders of Mirvac 609.9 447.3
Total comprehensive income for the year attributable to the stapled securityholders of Mirvac 627.1 446.4
EPS for profit attributable to the stapled securityholders of Mirvac Cents Cents
Basic EPS 5 16.51 12.19Diluted EPS 5 16.50 12.17
The above consolidated statement of comprehensive income (“SoCI”) should be read in conjunction with the accompanying notes.

MIRVAC GROUP ANNUAL REPORT 201534
Consolidated statement of financial positionAs at 30 June 2015
2015 2014 Note $m $m
Current assetsCash and cash equivalents 28 59.8 97.8Receivables 10.1 73.0 98.7Derivative financial assets 13.1 — 15.7Inventories 9 774.2 598.1Other financial assets at fair value through profit or loss 13.2 11.3 11.8Other financial assets 13.3 — 52.0Other assets 11.1 21.6 22.7Assets classified as held for sale 7 — 821.0
Total current assets 939.9 1,717.8
Non-current assetsReceivables 10.1 56.8 60.5Inventories 9 939.2 859.1Investments accounted for using the equity method 16 562.2 537.6Derivative financial assets 13.1 175.9 11.3Other financial assets 13.3 264.6 79.4Investment properties 6 6,751.1 6,016.4PPE 8 261.9 248.7Intangible assets 11.2 39.0 39.0Deferred tax assets 4 412.9 351.9
Total non-current assets 9,463.6 8,203.9
Total assets 10,403.5 9,921.7
Current liabilitiesPayables 10.2 673.1 505.1Borrowings 12 0.2 202.9Derivative financial liabilities 13.1 12.4 13.0Provisions 11.3 201.5 178.2Other liabilities 11.4 0.2 0.2
Total current liabilities 887.4 899.4
Non-current liabilitiesPayables 10.2 113.5 85.0Borrowings 12 2,633.7 2,514.7Derivative financial liabilities 13.1 76.0 98.7Deferred tax liabilities 4 213.7 144.3Provisions 11.3 17.1 3.5
Total non-current liabilities 3,054.0 2,846.2
Total liabilities 3,941.4 3,745.6
Net assets 6,462.1 6,176.1
EquityContributed equity 19 6,804.3 6,796.8Reserves 20 94.5 76.9Retained earnings 21 (436.7) (697.6)
Equity, reserves and retained earnings attributable to the stapled securityholders of Mirvac 6,462.1 6,176.1
The above consolidated statement of financial position (“SoFP”) should be read in conjunction with the accompanying notes.

MIRVAC GROUP ANNUAL REPORT 2015 35
Consolidated statement of changes in equityFor the year ended 30 June 2015
Attributable to the stapled securityholders of Mirvac Contributed Retained equity Reserves earnings Total Note $m $m $m $m
Balance 30 June 2013 6,745.3 79.8 (814.3) 6,010.8
Profit for the year — — 447.3 447.3Other comprehensive income for the year — (0.9) — (0.9)
Total comprehensive income for the year — (0.9) 447.3 446.4
EEP securities issued 19 0.7 — — 0.7LTP, LTIP and EIS securities converted, sold, vested or forfeited 19 5.3 — — 5.3DRP securities issued 19 46.0 — — 46.0Contributed equity, raising costs 19 (0.5) — — (0.5)SBP transactions 20 — 4.4 — 4.4Security based compensation 21 — — (1.5) (1.5)Dividends/distributions provided for or paid 21 — — (331.1) (331.1)Transfers due to deconsolidation of entity 21 — (3.2) (1.2) (4.4)Transfers (out)/in 21 — (3.2) 3.2 —
Total transactions with owners in their capacity as owners 51.5 (2.0) (330.6) (281.1)
Balance 30 June 2014 6,796.8 76.9 (697.6) 6,176.1
Profit for the year — — 609.9 609.9Other comprehensive income for the year — 17.2 — 17.2
Total comprehensive income for the year — 17.2 609.9 627.1
EEP securities issued 19 0.8 — — 0.8LTP, LTIP and EIS securities converted, sold, vested or forfeited 19 6.7 — — 6.7SBP transactions 20 — 0.4 — 0.4Security based compensation 21 — — (1.4) (1.4)Dividends/distributions provided for or paid 21 — — (347.6) (347.6)
Total transactions with owners in their capacity as owners 7.5 0.4 (349.0) (341.1)
Balance 30 June 2015 6,804.3 94.5 (436.7) 6,462.1
The above consolidated statement of changes in equity should be read in conjunction with the accompanying notes.

MIRVAC GROUP ANNUAL REPORT 201536
Consolidated statement of cash flowsFor the year ended 30 June 2015
2015 2014 Note $m $m
Cash flows from operating activitiesReceipts from customers (inclusive of goods and services tax) 2,052.1 1,845.4Payments to suppliers and employees (inclusive of goods and services tax) (1,555.4) (1,325.5)
496.7 519.9Interest received 23.5 18.1Dividends/distributions received from JVA 41.6 17.6Dividends/distributions received 0.4 0.5Borrowing costs paid (149.5) (156.8)
Net cash inflows from operating activities 28(b) 412.7 399.3
Cash flows from investing activitiesPayments for PPE (12.8) (3.7)Proceeds from sale of PPE 0.2 0.1Payments for investment properties (977.0) (850.0)Proceeds from sale of investment properties and assets held for sale 1,072.3 226.5Payments for loans to unrelated entities — (14.7)Proceeds from loans to unrelated entities 81.6 8.0Contributions to JVA (40.0) (86.9)Proceeds from JVA 12.3 12.9Proceeds from sale of investments 11.5 —
Net cash inflows/(outflows) from investing activities 148.1 (707.8)
Cash flows from financing activitiesProceeds from borrowings 1,119.9 2,717.2Repayments of borrowings (1,382.5) (2,156.6)Contributed equity raising costs 19 — (0.5)Dividends/distributions paid (336.2) (280.2)
Net cash (outflows)/inflows from financing activities (598.8) 279.9
Net decrease in cash and cash equivalents (38.0) (28.6)Cash and cash equivalents at the beginning of the year 97.8 126.4
Cash and cash equivalents at the end of the year 28(a) 59.8 97.8
The above consolidated statement of cash flows should be read in conjunction with the accompanying notes.

MIRVAC GROUP ANNUAL REPORT 2015 37
BASIS OF PREPARATIONa) Mirvac — stapled securitiesA Mirvac stapled security comprises one Mirvac Limited share “stapled” to one MPT unit to create a single listed security traded on the ASX. The stapled securities cannot be traded or dealt with separately. With the establishment of the Group and its common investors, Mirvac Limited and Mirvac Funds Limited (as responsible entity for MPT) have common directors and operate as Mirvac Group with two core divisions: Investment and Development. The entities forming the stapled group entered into a Deed of Cooperation. This Deed of Cooperation allows that members of the stapled group, where permitted by law, will carry out activities with other members on a cost recovery basis, thereby maintaining the best interests of Mirvac as a whole.
The two Mirvac entities comprising the stapled group, remain separate legal entities in accordance with the Corporations Act 2001, and are each required to comply with the reporting and disclosure requirements of AAS and the Corporations Act 2001. In accordance with AAS, Mirvac Limited has been deemed the parent entity of MPT. The stapled security structure will cease to operate on the first to occur of:
— Mirvac Limited or MPT resolving by special resolution in general meeting and in accordance with its Constitution to terminate the stapling provisions; or
— the commencement of the winding up of Mirvac Limited or MPT.
The ASX reserves the right (but without limiting its absolute discretion) to remove one or more entities with stapled securities from the official list if any of their securities cease to be stapled together, or any equity securities of the same class are issued by one entity which are not stapled to equivalent securities in the other entity or entities.
b) Basis of preparationThese general purpose financial statements have been prepared in accordance with AAS, other authoritative pronouncements of the AASB, Urgent Issues Group Interpretations and the Corporations Act 2001. Mirvac Group is a for-profit entity for the purpose of preparing the financial statements.
i) Compliance with International Financial Reporting Standards (“IFRS”)
The consolidated financial statements of the Group also comply with IFRS as issued by the International Accounting Standards Board (“IASB”).
ii) Historical cost conventionThe financial statements have been prepared on a historical cost basis, except for the following:
— available-for-sale financial assets, financial assets and liabilities (including derivative instruments) at fair value through profit or loss, certain classes of PPE and investment properties; and
— assets held for sale — measured at fair value less costs of disposal.
iii) Critical accounting estimatesThe preparation of financial statements in conformity with AAS requires the use of certain critical accounting estimates. It also requires management to exercise its judgement in the process of applying Mirvac’s accounting policies. The areas involving a higher degree of judgement or complexity, or areas where assumptions and estimates are significant to the financial statements, are disclosed in note 31.
iv) Comparative informationWhere necessary, comparative information has been reclassified to achieve consistency in disclosure with current year amounts and other disclosures.
v) Rounding of amountsMirvac is an entity of the kind referred to in Class Order 98/100 issued by ASIC, relating to the “rounding off” of amounts in the financial statements. Amounts in the financial statements have been rounded off to the nearest tenth of a million dollars in accordance with that class order.
vi) Goods and services tax (“GST”)Revenues, expenses and assets are recognised net of the amount of associated GST, unless the GST incurred is not recoverable from the taxation authority. In this case, it is recognised as part of the cost of acquisition of the asset or as part of the expense. Receivables and payables are stated inclusive of the amount of GST receivable or payable. The net amount of GST recoverable from, or payable to, the taxation authority is included with other receivables or payables in the consolidated SoFP. Cash flows are presented on a gross basis. The GST components of cash flows arising from investing or financing activities which are recoverable from or payable to the taxation authority, are presented as operating cash flow.
vii) New and amended standards adopted by the GroupThe Group has applied the following standards and amendments for first time for their annual reporting period commencing 1 July 2014:
— AASB 2013-3 Amendments to AASB 136 — Recoverable Amount Disclosures for Non-Financial Assets;
— Interpretation 21 Accounting for Levies;
— AASB 2014-1 Amendments to Australian Accounting Standards.
The adoption of AASB 2013-3 had a small impact on the impairment disclosures. Other than that, the adoption of these standards did not have any impact on the current period or any prior period and is not likely to affect future periods.
As these amendments merely clarify the existing requirements, they do not affect the Group’s accounting policies or any of the disclosures.
RESULTS FOR THE YEAR1 Segmental informationa) Description of business segmentsManagement has determined the segments based on the reports reviewed by the ELT that are used to make strategic decisions. The ELT considers the business from both a product, and within Australia, a geographic perspective. Each division prepares an executive finance report on a monthly basis; this is a detailed report that summarises the following:
— historic results of the division, using both statutory profit and operating profit;
— future forecast of the division for the remainder of the year; and
— key risks and opportunities facing the division.
The ELT assesses the performance of the segments based on a number of measures, both financial and non-financial, which include a measure of operating profit; the use of capital; and success in delivering against KPI. The ELT has identified two core divisions, Investment and Development. Applying the requirements of AASB 8 Operating Segments, Mirvac has two reportable segments, and in addition one business unit, Investment Management (including MAM), which does not meet the requirements for aggregation and therefore has been shown separately:
i) InvestmentThe division is made up of MPT and a small number of assets held by the company which holds investments in properties covering the office, retail, industrial and hotel sectors throughout Australia, held for the purpose of producing rental income, predominately through the Trust, its controlled trusts and corporate entities holding investment properties. Income is also derived from investments in JVA including Mirvac 8 Chifley Trust.
ii) Investment ManagementMIM comprises two business activities for segment reporting purposes, being capital management for listed and unlisted property funds on behalf of retail and institutional investors, and property asset management (MAM) on behalf of MPT, joint venture partners and external property owners.
Notes to the consolidated financial statements

MIRVAC GROUP ANNUAL REPORT 201538
Notes to the consolidated financial statements
e) Operating profitOperating profit is a financial measure which is not prescribed by AAS and represents the profit under AAS adjusted for specific non-cash items and significant items which management considers to reflect the core earnings of the Group.
f) Segment assets and liabilitiesThe amounts provided to the ELT with respect to total assets and total liabilities are measured in a manner consistent with that of the consolidated financial statements. These assets and liabilities are allocated based on the operations of the segment and physical location of the asset. The Group’s borrowings and derivative financial instruments are not considered to be segment liabilities but rather are managed by the Mirvac Group Treasury.
g) Geographical and customer analysisMirvac operates predominately in Australia. Materially, all revenue is derived in Australia and all assets are in Australia. No single customer in the current or prior year provided more than 10 per cent of the Group’s revenue.
1 Segmental information / continuediii) DevelopmentThe division’s primary operations are property development and construction of residential, office, industrial and retail development projects throughout Australia. In addition, project management fees are received from the management of development and construction projects on behalf of JVA and residential development funds.
b) Inter-segment transfersSegment revenues, expenses and results include transfers between segments. Such transfers are on an arm’s length basis and eliminated on consolidation.
c) EliminationThe elimination segment includes adjustment to eliminate trading between segments and to transfer balances to reflect correct disclosure of items on a consolidated basis.
d) Comparative informationWhen necessary, comparative information has been reclassified to achieve consistency in disclosure in current year amounts and other disclosures.
Investment Consolidated Investment Management Development Unallocated Elimination SoCI 2015 $m $m $m $m $m $m
Revenue from continuing operationsInvestment properties rental revenue 609.6 8.8 — — — 618.4Investment management fee revenue — 12.9 — — — 12.9Development and construction revenue — — 1,008.2 — — 1,008.2Development management fee revenue — — 13.5 — — 13.5Interest revenue 22.0 0.4 9.1 1.2 (0.1) 32.6Dividends/distributions revenue 0.4 — — — — 0.4Other revenue — 2.7 4.4 — 2.5 9.6Inter-segment revenue 8.3 19.2 97.7 59.9 (185.1) —
Total revenue from continuing operations 640.3 44.0 1,132.9 61.1 (182.7) 1,695.6
Net gain on fair value of investment properties and IPUC 146.2 — — — (5.4) 140.8Share of net profit of JVA accounted for using the equity method 60.6 1.2 5.5 0.7 — 68.0Gain on fair value of derivative financial instruments — — — 187.6 — 187.6Net gain on sale of assets 16.1 — 43.8 — — 59.9
Total other income 222.9 1.2 49.3 188.3 (5.4) 456.3
Total revenue from continuing operations and other income 863.2 45.2 1,182.2 249.4 (188.1) 2,151.9
Net loss on sale of PPE — — 0.3 — — 0.3Foreign exchange loss 3.1 — — 178.6 — 181.7Investment properties expenses 152.8 2.5 — — (12.4) 142.9Cost of property development and construction — — 880.9 — (96.2) 784.7Employee benefits expenses — 26.5 25.6 68.8 — 120.9Depreciation and amortisation expenses 21.6 0.5 2.1 2.1 4.1 30.4Impairment of loans, investments and inventories — — — (0.2) — (0.2)Finance costs 73.5 — 73.2 60.0 (61.6) 145.1Loss on fair value of derivative financial instruments 7.1 — — 8.8 — 15.9Selling and marketing expenses — 0.1 46.0 — — 46.1Other expenses 11.9 10.5 27.5 21.3 (15.0) 56.2
Profit/(loss) from continuing operations before income tax 593.2 5.1 126.6 (90.0) (7.0) 627.9Income tax expense (18.0)
Profit attributable to the stapled securityholders of Mirvac 609.9

MIRVAC GROUP ANNUAL REPORT 2015 39
1 Segmental information / continued Investment Investment Management Development Unallocated Elimination Tax Consolidated 2015 $m $m $m $m $m $m $m
Profit/(loss) attributable to the stapled securityholders of Mirvac 593.2 5.1 126.6 (90.0) (7.0) (18.0) 609.9Specific non-cash itemsNet gain on fair value of investment properties and IPUC (146.2) — — — 5.4 — (140.8)Net loss on fair value of derivative financial instruments and associated foreign exchange movements 1 10.2 — — (0.2) — — 10.0SBP expense 2 — — — 5.6 — — 5.6Depreciation of OOP 3 — — — — 6.1 — 6.1Straight-lining of lease revenue 4 (5.3) — — — — — (5.3)Amortisation of lease fitout incentives 3 11.3 — — — (2.0) — 9.3Net gain on fair value of investment properties, derivatives and other specific non-cash items included in share of net profit of JVA 5 (28.8) (0.6) — (0.4) — — (29.8)Significant itemsImpairment of loans, investments and inventories — — — (0.2) — — (0.2)Net gain from sale of non-aligned assets 6 (16.1) — — — — — (16.1)Restructuring costs 2, 7 — — — 6.8 — — 6.8Tax effectTax effect of non-cash and significant adjustments 8 — — — — — (0.7) (0.7)
Operating profit/(loss) (profit before specific non-cash and significant items) 418.3 4.5 126.6 (78.4) 2.5 (18.7) 454.8
1) Total of Gain and Loss on fair value of derivative financial instruments and Foreign exchange loss in the consolidated SoCI.2) Included within Employee benefits expenses in the consolidated SoCI.3) Included within Depreciation and amortisation expenses in the consolidated SoCI.4) Included within Investment properties rental revenue in the consolidated SoCI.5) Included within Share of net profit of JVA accounted for using the equity method in the consolidated SoCI.6) Included within Net gain on sale of assets in the consolidated SoCI.7) Included within Other expenses in the consolidated SoCI.8) Included in Income tax expense in the consolidated SoCI.

MIRVAC GROUP ANNUAL REPORT 201540
Notes to the consolidated financial statements
1 Segmental information / continued Investment Consolidated Investment Management Development Unallocated Elimination SoCI 2014 $m $m $m $m $m $m
Revenue from continuing operationsInvestment properties rental revenue 645.1 5.8 — — — 650.9Investment management fee revenue — 13.0 — — — 13.0Development and construction revenue — — 1,168.4 — (10.8) 1,157.6Development management fee revenue — — 15.2 — 0.7 15.9Interest revenue 15.6 0.3 5.1 1.5 (0.3) 22.2Dividend and distribution revenue 0.5 — — — — 0.5Other revenue 1.9 3.2 3.5 1.1 (1.8) 7.9Inter-segment revenue 14.5 18.0 99.4 35.7 (167.6) —
Total revenue from continuing operations 677.6 40.3 1,291.6 38.3 (179.8) 1,868.0
Net gain on fair value of investment properties and IPUC 37.9 — — — 10.9 48.8Share of net profit of JVA accounted for using the equity method 37.5 0.1 8.7 0.6 — 46.9Gain on fair value of derivative financial instruments (4.3) — — 7.3 — 3.0Foreign exchange gain 0.2 — — 7.3 — 7.5
Total other income 71.3 0.1 8.7 15.2 10.9 106.2
Total revenue from continuing operations and other income 748.9 40.4 1,300.3 53.5 (168.9) 1,974.2
Net loss on sale of assets 6.0 — — — — 6.0Net loss on sale of PPE — — 0.2 — — 0.2Investment properties expenses 169.2 2.2 — — (12.2) 159.2Cost of property development and construction — — 1,037.8 — (97.1) 940.7Employee benefits expenses — 23.8 17.3 64.0 — 105.1Depreciation and amortisation expenses 21.3 0.5 2.3 1.7 3.8 29.6Impairment of goodwill 24.5 — — — — 24.5Impairment of loans, investments and inventories — — — (1.2) — (1.2)Finance costs 77.0 0.4 77.9 35.6 (46.1) 144.8Loss on fair value of derivative financial instruments 0.2 — — 25.5 0.6 26.3Selling and marketing expenses — 0.2 30.4 0.4 — 31.0Other expenses 12.6 7.5 22.4 17.3 (12.5) 47.3
Profit/(loss) from continuing operations before income tax 438.1 5.8 112.0 (89.8) (5.4) 460.7Income tax expense (13.4)
Profit attributable to the stapled securityholders of Mirvac 447.3

MIRVAC GROUP ANNUAL REPORT 2015 41
1 Segmental information / continued Investment Investment Management Development Unallocated Elimination Tax Consolidated 2014 $m $m $m $m $m $m $m
Profit/(loss) attributable to the stapled securityholders of Mirvac 438.1 5.8 112.0 (89.8) (5.4) (13.4) 447.3Specific non-cash itemsNet gain on fair value of investment properties and IPUC (37.9) — — — (10.9) — (48.8)Net loss on fair value of derivative financial instruments and associated foreign exchange movements 1 4.3 — — 10.9 0.6 — 15.8SBP expense 2 — — — 6.5 — — 6.5Depreciation of OOP 3 — — — — 5.9 — 5.9Straight-lining of lease revenue 4 (12.2) — — — — — (12.2)Amortisation of lease fitout incentives 3 12.4 — — — (2.1) — 10.3Net gain on fair value of investment properties, derivatives and other specific non-cash items included in share of net profit of JVA 5 (20.2) 0.9 — (0.3) — — (19.6)Significant itemsImpairment of loans, investments and inventories — — — (1.2) — — (1.2)Impairment of goodwill 24.5 — — — — — 24.5Net loss from sale of non-aligned assets 6 6.0 — — — — — 6.0Tax effectTax effect of non-cash and significant items adjustments 7 — — — — — 3.3 3.3
Operating profit/(loss) (profit before specific non-cash and significant items) 415.0 6.7 112.0 (73.9) (11.9) (10.1) 437.8
1) Total of Gain and Loss on fair value of derivative financial instruments and Foreign exchange gain in the consolidated SoCI.2) Included within Employee benefits expenses in the consolidated SoCI.3) Included within Depreciation and amortisation expenses in the consolidated SoCI.4) Included within Investment properties rental revenue in the consolidated SoCI.5) Included within Share of net profit of JVA accounted for using the equity method in the consolidated SoCI.6) Net loss on sale of assets in the consolidated SoCI.7) Included in Income tax expense in the consolidated SoCI.
Investment Consolidated Investment Management Development Unallocated Elimination SoFP/SoCI 30 June 2015 $m $m $m $m $m $m
Total assets 7,785.5 41.3 2,411.5 1,477.5 (1,312.3) 10,403.5Total liabilities 1,317.8 10.2 887.5 2,841.8 (1,115.9) 3,941.4Investments in JVA 415.1 0.6 198.3 3.1 (54.9) 562.2Acquisitions of investments and PPE 1,025.5 0.8 4.7 10.7 — 1,041.7Depreciation and amortisation expenses 21.6 0.5 2.1 2.1 4.1 30.4
30 June 2014
Total assets 7,638.6 54.6 2,069.3 1,685.1 (1,525.9) 9,921.7Total liabilities 1,912.0 8.1 572.5 2,711.5 (1,458.5) 3,745.6Investments in JVA 370.1 2.3 217.4 2.8 (55.0) 537.6Acquisitions of investments and PPE 1,028.7 0.3 4.0 2.4 — 1,035.4Depreciation and amortisation expenses 21.3 0.5 2.3 1.7 3.8 29.6

MIRVAC GROUP ANNUAL REPORT 201542
Notes to the consolidated financial statements
2 Revenue from continuing operations and other income 2015 2014 $m $m
Interest revenueCash and cash equivalents 5.3 1.7JVA and related party loans 13.6 20.4Mezzanine loans 13.7 0.1
Total interest revenue 32.6 22.2
Gain on fair value of derivative financial instrumentsGain on interest rate derivatives — 2.9Gain on cross currency derivatives 187.6 0.1
Total gain on fair value of derivative financial instruments 187.6 3.0
Net gain on sale of assetsNet gain on sale of financial instruments 43.8 —Net gain on sale of investments 10.2 —Net gain on sale of investment properties 5.9 —
Total net gain on sale of assets 59.9 —
3 Expenses 2015 2014 Profit before income tax includes the following specific expenses: Note $m $m
Interest and finance charges paid/payable net of provision release 136.7 135.7Amount capitalised 1 (40.3) (35.9)Interest capitalised in current and prior years expensed this year net of provision release 45.8 38.4Borrowing costs amortised 2.9 6.6
Total finance costs 145.1 144.8
DepreciationPlant and equipment 4.7 4.5OOP 6.1 5.9
Total depreciation expenses 8 10.8 10.4
AmortisationLease fitout incentives 9.3 10.3Lease incentives 10.3 8.9
Total amortisation expenses 19.6 19.2
Total depreciation and amortisation expenses 30.4 29.6
Loss on fair value of derivative financial instrumentsLoss on cross currency derivatives — 25.5Loss on interest rate derivatives 15.4 —Loss on revaluation of other financial assets at fair value through profit or loss 0.5 0.8
Total loss on fair value of derivative financial instruments 15.9 26.3
Net loss on sale of assetsNet loss on sale of investment properties — 6.0
Other charges against assetsImpairment of receivables 10.1 2.2 15.0Impairment of goodwill 11.2 — 24.5Impairment of loans, investments and inventories (0.2) (1.2)Rental expense relating to operating leases 4.3 3.9
1) The interest capitalisation rate is primarily derived from the Group’s gearing for developments using the applicable interest rates in note 14.

MIRVAC GROUP ANNUAL REPORT 2015 43
4 Income tax 2015 2014 $m $m
a) Income tax expenseIncome tax expenseCurrent tax 0.4 0.4Deferred tax 17.6 13.0
Income tax expense 18.0 13.4
Income tax expense is attributable to:Profit from continuing operations 18.0 13.4Profit from discontinued operations — —
Aggregate income tax expense 18.0 13.4
Deferred income tax expense/(benefit) included in income tax expense comprises:Increase in deferred tax assets (60.5) (11.8)Increase in deferred tax liabilities 78.1 24.8
Deferred income tax expense 17.6 13.0
b) Numerical reconciliation of income tax expense to prima facie tax payableProfit before income tax 627.9 460.7
Exclude Group Elimination entries not subject to corporate taxation 1 9.4 (4.8)Exclude Investment segment profit 2 (581.4) (425.4)
Profit before tax subject to company income tax 55.9 30.5
Income tax expense calculated at 30 per cent 16.8 9.1
Tax effect of amounts which are not deductible/(taxable) in calculating taxable incomeNon-assessable impairment write-back of investments including JVA (0.2) —Non-deductible impairment of loans — 4.7Other non-deductible/non-assessable items 2.2 1.4
18.8 15.2Over provision in prior years (0.8) (1.8)
Income tax expense 3 18.0 13.4
Booked effective tax rate inclusive of prior year over provision 4 32.2% 43.9%
c) Tax lossesUnused tax and capital gains tax losses incurred by Australian entities for which no deferred tax asset has been recognised 620.6 566.1
Potential tax benefit at 30 per cent 186.2 169.8
1) Group Eliminations not subject to corporate tax generally relate to Investment segment profit restatements required for consolidated group reporting purposes.2) Investment segment profit represents trust income of MPT. MPT is treated as a flow through vehicle for tax purposes and does not pay tax. Investors pay tax
on the taxable income of MPT.3) The income tax expense represents both current and future income attributable to the financial year. The Mirvac Limited Australian consolidated tax group will
pay tax on its taxable profits when it has fully recovered its past accumulated losses.4) The effective tax rate for 2014 would have been reported at 34 per cent if a deferred tax asset of $4.7m had been recognised on the loan impairments.
d) Tax consolidation legislationMirvac Limited and its wholly-owned Australian controlled entities have implemented the tax consolidation legislation as of 1 July 2003 (refer to note 30(z)). On adoption of the tax consolidation legislation, the entities in the tax consolidated group entered into a tax sharing agreement which, in the opinion of the Directors, limits the joint and several liability of the wholly owned entities in the case of a default by the head entity, Mirvac Limited. The entities within the tax consolidated group have also entered into a tax funding agreement under which the wholly-owned entities fully compensate Mirvac Limited for any current tax payable assumed and are compensated by Mirvac Limited for any current tax receivable and deferred tax assets relating to unused tax losses or unused tax credits that are transferred to Mirvac Limited under the tax consolidation legislation. The funding amounts are determined by reference to the amounts recognised in the wholly-owned entities’ financial statements. The amounts receivable/payable under the tax funding agreement are due upon receipt of the funding advice from the head entity, which is issued as soon as practicable after the end of each year. The head entity may also require payment of interim funding amounts to assist with its obligations to pay tax instalments. The funding amounts are recognised as current inter-company receivables/payables.

MIRVAC GROUP ANNUAL REPORT 201544
Notes to the consolidated financial statements
4 Income tax / continued 2015 2014 $m $m
e) Current tax (liabilities)/assetsTax (payable)/receivable — —
f) Net deferred tax assetsNon-current assets — deferred tax assetsThe balance comprises temporary differences attributable to:Unearned profits with associates 11.2 22.1Accrued expenses 30.6 33.5Employee benefit provisions 7.3 6.7Unearned progress billings 124.9 55.3Derivative financial instruments 26.5 33.5Impairment of loans 4.2 7.4PPE 1.9 1.4Equity raising costs — 0.1Tax losses 185.4 191.9Foreign exchange translation losses 20.9 —
Deferred tax assets 412.9 351.9
Non-current liabilities — deferred tax liabilitiesThe balance comprises temporary differences attributable to:Equity accounted investments 3.7 17.1Inventories 151.4 86.2Foreign exchange translation gains — 30.5Derivative financial instruments 55.3 8.6Other 3.3 1.9
Deferred tax liabilities 213.7 144.3
Net deferred tax assets 199.2 207.6
Deferred tax assets expected to be recovered within 12 months — 12.0Deferred tax assets expected to be recovered after more than 12 months 412.9 339.9
412.9 351.9
g) Amounts recognised directly in equityAggregate current and deferred tax arising in the reporting period and not recognised in profit or loss or other comprehensive income but directly credited to equity:Deferred tax — credited directly to equity — 0.4
— 0.4
h) Tax expense/(benefit) relating to items of other comprehensive incomeExchange differences on translation of foreign operations 1.4 (0.1)
1.4 (0.1)

MIRVAC GROUP ANNUAL REPORT 2015 45
4 Income tax / continuedMovements in deferred tax
Foreign Equity exchange Unearned Unearned Derivative accounted translation profits with progress financial Impairment investments (gains)/losses associates billings instruments of loans PPE $m $m $m $m $m $m $m
Balance 1 July 2013 (10.5) (28.6) 18.1 97.0 22.1 5.4 1.3Credited/(charged) to profit or loss (6.6) (2.0) 4.0 (41.7) 2.8 2.0 0.1Credited/(charged) to other comprehensive income — 0.1 — — — — —Charged to equity — — — — — — —Acquisition/disposal of controlled entity — — — — — — —
Closing balance 30 June 2014 (17.1) (30.5) 22.1 55.3 24.9 7.4 1.4Credited/(charged) to profit or loss 3.9 52.8 (10.9) 67.7 (53.7) (3.2) 0.5Credited/(charged) to other comprehensive income — (1.4) — — — — —Charged to equity — — — — — — —Acquisition/disposal of controlled entity — — — 1.9 — — —Credited to other liabilities 9.5 — — — — — —
Closing balance 30 June 2015 (3.7) 20.9 11.2 124.9 (28.8) 4.2 1.9
Equity Employee raising Accrued benefit costs Inventories expenses provisions Tax losses Other Total $m $m $m $m $m $m $m
Balance 1 July 2013 0.2 (79.0) 23.9 6.0 165.7 (1.5) 220.1Credited/(charged) to profit or loss (0.1) (7.2) 9.6 0.7 25.8 (0.4) (13.0)Credited/(charged) to other comprehensive income — — — — — — 0.1Charged to equity — — — — 0.4 — 0.4Acquisition/disposal of controlled entity — — — — — — —
Closing balance 30 June 2014 0.1 (86.2) 33.5 6.7 191.9 (1.9) 207.6Credited/(charged) to profit or loss (0.1) (64.4) (2.9) 0.6 (6.5) (1.4) (17.6)Credited/(charged) to other comprehensive income — — — — — — (1.4)Charged to equity — — — — — — —Acquisition/disposal of controlled entity — (3.1) — — — — (1.2)Credited to other liabilities — 2.3 — — — — 11.8
Closing balance 30 June 2015 — (151.4) 30.6 7.3 185.4 (3.3) 199.2
5 EPS 2015 2014 Cents Cents
Earnings per stapled securityBasic EPS 16.51 12.19Diluted EPS 1 16.50 12.17
Basic and diluted earnings $m $m
Profit attributable to the stapled securityholders of Mirvac used in calculating EPS 609.9 447.3
Number Number Weighted average number of securities used as denominator m m
Weighted average number of securities used in calculating basic EPS 3,693.1 3,669.5Adjustment for calculation of diluted EPSSecurities issued under EIS 3.5 4.7
Weighted average number of securities used in calculating diluted EPS 1 3,696.6 3,674.2
1) Diluted securities include securities issued under the EIS, but do not include the options and rights issued under the current LTI plans as the exercise of these equity instruments is contingent on conditions during the vesting period.

MIRVAC GROUP ANNUAL REPORT 201546
Notes to the consolidated financial statements
OPERATING ASSETS AND LIABILITIES6 Investment propertiesInvestment properties comprised land and buildings held for long term rental yields, for capital appreciation and are not occupied by the Group. Revenue from the rental yields is included in the consolidated SoCI under investment properties rental revenue. Total rental revenue for the year was $618.4m (2014: $650.9m). Investment properties are carried at fair value (book value in the following table). Refer to note 6(c) for the valuation basis of the fair value measurement.
Capitalisation Book value rate Discount rate Last 30 Jun 30 Jun 30 Jun 30 Jun 30 Jun 30 Jun Date of external Date of 2015 2014 2015 2014 2015 2014 last external valuation acquisition $m $m % % % % valuation $m
1 Darling Island, Pyrmont NSW Apr 2004 195.8 188.9 6.75 7.00 8.25 8.75 Dec 2014 188.91 Woolworths Way, Bella Vista NSW 1 Aug 2010 250.2 250.0 7.75 7.75 8.50 8.88 Dec 2014 250.01-47 Percival Road, Smithfield NSW Nov 2002 35.9 32.5 7.50 8.00 8.75 9.50 Dec 2013 31.010-20 Bond Street, Sydney NSW (50% interest) 1 Dec 2009 200.0 192.8 6.38 6.63 8.00 8.50 Jun 2015 200.0101-103 Miller Street & Greenwood Plaza, North Sydney NSW (50% interest) Jun 1994 302.7 289.3 6.25-6.37 6.50-6.75 8.25-8.75 8.50-8.75 Dec 2014 300.016 Furzer Street, Phillip ACT Jul 2007 68.0 69.0 7.75 7.75 8.75 9.00 Dec 2013 69.0189 Grey Street, Southbank QLD Apr 2004 83.1 82.2 7.63 7.63 8.50 9.00 Dec 2013 79.01900-2060 Pratt Boulevard, Chicago Illinois USA Dec 2007 45.1 36.0 7.25 7.25 8.50 8.50 Dec 2013 36.0191-197 Salmon Street, Port Melbourne VIC 2 Jul 2003 — 77.5 — 9.75 — 10.00 Jun 2014 77.5210 George Street, Sydney NSW 2 May 2013 — 26.0 — 7.75 — 8.75 Jun 2014 26.0220 George Street, Sydney NSW 2 May 2013 — 57.0 — 8.00 — 8.75 Jun 2014 57.023 Furzer Street, Phillip ACT Feb 2010 252.1 247.0 7.25 7.35 8.50 8.75 Dec 2013 246.5271 Lane Cove Road, North Ryde NSW Apr 2000 32.3 31.4 8.25 8.25 9.00 9.25 Jun 2014 31.4275 Kent Street, Sydney NSW (50% interest) 1,3 Aug 2010 435.6 435.0 6.00 6.00 8.50 8.50 Jun 2012 792.03 Rider Boulevard, Rhodes NSW 1 Dec 2009 89.0 89.1 8.00 8.00 8.75 8.75 Dec 2014 88.434-39 Anzac Avenue, Smeaton Grange NSW 4 Jan 2015 23.3 — 8.00 — 9.00 — — —340 Adelaide Street, Brisbane QLD 1 Dec 2009 55.5 55.3 8.75 8.75 8.75 9.25 Dec 2014 55.0367 Collins Street, Melbourne VIC Nov 2013 238.5 228.0 6.50 7.00 8.25 8.75 Jun 2015 238.537 Pitt Street, Sydney NSW May 2013 68.0 68.0 8.00 8.00 8.75 8.75 Jun 2014 68.0380 St Kilda Road, Melbourne VIC Oct 1995 (50%) & Apr 2001 (50%) 140.2 127.7 7.25 8.00 8.25 9.00 Jun 2015 140.239 Britton Steet, Smithfield NSW 4 Jan 2015 21.1 — 7.25 — 8.75 — — —39 Herbert Street, St Leonards NSW 4 Jan 2015 153.5 — 6.75 — 8.75 — — —40 Miller Street, North Sydney NSW Mar 1998 114.1 106.4 6.75 7.25 8.50 8.75 Jun 2014 106.447-67 Westgate Drive, Altona North VIC 1 Dec 2009 18.7 19.1 9.50 9.50 9.75 9.75 Dec 2013 19.1472 Pacific Highway, St Leonards NSW 4 Jun 2015 63.1 — — — — — — —477 Collins Street, Melbourne VIC Nov 2013 72.0 72.0 7.00 7.50 8.25 8.75 Jun 2015 72.0486 Pacific Highway, St Leonards NSW 4 Jun 2015 58.3 — — — — — — —5 Rider Boulevard, Rhodes NSW Jan 2007 133.6 130.4 7.75 7.75 8.75 8.75 Dec 2014 133.051 Pitt Street, Sydney NSW May 2013 26.0 26.0 8.00 8.00 8.75 8.75 Jun 2014 26.054 Marcus Clarke Street, Canberra ACT 2 Oct 1987 — 14.1 — 9.75 — 10.50 Dec 2014 12.955 Coonara Avenue, West Pennant Hills NSW 1 Aug 2010 70.0 70.0 9.50 9.50 9.75 10.00 Jun 2014 70.06-8 Underwood Street, Sydney NSW May 2013 9.5 9.5 9.00 9.00 9.00 9.00 Jun 2014 9.560 Marcus Clarke Street, Canberra ACT 2 Sep 1989 — 48.5 — 8.75 — 9.50 Jun 2013 48.560 Wallgrove Road, Eastern Creek NSW Jan 2014 55.7 55.1 6.00-9.00 6.50-9.50 9.00-10.50 9.00-10.50 Jun 2014 55.165 Pirrama Road, Pyrmont NSW Jun 2001 126.6 115.0 7.00 7.50 8.25 8.75 Dec 2013 110.0699 Bourke Street, Melbourne VIC Nov 2007 (50%) (50% interest) 5 & May 2011 (50%) 77.0 — 6.13 — 8.25 — Jun 2015 77.077 St Georges Terrace, Perth WA May 2013 227.7 237.0 8.00 8.00 9.25 9.25 Jun 2014 237.08 Brabham Drive, Huntingwood NSW 4 Jan 2015 19.7 — 7.00 — 8.75 — — —90 Collins Street, Melbourne VIC May 2013 185.0 175.5 6.50 6.75 8.25 8.75 Jun 2014 175.5Birkenhead Point Outlet Centre, Drummoyne NSW 4 Dec 2014 320.7 — 6.25-8.00 — 8.50-9.50 — Jun 2015 320.7Broadway Shopping Centre, Broadway NSW (50% interest) 6 Jan 2007 292.1 280.0 6.00 6.00 8.75 8.75 Jun 2014 280.0Cherrybrook Village Shopping Centre, Cherrybrook NSW 1 Dec 2009 91.0 86.7 7.00 7.25 8.75 9.25 Jun 2015 91.0City Centre Plaza, Rockhampton QLD 1,2 Dec 2009 — 44.0 — 8.00 — 9.25 Jun 2013 49.0

MIRVAC GROUP ANNUAL REPORT 2015 47
6 Investment properties / continued Capitalisation Book value rate Discount rate Last 30 Jun 30 Jun 30 Jun 30 Jun 30 Jun 30 Jun Date of external Date of 2015 2014 2015 2014 2015 2014 last external valuation acquisition $m $m % % % % valuation $m
Como Centre, Cnr Toorak Road & Chapel Street, South Yarra VIC Aug 1998 179.5 168.3 7.50-8.00 8.00-8.36 8.25-12.00 9.00-11.00 Jun 2015 179.5Cooleman Court, Weston ACT 1 Dec 2009 52.4 52.0 7.50 7.50 9.00 9.00 Dec 2013 53.0Harbourside Shopping Centre, Darling Harbour NSW Jan 2014 262.0 252.0 6.50 6.75 9.00 8.75 Dec 2014 255.0Hinkler Central, Bundaberg QLD 2 Aug 2003 — 93.2 — 7.75 — 9.50 Dec 2014 99.0Hoxton Distribution Park, Hoxton Park NSW (50% interest) Jul 2010 131.7 114.1 6.00 6.50 8.00 9.25 Jun 2015 131.7Kawana Shoppingworld, Dec 1993 (50%) Buddina QLD & Jun 1998 (50%) 322.0 299.8 6.25 6.50 8.75 9.00 Dec 2014 311.0Moonee Ponds Central, May 2003 Moonee Ponds VIC & Feb 2008 68.6 67.0 7.75 7.75 9.00 9.00 Jun 2014 67.0Nexus Industry Park (Building 1), Lyn Parade, Prestons NSW Aug 2004 21.6 20.5 7.25 7.75 8.75 9.25 Jun 2015 21.6Nexus Industry Park (Building 2), Lyn Parade, Prestons NSW Aug 2004 14.6 13.1 7.25 7.75 8.75 9.25 Dec 2014 13.5Nexus Industry Park (Building 3), Lyn Parade, Prestons NSW Aug 2004 27.5 26.1 7.50 8.00 8.75 9.25 Jun 2015 27.5Nexus Industry Park (Building 4), Lyn Parade, Prestons NSW Aug 2004 39.7 38.2 7.25 7.50 8.75 9.25 Dec 2013 35.8Nexus Industry Park (Building 5), Lyn Parade, Prestons NSW Aug 2004 20.6 19.5 7.25 7.50 8.75 9.25 Dec 2014 19.8Orion Springfield Central, Springfield QLD 7 Aug 2002 235.0 138.8 6.50 6.75 9.00 9.25 Dec 2014 143.0Quay West Car Park, 109-111 Harrington Street, Sydney NSW Nov 1989 30.0 29.3 7.25 8.25 9.25 10.00 Jun 2015 30.0Rhodes Waterside, Rhodes NSW (50% interest) Jan 2007 149.0 130.4 6.25 7.00 8.50 9.25 Jun 2015 149.0Riverside Quay, Southbank VIC 8 Apr 2002 & Jul 2003 193.1 208.5 7.50 7.50-7.75 8.75 9.00-10.25 Dec 2013 199.3St Marys Village Centre, St Marys NSW Jan 2003 48.2 46.0 7.25 7.75 9.00 9.00 Dec 2014 47.0Stanhope Village, Stanhope Gardens NSW Nov 2003 116.0 101.6 7.00 7.25 9.00 9.00 Dec 2013 97.0
Total investment properties 6,562.2 5,890.4
IPUC2 Riverside Quay, Southbank VIC (50% interest) 8 Apr 2002 23.7 — 6.13 — 8.50 — — —200 George Street, Sydney NSW (50% interest) Dec 2012 133.5 68.6 6.00 6.50 8.00 8.75 Dec 2014 92.9699 Bourke Street, Melbourne VIC Nov 2007 (50%) (50% interest) 5 & May 2011 (50%) — 20.4 — 6.50 — 9.00 — —Orion Springfield land, Springfield QLD 7 Aug 2002 21.6 37.0 — 6.50-9.50 — 9.25-10.25 Dec 2014 73.4Tramsheds, Harold Park NSW 9 Dec 2010 10.1 — 6.75 — 8.75 — — —
Total IPUC 188.9 126.0 —
Total investment properties and IPUC 6,751.1 6,016.4 —
1) Date of acquisition represents business combination acquisition date.2) Investment property disposed of during the year.3) Last external valuation represents 100 per cent interest, prior to sale of 50 per cent interest on 1 July 2014. No external valuation since June 2012, as sale price
on 1 July 2014 was considered as fair value.4) Investment property acquired during the year.5) Investment property reached practical completion during the year and was reclassified from IPUC.6) Includes 52-60 Francis Street, Glebe NSW (50% interest), acquired during the year.7) Stage 2 of Orion Springfield Central development now included as investment property in main centre. Remaining land now valued on a direct comparison basis.8) 50 per cent of 2 Riverside Quay, Southbank VIC was disposed of during the year. The remaining 50 per cent was reclassified as IPUC.9) Date of acquisition of Harold Park site. Construction of investment property commenced during the year.

MIRVAC GROUP ANNUAL REPORT 201548
Notes to the consolidated financial statements
6 Investment properties / continueda) Reconciliation of carrying amounts of investment properties 2015 2014 At fair value $m $m
Balance 1 July 6,016.4 6,029.6Additions 328.2 215.5Acquisitions 685.5 643.1Disposals (401.3) (149.1)Net gain on fair value of investment properties and IPUC 140.8 48.8Net gain/(loss) from foreign currency translation 8.1 (0.9)Assets classified as held for sale — (821.0)Transfers from inventories 4.1 20.1Transfers from OOP — 60.0Amortisation of lease fitout incentives, leasing costs and rent incentive (30.7) (29.7)
Balance 30 June 6,751.1 6,016.4
b) Amounts recognised in the consolidated SoCI for investment propertiesInvestment properties rental revenue 618.4 650.9Investment property expenses (142.9) (159.2)
475.5 491.7
c) Fair value measurement and valuation basisi) Investment propertiesInvestment properties are carried at fair value. Valuation methods used to determine the fair value include market sales comparison, DCF and capitalisation rate (“CR”). The fair value for a property may be determined by using a combination of these and other valuation methods.
Market sales comparison: The sales comparison approach utilises recent sales of comparable properties, adjusted for any differences including the nature, location and lease profile, to indicate the fair value of a property. Where there is a lack of recent sales activity, adjustments are made from previous comparable sales to reflect changes in economic conditions.
DCF: DCF projections derived from contracted rents, market rents, operating costs, lease incentives, lease fees, capital expenditure and future income on vacant space are discounted at a rate to arrive at a value. The discount rate is a market assessment of the risk associated with the cash flows, and the nature, location and tenancy profile of the property relative to returns from alternative investments, CPI rates and liquidity risk. It is assumed that the property is sold at the end of the investment period at a terminal value. The terminal value is determined by using an appropriate terminal CR. Mirvac’s terminal CR is in the range of an additional nil to 100 basis points above the respective property’s CR.
CR: An assessment is made of fully leased net income based on contracted rents, market rents, operating costs and future income on vacant space. The adopted fully leased net income is capitalised in perpetuity from the valuation date at an appropriate CR. The CR reflects the nature, location and tenancy profile of the property together with current market investment criteria, as evidenced by current sales evidence. Various adjustments, including incentives, capital expenditure, and reversions to market rent, are made to arrive at the property value.
ii) IPUCThere are generally no active markets for IPUC; therefore, a lack of comparable transactions for IPUC usually requires the use of estimation models. The two main estimation models used to value IPUC are residual and DCF valuations. The residual method of determining the value of a property uses the estimated total cost of the development, including construction and associated expenditures, finance costs, and an allowance for developer’s risk and profit is deducted from the end value of the completed project. The resultant figure is then adjusted back to the date of valuation to give the residual value.
AASB 13 Fair Value Measurement requires disclosure of fair value measurements by level of the following fair value measurement hierarchy:
— quoted prices (unadjusted) in active markets for identical assets or liabilities (level one);
— inputs other than quoted prices included within level one that are observable for the asset or liability, either directly (as prices) or indirectly (derived from prices) (level two); and
— inputs for the asset or liability that are not based on observable market data (unobservable inputs) (level three).

MIRVAC GROUP ANNUAL REPORT 2015 49
6 Investment properties / continuedDCF and CR both use unobservable inputs in determining fair value; ranges of the inputs are included below:
Inputs used to measure fair value
10 year market rent compound Net market annual Terminal Discount Fair value Fair value income growth rate CR yield rate Sector hierarchy $m $ 1 % 1 % % %
Office 2 Level three 3,898.8 205-1,003 0.00-4.10 6.00-9.50 6.25-10.00 8.00-9.75Industrial Level three 661.0 15-345 2.33-3.30 6.00-9.50 6.25-9.75 8.00-9.75Retail 2 Level three 2,103.6 221-1,071 3.00-4.43 6.00-8.00 6.25-8.00 8.50-9.50Other 3 Level three 87.7 — 1.88-3.35 7.25-8.00 7.50-9.00 9.25-12.00
1) Square metre.2) Includes IPUC.3) Net market income for Other sector (Car Parks and Hotel) not reported on a square metre basis.
d) Sensitivity on changes in fair value of investment property Fair value measurement sensitivity Fair value measurement sensitivity Significant inputs to significant increase in input to significant decrease in input
Net market income Increase Decrease10 year market rent compound annual growth rate Increase DecreaseCR Decrease IncreaseTerminal yield Decrease IncreaseDiscount rate Decrease Increase
Movement in any of the unobservable inputs is likely to have an impact on the fair value of investment property. The higher the net market rent and 10 year market rent compound annual growth rate, the higher the fair value. The higher the CR, terminal yield and discount rate, the lower the fair value.
e) Highest and best useFor all investment properties, the current use equates to the highest and best use.
f) Non-current assets pledged as securityThere are no non-current assets pledged as security by the Group.
g) Property portfolioMirvac’s property portfolio is made up as follows:
2015 2014 Note $m $m
Investment properties per consolidated SoFP 6,751.1 6,016.4Properties classified as assets held for sale 7 — 821.0OOP classified as PPE 8 244.3 238.6
6,995.4 7,076.0
7 Assets classified as held for sale and discontinued operationsa) Assets classified as held for sale 2015 2014 $m $m
Non-current assets held for sale1 Castlereagh Street, Sydney NSW 1 — 69.410 Julius Avenue, North Ryde NSW 1 — 51.412 Julius Avenue, North Ryde NSW 1 — 21.3275 Kent Street, Sydney NSW (50%) 1 — 435.033 Corporate Drive, Cannon Hill QLD 1 — 15.238 Sydney Avenue, Forrest ACT 1 — 35.5339 Coronation Drive, Milton QLD 1 — 53.7Waverley Gardens Shopping Centre, Mulgrave VIC 1 — 139.5
— 821.0
1) Settlement occurred on 1 July 2014.
As part of the Group’s strategy, investment properties that no longer meet the investment criteria and are subject to a contract for sale, are classified as held for sale.
i) Non-recurring fair value measurementsInvestment property classified as held for sale during the reporting period was measured at the lower of its carrying amount and fair value less costs to sell at the time of the reclassification. The fair value of the investment properties was determined using the market sales comparison approach as described in note 6. This is a level three measurement as per the fair value hierarchy set out in note 15.

MIRVAC GROUP ANNUAL REPORT 201550
Notes to the consolidated financial statements
8 PPEPPE comprises mainly plant and equipment and OOP. The different classes of assets are grouped in a similar nature and use in the Group’s operation. Items included in plant and equipment are stated at cost (or deemed cost) less accumulated depreciation. Items included in OOP are shown at fair value, less subsequent depreciation for buildings. OOP is primarily an investment property held for long term rental yields and capital appreciation. It is classified as PPE because of Mirvac’s tenancy in the property and under Australian Accounting Standards OOP is considered as PPE. Refer to note 30(p)(ii) for further detail.
Plant and Leased plant equipment OOP and equipment Total $m $m $m $m
2015Balance 1 July 9.6 238.6 0.5 248.7Revaluation increment — 11.8 — 11.8Additions 12.7 — — 12.7Disposals (0.5) — — (0.5)Depreciation expenses (4.7) (6.1) — (10.8)
Balance 30 June 17.1 244.3 0.5 261.9
2015Cost or fair value 41.8 288.4 0.5 330.7Accumulated depreciation (24.7) (44.1) — (68.8)
Net book amount 17.1 244.3 0.5 261.9
2014Balance 1 July 11.1 306.7 — 317.8Revaluation decrement — (2.2) — (2.2)Additions 3.2 — 0.5 3.7Transfers to other assets 1 — (60.0) — (60.0)Disposals (0.2) — — (0.2)Depreciation expenses (4.5) (5.9) — (10.4)
Balance 30 June 9.6 238.6 0.5 248.7
2014Cost or fair value 32.5 276.6 0.5 309.6Accumulated depreciation (22.9) (38.0) — (60.9)
Net book amount 9.6 238.6 0.5 248.7
1) Transfers out relate to 340 Adelaide Street, Brisbane QLD being reclassified as investment property as it no longer satisfies the criteria for OOP.
A reconciliation of the revaluation increment/(decrement) and the asset revaluation reserve (“ARR”) is shown in note 20(d).
a) Fair value measurement and valuation basis of OOPOOP is revalued by external valuers on a rotation basis with approximately one-half of the portfolio investment property and OOP portfolio being valued annually. The basis of valuation of OOP is fair value; for information about the methods and assumptions used in determining the fair value of OOP, refer to note 6. The valuation basis is consistent with the approach taken for investment properties (refer to note 6(c)(i)). Discount rates range from 8.25 to 8.75 per cent (2014: 8.50 to 10.50 per cent) and CR range from 6.50 to 6.88 per cent (2014: 6.00 to 9.50 per cent). The revaluation increment net of applicable deferred income taxes was credited to the ARR in equity (refer to note 20(b)).
b) Historical cost of items carried at fair value 2015 2014 OOP $m $m
Balance 30 June 213.0 210.6

MIRVAC GROUP ANNUAL REPORT 2015 51
9 InventoriesInventories comprise development projects and construction contracts. Development projects are valued at lower of cost and NRV and construction work-in-progress is stated at the aggregate of contract costs incurred to date plus recognised profits less recognised losses and progress billings.
2015 2014 $m $m
Current 1
Development projectsAcquisition costs 218.7 202.1Development costs 542.9 362.6Borrowing costs capitalised during development 46.2 62.8Provision for loss (33.6) (29.4)
774.2 598.1
Construction work in progress (amount due from customers for contract work)Contract costs incurred and recognised profits less recognised losses — 126.0Progress billings — (126.0)
— —
Total current inventories 774.2 598.1
Non-current 1
Development projectsAcquisitions costs 661.0 609.4Development costs 293.0 283.0Borrowing costs capitalised during development 113.5 120.4Provision for loss (128.3) (153.7)
Total non-current inventories 939.2 859.1
Aggregate carrying amount of inventoriesCurrent 774.2 598.1Non-current 939.2 859.1
Total inventories 1,713.4 1,457.2
1) Lower of cost and NRV.
a) Inventories expenseInventories expensed as cost of property development and construction during the year ended 30 June 2015 amounted to $784.7m (2014: $940.7m). During the year, there was no amount (2014: $nil) expensed as provision for loss on inventories.
b) Current and non-current inventoriesThe disclosure of inventories as either current or non-current is determined by the period within which they are expected to be realised. Inventories disclosed as current are expected to be realised within 12 months; all other inventories are expected to be realised beyond 12 months from the reporting date.
10 Financial assets and liabilities10.1 Receivables Provision for Gross impairment Net $m $m $m
30 June 2015CurrentTrade receivables 23.9 (0.4) 23.5Amounts due from related parties 21.0 (0.3) 20.7Amounts due from unrelated parties 8.9 (0.8) 8.1Mezzanine loans 12.2 (12.2) —Accrued income 11.5 — 11.5Other receivables 11.8 (2.6) 9.2
89.3 (16.3) 73.0
Non-currentAmounts due from related parties 48.1 (24.5) 23.6Other receivables 66.2 (33.0) 33.2
114.3 (57.5) 56.8

MIRVAC GROUP ANNUAL REPORT 201552
Notes to the consolidated financial statements
10 Financial assets and liabilities / continued Provision for Gross impairment Net $m $m $m
30 June 2014Current receivablesTrade receivables 22.3 (0.1) 22.2Loans to directors and employees 2.0 — 2.0Amounts due from related parties 13.6 (0.3) 13.3Amounts due from unrelated parties 47.4 (16.6) 30.8Mezzanine loans 12.2 (12.2) —Accrued income 17.3 — 17.3Other receivables 14.3 (1.2) 13.1
129.1 (30.4) 98.7
Non-current receivablesLoans to directors and employees 0.3 — 0.3Amounts due from related parties 56.7 (24.2) 32.5Other receivables 60.7 (33.0) 27.7
117.7 (57.2) 60.5
Further information in relation to loans to KMP is set out in the Remuneration report and amounts due from related parties is set out in note 26.
a) Trade receivablesThe average credit period on sales of goods is 30 days. No interest is charged on any outstanding trade receivables. Refer to note 10.1(d) for details regarding the credit risk of receivables.
b) Other receivablesThese amounts generally arise from transactions outside of the classification of trade receivables such as GST receivables and other sundry debtors.
c) Provision for impairment of receivablesMovements in the provision for impairment of receivables are detailed below:
2015 2014 $m $m
Balance 1 July (87.6) (96.1)Amounts written off 16.0 23.5Provision for impairment recognised (2.2) (15.0)
Balance 30 June (73.8) (87.6)
Mirvac has written off $16.0m (2014: $23.5m) of impairment against receivables during the current year. This relates to a loan to an unrelated party that was previously provided for impairment and management had assessed that it is now non-recoverable (2014: two mezzanine loans and a loan to a related party). This loss has been applied against the provision for impairment of receivables. The creation and release of the provision for impaired receivables have been included in impairment of loans in profit or loss where these relate to the mezzanine loans and loan to a related party, and have been included in other expenses in profit or loss where these relate to the impairment of trade receivables.
d) Credit riskReceivables consist of a large number of customers. Mirvac does not have any significant credit risk exposure to a single customer or groups of customers. Ongoing credit evaluation is performed on the financial condition of customers and, where appropriate, a provision for impairment of receivables is raised. Mirvac holds collateral in certain circumstances which takes the form of bank guarantees, security deposits, personal guarantee or a mortgage over property until completion. The ageing of receivables is detailed below:
2015 2014
Total Provision for Total Provision for receivables impairment receivables impairment $m $m $m $m
Not past due 161.4 (38.5) 191.9 (36.6)Renegotiated — — — —Past due 1—30 days 5.9 — 2.5 —Past due 31—60 days 0.6 — 0.6 —Past due 61—90 days 0.3 (0.1) 0.2 —Past due 91—120 days 0.2 (0.1) 0.2 —Past 120 days 35.2 (35.1) 51.4 (51.0)
Total 203.6 (73.8) 246.8 (87.6)

MIRVAC GROUP ANNUAL REPORT 2015 53
10 Financial assets and liabilities / continuedUnder certain circumstances, Mirvac has not provided for all balances past due as it has been determined that there has not been a significant change in credit quality at the end of the reporting period based upon the customer’s payment history and analysis of the customer’s financial accounts. The Group holds collateral over receivables of $286.4m (2014: $288.3m). The fair value of the collateral held equals the fair value of the receivables for which the collateral is held. The terms of the collateral are if payment due is not received per the agreed terms, Mirvac is able to claim the collateral held.
e) Impairment and risk exposuresRefer to note 30(j) for information about the impairment of trade receivables and their credit quality and note 30(n) for impairment of other receivables. Refer to note 14 for Mirvac’s exposure to foreign currency risk, interest rate risk and credit risk.
f) Fair values of trade and other receivablesDue to the short term nature of the current receivables, their carrying amount (less impairment provision) is assumed to be the same as their fair value. For the majority of the non-current receivables, the carrying amount is also not significantly different to their fair value.
10.2 Payables 2015 2014 $m $m
CurrentTrade payables 95.6 79.0Employee benefits 11.8 9.8Deferred revenue 1 320.7 128.0Accruals 202.2 185.1Deferred payment for land 26.0 55.2Other creditors 15.9 45.8Amounts due to related parties 0.9 2.2
673.1 505.1
Non-currentDeferred revenue 1 28.9 24.5Deferred payment for land 55.5 35.5Other creditors 29.1 25.0
113.5 85.0
1) Deferred revenue includes payments received in respect of development contracts that do not meet the requirements to be accounted for as construction contracts.
Trade payables are unsecured and are usually paid within 30 days of recognition.
a) Fair values of payablesThe carrying amounts of trade and other payables are assumed to be the same as their fair values due to their short term nature.
11 Other non-financial assets and liabilities11.1 Other assets 2015 2014 $m $m
Prepayments 21.4 22.5Monies held in trust 0.2 0.2
21.6 22.7
Monies held in trust relate to deposits received in respect of future sales of inventories.
11.2 Intangible assets Management rights Goodwill Total $m $m $m
2015Balance 1 July 2.6 36.4 39.0
Balance 30 June 2.6 36.4 39.0
2014Balance 1 July 2.6 63.1 65.7Impairment of goodwill — (24.5) (24.5)Derecognition of goodwill — (2.2) (2.2)
Balance 30 June 2.6 36.4 39.0

MIRVAC GROUP ANNUAL REPORT 201554
Notes to the consolidated financial statements
11 Other non-financial assets and liabilities / continueda) Allocation of intangible assets by operating segmentA segment level summary of the intangible asset allocations is presented below:
Investment Investment Management Total $m $m $m
2015Management rights — indefinite life 1 — 2.6 2.6Goodwill 36.4 — 36.4
Balance 30 June 36.4 2.6 39.0
2014Management rights — indefinite life 1 — 2.6 2.6Goodwill 36.4 — 36.4
Balance 30 June 36.4 2.6 39.0
1) Management rights are primarily held in relation to funds established or rights established by entities acquired by Mirvac. These funds are considered to be open-ended and therefore have no expiry. The Group also holds strategic stakes in these funds in order to protect its interests.
b) Key assumptions used for value in use calculations for goodwill and other intangible assetsThe recoverable amount of cash generating units (“CGUs”) is determined using the higher of fair value less costs to sell, and their value in use. Mirvac uses the value in use calculation which is based on financial budgets and forecasts approved by management covering a five year period. For the Investment Management CGU, cash flows beyond the five year period are extrapolated using the estimated growth rates stated below. For the Investment CGU, no forecast growth rate is assumed as the value in use calculations are based on forecast cash flows from existing projects and investment properties. The key assumptions used to determine the forecast cash flows included net market rent, capital expenditure, CR, growth rate, discount rate, and market conditions. The growth rate has been adjusted to reflect current market conditions and does not exceed the long term average growth rate for the business in which the CGU operates. The discount rates used are pre-tax and reflect specific risks relating to the relevant segments and the countries in which they operate. A terminal growth rate of three per cent has also been applied.
Growth rate 1 Discount rate Growth rate 1 Discount rate 2015 2015 2014 2014 CGU % pa % pa % pa % pa
Investment — 2 8.6 — 2 8.9Investment Management 1.0 13.0 1.0 13.0
1) Weighted average growth rate used to extrapolate cash flows beyond the budget period.2) The value in use calculation is based on financial budgets and forecasts approved by management covering a five year period. No forecast growth rate
is assumed as the value in use calculations are based on forecast cash flows from existing projects and investment properties.
The recoverable amount of goodwill exceeds the carrying value at 30 June 2015. Based on the information available on the key assumptions and market conditions at 30 June 2015, Management has considered and assessed reasonable possible changes on the key assumptions and has not identified any instances that could cause the carrying value to exceed the recoverable amount of goodwill.
As the CGU’s primarily consist of investment property, assumptions considered are the unobservable inputs used in determining fair value of investment property. For further information on the impact of a significant change in an unobservable input refer to note 6(d).
c) Impairment of goodwillThere was no impairment of goodwill (2014: $24.5m).
d) Impairment of intangible assetsThere was no impairment of management rights (2014: $nil). Management rights are primarily held in relation to funds established or rights established by entities acquired by Mirvac. These funds are considered to be open-ended and therefore have no expiry.
11.3 Provisions 2015 2014 Current Non-current Total Current Non-current Total $m $m $m $m $m $m
Employee benefits — LSL 9.1 3.2 12.3 8.4 3.2 11.6Dividends/distributions payable 181.2 — 181.2 169.8 — 169.8Restructuring costs 1 5.4 — 5.4 — — —Warranties 5.8 8.8 14.6 — — —Asset retirement obligation — — — — 0.3 0.3Other — 5.1 5.1 — — —
201.5 17.1 218.6 178.2 3.5 181.7
1) Includes employee severance costs of $3.9m.

MIRVAC GROUP ANNUAL REPORT 2015 55
11 Other non-financial assets and liabilities / continuedMovements in each class of provision during the year, other than employee benefits, are set out below:
Dividends/ Asset distributions Restructuring retirement payable 1 costs 2 Warranties 3 obligation 4 Other Total $m $m $m $m $m $m
2015Balance 1 July 169.8 — — 0.3 — 170.1Transfer in — — 17.6 — 5.1 22.7Additional provisions 347.6 5.4 4.6 — — 357.6Payments made/amounts utilised during the year (336.2) — (7.6) — — (343.8)Release of provision — — — (0.3) — (0.3)
Balance 30 June 181.2 5.4 14.6 — 5.1 206.3
2014Balance 1 July 164.9 — — 0.4 — 165.3Additional provisions 331.1 — — 0.3 — 331.4Payments made/amounts utilised during the year (326.2) — — — — (326.2)Release of provision — — — (0.4) — (0.4)
Balance 30 June 169.8 — — 0.3 — 170.1
1) The amounts reported in the provision include dividends/distributions paid/payable to securityholders of the Group.2) Provisions are recognised for restructuring activities when a detailed plan has been developed and a valid expectation that the plan will be carried out is held
by those affected by it. On 25 June 2015, Mirvac announced a change in the Group’s organisational structure and the decision to outsource certain finance related activities to an offshore provider and to downsize a number of corporate and business functions.
3) Warranties relate to the Group’s obligation to rectify any defective work during the warranty period of its developments, known as post-completion maintenance costs. Previously, given the smaller number of development projects and greater certainty around the liability due to the nature of the project the Group had classified these as accruals, refer to note 10.2. However, given the increase in Development activity including commercial projects, there is less historical knowledge to base an accrual and significant uncertainty around the amount of future expenditure required to cover these maintenance works and when they will be incurred. Given this, management has decided to reclassify these from accruals to provisions. There has been no change in the spilt between current and not-current.
4) The asset retirement obligation relates to obligations under lease agreements for space on expiry of the lease, to return it to its condition at the commencement of the lease.
11.4 Other liabilities 2015 2014 $m $m
Monies held in trust 0.2 0.2
CAPITAL STRUCTURE12 Borrowingsa) Borrowings 2015 2014 Note $m $m
CurrentUnsecuredDomestic medium term notes (“MTN”) 12(a)(ii) — 200.0SecuredLease liabilities 12(a)(iii) 0.2 2.9
0.2 202.9
2015 2014 Note $m $m
Non-currentUnsecuredBank loans 12(a)(i) 920.2 975.2Domestic MTN 12(a)(ii) 625.0 625.0Foreign MTN 12(a)(iv) 1,088.4 914.3SecuredLease liabilities 12(a)(iii) 0.1 0.2
2,633.7 2,514.7

MIRVAC GROUP ANNUAL REPORT 201556
Notes to the consolidated financial statements
12 Borrowings / continuedi) Bank loansMirvac has unsecured bank facilities totalling $1,400.0m (2014: $1,388.2m). The facility contains five tranches: a $200.0m tranche maturing in September 2016, a $350.0m tranche maturing in September 2017, a $300.0m tranche maturing in September 2018, a $300.0m tranche maturing in September 2019, and a $250.0m tranche maturing in September 2020. Subject to compliance with the terms, each of these bank loan facilities may be drawn at any time.
ii) Domestic MTNMirvac has a total of $625.0m (2014: $825.0m) of domestic MTN outstanding: $225.0m maturing in September 2016, $200.0m maturing in December 2017 and $200.0m maturing in September 2020. Interest is payable either quarterly or semi-annually in arrears in accordance with the terms of the notes.
iii) Lease liabilitiesLease liabilities are effectively secured as the rights to the leased asset revert to the lessor in the event of default.
iv) Foreign MTNMirvac has a total of $1,019.8m (US$735.0m and $135.0m) (2014: $1,019.8m) US Private Placement notes outstanding. The notes mature as follows:
— US$275.0m and $10.0m maturing in November 2016;
— US$100.0m maturing in November 2018;
— US$160.0m and $50.0m maturing in December 2022;
— US$105.0m and $25.0m maturing in December 2024; and
— US$95.0m and $50.0m maturing in December 2025.
Interest is payable semi-annually in arrears for all notes. Some of the notes were issued with fixed and floating rate coupons payable in US dollars and swapped back to Australian dollar floating rate coupons through cross currency swaps and interest rate swaps.
b) Financing arrangements 2015 2014 $m $m
Total facilitiesBank loans 1,400.0 1,388.2Domestic MTN 625.0 825.0Foreign MTN 1,088.4 914.3
3,113.4 3,127.5
Used at end of the reporting periodBank loans 920.2 975.2Domestic MTN 625.0 825.0Foreign MTN 1,088.4 914.3
2,633.6 2,714.5
Unused at end of the reporting periodBank loans 479.8 413.0Domestic MTN — —Foreign MTN — —
479.8 413.0
c) Fair value Carrying amount Fair value
2015 2014 2015 2014 $m $m $m $m
Included in consolidated SoFPNon-traded financial liabilitiesBank loans 920.2 975.2 920.2 975.2Domestic MTN 625.0 825.0 664.2 868.8Foreign MTN 1,088.4 914.3 1,148.5 970.5Lease liabilities 0.3 3.1 0.3 3.1
2,633.9 2,717.6 2,733.2 2,817.6
None of the classes above is readily traded on organised markets in standardised form.
The bank loans and lease liabilities are floating rate borrowings, therefore their fair value represents their respective carrying values. The fair value of domestic and foreign MTN has been calculated by discounting the expected future cash flows by the current market rates applicable to the relevant term of the MTN as disclosed in note 14. All borrowings are disclosed as level three in the fair value measurement hierarchy. For details on fair value hierarchy, refer to note 15.

MIRVAC GROUP ANNUAL REPORT 2015 57
12 Borrowings / continuedi) Included in consolidated SoFPThe fair value for borrowings less than 12 months to maturity is deemed to equal the carrying amounts. All other borrowings are discounted if the effect of discounting is material. The fair value of borrowings is based upon market prices where a market exists or by discounting the expected future cash flows by the current interest rates for liabilities with similar risk profiles.
13 Other financial assets and liabilities13.1 Derivative financial instruments 2015 2014 $m $m
Current assetsInterest rate swap contracts — fair value — 6.6Cross currency swaps — fair value — 9.1
— 15.7
Non-current assetsInterest rate swap contracts — fair value 16.5 6.9Cross currency swaps — fair value 159.4 4.4
175.9 11.3
Current liabilitiesInterest rate swap contracts — fair value 12.4 13.0
12.4 13.0
Non-current liabilitiesInterest rate swap contracts — fair value 36.1 17.1Cross currency derivatives — fair value 39.9 81.6
76.0 98.7
Mirvac’s derivatives are exclusively used for hedging purposes and not held for trading or speculative purposes.
a) Instruments used by MirvacRefer to note 14 for information on instruments used by Mirvac.
b) Risk exposuresRefer to note 14 for Mirvac’s exposure to foreign exchange, interest rate and credit risk on interest rate and cross currency swaps.
c) Change in accounting policyThe Group has applied the new standards on fair value measurement from 1 July 2014. The adoption of the standard has affected the measurement of the fair value of certain net derivative liabilities. The Group has recognised the adjustment as a fair value movement in profit or loss in the current period of $5.5m.
d) Fair value measurementFor information about the methods and assumptions used in determining the fair value of derivatives, refer to note 15.
13.2 Other financial assets at fair value through profit or loss 2015 2014 $m $m
Units in unlisted fundBalance 1 July 11.8 12.6Loss on revaluation (0.5) (0.8)
Balance 30 June 11.3 11.8
Changes in fair values of other financial assets at fair value through profit or loss are reflected in the consolidated SoCI as a gain or loss on fair value of derivative financial instruments.
a) Unlisted securitiesUnlisted securities are traded in inactive markets. The fair value of investments that are not traded in an active market is determined by the unit price as advised by the trustee of the fund. Unlisted securities held in the Group are units in JF Infrastructure Yield Fund. James Fielding Trust, a wholly-owned Group entity, owns 12.9m units (22 per cent) of this entity. The fair value of the security is determined based on the value of the underlying assets held by the fund. The assets of the fund are subject to regular external valuations. These valuations are based on discounted net cash inflows from expected future income and/or comparable sales of similar assets. Appropriate discount rates determined by the external valuer are used to determine the present value of the net cash inflows based on a market interest rate adjusted for the risk premium specific to each asset. The fair value is determined using valuation techniques that are not supported by prices from an observable market; so, the fair value recognised in the consolidated financial statements could change significantly if the underlying assumptions made in estimating the fair values were significantly changed.
b) Price risk exposureRefer to note 14 for Mirvac’s exposure to price risk on other financial assets at fair value through profit or loss.

MIRVAC GROUP ANNUAL REPORT 201558
Notes to the consolidated financial statements
13 Other financial assets and liabilities / continued13.3 Other financial assets 2015 2014 $m $m
CurrentHeritage Maintenance Annuity — Treasury Building Hotel — 52.0
— 52.0
Non-currentConvertible notes issued by Mirvac (Old Treasury) Trust 95.7 79.4Loan notes issued by Blackstone 168.9 —
264.6 79.4
At 30 June 2015, the Group held $95.7m of convertible notes (2014: $79.4m) of convertible notes in the Mirvac (Old Treasury) Trust. The Group also has an investment accounted for using the equity method in the issuing joint venture. Convertible notes have been issued to fund the development costs of IPUC held by the joint venture. In the future, the convertible notes will be converted into equity held by the Group and the investment accounted for using the equity method will increase by the value of the convertible notes held. The Group holds $168.9m of loan notes (2014: $nil). $156.0m of notes were issued by Blackstone for partial non-receipt of funds for the sale of non-aligned assets during the year. The remaining $12.9m (2014: $nil) of notes relate to capitalised interest.
a) Fair value measurementFor information about the methods and assumptions used in determining the fair value of other financial assets, refer to note 15.
14 Financial risk managementMirvac’s activities expose it to a variety of financial risks: market risk (including currency risk, interest rate risk and price risk), credit risk and liquidity risk. Mirvac’s overall risk management program seeks to minimise potential adverse effects on the financial performance of Mirvac. The Group uses various derivative financial instruments to manage certain risk exposures, specifically in relation to interest rate and foreign exchange risks on borrowings. Derivatives are exclusively used for hedging purposes and are not held for trading or speculative purposes. Financial risk management is carried out by Mirvac Group Treasury under policies approved by the Board. The Board provides written principles for overall risk management, as well as written policies covering specific areas, such as mitigating foreign exchange, interest rate and credit risks, using derivative financial instruments and investing excess liquidity. Mirvac Group Treasury identifies, evaluates, reports and manages financial risks in close cooperation with the Group’s operating units in accordance with Board policy.
The Group holds the following financial instruments:
2015 2014 Note $m $m
Financial assetsCash and cash equivalents 28 59.8 97.8Receivables 10.1 129.8 159.2Derivative financial assets 13.1 175.9 27.0Other financial assets at fair value through profit or loss 13.2 11.3 11.8Other financial assets 13.3 264.6 131.4
Total financial assets 641.4 427.2
Financial liabilitiesPayables 10.2 786.6 590.1Borrowings 12 2,633.9 2,717.6Derivative financial liabilities 13.1 88.4 111.7
Total financial liabilities 3,508.9 3,419.4
The carrying values of trade receivables (less impairment provision) and payables are assumed to approximate their fair values due to their short term nature. Derivative financial assets and liabilities are valued based upon valuation techniques (refer to note 15).
a) Market riskMarket risk is the risk that the fair value or future cash flows of a financial asset or financial liability will fluctuate because of changes in market prices. Market risk comprises currency risk, interest rate risk and price risk.
i) Currency riskForeign exchange risk refers to the change in value between foreign currencies and the Australian dollar. This change affects the assets and liabilities of Mirvac which are denominated in currencies other than Australian dollars. Mirvac foreign exchange risks arise mainly from:
— borrowings denominated in currencies other than Australian dollars which are predominately US dollars;
— investments in offshore operations which are located in the United States;
— receipts and payments which are denominated in other currencies; and
— foreign exchange risk on derivatives.

MIRVAC GROUP ANNUAL REPORT 2015 59
14 Financial risk management / continuedMirvac manages its foreign exchange risk for its assets and liabilities denominated in other currencies by borrowing in the same currency as that in which the offshore business operates to form a natural hedge against the movement in exchange rates. Mirvac manages its foreign currency note borrowings with cross currency swaps which swap the obligations to pay fixed or floating US dollar principal and interest payments to floating Australian dollar interest payments. Cross currency swaps in place cover 100 per cent of the US dollar denominated note principal and interest outstanding. These swaps have the same maturity profiles as the underlying note obligations. This removes exposure to interest rates in the US market while creating floating exposures in the domestic market that have been managed to meet Mirvac’s target interest rate profile. The foreign currency exchange rate has been fixed for US$375.0m swaps to A$/US$0.7456 and US$360.0m swaps to A$/US$0.9429.
At 30 June 2015, the notional amounts and periods of expiry of the cross currency swap contracts for the Group were:
2015 2014 $m $m
Between one to two year(s) 368.9 —Between two to three years — 368.9Between three to four years 134.1 —Between four to five years — 134.1Greater than five years 381.9 381.9
884.9 884.9
All swaps require settlement on a quarterly basis. Translation gains or losses on the net investment in foreign operations are recorded through the foreign currency translation reserve.
Sensitivity analysisCross currency swaps are in place to manage the foreign exchange exposure on the US dollar debt. These swaps have the same notional principal and maturity profiles as those of the underlying note obligations. Based upon current exposures, the impact on the Group’s result of a 50 (2014: 25) basis point increase in US dollar interest rates would be a decrease in profit of $25.6m (2014: increase of $2.4m). The impact on Mirvac’s result of a 50 (2014: 25) basis point decrease in US dollar interest rates would be an increase in profit of $24.3m (2014: decrease of $1.4m).
ii) Interest rate riskMirvac’s interest rate risk arises from long term borrowings, cash and cash equivalents (refer to note 28(a)), receivables and derivatives.
BorrowingsBorrowings issued at variable rates expose Mirvac to cash flow interest rate risk. Borrowings issued at fixed rates expose Mirvac to fair value interest rate risk. The Group’s policy is to have a minimum of 40 per cent and a maximum of 80 per cent of borrowings subject to fixed or capped interest rates. This policy was complied with at the end of the year. Mirvac manages its cash flow interest rate risk by using interest rate derivatives, thereby maintaining fixed rate exposures within the policy range. Such interest rate derivatives have the economic effect of converting borrowings from floating rates to fixed or capped rates or vice versa.
The following table sets out Mirvac’s net exposure to interest rate risk by maturity periods. Exposures arise predominately from liabilities bearing variable interest rates as the Group intends to hold fixed rate liabilities to maturity.
Fixed interest maturing in
Floating 1 year Over 1 to 2 Over 2 to 3 Over 3 to 4 Over 4 to 5 Over interest rate or less year(s) years years years 5 years Total $m $m $m $m $m $m $m $m
2015Unsecured bank loans 920.2 — — — — — — 920.2Domestic MTN — — 225.0 200.0 200.0 — — 625.0Foreign MTN 953.4 — 10.0 — — — 125.0 1,088.4Interest rate swaps (1,100.0) 100.0 — 100.0 200.0 100.0 600.0 —Lease liabilities — 0.2 0.1 — — — — 0.3
773.6 100.2 235.1 300.0 400.0 100.0 725.0 2,633.9
2014Unsecured bank loans 975.2 — — — — — — 975.2Domestic MTN — 200.0 — 225.0 200.0 200.0 — 825.0Foreign MTN 779.3 — — 10.0 — — 125.0 914.3Interest rate swaps (650.0) (150.0) 100.0 100.0 200.0 200.0 200.0 —Lease liabilities — 2.9 0.1 0.1 — — — 3.1
1,104.5 52.9 100.1 335.1 400.0 400.0 325.0 2,717.6

MIRVAC GROUP ANNUAL REPORT 201560
Notes to the consolidated financial statements
14 Financial risk management / continuedDerivative instruments used by MirvacMirvac enters into a variety of derivative instruments, although most commonly it uses interest rate swap agreements. Under the swap agreements, Mirvac agrees with other parties to exchange, at specified intervals (mainly quarterly), the difference between fixed contract rates and floating rate interest amounts calculated by reference to the agreed notional principal amounts.
Aside from swap agreements, bought and/or sold option agreements are used which allow rates to float between certain ranges and bank cancellable agreements are used which allow the relevant bank to cancel the agreement if certain conditions arise, the benefit of which is lower fixed rates. These derivatives are recorded in the consolidated SoFP at fair value in accordance with AASB 139 Financial Instruments: Recognition and Measurement. The fair value movements are recorded through the consolidated SoCI (refer to notes 2 and 3). Derivatives currently in place cover approximately 61.4 per cent (2014: 57.1 per cent) of the loan principal outstanding. The fixed interest rates range between 2.50 and 6.40 per cent (2014: 2.50 and 6.40 per cent) per annum. At 30 June 2015, the notional principal amounts, interest rates and periods of expiry of the interest rate swap contracts held by the Group were as follows:
Floating to fixed Fixed to floating
2015 2014 2015 2014
Interest Interest Interest Interest rates rates rates rates % pa $m % pa $m % pa $m % pa $m
1 year or less 4.75-5.50 100.0 — — — — 8.25 150.0Over 1 to 2 year(s) — — 4.75-5.50 100.0 — — — —Over 2 to 3 years 2.50-6.40 300.0 4.70 100.0 5.50 200.0 — —Over 3 to 4 years 2.50-4.00 200.0 2.50-6.40 400.0 — — 5.5 200.0Over 4 to 5 years 3.49 100.0 2.50-4.00 200.0 — — — —Over 5 years 2.81-4.36 600.0 3.49-4.00 200.0 — — — —
1,300.0 1,000.0 200.0 350.0
The contracts require settlement of net interest receivable or payable each reset date (generally 90 days). The settlement dates generally coincide with the dates on which interest is payable on the underlying debt. The contracts are settled on a net basis.
Cash and cash equivalentsCash held exposes Mirvac to cash flow interest rate risk.
ReceivablesThe Group’s exposure to interest rate risk for current and non-current receivables is set out in the following table:
Fixed interest maturing in
Floating Non- interest 1 year Over 1 to Over 2 to Over 3 to Over 4 to interest rate or less 2 year(s) 3 years 4 years 5 years bearing Total Note $m $m $m $m $m $m $m $m
2015Trade receivables 10.1 — — — — — — 23.5 23.5Related party receivables 10.1 — 9.3 15.1 — — — 19.9 44.3Other receivables 10.1 18.9 2.5 2.7 0.2 — — 37.7 62.0
18.9 11.8 17.8 0.2 — — 81.1 129.8
2014Trade receivables 10.1 — — — — — — 22.2 22.2Related party receivables 10.1 — 5.8 11.2 15.1 — — 13.7 45.8Loans to directors and employees 10.1 — — — — — — 2.3 2.3Other receivables 10.1 16.2 3.1 4.9 — — — 64.7 88.9
16.2 8.9 16.1 15.1 — — 102.9 159.2
Sensitivity analysisMirvac’s interest rate risk exposure arises from long term borrowings, cash held with financial institutions and receivables. Based upon a 50 (2014: 50) basis point increase or decrease in Australian interest rates, the impact on profit after tax has been calculated taking into account all underlying exposures and related derivatives. This sensitivity has been selected as this is considered reasonable given the current level of both short term and long term interest rates.
The impact on the Group’s result of a 50 (2014: 50) basis point increase in interest rates assuming no interest is capitalised would be an increase in profit of $19.1m (2014: decrease of $2.3m). The impact on Mirvac’s result of a 50 (2014: 50) basis point decrease in interest rates would be decrease in profit of $20.5m (2014: increase of $1.5m).
The interest rate sensitivities of the Group vary on an increase/decrease of 50 basis point movement in interest rates due to the interest rate optionality of a small number of derivatives.
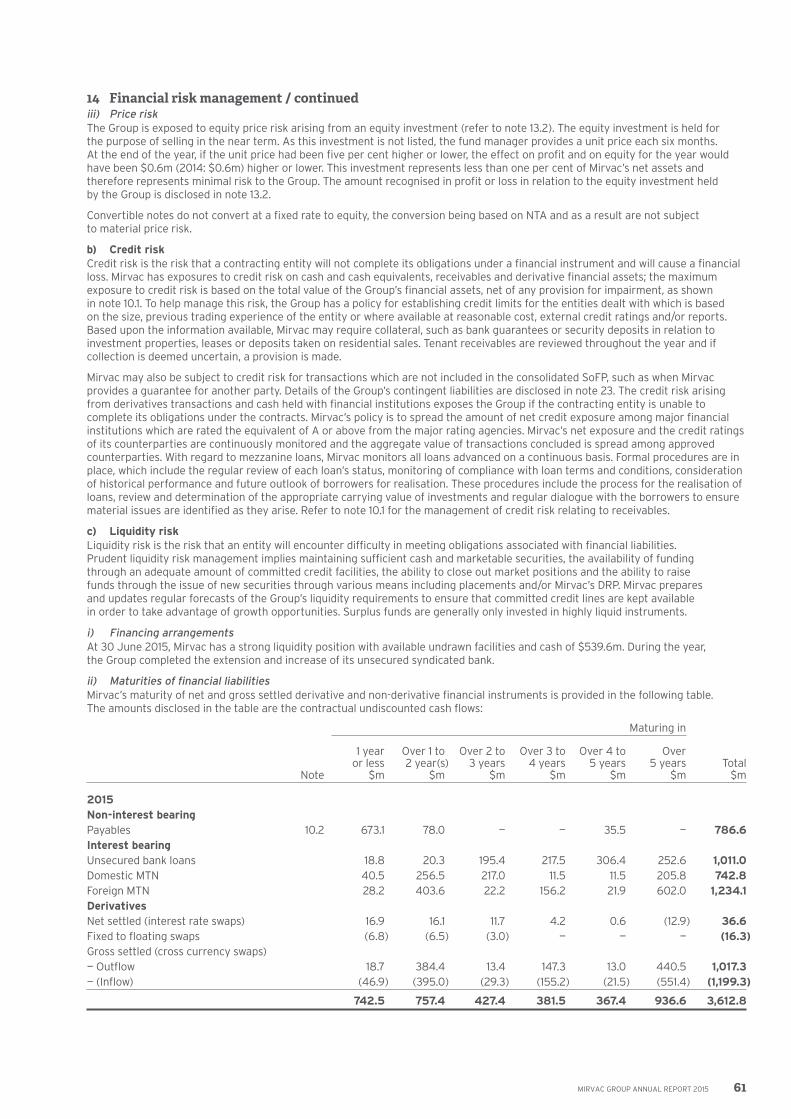
MIRVAC GROUP ANNUAL REPORT 2015 61
14 Financial risk management / continuediii) Price riskThe Group is exposed to equity price risk arising from an equity investment (refer to note 13.2). The equity investment is held for the purpose of selling in the near term. As this investment is not listed, the fund manager provides a unit price each six months. At the end of the year, if the unit price had been five per cent higher or lower, the effect on profit and on equity for the year would have been $0.6m (2014: $0.6m) higher or lower. This investment represents less than one per cent of Mirvac’s net assets and therefore represents minimal risk to the Group. The amount recognised in profit or loss in relation to the equity investment held by the Group is disclosed in note 13.2.
Convertible notes do not convert at a fixed rate to equity, the conversion being based on NTA and as a result are not subject to material price risk.
b) Credit riskCredit risk is the risk that a contracting entity will not complete its obligations under a financial instrument and will cause a financial loss. Mirvac has exposures to credit risk on cash and cash equivalents, receivables and derivative financial assets; the maximum exposure to credit risk is based on the total value of the Group’s financial assets, net of any provision for impairment, as shown in note 10.1. To help manage this risk, the Group has a policy for establishing credit limits for the entities dealt with which is based on the size, previous trading experience of the entity or where available at reasonable cost, external credit ratings and/or reports. Based upon the information available, Mirvac may require collateral, such as bank guarantees or security deposits in relation to investment properties, leases or deposits taken on residential sales. Tenant receivables are reviewed throughout the year and if collection is deemed uncertain, a provision is made.
Mirvac may also be subject to credit risk for transactions which are not included in the consolidated SoFP, such as when Mirvac provides a guarantee for another party. Details of the Group’s contingent liabilities are disclosed in note 23. The credit risk arising from derivatives transactions and cash held with financial institutions exposes the Group if the contracting entity is unable to complete its obligations under the contracts. Mirvac’s policy is to spread the amount of net credit exposure among major financial institutions which are rated the equivalent of A or above from the major rating agencies. Mirvac’s net exposure and the credit ratings of its counterparties are continuously monitored and the aggregate value of transactions concluded is spread among approved counterparties. With regard to mezzanine loans, Mirvac monitors all loans advanced on a continuous basis. Formal procedures are in place, which include the regular review of each loan’s status, monitoring of compliance with loan terms and conditions, consideration of historical performance and future outlook of borrowers for realisation. These procedures include the process for the realisation of loans, review and determination of the appropriate carrying value of investments and regular dialogue with the borrowers to ensure material issues are identified as they arise. Refer to note 10.1 for the management of credit risk relating to receivables.
c) Liquidity riskLiquidity risk is the risk that an entity will encounter difficulty in meeting obligations associated with financial liabilities. Prudent liquidity risk management implies maintaining sufficient cash and marketable securities, the availability of funding through an adequate amount of committed credit facilities, the ability to close out market positions and the ability to raise funds through the issue of new securities through various means including placements and/or Mirvac’s DRP. Mirvac prepares and updates regular forecasts of the Group’s liquidity requirements to ensure that committed credit lines are kept available in order to take advantage of growth opportunities. Surplus funds are generally only invested in highly liquid instruments.
i) Financing arrangementsAt 30 June 2015, Mirvac has a strong liquidity position with available undrawn facilities and cash of $539.6m. During the year, the Group completed the extension and increase of its unsecured syndicated bank.
ii) Maturities of financial liabilitiesMirvac’s maturity of net and gross settled derivative and non-derivative financial instruments is provided in the following table. The amounts disclosed in the table are the contractual undiscounted cash flows:
Maturing in
1 year Over 1 to Over 2 to Over 3 to Over 4 to Over or less 2 year(s) 3 years 4 years 5 years 5 years Total Note $m $m $m $m $m $m $m
2015Non-interest bearingPayables 10.2 673.1 78.0 — — 35.5 — 786.6Interest bearingUnsecured bank loans 18.8 20.3 195.4 217.5 306.4 252.6 1,011.0Domestic MTN 40.5 256.5 217.0 11.5 11.5 205.8 742.8Foreign MTN 28.2 403.6 22.2 156.2 21.9 602.0 1,234.1DerivativesNet settled (interest rate swaps) 16.9 16.1 11.7 4.2 0.6 (12.9) 36.6Fixed to floating swaps (6.8) (6.5) (3.0) — — — (16.3)Gross settled (cross currency swaps)— Outflow 18.7 384.4 13.4 147.3 13.0 440.5 1,017.3— (Inflow) (46.9) (395.0) (29.3) (155.2) (21.5) (551.4) (1,199.3)
742.5 757.4 427.4 381.5 367.4 936.6 3,612.8

MIRVAC GROUP ANNUAL REPORT 201562
Notes to the consolidated financial statements
14 Financial risk management / continued Maturing in
1 year Over 1 to Over 2 to Over 3 to Over 4 to Over or less 2 year(s) 3 years 4 years 5 years 5 years Total Note $m $m $m $m $m $m $m
2014Non-interest bearingPayables 10.2 505.1 42.1 7.4 — — 35.5 590.1Interest bearingUnsecured bank loans 24.7 290.6 22.4 339.1 392.3 — 1,069.1Domestic MTN 257.0 40.5 256.5 217.0 11.5 217.3 999.8Foreign MTN 47.8 48.1 342.9 32.9 135.9 639.7 1,247.3DerivativesNet settled (interest rate swaps) 13.7 8.6 7.1 3.7 (0.5) (0.8) 31.8Fixed to floating swaps (13.9) (5.2) (4.5) (1.9) — — (25.5)Gross settled (cross currency swaps) — — — — — — —— Outflow 13.3 14.1 378.8 4.7 136.7 — 547.6— (Inflow) (38.3) (38.6) (323.7) (24.0) (127.1) (469.3) (1,021.0)
809.4 400.2 686.9 571.5 548.8 422.4 3,439.2
d) Capital riskMirvac’s objectives when managing capital are to safeguard the Group’s ability to continue as a going concern, so that it can provide returns to securityholders and meet its strategic objectives without increasing its overall risk profile.
In assessing the optimal capital structure, the Group seeks to maintain an investment grade credit rating of BBB+ to reduce the cost of capital and diversify its sources of debt capital.
At 30 June 2015, the gearing ratio (net debt including cross currency swaps to total tangible assets less cash) was 24.3 per cent (2014: 27.8 per cent). The Group’s target gearing ratio is 20 to 30 per cent. This may be exceeded in order to take advantage of appropriate opportunities, such as acquisitions as they arise. To manage the Group’s gearing ratio, a number of mechanisms are available. These may include adjusting the amount of dividends/distributions paid to securityholders, adjusting the number of securities on issue (via buy-backs), or the disposal of assets.
Mirvac prepares quarterly consolidated SoFP, SoCI and cash flow updates for the current year and five year forecasts. These forecasts are used to monitor the Group’s capital structure and future capital requirements, taking into account future market conditions.
AFSL ratios and Queensland Building licences ratios were complied with at 30 June 2015. Mirvac also complied with all its borrowing covenant ratios at 30 June 2015. The gearing ratios were as follows:
2015 2014 $m $m
Net interest bearing debt less cash 1 2,505.1 2,722.2Total tangible assets less cash 10,304.7 9,784.9
Gearing ratio (%) 24.3 27.8
1) US dollar denominated borrowings translated at cross currency instrument rate and excluding leases.
15 Fair value measurement of financial instrumentsi) Fair value hierarchyThe fair value of financial assets and financial liabilities must be estimated for recognition and measurement or for disclosure purposes. AASB 13 Fair Value Measurement requires disclosure of fair value measurements by level of the following fair value measurement hierarchy:
— quoted prices (unadjusted) in active markets for identical assets or liabilities (level one);
— inputs other than quoted prices included within level one that are observable for the asset or liability, either directly (as prices) or indirectly (derived from prices) (level two); and
— inputs for the asset or liability that are not based on observable market data (unobservable inputs) (level three).

MIRVAC GROUP ANNUAL REPORT 2015 63
15 Fair value measurement of financial instruments / continuedThe following table presents the Group’s assets and liabilities measured and recognised at fair value at 30 June 2015 and 30 June 2014 on a recurring basis:
Level one Level two Level three Total Note $m $m $m $m
2015AssetsOther financial assets at fair value through profit or loss— unlisted securities 13.2 — — 11.3 11.3Other financial assets 1 13.3 — — 264.6 264.6Derivatives used for hedging 13.1 — 175.9 — 175.9
— 175.9 275.9 451.8
LiabilitiesDerivatives used for hedging 13.1 — 88.4 — 88.4
— 88.4 — 88.4
2014AssetsOther financial assets at fair value through profit or loss— unlisted securities 13.2 — — 11.8 11.8Other financial assets 1 13.3 — — 131.4 131.4Derivatives used for hedging 13.1 — 27.0 — 27.0
— 27.0 143.2 170.2
LiabilitiesDerivatives used for hedging 13.1 — 111.7 — 111.7
— 111.7 — 111.7
1) Relates to convertible notes associated with funding Mirvac (Old Treasury) Trust joint venture $95.7m (2014: $79.4m). Convertible notes have been issued to fund the development costs of IPUC held by the Group and they will be converted into equity held by the Group at the end of the development. Also included is the vendor financing arrangement with Blackstone $168.9m (2014: $nil) which relates to partial non-receipt of funds from sale relating to sale of non-aligned assets and Heritage Maintenance Annuity $nil (2014: $52.0m).
There were no transfers between levels one, two and three for recurring fair value measurements during the year. The Group’s policy is to recognise transfers into and transfers out of fair value hierarchy levels as at the end of the reporting period.
ii) Valuation techniques used to derive level one, level two and level three fair valuesLevel one: The fair value of financial instruments traded in active markets (such as publicly traded derivatives, and trading and available-for-sale securities) is based on quoted market prices at the end of the reporting period. The quoted market price used for financial assets held by the Group is the current bid price. Mirvac holds no level one financial instruments.
Level two: The fair value of financial instruments that are not traded in an active market (for example, over-the-counter derivatives) is determined using valuation techniques. Mirvac uses a variety of methods and makes assumptions that are based on market conditions existing at the end of each reporting period. Quoted market prices or dealer quotes for similar instruments are used to estimate fair value for long term debt for disclosure purposes. Other techniques, such as estimated DCF, are used to determine fair value for the remaining financial instruments. The fair value of interest rate swaps is calculated as the present value of the estimated future cash flows. The fair value of forward exchange contracts is determined using forward exchange market rates at the end of the reporting period. These instruments are included in level two and comprise debt investments and derivative financial instruments, where the fair values have been determined based on present values and discount rates used were adjusted for counterparty or own credit or debit adjustments.
Credit value adjustments: these are applied to mark-to-market assets based on the counterparty’s credit risk using the observable credit default swaps curve as a benchmark for credit risk.
Debit value adjustments: these are applied to mark-to-market liabilities based on Mirvac’s credit risk using Mirvac’s credit default swaps curve as a benchmark for credit risk.
Level three: If one or more of the valuation techniques for financial instruments is based on significant unobservable inputs, such instruments are included in level three. This is the case for unlisted securities and other financial assets.

MIRVAC GROUP ANNUAL REPORT 201564
Notes to the consolidated financial statements
15 Fair value measurement of financial instruments / continuediii) Fair value measurements using significant unobservable inputs (level three)The following table presents the changes in level three instruments for the year ended 30 June 2015 held by the Group:
Unlisted Other financial securities assets Total $m $m $m
Balance 1 July 2013 12.6 187.1 199.7Acquisitions — 41.5 41.5Equity conversion — (97.2) (97.2)Loss recognised in other income 1 (0.8) — (0.8)
Balance 30 June 2014 11.8 131.4 143.2
Acquisitions — 185.2 185.2Disposal — (52.0) (52.0)Loss recognised in other income 1 (0.5) — (0.5)
Balance 30 June 2015 11.3 264.6 275.9
1) Unrealised loss for the year included in gain/(loss) on fair value of derivative financial instruments that relate to assets held at the end of the year:
2015 (0.5) — (0.5)2014 (0.8) — (0.8)
There were no transfers between the levels of the fair value hierarchy during the year. There were also no changes made to any of the valuation techniques applied as of 30 June 2015.
The main level three inputs used by the Group in measuring the fair value of financial instruments are derived and evaluated as follows:
— unlisted securities — fair values of the security unit prices: these are determined based on the valuation of the underlying assets held by the fund. These valuations are based on discounted net cash inflows from expected future income and/or comparable sales of similar assets; and
— other financial assets — expected cash inflows: these are determined based on the development management agreement and vendor financing agreement with fixed repayment terms based on fixed interest rate and agreed project costs.
iv) Sensitivity on changes in fair value of level three financial instrumentsFor sensitivity analysis on level three unlisted securities, refer to note 14(a)(iii).
v) Fair value of other financial instrumentsThe carrying value of the other short term financial assets and financial liabilities being receivables and payables (set out in note 14) is considered to approximate their fair value.
GROUP STRUCTURE16 Investments in JVA 2015 2014 Note $m $m
Consolidated SoFPInvestments accounted for using the equity methodInvestments in associates 16(a)(i) — 0.5Investments in joint ventures 16(a)(iii) 562.2 537.1
562.2 537.6
Consolidated SoCIShare of net profit of JVA accounted for using the equity methodInvestments in associates 16(d)(i) (0.5) 1.2Investments in joint ventures 16(d)(ii) 68.5 45.7
68.0 46.9

MIRVAC GROUP ANNUAL REPORT 2015 65
16 Investments in JVA / continueda) Details of Mirvac’s JVAInvestments in JVA are accounted for using the equity method of accounting. All JVA were established or incorporated in Australia. Information relating to JVA is as follows:
i) Associates Carrying Interest value 2015 2014 2015 2014 Name of entity Principal activities % % $m $m
Mindarie Keys Joint Venture 1 Residential development — 15 — —Mirvac Industrial Trust 2 Property investment — 14 — 0.5
— 0.5
1) This investment was wound up during the year.2) This investment was sold on 3 December 2014.
ii) Fair value of listed investments in associates 2015 2014 $m $m
Mirvac Industrial Trust — 8.4
iii) Joint ventures Carrying Interest value
2015 2014 2015 2014 Name of entity Principal activities % % $m $m
Ascot Chase Nominee Stages 3-5 Pty Ltd Residential development 50 50 — —Australian Sustainable Forestry Investors 1&2 Forestry and environmental asset management 60 60 0.1 2.3BAC Devco Pty Limited 1 Non-residential development 33 33 — —BL Developments Pty Limited Residential development 50 50 19.6 30.9City West Property Investments (No.1) Trust Non-residential development 50 50 9.9 9.7City West Property Investments (No.2) Trust Non-residential development 50 50 9.9 9.7City West Property Investments (No.3) Trust Non-residential development 50 50 9.9 9.7City West Property Investments (No.4) Trust Non-residential development 50 50 9.9 9.7City West Property Investments (No.5) Trust Non-residential development 50 50 9.9 9.7City West Property Investments (No.6) Trust Non-residential development 50 50 9.9 9.7Domaine Investment Trust 2 Non-residential development — 50 — —Ephraim Island Joint Venture Residential development 50 50 — —Fast Track Bromelton Pty Limited and Nakheel SPV Pty Limited Non-residential development 50 50 27.3 27.4FreeSpirit Resorts Pty Limited Investment property 25 25 — —Googong Township Unit Trust Residential development 50 50 34.6 27.8Harold Park Real Estate Unit Trust 3 Real estate agency 50 — 0.1 —Infocus Infrastructure Management Pty Limited Investment property 50 50 0.5 1.0Leakes Road Rockbank Unit Trust Residential development 50 50 13.0 14.3Mirvac 8 Chifley Trust Investment property 50 50 173.1 157.3Mirvac Green Square Pty Limited 4 Residential development — 50 — 1.5Mirvac Lend Lease Village Consortium Residential development 50 50 0.4 0.9Mirvac (Old Treasury) Trust Investment property 50 50 65.5 53.6Mirvac Wholesale Residential Development Partnership Trust Residential development 20 20 11.0 21.8MVIC Finance 2 Pty Limited Residential development 50 50 — —Tucker Box Hotel Group Hotel investment 50 50 157.6 138.5Walsh Bay Partnership Residential development 50 50 — 1.6
562.2 537.1
1) This entity is in voluntary administration.2) This entity was wound up on 29 June 2015.3) This entity was established on 18 August 2014.4) Previously registered as Green Square Consortium Pty Limited. The remaining 50 per cent interest was acquired by Mirvac on 11 August 2014 and this entity
is now a controlled entity.

MIRVAC GROUP ANNUAL REPORT 201566
Notes to the consolidated financial statements
16 Investments in JVA / continuedb) Share of JVA commitmentsMirvac’s share of its JVA commitments which have been approved but not yet provided for at year ended 30 June 2015 are set out below: 2015 2014 $m $m
Capital commitments — —
Total JVA commitments — —
c) Summarised financial information for JVAThe tables below provide summarised financial information for JVA of the Group. The information disclosed reflects the amounts presented in the financial statements of the relevant JVA and not the Mirvac’s share of those amounts.
i) Associates Non- Current current financial financial liabilities liabilities Other Total Cash Other Total Total non- (excluding Other Total (excluding non- non- and cash current current current trade current current trade current current Net Summarised consolidated SoFP equivalents assets assets assets payables) liabilities liabilities payables) liabilities liabilities assets 2015 $m $m $m $m $m $m $m $m $m $m $m
Mindarie Keys Joint Venture 1 — — — — — — — — — — —Mirvac Industrial Trust 2 — — — — — — — — — — —
— — — — — — — — — — —
2014
Mindarie Keys Joint Venture 0.4 — 0.4 — — 0.3 0.3 — — — 0.1Mirvac Industrial Trust 3 16.5 1.1 17.6 219.2 2.9 12.7 15.6 142.3 — 142.3 78.9
16.9 1.1 18.0 219.2 2.9 13.0 15.9 142.3 — 142.3 79.0
1) This investment was wound up during the year.2) The investment was sold on 3 December 2014.3) SoFP based on the latest publicly available financial statements as at 31 December 2013.
Other Opening Profit/(loss) compre- Issue/ Distributions Closing Reconciliation to net assets for the hensive (redemption) paid/ net Group’s Group’s Carrying carrying amounts 1 July year income of equity payable assets share in share in amount 2015 $m $m $m $m $m $m % $m $m
Mindarie Keys Joint Venture 1 — — — — — — — — —Mirvac Industrial Trust 2 — — — — — — — — —
— — — — — — — —
2014
Mindarie Keys Joint Venture 5.9 3.5 — — (9.3) 0.1 15 — —Mirvac Industrial Trust 3 76.0 (0.3) 3.2 — — 78.9 14 11.0 0.5
81.9 3.2 3.2 — (9.3) 79.0 11.0 0.5
1) This investment was wound up during the year.2) The investment was sold on 3 December 2014.3) The investment was written down to $nil in 2009. The impairment on the loan to this investment was released during the year ended 30 June 2012.
The Group did not recognise the full share of profit or loss in the investment since it had been fully impaired to $nil.
Distributions Other Total received/ Profit/(loss) comprehensive comprehensive receivable Summarised consolidated SoCI Revenue for the year income income from associates 2015 $m $m $m $m $m
Mindarie Keys Joint Venture — — — — —Mirvac Industrial Trust — — — — —
— — — — —
2014Mindarie Keys Joint Venture 10.5 3.5 — 3.5 1.4Mirvac Industrial Trust 17.3 (0.3) 3.2 2.9 0.3
27.8 3.2 3.2 6.4 1.7

MIRVAC GROUP ANNUAL REPORT 2015 67
16 Investments in JVA / continuedii) Joint ventures Non- Current current financial financial Total liabilities liabilities Other Total Other Total non- (excluding Other Total (excluding non- non- Cash and cash current current current trade current current trade current current Net Summarised consolidated SoFP equivalents assets assets assets payables) liabilities liabilities payables) liabilities liabilities assets 2015 $m $m $m $m $m $m $m $m $m $m $m
Ascot Chase Nominee Stages 3-5 Pty Ltd 2.8 6.2 9.0 11.0 11.0 1.5 12.5 12.3 0.4 12.7 (5.2)Australian Centre for Life Long Learning — — — — — — — — — — —Australian Sustainable Forestry Investors 1 & 2 0.2 — 0.2 — — — — — — — 0.2BAC Devco Pty Limited — — — — — — — — — — —BL Developments Pty Limited 19.0 4.8 23.8 28.8 — 0.4 0.4 — — — 52.2City West Property Investments (No. 1 to 6) Trusts 0.3 1.9 2.2 116.3 — — — — — — 118.5Domaine Investment Trust — — — — — — — — — — —Ephraim Island Joint Venture 0.1 0.2 0.3 — — 0.1 0.1 — — — 0.2Fast Track Bromelton Pty Limited and Nakheel SPV Pty Limited 2.3 0.1 2.4 62.6 — 0.1 0.1 — — — 64.9FreeSpirit Resorts Pty Limited 0.5 4.1 4.6 25.7 0.3 7.6 7.9 29.8 — 29.8 (7.4)Googong Township Unit Trust — 53.2 53.2 134.3 21.7 77.4 99.1 14.6 — 14.6 73.8Harold Park Real Estate Unit Trust 0.5 (0.2) 0.3 — — 0.2 0.2 — — — 0.1Infocus Infrastructure Management Pty Limited 1.6 0.1 1.7 — — 0.6 0.6 — — — 1.1Leakes Road Rockbank Unit Trust 2.0 0.6 2.6 48.7 — 0.2 0.2 — 25.0 25.0 26.1Mirvac 8 Chifley Trust 2.5 0.5 3.0 379.2 — 3.0 3.0 — — — 379.2Mirvac Green Square Pty Limited — — — — — — — — — — —Mirvac Lend Lease Village Consortium 4.0 — 4.0 — — 3.5 3.5 — — — 0.5Mirvac (Old Treasury) Trust 66.3 0.1 66.4 264.4 — (1.6) (1.6) 191.4 — 191.4 141.0Mirvac Wholesale Residential Development Partnership Trust 36.5 103.7 140.2 51.1 23.0 60.3 83.3 36.0 — 36.0 72.0MVIC Finance 2 Pty Limited 0.1 — 0.1 — — — — — — — 0.1Tucker Box Hotel Group 1.2 6.7 7.9 472.5 1.7 7.9 9.6 153.7 0.9 154.6 316.2Walsh Bay Partnership — — — — — — — — — — —
139.9 182.0 321.9 1,594.6 57.7 161.2 218.9 437.8 26.3 464.1 1,233.5
2014
Ascot Chase Nominee Stages 3-5 Pty Ltd 26.7 8.3 35.0 15.3 11.7 4.5 16.2 36.9 (0.1) 36.8 (2.7)Australian Centre for Life Long Learning 0.7 89.7 90.4 0.1 — 40.1 40.1 35.2 — 35.2 15.2Australian Sustainable Forestry Investors 1 & 2 5.5 — 5.5 — — — — — — — 5.5BAC Devco Pty Limited — — — — — — — — — — —BL Developments Pty Limited 35.1 5.1 40.2 35.4 — 0.7 0.7 — (0.5) (0.5) 75.4City West Property Investments (No. 1 to 6) Trusts 0.3 4.4 4.7 112.4 — 0.1 0.1 — — — 117.0Domaine Investment Trust — — — — — — — — — — —Ephraim Island Joint Venture 0.4 — 0.4 — — 0.2 0.2 — — — 0.2Fast Track Bromelton Pty Limited and Nakheel SPV Pty Limited 2.7 — 2.7 62.3 — 0.1 0.1 — — — 64.9FreeSpirit Resorts Pty Limited 0.2 4.1 4.3 1.0 0.3 7.2 7.5 3.5 — 3.5 (5.7)Googong Township Unit Trust — 32.0 32.0 103.4 14.9 11.7 26.6 6.7 39.0 45.7 63.1Green Square Consortium Pty Limited 1.5 1.5 3.0 16.7 4.8 11.4 16.2 — 0.4 0.4 3.1HPAL Freehold Pty Limited — — — — — — — — — — —Infocus Infrastructure Management Pty Limited 2.1 0.1 2.2 — — 0.2 0.2 — — — 2.0Leakes Road Rockbank Unit Trust 1.0 — 1.0 32.0 — 1.1 1.1 — 3.3 3.3 28.6Mirvac 8 Chifley Trust 0.2 0.4 0.6 347.6 — 0.5 0.5 — — — 347.7Mirvac Lend Lease Village Consortium 4.3 — 4.3 — — 2.1 2.1 — — — 2.2Mirvac (Old Treasury) Trust 151.5 0.2 151.7 124.2 — (0.2) (0.2) 158.9 — 158.9 117.2Mirvac Wholesale Residential Development Partnership Trust 35.0 69.0 104.0 108.1 — 9.7 9.7 76.7 — 76.7 125.7MVIC Finance 2 Pty Limited 0.1 — 0.1 — — — — — — — 0.1Tucker Box Hotel Group 4.8 7.2 12.0 423.6 2.8 7.5 10.3 146.2 1.1 147.3 278.0Walsh Bay Partnership — 0.6 0.6 — — 2.6 2.6 — — — (2.0)
272.1 222.6 494.7 1,382.1 34.5 99.5 134.0 464.1 43.2 507.3 1,235.5

MIRVAC GROUP ANNUAL REPORT 201568
Notes to the consolidated financial statements
16 Investments in JVA / continued Other Opening (Loss)/ compre- Issue/ Distributions net assets profit for hensive (return) paid/ Closing Group’s Group’s Carrying Reconciliation to carrying amounts 1 July the year income of equity payable net assets share share in amount 2015 $m $m $m $m $m $m % $m $m
Ascot Chase Nominee Stages 3-5 Pty Ltd 1 (2.7) (2.5) — — — (5.2) 50 (2.6) —Australian Sustainable Forestry Investors 1 & 2 5.5 — — — (5.3) 0.2 60 0.1 0.1BAC Devco Pty Limited — — — — — — 33 — —BL Developments Pty Limited 2 75.4 0.2 — — (23.4) 52.2 50 26.1 19.6City West Property Investments (No. 1 to 6) Trusts 117.0 1.5 — — — 118.5 50 59.3 59.4Domaine Investment Trust — — — — — — — — —Ephraim Island Joint Venture 0.2 — — — — 0.2 50 0.1 —Fast Track Bromelton Pty Limited and Nakheel SPV Pty Limited 2 64.9 — — — — 64.9 50 32.5 27.3FreeSpirit Resorts Pty Limited (5.7) (1.7) — — — (7.4) 25 (1.9) —Googong Township Unit Trust 3 63.1 8.3 2.4 — — 73.8 50 36.9 34.6Harold Park Real Estate Unit Trust — (0.4) — 0.5 — 0.1 50 0.1 0.1Infocus Infrastructure Management Pty Limited 2.0 1.1 — — (2.0) 1.1 50 0.6 0.5Leakes Road Rockbank Unit Trust 28.6 (2.5) — — — 26.1 50 13.1 13.0Mirvac 8 Chifley Trust 2 347.7 53.7 — — (22.2) 379.2 50 189.6 173.1Mirvac Green Square Pty Limited 3.1 — — (3.1) — — — — —Mirvac Lend Lease Village Consortium 2.2 — — — (1.7) 0.5 50 0.3 0.4Mirvac (Old Treasury) Trust 2 117.2 4.2 — 23.6 (4.0) 141.0 50 70.5 65.5Mirvac Wholesale Residential Development Partnership Trust 2 125.7 3.1 — (56.8) — 72.0 20 14.4 11.0MVIC Finance 2 0.1 — — — — 0.1 50 0.1 —Tucker Box Hotel Group 278.0 64.8 — — (26.6) 316.2 50 158.1 157.6Walsh Bay Partnership (2.0) (4.3) — 6.3 — — 50 — —
1,235.5 125.5 (21.2) (21.1) (85.2) 1,233.5 597.3 562.2
2014
Ascot Chase Nominee Stages 3-5 Pty Ltd 1 (0.8) (1.9) — — — (2.7) 50 (1.4) —Australian Centre for Life Long Learning 4 14.9 0.3 — — — 15.2 — — —Australian Sustainable Forestry Investors 1 & 2 5 31.7 (13.7) — (12.5) — 5.5 60 3.3 2.3BAC Devco Pty Limited — — — — — — 33 — —BL Developments Pty Limited 2 74.5 0.9 — — — 75.4 50 37.7 30.9City West Property Investments (No. 1 to 6) Trusts 115.2 1.8 — — — 117.0 50 58.5 58.2Domaine Investment Trust (5.2) 5.2 — — — — 50 — —Ephraim Island Joint Venture 7.1 (2.0) — — (4.9) 0.2 50 0.1 —Fast Track Bromelton Pty Limited and Nakheel SPV Pty Limited 2 64.8 0.1 — — — 64.9 50 32.5 27.4FreeSpirit Resorts Pty Limited (4.6) (1.1) — — — (5.7) 25 (1.4) —Googong Township Unit Trust 6 52.0 11.1 — — — 63.1 50 31.6 27.8Green Square Consortium Pty Limited — 0.1 — 3.0 — 3.1 50 1.6 1.5HPAL Freehold Pty Limited 7 15.0 (14.7) — (0.3) — — — — —Infocus Infrastructure Management Pty Limited 1.2 1.2 — — (0.4) 2.0 50 1.0 1.0Leakes Road Rockbank Unit Trust 28.3 0.3 — — — 28.6 50 14.3 14.3Mirvac 8 Chifley Trust 2 84.2 12.9 — 250.6 — 347.7 50 173.9 157.3Mirvac Lend Lease Village Consortium 2.3 (0.1) — — — 2.2 50 1.1 0.9Mirvac (Old Treasury) Trust 2 70.3 3.5 — 45.7 (2.3) 117.2 50 58.6 53.6Mirvac Wholesale Residential Development Partnership Trust 2 120.0 25.0 — (19.3) — 125.7 20 25.1 21.8MVIC Finance 2 Pty Limited 0.1 — — — — 0.1 50 0.1 —Tucker Box Hotel Group 244.1 58.7 — — (24.8) 278.0 50 139.0 138.5Walsh Bay Partnership (0.1) — — (1.9) — (2.0) 50 (1.0) 1.6
915.0 87.6 — 265.3 (32.4) 1,235.5 574.6 537.1
1) The investment is in an asset deficiency position and the Group has taken the amount to its liability on the consolidated SoFP.2) The difference between the carrying amount and the Group’s share in the net assets of its investment is a result of elimination due to the Group’s transactions
with its investment.3) The difference between the carrying amount and the Group’s share in the net assets of its investment is due to the fair value adjustment of the loan not taken
up by the Group.4) The Group disposed of this investment during the year.5) The investment has disposed of its assets and made a part repayment of capital to its investors. The remaining of the capital will be repaid in FY15. The Group
is still holding part of the provision previously made against this investment. As a result, the carrying amount is less than Group’s entitlement to the net asset of the investment.
6) The difference between the carrying amount and the Group’s share in the net assets of its investment is due to a different methodology on allocation of cost of goods sold upon settlements of project lots in the joint venture.
7) This investment was deregistered on 5 September 2013.

MIRVAC GROUP ANNUAL REPORT 2015 69
16 Investments in JVA / continued Distributions Depreciation (Loss)/ Other Total received/ and Income profit compre- compre- receivable Interest amortis- Interest tax for the hensive hensive from joint Summarised consolidated SoCI Revenue income ation expense expense year income income ventures 2015 $m $m $m $m $m $m $m $m $m
Ascot Chase Nominee Stages 3-5 Pty Ltd 16.1 2.0 — 5.7 (1.1) (2.5) — (2.5) —Australian Centre for Life Long Learning — — — — — — (23.6) (23.6) —Australian Sustainabe Forestry Investors 1 & 2 — — — — — — — — 3.2BAC Devco Pty Limited — — — — — — — — —BL Developments Pty Limited 9.4 0.9 — 0.2 — 0.7 — 0.7 11.7City West Property Investments (No. 1 to 6) Trusts 1.9 — — — — 1.7 — 1.7 —Domaine Investment Trust — — — — — — — — —Ephraim Island Joint Venture — — — — — — — — —Fast Track Bromelton Pty Limited and Nakheel SPV Pty Limited 0.1 0.1 — — — — — — —FreeSpirit Resorts Pty Limited 6.3 — — — — (1.8) — (1.8) —Googong Township Unit Trust 50.4 0.2 0.3 2.2 (0.1) 8.4 2.4 10.8 —Harold Park Real Estate Unit Trust 0.3 — — — — (0.4) — (0.4) —Infocus Infrastructure Management Pty Limited 1.7 — — — 0.5 1.1 — 1.1 1.0Leakes Road Rockbank Unit Trust — — — — — (2.6) — (2.6) —Mirvac 8 Chifley Trust 57.8 — — — — 53.7 — 53.7 11.1Mirvac Green Square Pty Limited — — — — — — — — —Mirvac Lend Lease Village Consortium 0.1 0.1 — — — — — — —Mirvac (Old Treasury) Trust 4.2 3.4 — — — 4.2 — 4.2 1.9Mirvac Wholesale Residential Development Partnership Trust 73.9 0.4 — 6.2 — 1.8 — 1.8 —Tucker Box Hotel Group 74.1 0.1 — 8.0 0.1 64.0 — 64.0 13.3Walsh Bay Partnership — — — — — (0.7) — (0.7) —
296.3 7.2 0.3 22.3 (0.6) 127.6 (21.2) 106.4 42.2
2014
Ascot Chase Nominee Stages 3-5 Pty Ltd 25.5 3.5 — 7.1 (0.8) (1.9) — (1.9) —Australian Centre for Life Long Learning 0.3 — — — — 0.2 — 0.2 —Australian Sustainable Forestry Investors 1 & 2 2.1 0.1 — 1.2 — 0.2 — 0.2 —BAC Devco Pty Limited — — — — — — — — —BL Developments Pty Limited 13.5 0.6 — 0.2 — (0.5) — (0.5) —City West Property Investments (No. 1 to 6) Trusts 1.6 — — — — 1.4 — 1.4 —Domaine Investment Trust — — — — — — — — —Ephraim Island Joint Venture 8.4 — — (0.6) — (2.0) — (2.0) 2.4Fast Track Bromelton Pty Limited and Nakheel SPV Pty Limited 0.1 0.1 — — — 0.1 — 0.1 —FreeSpirit Resorts Pty Limited 10.2 — — — — (0.7) — (0.7) —Googong Township Unit Trust 72.8 0.2 0.1 0.6 — 11.1 — 11.1 —Green Square Consortium Pty Limited (1.4) 0.1 — — — — — — —HPAL Freehold Pty Limited — — — — — — — — —Infocus Infrastructure Management Pty Limited 1.7 — — — 0.5 1.2 — 1.2 0.2Leakes Road Rockbank Unit Trust — — — 0.3 — 0.4 — 0.4 —Mirvac 8 Chifley Trust 32.7 — — 16.7 — 12.8 — 12.8 —Mirvac Lend Lease Village Consortium 0.1 — — — — 0.1 — 0.1 —Mirvac (Old Treasury) Trust 3.5 3.0 — — — 3.5 — 3.5 1.2Mirvac Wholesale Residential Development Partnership Trust 251.4 0.5 — 21.0 — 25.0 — 25.0 —MVIC Finance 2 Pty Limited — — — — — — — — —Tucker Box Hotel Group 68.5 0.1 — 10.0 0.1 58.6 — 58.6 12.4Walsh Bay Partnership — — — — — — — — —
491.0 8.2 0.1 56.5 (0.2) 109.5 — 109.5 16.2

MIRVAC GROUP ANNUAL REPORT 201570
Notes to the consolidated financial statements
16 Investments in JVA / continuedd) Reconciliation of the carrying amount of investments in JVAi) Associates 2015 2014 $m $m
Movements in carrying amountBalance 1 July 0.5 0.5Distributions received/receivable — (1.7)Share of profit from ordinary operating activities (0.5) 1.2Other — 0.5
Balance 30 June — 0.5
ii) Joint ventures 2015 2014 $m $m
Movements in carrying amountBalance 1 July 537.1 379.4Equity acquired 15.2 151.3Repayment of capital (11.8) (11.4)Distributions received/receivable (42.2) (16.2)Deferred revenue eliminated — (12.3)Share of profit from ordinary operating activities 68.5 45.7Transfers to investment in controlled entities (1.5) —Other (3.1) 0.6
Balance 30 June 562.2 537.1
e) Investment in associates accounted for at fair value Interest 2015 2014 2015 2014 Name of entity Principal activities % % $m $m
JF Infrastructure Yield Fund Infrastructure 22 22 11.3 11.8
For information about the methods and assumptions used in determining the fair value of other financial assets at fair value through profit or loss, refer to note 15.
f) Impairment of investmentsIn the year ended 30 June 2015, there was no impairment provision taken against the carrying value of the investments in JVA (2014: $nil). Investments in JVA are reviewed at the end of each reporting period for any impairment and written off to the extent that the future benefits are no longer probable and do not support the carrying value of the investment.
g) Investments in unconsolidated structured entitiesMirvac is not contractually obliged to provide financial support to its unconsolidated structured entities.
Mirvac invests in a number of funds and trusts. These investments are open-end and closed-end investment funds and trusts which invest in infrastructure and industrial real estate for the purpose of capital appreciation and/or to earn investment income. The investees finance their operations through borrowings and through equity issues. Material unconsolidated structured entities include the following:
— JF Infrastructure Yield Fund; and
— ASFI.
As Mirvac does not provide financial support, the exposure of Mirvac is equal to the carrying value being $11.4m (2014: $14.6m).

MIRVAC GROUP ANNUAL REPORT 2015 71
17 Controlled entities and deed of cross guaranteeThe consolidated financial statements incorporate the assets, liabilities and results of the following controlled entities in accordance with the accounting policy described in note 30(a):
Country of Equity holding establishment/ Class of 2015 2014 Name of entity incorporation units/shares % %
a) Interests in controlled entities of Mirvac107 Mount Street Head Trust Australia Units 100 100107 Mount Street Sub Trust Australia Units 100 100197 Salmon Street Pty Limited 1 Australia Ordinary 100 100A.C.N. 087 773 859 Pty Limited 1 Australia Ordinary 100 100A.C.N. 110 698 603 Pty Limited 1 Australia Ordinary 100 100A.C.N. 150 521 583 Pty Limited 1 Australia Ordinary 100 100A.C.N. 165 515 515 Pty Limited 1 Australia Ordinary 100 100Banksia Unit Trust Australia Units 100 100CN Collins Pty Limited 1 Australia Ordinary 100 100Domaine Investments Management Pty Limited Australia Ordinary 50 50Fast Track Bromelton Pty Limited 1 Australia Ordinary 100 100Ford Mirvac Unit Trust Australia Units 100 100Fyfe Road Pty Limited 1 Australia Ordinary 100 100Gainsborough Greens Pty Limited 1 Australia Ordinary 100 100Hexham Project Pty Limited 1 Australia Ordinary 100 100HIR Boardwalk Tavern Pty Limited 1 Australia Ordinary 100 100HIR Golf Club Pty Limited 1 Australia Ordinary 100 100HIR Golf Course Pty Limited 1 Australia Ordinary 100 100HIR Property Management Holdings Pty Limited 1 Australia Ordinary 100 100HIR Tavern Freehold Pty Limited 1 Australia Ordinary 100 100Hoxton Park Airport Limited 1 Australia Ordinary 100 100HPAL Holdings Pty Limited 1 Australia Ordinary 100 100Industrial Commercial Property Solutions (Constructions) Pty Limited 1 Australia Ordinary 100 100Industrial Commercial Property Solutions (Finance) Pty Limited 1 Australia Ordinary 100 100Industrial Commercial Property Solutions (Holdings) Pty Limited 1 Australia Ordinary 100 100Industrial Commercial Property Solutions (Queensland) Pty Limited 1 Australia Ordinary 100 100Industrial Commercial Property Solutions Pty Limited 1 Australia Ordinary 100 100JF ASIF Pty Limited 1 Australia Ordinary 100 100Magenta Shores Finance Pty Limited 1 Australia Ordinary 100 100Magenta Shores Unit Trust Australia Units 100 100Magenta Unit Trust Australia Units 100 100MFM US Real Estate Inc United States Ordinary 100 100MGR US Real Estate Inc United States Ordinary 100 100Mirvac (Beacon Cove) Pty Limited 1 Australia Ordinary 100 100Mirvac (Docklands) Pty Limited 1 Australia Ordinary 100 100Mirvac (Old Treasury Development Manager) Pty Limited 1 Australia Ordinary 100 100Mirvac (Old Treasury) Pty Limited Australia Ordinary 50 50Mirvac (Old Treasury Hotel) Pty Limited 1 Australia Ordinary 100 100Mirvac (WA) Pty Limited 1 Australia Ordinary 100 100Mirvac (Walsh Bay) Pty Limited 1 Australia Ordinary 100 100Mirvac 8 Chifley Pty Limited Australia Ordinary 50 50Mirvac Advisory Pty Limited 1 Australia Ordinary 100 100Mirvac Aero Company Pty Limited 1 Australia Ordinary 100 100Mirvac AOP SPV Pty Limited 1 Australia Ordinary 100 100Mirvac Blue Trust Australia Units 100 100Mirvac Birkenhead Point Marina Pty Limited 1,2 Australia Ordinary 100 —Mirvac Capital Investments Pty Limited 1 Australia Ordinary 100 100Mirvac Capital Office Pty Limited 1 Australia Ordinary 100 100Mirvac Capital Partners Limited 3 Australia Ordinary 100 100Mirvac Capital Partners Investment Management Pty Limited 1 Australia Ordinary 100 100Mirvac Capital Pty Limited 1 Australia Ordinary 100 100Mirvac Chifley Holdings Pty Limited Australia Ordinary 100 100Mirvac Commercial Funding Pty Limited 1 Australia Ordinary 100 100Mirvac Commercial Sub SPV Pty Limited 1 Australia Ordinary 100 100Mirvac Constructions (Homes) Pty Limited 1 Australia Ordinary 100 100Mirvac Constructions (QLD) Pty Limited 1 Australia Ordinary 100 100

MIRVAC GROUP ANNUAL REPORT 201572
Notes to the consolidated financial statements
17 Controlled entities and deed of cross guarantee / continued Country of Equity holding establishment/ Class of 2015 2014 Name of entity incorporation units/shares % %
Mirvac Constructions (SA) Pty Limited 1 Australia Ordinary 100 100Mirvac Constructions (VIC) Pty Limited 1 Australia Ordinary 100 100Mirvac Constructions (WA) Pty Limited 1 Australia Ordinary 100 100Mirvac Constructions Pty Limited 1 Australia Ordinary 100 100Mirvac Design Pty Limited 1 Australia Ordinary 100 100Mirvac Developments Pty Limited 1 Australia Ordinary 100 100Mirvac Doncaster Pty Limited 1 Australia Ordinary 100 100Mirvac Elderslie Pty Limited 1 Australia Ordinary 100 100Mirvac ESAT Pty Limited 1 Australia Ordinary 100 100Mirvac Finance Limited 1 Australia Ordinary 100 100Mirvac Funds Limited 3 Australia Ordinary 100 100Mirvac Funds Management Limited 3 Australia Ordinary 100 100Mirvac George Street Holdings Pty Limited 1 Australia Ordinary 100 100Mirvac George Street Pty Limited 1 Australia Ordinary 100 100Mirvac Green Square Pty Limited 4 Australia Ordinary 100 50Mirvac Green Trust Australia Units 100 100Mirvac Group Finance Limited 1 Australia Ordinary 100 100Mirvac Group Funding Limited 1 Australia Ordinary 100 100Mirvac Harbourtown Pty Limited 1 Australia Ordinary 100 100Mirvac Harold Park Pty Limited 1 Australia Ordinary 100 100Mirvac Harold Park Trust Australia Units 100 100Mirvac Holdings (WA) Pty Limited 1 Australia Ordinary 100 100Mirvac Holdings Limited 1 Australia Ordinary 100 100Mirvac Home Builders (VIC) Pty Limited 1 Australia Ordinary 100 100Mirvac Homes (NSW) Pty Limited 1 Australia Ordinary 100 100Mirvac Homes (QLD) Pty Limited 1 Australia Ordinary 100 100Mirvac Homes (SA) Pty Limited 1 Australia Ordinary 100 100Mirvac Homes (VIC) Pty Limited 1 Australia Ordinary 100 100Mirvac Homes (WA) Pty Limited 1 Australia Ordinary 100 100Mirvac Hotel Services Pty Limited 1 Australia Ordinary 100 100Mirvac ID (Bromelton) Pty Limited 1 Australia Ordinary 100 100Mirvac ID (Bromelton) Sponsor Pty Limited 1 Australia Ordinary 100 100Mirvac Industrial Developments Pty Limited 1 Australia Ordinary 100 100Mirvac International (Middle East) No. 2 Pty Limited 1 Australia Ordinary 100 100Mirvac International (Middle East) No. 3 Pty Limited 1 Australia Ordinary 100 100Mirvac International Investments Limited 1 Australia Ordinary 100 100Mirvac International No. 3 Pty Limited 1 Australia Ordinary 100 100Mirvac JV’s Pty Limited 1 Australia Ordinary 100 100Mirvac Kent Street Holdings Pty Limited 1 Australia Ordinary 100 100Mirvac Mandurah Pty Limited 1 Australia Ordinary 100 100Mirvac National Developments Pty Limited 1 Australia Ordinary 100 100Mirvac Newcastle Pty Limited 1 Australia Ordinary 100 100Mirvac Old Treasury Holdings Pty Limited 1 Australia Ordinary 100 100Mirvac Pacific Pty Limited 1 Australia Ordinary 100 100Mirvac Parking Pty Limited 1 Australia Ordinary 100 100Mirvac Parklea Pty Limited 1 Australia Ordinary 100 100Mirvac Precinct 2 Pty Limited 1 Australia Ordinary 100 100Mirvac Procurement Pty Limited 1 Australia Ordinary 100 100Mirvac Projects Dalley Street Pty Limited 1 Australia Ordinary 100 100Mirvac Projects Dalley Street Trust Australia Units 100 100Mirvac Projects George Street Pty Limited 1 Australia Ordinary 100 100Mirvac Projects George Street Trust Australia Units 100 100Mirvac Projects No. 2 Pty Limited 1 Australia Ordinary 100 100Mirvac Projects Norwest Trust 2 Australia Units 100 —Mirvac Projects Norwest No. 2 Trust 2 Australia Units 100 —Mirvac Projects Pty Limited 1 Australia Ordinary 100 100Mirvac Projects (Retail and Commercial) Pty Ltd 1,5 Australia Ordinary 100 100Mirvac Projects Trust 2 Australia Units 100 —Mirvac Properties Pty Limited 1 Australia Ordinary 100 100

MIRVAC GROUP ANNUAL REPORT 2015 73
17 Controlled entities and deed of cross guarantee / continued Country of Equity holding establishment/ Class of 2015 2014 Name of entity incorporation units/shares % %
Mirvac Property Advisory Services Pty Limited 1 Australia Ordinary 100 100Mirvac Property Services Pty Limited 1 Australia Ordinary 100 100Mirvac Queensland Pty Limited 1 Australia Ordinary 100 100Mirvac Real Estate Debt Funds Pty Limited 1 Australia Ordinary 100 100Mirvac Real Estate Pty Limited 1 Australia Ordinary 100 100Mirvac REIT Management Limited 3 Australia Ordinary 100 100Mirvac Retail Head SPV Pty Limited 1 Australia Ordinary 100 100Mirvac Retail Sub SPV Pty Limited 1 Australia Ordinary 100 100Mirvac Rockbank Pty Limited 1 Australia Ordinary 100 100Mirvac Services Pty Limited 1 Australia Ordinary 100 100Mirvac St Leonards Pty Limited 2 Australia Ordinary 100 —Mirvac St Leonards Trust 2 Australia Units 100 —Mirvac South Australia Pty Limited 1 Australia Ordinary 100 100Mirvac Spare Pty Limited 1 Australia Ordinary 100 100Mirvac Spring Farm Limited 1 Australia Ordinary 100 100Mirvac SPV 1 Pty Limited 1 Australia Ordinary 100 100Mirvac Trademarks Pty Limited 1 Australia Ordinary 100 100Mirvac Treasury Limited 1 Australia Ordinary 100 100Mirvac Treasury No. 3 Limited 1 Australia Ordinary 100 100Mirvac Victoria Pty Limited 1 Australia Ordinary 100 100Mirvac Waterloo Pty Limited 1 Australia Ordinary 100 100Mirvac Wholesale Funds Management Limited 1 Australia Ordinary 100 100Mirvac Wholesale Industrial Developments Limited 1 Australia Ordinary 100 100Mirvac Woolloomooloo Pty Limited 1 Australia Ordinary 100 100MRV Hillsdale Pty Limited 1 Australia Ordinary 100 100MWID (Brendale) Pty Limited 1 Australia Ordinary 100 100MWID (Brendale) Unit Trust Australia Units 100 100MWID (Mackay) Pty Limited 1 Australia Ordinary 100 100Newington Homes Pty Limited 1 Australia Ordinary 100 100Oakstand No. 15 Hercules Street Pty Limited 1 Australia Ordinary 100 100Pigface Unit Trust Australia Units 100 100Planned Retirement Living Pty Limited 1 Australia Ordinary 100 100Rovno Pty Limited Australia Ordinary 100 100Spring Farm Finance Pty Limited 1 Australia Ordinary 100 100Springfield Development Company Pty Limited 1 Australia Ordinary 100 100SPV Magenta Pty Limited 1 Australia Ordinary 100 100Suntrack Holdings Pty Limited Australia Ordinary 100 100Suntrack Property Trust Australia Units 100 100Taree Shopping Centre Pty Limited Australia Ordinary 100 100TMT Finance Pty Limited1 Australia Ordinary 100 100Tucker Box Management Pty Limited 1 Australia Ordinary 100 100
b) Interests in controlled entities of MPT10-20 Bond Street Trust Australia Units 100 1001900-2000 Pratt Inc. United States Ordinary 100 100197 Salmon Street Trust Australia Units 100 100275 Kent Street Holding Trust Australia Units 100 100367 Collins Street Trust Australia Units 100 100367 Collins Street No. 2 Trust Australia Units 100 100380 St Kilda Road Trust 6 Australia Units 100 100477 Collins Street No. 1 Trust Australia Units 100 100477 Collins Street No. 2 Trust Australia Units 100 100Australian Office Partnership Trust Australia Units 100 100Cannon Hill Office Trust 7 Australia Units — 100Chifley Holding Trust Australia Units 100 100George Street Holding Trust Australia Units 100 100James Fielding Trust Australia Units 100 100JF Infrastruture — Sustainable Equity Fund Australia Units 100 100JFIF Victorian Trust Australia Units 100 100JFM Hotel Trust Australia Units 100 100

MIRVAC GROUP ANNUAL REPORT 201574
Notes to the consolidated financial statements
17 Controlled entities and deed of cross guarantee / continued Country of Equity holding establishment/ Class of 2015 2014 Name of entity incorporation units/shares % %
Meridian Investment Trust No. 1 Australia Units 100 100Meridian Investment Trust No. 2 Australia Units 100 100Meridian Investment Trust No. 3 Australia Units 100 100Meridian Investment Trust No. 4 Australia Units 100 100Meridian Investment Trust No. 5 Australia Units 100 100Meridian Investment Trust No. 6 Australia Units 100 100Mirvac 210 George Street Trust 8 Australia Units — 100Mirvac 220 George Street Trust 8 Australia Units — 100Mirvac 90 Collins Street Trust Australia Units 100 100Mirvac Allendale Square Trust Australia Units 100 100Mirvac Bourke Street No.1 Sub-Trust Australia Units 100 100Mirvac Bourke Street No.2 Sub-Trust Australia Units 100 100Mirvac Broadway Sub-Trust Australia Units 100 100Mirvac Capital Partners 1 Trust Australia Units 100 100Mirvac Collins Street Trust No.1 Sub-Trust Australia Units 100 100Mirvac Collins Street Trust No.2 Sub-Trust Australia Units 100 100Mirvac Commercial Trust Australia Units 100 100Mirvac Commercial No.1 Sub Trust 9 Australia Units — 100Mirvac Commercial No.3 Sub Trust Australia Units 100 100Mirvac Funds Finance Pty Limited Australia Ordinary 100 100Mirvac Funds Loan Note Pty Limited Australia Ordinary 100 100Mirvac Glasshouse Sub-Trust Australia Units 100 100Mirvac Group Funding No.2 Limited Australia Ordinary 100 100Mirvac Group Funding No.3 Pty Limited Australia Ordinary 100 100Mirvac Harbourside Sub Trust Australia Units 100 100Mirvac Industrial Fund Australia Units 100 100Mirvac Industrial No. 1 Sub Trust Australia Units 100 100Mirvac Industrial No. 2 Sub Trust Australia Units 100 100Mirvac Office Trust 7 Australia Units — 100Mirvac Pitt Street Trust Australia Units 100 100Mirvac Property Trust No.3 2 Australia Units 100 —Mirvac Property Trust No.4 2 Australia Units 100 —Mirvac Property Trust No.5 2 Australia Units 100 —Mirvac Property Trust No.6 2 Australia Units 100 —Mirvac Property Trust No.7 2 Australia Units 100 —Mirvac Real Estate Investment Trust Australia Units 100 100Mirvac Retail Head Trust Australia Units 100 100Mirvac Retail Sub-Trust No. 1 Australia Units 100 100Mirvac Retail Sub-Trust No. 2 Australia Units 100 100Mirvac Retail Sub-Trust No. 3 2 Australia Units 100 —Mirvac Retail Sub-Trust No. 4 2 Australia Units 100 —Mirvac Rhodes Sub-Trust Australia Units 100 100Old Treasury Holding Trust Australia Units 100 100Pennant Hills Office Trust Australia Units 100 100Springfield Regional Shopping Centre Trust Australia Units 100 100The George Street Trust Australia Units 100 100The Mulgrave Trust Australia Units 100 100WOT CMBS Pty Ltd 7 Australia Ordinary — 100WOT Holding Trust 7 Australia Units — 100WOT Loan Note Pty Ltd 7 Australia Ordinary — 100WOW Office Trust 7 Australia Units — 100
1) These subsidiaries have been granted relief as at 30 June 2015 from the necessity to prepare financial reports in accordance with Class Order 98/1418 issued by ASIC.
2) These entities were established/registered during the year ended 30 June 2015.3) These entities are included in the deed of cross guarantee; however, they are still required to lodge separate financial statements.4) Previously registered as Green Square Consortium Pty Limited. The remaining 50 per cent was acquired by Mirvac on 11 August 2014 and this entity is now
a controlled entity.5) Previously registered as A.C.N. 151 466 241 Pty Ltd.6) One unit on issue held by Mirvac Limited as custodian for MPT.7) These entities were deregistered/wound up during the year ended 30 June 2015.8) On 22 June 2015, 100 per cent of the units in these trusts were sold to an external party.9) On 30 April 2014, 100 per cent of the units in this trust were exchanged for sale. Settlement occurred on 1 July 2014.

MIRVAC GROUP ANNUAL REPORT 2015 75
17 Controlled entities and deed of cross guarantee / continuedc) Entities subject to class orderCertain wholly-owned companies incorporated in Australia are permitted to be parties to a deed of cross guarantee under which each company guarantees the debts of the others. By entering into the deed, the wholly-owned companies can be relieved from the requirements among other things to prepare a financial report and directors’ report under Class Order 98/1418 (as amended) issued by ASIC. The entities included at 30 June 2015 are listed in note 17(a). Companies identified in note 17(a) as being included in the Class Order are a “closed group” for the purpose of the Class Order, and as there are no other parties to the deed of cross guarantee that are controlled by the parent entity, they also represent the “extended closed group”. As a condition of the Class Order, the companies have entered into a deed of cross guarantee. The effect of the deed is that Mirvac Limited has guaranteed to pay any deficiency in the event of winding up of a company in the closed group. The companies in the closed group also have given a similar guarantee in the event that Mirvac Limited is wound up. The consolidated SoCI, a summary of movements in consolidated retained earnings and the consolidated SoFP for the year ended 30 June 2015 of the entities which are members of the closed group are as follows:
2015 2014 Consolidated SoCI $m $m
Revenue from continuing operationsInvestment properties rental revenue 19.7 16.4Investment management fee revenue 35.7 33.1Development and construction revenue 694.9 1,269.6Development management fee revenue 13.5 15.9Interest revenue 70.7 42.9Other revenue 8.2 7.2
Total revenue from continuing operations 842.7 1,385.1
Other incomeNet gain on fair value of investment properties 15.1 7.5Share of net profit of JVA accounted for using the equity method 7.3 9.4Gain on fair value of derivative financial instruments 187.6 7.3Foreign exchange gain — 7.2Net gain on sale of investment properties 43.8 0.3
Total other income 253.8 31.7
Total revenue from continuing operations and other income 1,096.5 1,416.8
Net loss on sale of investment properties 0.2 —Net loss on sale of PPE 0.3 0.2Foreign exchange loss 178.6 —Investment properties expenses 6.7 4.9Cost of property development and construction 585.7 1,038.0Employee benefits expenses 119.8 104.5Depreciation and amortisation expenses 4.7 4.5Impairment of loans, investments and inventories (0.1) (1.2)Finance costs 109.4 112.4Loss on fair value of derivative financial instruments 8.8 25.5Selling and marketing expenses 35.0 24.4Other expenses 61.3 53.9
(Loss)/profit from continuing operations before income tax (13.9) 49.7Income tax expense (18.1) (22.7)
(Loss)/profit for the year (32.0) 27.0
2015 2014 Summary of movements in consolidated retained earnings $m $m
Movements in retained earningsBalance 1 July (1,372.7) (1,402.8)(Loss)/profit for the year (32.0) 27.0SBP 1.5 (1.5)Retained loss from subsidiaries joining the group (60.1) —Transfer in from reserves — 4.6
Balance 30 June (1,463.3) (1,372.7)

MIRVAC GROUP ANNUAL REPORT 201576
Notes to the consolidated financial statements
17 Controlled entities and deed of cross guarantee / continued 2015 2014 Consolidated SoFP Note $m $m
Current assetsCash and cash equivalents 18.6 86.2Receivables 756.7 388.6Derivative financial assets — 9.2Inventories 651.3 437.8Other financial assets — 52.0Other assets 13.7 14.9
Total current assets 1,440.3 988.7
Non-current assetsReceivables 1,090.2 1,440.3Inventories 651.5 620.8Investments accounted for using the equity method 169.2 189.7Derivative financial assets 175.9 11.3Other financial assets 307.9 317.2Investment properties 137.9 114.1PPE 17.5 10.0Intangible assets 2.6 2.6Deferred tax assets 398.8 343.7
Total non-current assets 2,951.5 3,049.7
Total assets 4,391.8 4,038.4
Current liabilitiesPayables 712.1 450.0Borrowings 0.2 2.9Derivative financial liabilities 12.4 13.0Provisions 20.3 8.3Other liabilities 0.2 0.2
Total current liabilities 745.2 474.4
Non-current liabilitiesPayables 96.8 109.1Borrowings 2,633.7 2,500.6Derivative financial liabilities 76.0 98.7Deferred tax liabilities 201.0 144.3Provisions 17.1 3.5
Total non-current liabilities 3,024.6 2,856.2
Total liabilities 3,769.8 3,330.6
Net assets 622.0 707.8
EquityContributed equity 19(a) 2,071.9 2,070.8Reserves 13.4 9.7Retained earnings (1,463.3) (1,372.7)
Total equity 622.0 707.8

MIRVAC GROUP ANNUAL REPORT 2015 77
18 Parent entity financial informationa) Summary financial informationThe individual financial statements for the parent entity show the following aggregate amounts: 2015 2014 Note $m $m
SoFPCurrent assets 4,209.3 3,651.5Total assets 4,567.3 4,012.5Current liabilities 2,478.7 1,925.5Total liabilities 2,478.9 1,925.9
EquityContributed equity 19(a) 2,071.9 2,070.8Reserves— Capital reserve (0.2) (0.2)— SBP reserve 15.7 15.3Retained earnings 1.0 0.7
Total equity 2,088.4 2,086.6
Profit/(loss) for the year 1.5 (0.5)
Total comprehensive income for the year 1.5 (0.5)
b) Guarantees entered into by the parent entityThe parent entity is party to a deed of cross guarantee, with members of the closed group. Further details are disclosed in note 17(c).
c) Contingent liabilities of the parent entityThe parent entity did not have any other contingent liabilities other than the item referred to in note 18(b) at 30 June 2015 or 30 June 2014.
d) Contractual commitments for the acquisition of PPEThe parent entity did not have any contractual commitments for the acquisition of PPE at 30 June 2015 or 30 June 2014.
EQUITY19 Contributed equitya) Paid up equity 2015 2014 Securities Securities 2015 2014 m m $m $m
Mirvac Limited — ordinary shares issued 3,694.3 3,688.5 2,071.9 2,070.8MPT — ordinary units issued 3,694.3 3,688.5 4,732.4 4,726.0
Total contributed equity 6,804.3 6,796.8
b) Movements in paid up equityMovements in paid up equity of Mirvac for the year ended 30 June 2015 and 30 June 2014 were as follows: Securities Note m $m
Balance 1 July 2014 3,688.5 6,796.8EEP securities issued 23 March 2015 $2.01 19(c) 0.4 0.8LTP, LTIP and EIS securities converted, sold, vested or forfeited 19(c) 5.4 6.7
Balance 30 June 2015 3,694.3 6,804.3
Balance 1 July 2013 3,659.9 6,745.3DRP securities issued 27 February 2014 $1.71 19(f) 26.9 46.0EEP securities issued 20 March 2014 $1.72 19(c) 0.4 0.7LTP, LTIP and EIS securities converted, sold, vested or forfeited 19(c) 1.3 5.3Less: Transaction costs arising on issues of securities — (0.5)
Balance 30 June 2014 3,688.5 6,796.8
Ordinary securitiesAll ordinary securities were fully paid at 30 June 2015. Ordinary securities entitle the holder to participate in dividends/distributions and the proceeds on winding up of Mirvac in proportion to the number of and amount paid on the securities held. On a show of hands, every holder of ordinary securities present at a meeting in person or by proxy, is entitled to one vote, and upon a poll each security is entitled to one vote.

MIRVAC GROUP ANNUAL REPORT 201578
Notes to the consolidated financial statements
19 Contributed equity / continuedc) LTP, LTIP, EIS and EEP issuesi) Current LTPAt 30 June 2015, 26.6m (2014: 23.4m) performance rights and nil (2014: nil) options were issued to participants under the plan. The number of issued rights and options is net of adjustments due to forfeiture of rights and options as a result of termination of employment. During the year, 4.9m performance rights (2014: nil) and no options (2014: nil) vested.
ii) EEPAt 30 June 2015, 6.2m (2014: 5.8m) stapled securities have been issued to employees under the EEP.
iii) Superseded LTI and EIS plansDuring the year, no securities were issued to employees of Mirvac Limited and its controlled entities under the superseded LTI plan and EIS (2014: nil). The total number of stapled securities issued to employees under the superseded LTI and EIS at 30 June 2015 was 3.3m (2014: 3.8m). The market price per ordinary stapled security at 30 June 2015 was $1.85 (2014: $1.79). Securities issued as part of the superseded LTI plan and EIS are not classified as ordinary securities, until such time as the vesting conditions are satisfied, employee loans are fully repaid or the employee leaves Mirvac.
d) Reconciliation of securities issued on the ASXUnder AAS, securities issued under the Mirvac employee LTI plan and EIS are required to be accounted for as an option and are excluded from total issued equity, until such time as the relevant employee loans are fully repaid or the employee leaves the Group. Total ordinary securities issued as detailed above is reconciled to securities issued on the ASX as follows:
2015 2014 Securities Securities m m
Total ordinary securities disclosed 3,694.3 3,688.5Securities issued under LTI plan and EIS 3.3 3.8
Total securities issued on the ASX 3,697.6 3,692.3
e) Employee share schemeInformation relating to the employee share scheme, including details of shares issued under the scheme, is set out in note 25.
f) Dividend reinvestment planUnder the DRP, holders of stapled securities may elect to have all or part of their distribution entitlements satisfied by the issue of new stapled securities rather than being paid in cash. Stapled securities issued under the plan were issued at a price calculated on a volume weighted average market price basis over the 15 business days commencing on the second business day post record date.
g) Capital risk managementRefer to note 14 for details of Mirvac’s capital risk management.
20 Reservesa) Reserves 2015 2014 $m $m
ARR 68.5 59.0Capital reserve (1.5) (1.5)Foreign currency translation reserve 4.2 (3.5)SBP reserve 15.7 15.3NCI reserve 7.6 7.6
94.5 76.9

MIRVAC GROUP ANNUAL REPORT 2015 79
20 Reserves / continuedb) Movements in reserves 2015 2014 Note $m $m
ARRBalance 1 July 59.0 65.8Increment/(decrement) on revaluation of OOP 20(d) 9.5 (4.8)Transfers out to retained earnings 21 — (2.0)
Balance 30 June 68.5 59.0
Capital reserveBalance 1 July (1.5) (0.3)Transfers out to retained earnings 21 — (1.2)
Balance 30 June (1.5) (1.5)
Foreign currency translation reserveBalance 1 July (3.5) (3.8)Increase in reserve due to translation of foreign operations 9.1 3.4Deferred tax 4(h) (1.4) 0.1Transfers due to deconsolidation of entity — (3.2)
Balance 30 June 4.2 (3.5)
SBP reserveBalance 1 July 15.3 10.5Expense relating to SBP 0.4 4.4Deferred tax 4(g) — 0.4
Balance 30 June 15.7 15.3
NCI reserveBalance 1 July 7.6 7.6
Balance 30 June 7.6 7.6
c) Nature and purpose of reservesi) ARRThe ARR is used to record increments and decrements on the revaluation of OOP. However, any decrement in excess of previous increments is expensed to the consolidated SoCI.
ii) Capital reserveThe capital reserve was prior to the introduction of IFRS, and used to record the net revaluation increment or decrement on disposal of investment properties. The balance of the reserve may be transferred to retained earnings and used to satisfy distributions to securityholders.
iii) Foreign currency translation reserveExchange differences arising on translation of the foreign controlled operations of the Group are taken to the foreign currency translation reserve, as described in note 30(c).
iv) SBP reserveThe SBP reserve is used to recognise the fair value of securities issued under LTI plans, securities issued under the EEP and any deficit resulting from the sale of securities under LTI plans.
v) NCI reserveTransactions with NCI that do not result in a loss of control are accounted for through equity. The NCI reserve is used to record the difference between the fair value of the NCI acquired or disposed and any consideration paid/received.
d) Reconciliation of movements between PPE to ARR 2015 2014 Note $m $m
Revaluation (increment)/decrement within PPE 8 (11.8) 2.2Items adjusted to consolidated SoCIItems relating to OOP including fitout and lease amortisation 2.3 2.6
Balance transferred to ARR (9.5) 4.8Items adjusted directly to reservesTransfers out to retained earnings 21 — 2.0
Movements in ARR (9.5) 6.8

MIRVAC GROUP ANNUAL REPORT 201580
Notes to the consolidated financial statements
21 Retained earnings 2015 2014 Note $m $m
Balance 1 July (697.6) (814.3)Profit for the year attributable to the stapled securityholders of Mirvac 609.9 447.3Items in other comprehensive income recognised in directly in retained earnings— Movements in security based compensation (1.4) (1.5)— Transfers due to deconsolidation of entity — (1.2)— Transfers in from capital reserve 20(b) — 1.2— Transfers in from ARR due to retiring of OOP 20(b) — 2.0Dividends/distributions provided for or paid 22 (347.6) (331.1)
Balance 30 June (436.7) (697.6)
22 Dividends/distributions 2015 2014 Ordinary stapled securities $m $m
Half yearly ordinary distributions paid/payable as follows:4.50 CPSS paid on 26 February 2015 (unfranked distribution) 166.4 —4.40 CPSS paid on 27 February 2014 (unfranked distribution) — 161.34.90 CPSS payable on 26 August 2015 (unfranked distribution) 181.2 —4.60 CPSS paid on 28 August 2014 (unfranked distribution) — 169.8
Total dividend/distribution 9.40 (2014: 9.00) CPSS 347.6 331.1
The DRP was activated for the 31 December 2013 half yearly distribution but was deactivated for the 30 June 2014 half yearly distribution and remains inactive. Distributions paid and payable in cash or satisfied by the issue of stapled securities under the Group’s DRP are as follows:
2015 2014 $m $m
Paid/payable in cash 347.6 285.1Satisfied by the issue of stapled securities — 46.0
347.6 331.1
Franking credits available for subsequent years based on a tax rate of 30 per cent total $21.2m (2014: $15.8m on a tax rate of 30 per cent).
OTHER INFORMATION23 Contingent liabilitiesa) Contingent liabilitiesThe Group had contingent liabilities at 30 June 2015 in respect of the following:
2015 2014 $m $m
Bank guarantees and performance bonds issued by external parties in respect of certain performance obligations granted in the normal course of business. 127.4 155.1
The Group has provided guarantees to third parties in respect of the performance of entities within the Group. No material losses are anticipated in respect of these contractual obligations. — 1.2
Claims for damages in respect of injury sustained due to health and safety issues have been made during the year. The potential effect of these claims indicated by legal advice is that if the claims were to be successful against the Group, they would result in a liability. 1.2 1.0
As part of the ordinary course of business of the Group, disputes can arise with suppliers, customers and other third parties. Where there is a present obligation, a liability is recognised. Where there is a possible obligation, which will only be determined by a future event and it is not considered probable that a liability will arise, they are disclosed as a contingent liability. Where the possible obligation is remote, no disclosure is given. The Group does not provide details of these as to do so may prejudice the Group’s position.
b) GuaranteesFor information about guarantees given by entities within the Group, including the parent entity, refer to notes 17 and 18.
c) JVAThere are no contingent liabilities relating to JVA.

MIRVAC GROUP ANNUAL REPORT 2015 81
24 Commitmentsa) Capital commitments 2015 2014 $m $m
Investment propertiesNot later than one year 81.0 66.5Later than one year but not later than five years — —Later than five years — —
81.0 66.5
PPENot later than one year — —Later than one year but not later than five years — —Later than five years — —
— —
b) Lease commitments 2015 2014 $m $m
Operating lease receivable 1
Future minimum rental revenues under non-cancellable operating property leases, are as follows:Not later than one year 488.9 451.6Later than one year but not later than five years 1,446.3 1,500.6Later than five years 1,191.1 913.3
3,126.3 2,865.5
1) Excludes storeroom licences, signage, telecommunications percentage and sundry income.
Operating lease payableCommitments in relation to non-cancellable operating leases contracted for at the reporting date but not recognised as liabilities, are payable as follows:Not later than one year 10.0 9.9Later than one year but not later than five years 7.2 9.8Later than five years 0.6 1.8
17.8 21.5
Finance leasesCommitments in relation to finance leases are payable as follows:Not later than one year 0.2 3.0Later than one year but not later than five years 0.1 0.2Later than five years — —Residual — —
Minimum lease payments 0.3 3.2Less: Future finance charges — (0.1)
Lease liabilities 0.3 3.1
Mirvac leases various plant and equipment with a carrying value of $0.1m (2014: $0.3m) under finance leases expiring in less than five years.
25 Employee benefitsa) Employee benefits and related on-cost liabilities 2015 2014 Provision for employee benefits $m $m
Annual leave accrual 11.7 9.8Current LSL 9.1 8.4Non-current LSL 3.2 3.2
Aggregate employee benefit and related on-cost liabilities 24.0 21.4
The aggregate employee benefits and related on-cost liabilities include amounts for annual leave and LSL. The amount for LSL that is expected to be settled more than 12 months from the end of the year is measured at its present value.

MIRVAC GROUP ANNUAL REPORT 201582
Notes to the consolidated financial statements
25 Employee benefits / continuedb) Superannuation commitmentsMirvac offers employees based in Australia as part of their remuneration, the ability to participate in a staff superannuation plan managed by AustralianSuper. Employees are able to choose whether to participate in this plan or a qualifying plan of their choice. The plan provides lump sum benefits on retirement, disability or death for employees who are invited by their employer to join the plan. The plan is a defined contribution plan, which complies with relevant superannuation requirements.
c) Employee security issuesThe total of all securities issued under all employee security schemes is limited to five per cent of the issued securities of the stapled group in any five year period.
d) LTI plansi) EEPThe EEP is designed to encourage security ownership across the broader employee population. It provides eligible employees with $1,000 worth of Mirvac securities at nil cost. The plan is open to Australian based employees with more than 12 months of continuous service, who do not participate in other Mirvac equity plans.
Securities acquired under this plan are subject to a restriction on disposal until the earlier of three years after acquisition, or cessation of employment with the Group. Otherwise, holders enjoy the same rights and benefits as other holders of Mirvac’s stapled securities. On termination, employees retain any securities granted to them. At 30 June 2015, 6,267,141 stapled securities (2014: 5,844,194) had been issued to employees under the EEP.
ii) Current plan — LTPThe LTP was originally introduced in the year ended 30 June 2008 following approval by securityholders at the 2007 AGM. Securityholders approved an update to the LTP at the 2010 AGM. The purpose of the LTP is to drive performance, retain executives and facilitate executive security ownership.
LTP grants are generally restricted to the executives who are most able to influence securityholder value. Executives are eligible, at the discretion of the HRC, to participate in the LTP. Non-Executive Directors are not eligible to participate in the LTP. Awards under this plan are made in the form of performance rights. Awards of options have also been made under this plan in previous years. A performance right is a right to acquire one fully paid stapled security in Mirvac provided a specified performance hurdle is met. No loans are made to participants under this plan.
The Board reviews the performance conditions annually to determine the appropriate hurdles based on Mirvac’s strategy and prevailing market practice.
This year, the Board determined, on the recommendation of the HRC, the vesting outcome for half of the LTP awards made in the year ended 30 June 2015 will depend on Mirvac’s TSR performance relative to the constituents of the comparison group, with the other half linked to Mirvac’s ROE performance. TSR was chosen given that it is an objective measure of securityholder value creation, and given its wide level of understanding and acceptance by the various key stakeholders. ROE was chosen as the second performance condition because it is aligned to Mirvac’s strategic drivers, in particular financial performance and capital efficiency. At 30 June 2015, 26,577,191 (2014: 23,366,336) performance rights and nil (2014: nil) options had been issued to participants under the LTP. The number of issued rights and options is net of adjustments due to forfeiture of rights and options as a result of termination of employment. A total of 4,917,598 performance rights (2014: nil) and nil options (2014: nil) vested during the year ended 30 June 2015.
iii) Superseded plansThere are four old plans now closed for new grants with the introduction of the LTP:
ERPA small number of senior executives were invited to participate in the ERP. While the loans under this program were offered during the year ended 30 June 2009, some of the loan amounts were drawn down in the year ended 30 June 2010. The amounts of the loans range from $500,000 to $2,000,000 and must be secured against property or unconditional bank guarantee. A progressively increasing forgiveness schedule allows for no more than 50 per cent of the total loan balance in total to be forgiven.
EISUntil 2006, Mirvac’s long term variable remuneration scheme for employees was the EIS. Open to all permanent employees, allocations were made annually, were unrestricted and fully vested on allotment. Existing arrangements remain in place until all current loans are repaid.
The loans were repayable via distributions received on the securities or upon their sale. If an employee resigns or is dismissed, the outstanding loan balance must be paid when employment ceases. In the event of redundancy, retirement, total and permanent disablement or death, the employee has 12 months after employment ceases in which to repay the loan. If the loan value is greater than the value of the securities when the loan balance is due, the remaining balance is written off and the securities are forfeited.
LTIPThe LTIP was introduced in 2006 and approved by securityholders at the Group’s 2006 AGM. At this time, loan-funded incentive plans were common for entities with stapled securities due to the prevailing tax rules. Participation in the plan was open to the Managing Director, other Executive Directors, other executives and eligible employees. Participants were offered an interest-free loan which was applied to fund the acquisition of Mirvac’s stapled securities at market value. The term of the loan is eight years. Any loan balance outstanding at the end of the eighth year must be repaid at that time. The loan is reduced annually by applying the post-tax amounts of any distributions paid by Mirvac to the outstanding principal. The loans are interest free and non-recourse over their term.
Two performance conditions had to be met before the securities vested in full: relative TSR and EPS growth. The satisfaction of each condition was given an equal weighting in terms of the total number of securities that may vest (that is, 50 per cent of the total securities held by a participant was subject to each performance condition). On vesting, 53.5 per cent of the original loan to fund the purchase of the vested securities was waived. The remaining balance of the loan will continue to be reduced by post-tax distributions until either the loan has been fully repaid or the eight year term expires, whichever occurs first. If a participant terminates their employment, any outstanding loans must be repaid in full immediately or the underlying securities will be forfeited.

MIRVAC GROUP ANNUAL REPORT 2015 83
25 Employee benefits / continuedEIPThe final loans under the EIP were offered during the year ended 30 June 2006. The amounts of the loans ranged from $50,000 to $800,000 with Mirvac holding security over the assets purchased with the loan proceeds. A progressively increasing forgiveness schedule applied which allowed the total loan balance to be forgiven if the employee remained employed on the final forgiveness date. The total outstanding loan balance under the EIP was $200,000 as at 1 July 2012. This amount was forgiven in accordance with the loan agreement during the year ended 30 June 2013. There are no outstanding loan amounts under the EIP as at 30 June 2015 and no further loans will be made under the EIP.
e) SBP expenseTotal expenses arising from SBP transactions recognised during the year as part of employee benefits expenses were as follows:
2015 2014 $m $m
EEP 0.8 0.7Current plan — LTP 3.7 5.4Current plan — STI 1.1 0.4
Total 5.6 6.5
f) Fair value of SBP expensei) EEPThe nature of the securities allotted under this plan is in substance similar to an option. The assessed fair value is taken to profit or loss as the securities vest immediately.
SBP inputs for the EEP issued during the year EEP
Grant date 23 March 2015Security price at grant date $2.01
ii) LTPFair value at grant date has been independently determined using an option pricing model that takes into account the exercise price, the term of the securities, the current price of the underlying securities, the expected volatility of the security price, the expected dividend/distribution yield and the risk-free interest rate for the term of the security. The fair value of the SBP expense is calculated using a Monte-Carlo simulation. Assumptions used for the fair value of SBP expense are as follows:
SBP inputs for the current LTPIn valuing rights linked to the relative TSR measure, the key inputs for the 2015 grant were as follows:
Performance rights
Grant date 17 December 2014Performance hurdle Relative TSR and ROICPerformance period start 1 July 2014Performance testing date 1 July 2017Security price at grant date $1.79Exercise price $nilExpected life 2.5 yearsVolatility 20%Risk-free interest rate (per annum) 2.2%Dividend/distribution yield (per annum) 5.0%
26 Related partiesa) Controlled entitiesInterests in controlled entities are set out in note 17.
b) KMP compensation 2015 2014 $m $m
Short term employment benefits 12.7 11.0Post-employment benefits 0.3 0.2SBP 2.3 1.8Other long term benefits 0.1 0.1
15.4 13.1
Detailed remuneration disclosures are provided on pages 11 to 29 in the Remuneration report.

MIRVAC GROUP ANNUAL REPORT 201584
Notes to the consolidated financial statements
26 Related parties / continuedc) Transactions with other related partiesThe following transactions occurred with related parties:
2015 2014 $000 $000
Transactions with JVAInterest income 13,858 17,764Project development fees 2,505 807Management and service fees 5,637 23,500Construction billings 21,922 45,475Responsible entity fees 6,078 7,609
d) Outstanding balances in relation to transactions with related partiesThe following balances are outstanding at the end of the year in relation to transactions with related parties:
2015 2014 $000 $000
Current receivablesJVA 20,685 13,344Non-current receivablesJVA 23,612 32,489
During the year, impairment of receivables due from related parties was recognised $0.3m (2014: $2.0m) and the expense in respect of impaired receivables due from related parties was recognised within impairment of loans, investments and inventories in the consolidated SoCI.
e) Loans to/from related parties 2015 2014 $m $m
Loans to directors and employeesBeginning of the year 2.3 10.0Loan repayments received (2.3) (6.3)Loan forgiveness — (1.4)
End of year — 2.3
Amounts due from related partiesBeginning of the year 45.8 83.5Loans advanced 9.1 1.3Loan repayments received (13.4) (16.8)Impairment recognised (0.3) (2.0)Transfers out — (23.2)Interest charged 3.1 3.0
End of year 44.3 45.8
f) Terms and conditions of outstanding balancesTransactions relating to dividends/distributions are on the same terms and conditions that applied to other securityholders.
The terms of the tax funding agreement are set out as per note 4(d).
Other transactions were made on normal commercial terms and conditions with variable terms for the repayment and interest payable at market rates on the loans between the parties.

MIRVAC GROUP ANNUAL REPORT 2015 85
27 Remuneration of auditorsDuring the year, the following fees were paid or payable for services provided by the auditor of the Group, its related practices and non-related audit firms:
2015 2014 $000 $000
a) Assurance servicesAudit servicesAudit and review of financial reports 1,793.0 1,813.1Compliance services and regulatory returns 375.0 308.2
Total remuneration for assurance services 2,168.0 2,121.3
b) Taxation servicesTax advice and compliance services 105.4 123.9
Total remuneration for taxation services 105.4 123.9
c) Advisory servicesAdvisory services 107.2 15.9
28 Notes to the consolidated statement of cash flows 2015 2014 Note $m $m
a) Reconciliation of cashCash at the end of the year as shown in the consolidated statement of cash flows is the same as the consolidated SoFP:Cash at bank 59.6 67.6Deposits at call 0.2 30.2
Cash and cash equivalents 59.8 97.8
b) Reconciliation of profit attributable to the stapled securityholders of Mirvac to net cash inflows from operating activities
Profit attributable to the stapled securityholders of Mirvac 21 609.9 447.3Share of net profit of JVA not received as dividends/distributions (68.0) (46.9)Net gain on fair value of investment properties and IPUC 6 (140.8) (48.8)Net (gain)/loss on sale of investment properties (5.9) 6.0Net loss on sale of PPE 0.3 0.2Depreciation and amortisation expenses 3 30.4 29.6Impairment of loans, investments, inventories and goodwill 3 (0.2) 23.3SBP expense 5.6 6.5Net loss/(gain) on fair value of derivative financial instruments (171.7) 23.3Net loss/(gain) on foreign exchange 181.7 (7.5)JVA dividends/distributions received 41.6 17.6Net gain on sale of investments 2 (10.2) —Change in operating assets and liabilities, net of effects from purchase of controlled entities:— Increase in income taxes payable — 0.4— Increase in tax effected balances 13.5 12.4— (Increase)/decrease in receivables (3.6) 53.7— Increase in inventories (20.1) (33.1)— Increase in other assets/liabilities (6.6) (12.3)— Decrease in payables (49.1) (73.3)— Increase in provisions for employee benefits 5.9 0.9
Net cash inflows from operating activities 412.7 399.3
29 Events occurring after the end of the yearNo other circumstances have arisen since the end of the year which have significantly affected or may significantly affect the operations of Mirvac, the results of those operations, or the state of affairs of Mirvac in future years.

MIRVAC GROUP ANNUAL REPORT 201586
Notes to the consolidated financial statements
v) Changes in ownership interestsThe Group treats transactions with NCI that do not result in a loss of control as transactions with equity owners of the Group. A change in ownership interest results in an adjustment between the carrying amounts of the controlling and NCI to reflect their relative interests in the controlled entity. Any difference between the amount of the adjustment to NCI and any consideration paid or received is recognised in a separate reserve within equity attributable to the stapled securityholders of Mirvac.
When the Group ceases to consolidate or equity account for an investment because of loss of control, joint control or significant influence, any retained interest in the entity is remeasured to its fair value with the change in carrying amount recognised in profit or loss. The fair value is the initial carrying amount for the purpose of subsequently accounting for the retained interest as a JVA or financial asset. In addition, any amounts previously recognised in other comprehensive income in respect of that entity are accounted for as if Mirvac had directly disposed of the related assets or liabilities. This may mean that amounts previously recognised in other comprehensive income are reclassified to profit or loss. If the ownership interest in a JVA is reduced but joint control or significant influence is retained, only a proportionate share of the amounts previously recognised in other comprehensive income are reclassified to profit or loss where appropriate.
vi) Structured entitiesA structured entity is an entity that has been designed so that voting or similar rights are not the dominant factor in deciding who controls the entity. Mirvac considers that all funds and trusts in which it currently has an investment, or from which it currently earns income, to be structured entities. Depending on the Group’s power over the activities of the entity and its exposure to and ability to influence its own returns, it may consolidate the entity. In other cases, it may sponsor or have exposure to such an entity but not consolidate it.
Certain wholly-owned companies incorporated in Australia are permitted to be parties to a deed of cross guarantee. Refer to note 17 for further details of which wholly-owned companies are subject to the deed of cross guarantee. For those entities which are consolidated and which are not party to a deed of cross guarantee, Mirvac Limited does not have a contractual obligation to provide financial support.
Mirvac invests in a number of funds and trusts. These investments are open-end and closed-end investment funds and trusts which invest in infrastructure and industrial real estate for the purpose of capital appreciation and/or to earn investment income. The investees finance their operations through borrowings and through equity issues. Material unconsolidated structured entities include the following:
— JF Infrastructure Yield Fund; and
— ASFI.
b) Segment reportingOperating segments are reported in a manner consistent with the internal reporting provided to the chief operating decision maker. The chief operating decision maker, who is responsible for allocating resources and assessing performance of the operating segments, has been identified as the ELT.
c) Foreign currency translationi) Functional and presentation currencyItems included in the financial statements of each of the Group’s entities are measured using the currency of the primary economic environment in which the entity operates (“functional currency”). The consolidated financial statements are presented in Australian currency, which is Mirvac Limited’s functional and presentation currency.
30 Summary of significant accounting policiesThis note provides a list of all significant accounting policies adopted in the preparation of these consolidated financial statements. These policies have been consistently applied to all the years presented, unless otherwise stated. The financial statements of Mirvac consist of the consolidated financial statements of Mirvac Limited and its controlled entities including MPT and its controlled entities.
a) Principles of consolidationi) Controlled entitiesControlled entities are all entities (including structured entities) over which the Group has control. The Group controls an entity when the Group is exposed to, or has rights to, variable returns from its involvement with the entity and has the ability to affect those returns through its power to direct the activities of the entity. Controlled entities are fully consolidated from the date on which control is transferred to Mirvac. They are deconsolidated from the date that control ceases. The acquisition method of accounting is used to account for the business combinations undertaken by Mirvac (refer to note 30(g)). Inter-company transactions and balances between Mirvac entities are eliminated. Unrealised losses are also eliminated unless the transaction provides evidence of the impairment of the asset transferred. Accounting policies of controlled entities have been changed where necessary to ensure consistency with the policies adopted by the Group. Non-controlling interests in the results and equity of controlled entities are shown separately in the consolidated SoCI, consolidated SoFP and consolidated statement of changes in equity.
ii) AssociatesAssociates are all entities over which Mirvac has significant influence but not control or joint control, generally accompanying a holding of between 20 per cent and 50 per cent of the voting rights. Investments in associates are accounted for in the consolidated financial statements using the equity method of accounting (see (iv) below), after initially being recognised at cost.
iii) Joint arrangementsUnder AASB 11 Joint Arrangements, investments in joint arrangements are classified as either joint operations or joint ventures. The classification depends on the contractual rights and obligations of each investor, rather than the legal structure of the joint arrangement. Mirvac has assessed the nature of its joint arrangements and determined that it only has joint ventures.
iv) Equity methodUnder the equity method of accounting, the investments are initially recognised at cost and adjusted thereafter to recognise the Group’s share of the post-acquisition profits or losses of the investee in profit or loss, and the Group’s share of movements in other comprehensive income of the investee in other comprehensive income. Dividends received or receivable from JVA are recognised as a reduction in the carrying amount of the investment. When Mirvac’s share of losses in an equity accounted investment equals or exceeds its interest in the entity, including any other unsecured receivables, Mirvac does not recognise further losses, unless it has incurred obligations or made payments on behalf of the other entity.
Unrealised gains on transactions between Mirvac and its JVA are eliminated to the extent of Mirvac’s interest in these entities. Unrealised losses are also eliminated unless the transaction provides evidence of an impairment of the asset transferred. Accounting policies of equity accounted investees have been changed where necessary to ensure consistency with the policies adopted by Mirvac.
The carrying amount of equity accounted investments is tested for impairment in accordance with the policy described in note 30(h).

MIRVAC GROUP ANNUAL REPORT 2015 87
i) Development projects and land salesRevenue from the sale of development projects and land is recognised upon settlement, which has been determined to be when the significant risks and rewards of ownership are transferred to the purchaser. Other revenue from development projects such as project management fees is recognised as services are performed.
ii) Construction contractsAgreements to develop real estate are only defined as construction contracts when the purchaser is able to specify the main elements of the design of the project. Where this is not the case, the project is treated as a development project. Revenue and expenses are recognised in accordance with the percentage of completion method unless the outcome of the contract cannot be reliably estimated. The stage of completion is determined by costs incurred to date as a percentage of total expected cost. Where it is probable that a loss will arise from a construction contract, the excess of total costs over revenue is recognised as an expense immediately. When the outcome of a contract cannot be reliably estimated, contract costs are recognised as an expense as incurred, and where it is probable that the costs will be recovered, revenue is recognised to the extent of costs incurred.
iii) Rental incomeRental revenue for operating leases is recognised on a straight line basis over the term of the lease, except when an alternative basis is more representative of the pattern of service rendered through the provision of the leased premises. Lease incentives offered under operating leases are amortised on a straight line basis in profit or loss.
iv) Recoverable outgoingsRecovery of outgoings as specified in lease agreements is accrued on an estimated basis and adjusted when the actual amounts are invoiced to the respective tenants.
v) FeesRevenues from the rendering of property funds management, property advisory and facilities management services are recognised upon the delivery of the service to the customers or where there is a signed unconditional contract for the sale or purchase of assets.
vi) InterestInterest revenue is brought to account when earned, taking into account the effective yield on the financial asset.
vii) Dividends/distributionsDividends/distributions are recognised as revenue when the right to receive payment is established. This applies even if they are paid out of pre-acquisition profits. However, the investment may need to be tested for impairment as a consequence.
viii) Government grantsGrants from the government are recognised at their fair value where there is a reasonable assurance that the grant will be received and the Group will comply with all attached conditions. Government grants relating to costs are deferred and recognised in profit or loss over the period necessary to match them with the costs that they are intended to compensate.
e) Income taxThe income tax expense or benefit for the year is the tax payable on the current year’s taxable income based on the applicable income tax rate for each jurisdiction adjusted by changes in deferred tax assets and liabilities attributable to temporary differences between the tax bases of assets and liabilities and their carrying amounts in the consolidated financial statements and to unused tax losses. The current income tax charge is calculated on the basis of the tax laws enacted or substantively enacted at the end of the reporting period in the countries where the controlled entities or JVA generate taxable incomes.
30 Summary of significant accounting policies / continued
ii) Transactions and balancesForeign currency transactions are translated into the functional currency using the exchange rates prevailing at the dates of the transactions. Foreign exchange gains and losses resulting from the settlement of such transactions and from the translation at year end exchange rates of monetary assets and liabilities denominated in foreign currencies are recognised in profit or loss, except when deferred in equity as qualifying cash flow hedges and qualifying net investment hedges or they are attributable to part of the net investment in a foreign operation. Foreign exchange gains and losses that relate to borrowings are presented in the consolidated SoCI, within finance costs. All other foreign exchange gains and losses are presented in the consolidated SoCI on a net basis within other income or other expenses. Translation differences on non-monetary financial assets and liabilities held at fair value are reported as part of the fair value gain or loss using the exchange rate applicable at the date fair value is determined. Translation differences on non-monetary financial assets and liabilities such as equities held at fair value through profit or loss are recognised in profit or loss as part of the fair value gain or loss. Translation differences on non-monetary financial assets such as equities classified as available for sale financial assets are included in a fair value reserve in equity.
iii) Group companiesThe results and financial position of entities (none of which has the currency of a hyperinflationary economy) that have a functional currency different from the presentation currency are translated into the presentation currency as follows:
— assets and liabilities at the end of the reporting period are translated at the closing rate at the end of the reporting period;
— income and expenses for each consolidated SoCI are translated at average exchange rates (unless this is not a reasonable approximation of the cumulative effect of the rate prevailing on the transaction dates, in which case income and expenses are translated at the dates of the transactions); and
— all resulting exchange differences are recognised in other comprehensive income.
On consolidation, exchange differences arising from the translation of any net investment in foreign entities, and of borrowings and other financial instruments designated as hedges of such investments, are recognised in other comprehensive income. When a foreign controlled entity is sold or any borrowings forming part of the net investment are repaid, a proportionate share of such exchange differences is reclassified to profit or loss, as part of the gain or loss on sale where applicable.
Goodwill and fair value adjustments arising on the acquisition of a foreign entity are treated as assets and liabilities of the foreign entities and translated at the closing rate.
d) Revenue recognitionRevenue is measured at the fair value of the consideration received or receivable. Amounts disclosed as revenue are net of returns, trade allowances and duties and taxes paid. Mirvac recognises revenue when the amount of revenue can be reliably measured, it is probable that future economic benefits will flow to the entity and specific criteria have been met for each of the Group’s activities as described below. The Group bases its estimates on historical results, taking into consideration the type of customer, the type of transaction and the specifics of each arrangement. Revenue is recognised for the major business activities as follows:

MIRVAC GROUP ANNUAL REPORT 201588
Notes to the consolidated financial statements
g) Business combinationsThe acquisition method of accounting is used to account for all business combinations, regardless of whether equity instruments or other assets are acquired. The consideration transferred for the acquisition of a controlled entity comprises the fair values of the assets transferred, the liabilities incurred and the equity interests issued by the Group. The consideration transferred also includes the fair value of any contingent consideration arrangement and the fair value of any pre-existing equity interest in the controlled entity. Acquisition-related costs are expensed as incurred. Identifiable assets acquired and liabilities and contingent liabilities assumed in a business combination are, with limited exceptions, measured initially at their fair values at the acquisition date. On an acquisition-by-acquisition basis, the Group recognises any NCI in the acquiree either at fair value or at the NCI’s proportionate share of the acquiree’s net identifiable assets.
The excess of the consideration transferred, the amount of any NCI in the acquiree and the acquisition-date fair value of any previous equity interest in the acquiree over the fair value of the Group’s share of the net identifiable assets acquired is recorded as goodwill. If those amounts are less than the fair value of the net identifiable assets of the controlled entity acquired and the measurement of all amounts has been reviewed, the difference is recognised directly in profit or loss as a discount on business combination. Where settlement of any part of cash consideration is deferred, the amounts payable in the future are discounted to their present value at the date of exchange. The discount rate used is the entity’s incremental borrowing rate, being the rate at which a similar borrowing could be obtained from an independent financier under comparable terms and conditions. Contingent consideration is classified either as equity or a financial liability. Amounts classified as a financial liability are subsequently remeasured to fair value, with changes in fair value recognised in profit or loss.
If the business combination is achieved in stages, the acquisition-date carrying value of the Group’s previously held equity interest in the controlled entity is remeasured to fair value at the acquisition date. Any gains or losses arising from such remeasurement are recognised in profit or loss.
h) Impairment of assetsGoodwill and intangible assets that have an indefinite useful life are not subject to amortisation and are tested annually for impairment or more frequently if events or changes in circumstances indicate that they might be impaired. Other assets are tested for impairment whenever events or changes in circumstances indicate that the carrying amount may not be recoverable. An impairment loss is recognised for the amount by which the asset’s carrying amount exceeds its recoverable amount. The recoverable amount is the higher of an asset’s fair value less costs to sell, and value in use. In assessing value in use, the estimated future cash flows are discounted to their present value using the post-tax discount rate that reflects current market assessments of both the time value of money and the risk specific to the asset for which the estimates of future cash flows have not been adjusted. An impairment loss is recognised for the amount by which the asset’s (or CGU) carrying amount exceeds its recoverable amount. For the purpose of assessing impairment, assets are grouped at the lowest levels for which there are separately identifiable cash flows which are largely independent of the cash inflows from other assets or groups of assets (CGUs). The lowest level at which Mirvac allocates and monitors goodwill is at the primary reporting segments level (refer to note 1).
30 Summary of significant accounting policies / continued
Deferred tax assets and liabilities are recognised for temporary differences at the tax rates expected to apply when the assets are recovered or liabilities are settled, based on those tax rates which are enacted or substantively enacted. The relevant tax rates are applied to the cumulative amounts of deductible and taxable temporary differences to measure the deferred tax asset or liability. An exception is made for certain temporary differences arising from the initial recognition of an asset or a liability. No deferred tax asset or liability is recognised in relation to these temporary differences if they arose in a transaction, other than a business combination, that at the time of the transaction did not affect either accounting profit or taxable profit or loss. Deferred tax assets are recognised for deductible temporary differences and unused tax losses only if it is probable that future taxable amounts will be available to utilise those temporary differences and losses. Deferred tax assets and liabilities are not recognised for temporary differences between the carrying amount and tax bases of investments in controlled entities where the parent entity is able to control the timing of the reversal of the temporary differences and it is probable that the differences will not reverse in the foreseeable future.
Current tax assets and tax liabilities are offset where the entity has a legally enforceable right to offset and intends either to settle on a net basis, or to realise the asset and settle the liability simultaneously. Mirvac and its wholly-owned Australian controlled entities have implemented the tax consolidation legislation. As a consequence, these entities are taxed as a single entity and the deferred tax assets and liabilities of these entities are recorded in the consolidated financial statements. Current and deferred tax is recognised in profit or loss, except to the extent that it relates to items recognised in other comprehensive income or directly in equity. In this case, the tax is also recognised in other comprehensive income or directly in equity respectively.
i) Investment allowancesCompanies within the Group may be entitled to claim special tax deductions for investments in qualifying assets. The Group accounts for such allowances as tax credits, which means that the allowance reduces income tax payable and current tax expense. A deferred tax asset is recognised for unclaimed tax credits that are carried forward as deferred tax assets.
f) LeasesLeases of PPE where Mirvac has substantially all the risks and rewards of ownership are classified as finance leases. Finance leases are capitalised at the lease’s inception at the lower of the fair value of the leased property and the present value of the minimum lease payments. The corresponding rental obligations, net of finance charges, are included in other short term or long term payables. Each lease payment is allocated between the liability and finance costs. The finance costs are charged to the profit or loss over the lease period so as to produce a constant periodic rate of interest on the remaining balance of the liability for each period. The PPE acquired under finance leases is depreciated over the shorter of the asset’s useful life and the lease term if there is no reasonable certainty that the Group will obtain ownership at the end of the lease term. Leases in which a significant portion of the risks and rewards of ownership are retained by the lessor, are classified as operating leases. Payments made under operating leases (net of any incentives received from the lessor) are charged to profit or loss on a straight line basis over the period of the lease. Lease income from operating leases where the Group is a lessor is recognised in income on a straight line basis over the lease term. Refer to note 30(d)(iii).

MIRVAC GROUP ANNUAL REPORT 2015 89
Borrowing costs included in the cost of land are those costs that would have been avoided if the expenditure on the acquisition and development of the land had not been made. Borrowing costs incurred while active development is interrupted for extended periods are recognised as expenses.
ii) Construction contractsConstruction work in progress is stated at the aggregate of contract costs incurred to date plus recognised profits less recognised losses and progress billings. If there are contracts where progress billings exceed the aggregate costs incurred plus profits less losses, the net amounts are presented under payables. Contract costs include all costs directly related to specific contracts and costs that are specifically chargeable to the customer under the terms of the contract. The stage of completion is measured using the percentage of completion method unless the outcome of the contract cannot be reliably measured.
m) Non-current assets (or disposal groups) classified as held for sale
Non-current assets (or disposal groups) are classified as held for sale if their carrying amount will be recovered principally through a sale transaction rather than through continuing use and a sale is considered highly probable. They are measured at the lower of their carrying amount, and fair value less costs to sell, except for assets such as deferred tax assets, financial assets and investment properties that are carried at fair value. An impairment loss is recognised for any initial or subsequent write-down of the asset (or disposal group) to fair value less costs to sell. A gain is recognised for any subsequent increases in fair value less costs to sell of an asset (or disposal group), but not in excess of any cumulative impairment loss previously recognised. A gain or loss not previously recognised by the date of the sale of the non-current asset (or disposal group) is recognised at the date of derecognition.
Non-current assets (including those that are part of a disposal group) are not depreciated or amortised while they are classified as held for sale. Interest and other expenses attributable to the liabilities of a disposal group classified as held for sale continue to be recognised. Non-current assets classified as held for sale and the assets of a disposal group classified as held for sale are presented separately from other assets in the consolidated SoFP. The liabilities of a disposal group classified as held for sale are presented separately from other liabilities in the consolidated SoFP.
A disposal group is a component of the entity that has been disposed of or is classified as held for sale and that represents a separate major line of business or geographical area of operations, is part of a single coordinated plan to dispose of such a line of business or area of operations, or is a subsidiary acquired exclusively with a view to resale. The results of a disposal group are shown as discontinued operations and are presented separately in the consolidated SoCI. The comparatives in the consolidated SoCI are restated to include the profit or loss of the disposal group in discontinued operations.
n) Investments and other financial assetsi) ClassificationMirvac classifies its financial assets in the following categories: financial assets at fair value through profit or loss, loans and receivables, held-to-maturity investments and available-for-sale financial assets. The classification depends on the purpose for which the investments were acquired. Management determines the classification of its investments at initial recognition and, in the case of assets classified as held to maturity, re-evaluates this designation at the end of each reporting period.
30 Summary of significant accounting policies / continued
i) Cash and cash equivalentsFor the purpose of presentation in the consolidated statement of cash flows, cash and cash equivalents includes cash on hand, deposits held at call with financial institutions, other short term, highly liquid investments with original maturities of three months or less that are readily convertible to known amounts of cash and which are subject to an insignificant risk of changes in value, and bank overdrafts. Bank overdrafts are shown within borrowings in current liabilities on the consolidated SoFP.
j) Trade receivablesTrade receivables are amounts due from customers for goods sold or services performed in the ordinary course of business. If collection of the amounts is expected in one year or less, they are classified as current assets. If not, they are presented as non-current assets. Trade receivables are generally due for settlement within 30 days and therefore are all classified as current. Trade receivables are recognised initially at fair value and subsequently measured at amortised cost using the effective interest method, less provision for impairment. Collectability of trade receivables is reviewed on an ongoing basis. Receivables which are known to be uncollectible are written off by reducing the carrying amount directly. A separate provision for impairment of trade receivables is established when there is objective evidence that Mirvac will not be able to collect all amounts due according to the original terms of receivables. The Group considers that there is evidence of impairment if any of the following indicators are present:
— significant financial difficulties of the debtor;
— probability that the debtor will enter bankruptcy or financial reorganisation; and
— default or delinquency in payments (more than 30 days overdue).
The amount of the provision is the difference between the asset’s carrying amount, and the present value of estimated future cash flows discounted at the effective interest rate.
Cash flows relating to short term receivables are not discounted if the effect of discounting is immaterial. The amount of the provision is recognised in profit or loss within other expenses. When a trade receivable for which an impairment provision had been recognised becomes uncollectible in a subsequent period, it is written off against the provision account. Subsequent recoveries of amounts previously written off are credited against other expenses in profit or loss. See note 30(n) for information about how impairment losses are calculated.
k) Mezzanine loansMezzanine loans are loans to unrelated parties for predominately real estate property development. These loans are secured by a second ranking mortgage, behind that of the senior lender. Mezzanine loans are recognised initially at fair value. Collectability of loans is reviewed on an ongoing basis and those which are considered uncollectible are written off to profit or loss.
l) InventoriesInventories comprise development projects and construction contracts.
i) Development projectsDevelopment projects are valued at the lower of cost and NRV. Cost includes the costs of acquisition, development, borrowings and all other costs directly related to specific projects, including an allocation of direct overhead expenses. Upon completion of the contract of sale, borrowing costs and other holding charges are expensed as incurred. Profits on development projects are not brought to account until settlement of the contract of sale.

MIRVAC GROUP ANNUAL REPORT 201590
Notes to the consolidated financial statements
iii) Recognition and derecognitionRegular way purchases and sales of investments are recognised on trade date, being the date on which Mirvac commits to purchase or sell the asset. Financial assets are derecognised when the rights to receive cash flows from the financial assets have expired or have been transferred and Mirvac has transferred substantially all the risks and rewards of ownership. When securities classified as available for sale are sold, the accumulated fair value adjustments recognised in other comprehensive income are reclassified to profit or loss as gains and losses from investment securities.
iv) MeasurementAt initial recognition, the Group measures a financial asset at its fair value plus, in the case of a financial asset not at fair value through profit or loss, transaction costs that are directly attributable to the acquisition of the financial asset. Transaction costs of financial assets carried at fair value through profit or loss are expensed in profit or loss. Loans and receivables and held-to-maturity investments are subsequently carried at amortised cost using the effective interest method.
Available-for-sale financial assets and financial assets at fair value through profit or loss are subsequently carried at fair value. Gains or losses arising from changes in the fair value are recognised as follows:
— for financial assets at fair value through profit or loss — in profit or loss within other income or other expenses;
— for available-for-sale financial assets that are monetary securities denominated in a foreign currency — translation differences related to changes in the amortised cost of the security are recognised in profit or loss and other changes in the carrying amount are recognised in other comprehensive income; and
— for other monetary and non-monetary securities classified as available for sale — in other comprehensive income.
Dividends on financial assets at fair value through profit or loss and available-for-sale equity instruments are recognised in profit or loss as part of revenue from continuing operations when the Group’s right to receive payments is established. Interest income from financial assets at fair value through profit or loss is included in the net gain/(loss). Interest on available-for-sale securities calculated using the effective interest method is recognised in the profit or loss as part of revenue from continuing operations. Details on how the fair value of financial instruments is determined are disclosed in note 31(b)(viii).
v) ImpairmentThe Group assesses at the end of each reporting period whether there is objective evidence that a financial asset or group of financial assets is impaired. A financial asset or group of financial assets is impaired and impairment losses are incurred only if there is objective evidence of impairment as a result of one or more events that occurred after the initial recognition of the asset (“loss event”) and that loss event (or events) has an impact on the estimated future cash flows of the financial asset or group of financial assets that can be reliably estimated. In the case of equity investments classified as available for sale, a significant or prolonged decline in the fair value of the security below its cost is considered an indicator that the assets are impaired.
30 Summary of significant accounting policies / continued
— Financial assets at fair value through profit or lossFinancial assets classified as held for trading are included in the category “financial assets at fair value through profit or loss”. Financial assets are classified as held for trading if they are acquired for the purpose of selling in the near term. Derivatives are also categorised as held for trading unless they are designated as hedges. Assets in this category are classified as current assets if they are expected to be settled within 12 months; otherwise, they are classified as non-current.
— Loans and receivablesLoans and receivables are non-derivative financial assets with fixed or determinable payments that are not quoted in an active market. They arise when Mirvac provides money, goods or services directly to a debtor with no intention of selling the receivable. They are included in current assets, except for those with maturities greater than 12 months after the end of the reporting period which are classified as non-current assets. Loans and receivables are included in receivables in the consolidated SoFP, except where the amount relates to the funding of investment structures, which are disclosed separately.
— Held-to-maturity investmentsHeld-to-maturity investments are non-derivative financial assets with fixed or determinable payments and fixed maturities that Mirvac’s management has the positive intention and ability to hold to maturity. If the Group were to sell other than an insignificant amount of held-to-maturity financial assets, the whole category would be tainted and reclassified as available for sale. Held-to-maturity financial assets are included in non-current assets, except for those maturities less than 12 months from the end of the reporting period, which are classified as current assets.
— Available-for-sale financial assetsAvailable-for-sale financial assets, comprising principally marketable equity securities, are non-derivatives that are either designated in this category or not classified in any of the other categories. They are included in non-current assets unless the investment matures, or management intends to dispose of the investment, within 12 months of the end of the reporting period. Investments are designated as available for sale if they do not have fixed maturities and fixed or determinable payments and management intends to hold them for the medium to long term.
ii) ReclassificationThe Group may choose to reclassify a non-derivative trading financial asset out of the held-for-trading category if the financial asset is no longer held for the purpose of selling it in the near term. Financial assets other than loans and receivables are permitted to be reclassified out of the held-for-trading category only in rare circumstances arising from a single event that is unusual and highly unlikely to recur in the near term. In addition, the Group may choose to reclassify financial assets that would meet the definition of loans and receivables out of the held-for-trading or available-for-sale categories if the Group has the intention and ability to hold these financial assets for the foreseeable future or until maturity at the date of reclassification. Reclassifications are made at fair value as of the reclassification date. Fair value becomes the new cost or amortised cost as applicable, and no reversals of fair value gains or losses recorded before the reclassification date are subsequently made. Effective interest rates for financial assets reclassified to loans and receivables and held-to-maturity categories are determined at the reclassification date. Further increases in estimates of cash flows adjust effective interest rates prospectively.

MIRVAC GROUP ANNUAL REPORT 2015 91
is recognised in profit or loss within other income or other expenses. If the hedge no longer meets the criteria for hedge accounting, the adjustment to the carrying amount of a hedged item for which the effective interest method is used is amortised to profit or loss over the period to maturity using a recalculated effective interest rate.
ii) Cash flow hedgesThe effective portion of changes in the fair value of derivatives that are designated and qualify as cash flow hedges is recognised in other comprehensive income and accumulated in reserves in equity. The gain or loss relating to the ineffective portion is recognised immediately in profit or loss. Amounts accumulated in equity are reclassified to profit or loss in the periods when the hedged item will affect profit or loss (for instance, when the forecast sale that is hedged takes place). However, when the forecast transaction that is hedged results in the recognition of a non-financial asset (for example, inventories) or a non-financial liability, the gains and losses previously deferred in equity are transferred from equity and included in the measurement of the initial cost or carrying amount of the asset or liability. When a hedging instrument expires or is sold or terminated, or when a hedge no longer meets the criteria for hedge accounting, any cumulative gain or loss existing in equity at that time remains in equity and is recognised when the forecast transaction is ultimately recognised in profit or loss. When a forecast transaction is no longer expected to occur, the cumulative gain or loss that was reported in equity is immediately transferred to profit or loss.
iii) Derivatives that do not qualify for hedge accountingCertain derivative instruments do not qualify for hedge accounting. Changes in the fair value of any derivative instrument that does not qualify for hedge accounting are recognised immediately in profit or loss.
p) PPEPPE comprises land and buildings, plant and equipment and OOP. Increases in the carrying amounts arising on the revaluation of certain classes of PPE are credited, net of tax, in other comprehensive income and accumulated in reserves in equity. To the extent that the increase reverses a decrease previously recognised in profit or loss, the increase is first recognised in profit or loss. Decreases that reverse previous increases of the same asset are first recognised in other comprehensive income to the extent of the remaining surplus attributable to the asset; all other decreases are charged to profit or loss. Each year, the difference between depreciation based on the revalued carrying amount of the asset charged to profit or loss and depreciation based on the asset’s original cost, net of tax, is reclassified from the PPE revaluation surplus to retained earnings.
i) Plant and equipmentPlant and equipment is stated at historical cost less depreciation. Historical cost includes expenditure that is directly attributable to the acquisition of the items.
ii) OOPProperties are classified as owner-occupied where Mirvac occupies more than 10 per cent of the total lettable area of the individual property. OOP are shown at fair value, less subsequent depreciation for buildings. Fair values are determined by external valuers on a rotation basis with one-half of the portfolio being valued annually. Those assets which are not subject to an external valuation at the end of the reporting period are fair valued internally by management. Any accumulated depreciation at the date of revaluation is eliminated against the gross carrying amount of the asset and the net amount is revalued to fair value.
30 Summary of significant accounting policies / continued
— Assets carried at amortised costFor loans and receivables, the amount of the loss is measured as the difference between the asset’s carrying amount, and the present value of estimated future cash flows (excluding future credit losses that have not been incurred) discounted at the financial asset’s original effective interest rate. The carrying amount of the asset is reduced and the amount of the loss is recognised in profit or loss. If a loan or held-to-maturity investment has a variable interest rate, the discount rate for measuring any impairment loss is the current effective interest rate determined under the contract. As a practical expedient, the Group may measure impairment on the basis of an instrument’s fair value using an observable market price. If, in a subsequent period, the amount of the impairment loss decreases and the decrease can be related objectively to an event occurring after the impairment was recognised (such as an improvement in the debtor’s credit rating), the reversal of the previously recognised impairment loss is recognised in profit or loss. Impairment testing of trade receivables is described in note 30(j).
— Assets classified as available for saleIf there is objective evidence of impairment for available-for-sale financial assets, the cumulative loss — measured as the difference between the acquisition cost and the current fair value, less any impairment loss on that financial asset previously recognised in profit or loss — is removed from equity and recognised in profit or loss. Impairment losses on equity instruments that were recognised in profit or loss are not reversed through profit or loss in a subsequent period. If the fair value of a debt instrument classified as available for sale increases in a subsequent period and the increase can be objectively related to an event occurring after the impairment loss was recognised in profit or loss, the impairment loss is reversed through profit or loss.
o) Derivatives and hedging activitiesDerivatives are initially recognised at fair value on the date a derivative contract is entered into and are subsequently remeasured to their fair value at the end of each reporting period. The method of recognising the resulting gain or loss depends on whether the derivative is designated as a hedging instrument, and if so, the nature of the item being hedged. Mirvac designates certain derivatives as either: (1) hedges of the fair value of recognised assets, liabilities or firm commitments (“fair value hedges”); or (2) hedges of highly probable forecast transactions (“cash flow hedges”). Mirvac documents at the inception of the transaction the relationship between hedging instruments and hedged items, as well as its risk management objective and strategy for undertaking various hedge transactions. Mirvac also documents its assessment, both at hedge inception and on an ongoing basis, of whether the derivatives that are used in hedging transactions have been and will continue to be highly effective in offsetting changes in fair values or cash flows of hedged items. The fair values of various derivative financial instruments used for hedging purposes are disclosed in note 15. The full fair value of a hedging derivative is classified as a non-current asset or liability when the remaining maturity of the hedged item is more than 12 months; it is classified as a current asset or liability when the remaining maturity of the hedged item is less than 12 months.
i) Fair value hedgesChanges in the fair value of derivatives that are designated and qualify as fair value hedges are recorded in profit or loss, together with any changes in the fair value of the hedged asset or liability that are attributable to the hedged risk. The gain or loss relating to the effective portion of interest rate swaps hedging fixed rate borrowings is recognised in profit or loss within finance costs, together with changes in the fair value of the hedged fixed rate borrowings attributable to interest rate risk. The gain or loss relating to the ineffective portion

MIRVAC GROUP ANNUAL REPORT 201592
Notes to the consolidated financial statements
ii) Management rightsManagement rights which have an indefinite useful life are not amortised but tested annually for impairment.
s) Trade and other payablesThese amounts represent liabilities for goods and services provided to Mirvac prior to the end of the year which are unpaid. The amounts are unsecured and are usually paid within 30 days of recognition. Trade and other payables are presented as current liabilities unless payment is not due within 12 months from the reporting date. They are recognised initially at fair value and subsequently measured at amortised cost using the effective interest method.
t) Borrowings and borrowing costsBorrowings are initially recognised at fair value, net of transaction costs incurred. Borrowings are subsequently measured at amortised cost. Any difference between the proceeds (net of transaction costs) and the redemption amount is recognised in profit or loss over the period of the borrowings using the effective interest method. Fees paid on the establishment of loan facilities, which are not an incremental cost relating to the actual drawdown of the facility, are recognised as prepayments and amortised on a straight line basis over the term of the facility. Borrowings are removed from the consolidated SoFP when the obligation specified in the contract is discharged, cancelled or expired. Borrowings are classified as current liabilities unless Mirvac has an unconditional right to defer settlement of the liability for at least 12 months after the end of the reporting period. General and specific borrowing costs that are directly attributable to the acquisition, construction or production of a qualifying asset are capitalised during the period of time that is required to complete and prepare the asset for its intended use or sale. Qualifying assets are assets that necessarily take a substantial period of time to get ready for their intended use or sale. Investment income earned on the temporary investment of specific borrowings pending their expenditure on qualifying assets is deducted from the borrowing costs eligible for capitalisation. Other borrowing costs are expensed.
u) Employee benefitsi) Wages and salaries, annual leave and sick leaveLiabilities for wages and salaries, including non-monetary benefits, and annual leave expected to be settled within 12 months of the end of the reporting period in which the employees render the related service, are recognised in other creditors and accruals in respect of employees’ services up to the end of the reporting period and are measured at the amounts expected to be paid when the liabilities are settled. Liabilities for accumulating sick leave are recognised when the leave is taken and measured at the rates paid or payable.
ii) LSLThe liability for LSL vesting within 12 months of the end of the reporting period is recognised and is measured in accordance with (i) above and included in provisions. The liability for LSL vesting more than 12 months from the end of the reporting period is recognised and measured as the present value of expected future payments to be made in respect of services provided by employees up to the end of each reporting period using the projected unit credit method. Consideration is given to expected future wage and salary levels, experience of employee departures and periods of service. Expected future payments are discounted using interest rates attaching, at the end of the reporting period, to corporate bond rates with terms to maturity that match, as closely as possible, the estimated future cash flows.
30 Summary of significant accounting policies / continued
Land is not depreciated. Depreciation on other assets is calculated using the straight line method to allocate their cost or revalued amounts, net of their residual values, over their estimated useful lives, as follows:
— buildings 40 years
— plant and equipment 3-15 years
— office leasehold improvements 1-10 years.
The assets’ residual values and useful lives are reviewed, and adjusted if appropriate, at the end of each reporting period. An asset’s carrying amount is written down immediately to its recoverable amount if the asset’s carrying amount is greater than its estimated recoverable amount (refer to note 30(h)). Gains and losses on disposals are determined by comparing proceeds with carrying amount. These are included in profit or loss on a net basis when the risks and rewards pass to the purchaser.
q) Investment propertiesi) Investment propertiesInvestment properties are properties held for long term rental yields and for capital appreciation. Investment properties are carried at fair value with any gain or loss arising from a change in fair value recognised in the consolidated SoCI. The carrying amount of the investment properties recorded in the consolidated SoFP includes components relating to lease incentives.
Investment properties also include properties that are under construction for future use as investment properties. These are carried at fair value unless the fair value cannot yet be reliably determined. Where that is the case, the property will be accounted for at cost until either the fair value becomes reliably determinable or construction is complete. The fair value of IPUC is determined by using estimation models including residual valuations. The estimated value of future assets is based on the expected future income from the project, using current yields of similar completed properties. The remaining expected costs of completion plus risk adjusted development margin are deducted from the estimated future asset value.
ii) Investment properties under redevelopmentExisting investment properties being redeveloped for continued future use are carried at fair value.
iii) Lease incentivesLease incentives provided under an operating lease by the Group as lessor are recognised on a straight line basis against rental income. As these incentives are repaid out of future lease payments, they are recognised as an asset in the consolidated SoFP as a component of the carrying amount of investment properties and amortised over the lease period. Where the investment property is supported by a valuation that incorporates the value of lease incentives, the investment property is revalued back to the valuation amount after the lease incentive amortisation has been charged as an expense.
r) Intangible assetsi) GoodwillGoodwill represents the excess of the cost of an acquisition over the fair value of Mirvac’s share of the net identifiable assets of the acquired controlled entity or JVA at the date of acquisition. Goodwill on acquisition of controlled entities is included in intangible assets. Goodwill on acquisition of JVA is included in investments in JVA. Goodwill acquired in business combinations is not amortised. Instead, goodwill is tested for impairment annually or more frequently if events or changes in circumstances indicate that it might be impaired, and is carried at cost less accumulated impairment losses. Gains and losses on the disposal of an entity include the carrying amount of goodwill relating to the entity sold. Goodwill is allocated to CGUs for the purpose of impairment testing. The allocation is made to those CGUs or groups of CGU that are expected to benefit from the business combination in which the goodwill arose, identified according to operating segments (refer to note 1).

MIRVAC GROUP ANNUAL REPORT 2015 93
v) ProvisionsProvisions for legal claims, contracts and make good obligations are recognised when the Group has a present legal or constructive obligation as a result of past events, it is probable that an outflow of resources will be required to settle the obligation and the amount has been reliably estimated. Provisions are not recognised for future operating losses. Where there are a number of similar obligations, the likelihood that an outflow will be required in settlement is determined by considering the class of obligations as a whole. A provision is recognised even if the likelihood of an outflow with respect to any one item included in the same class of obligations may be small. Provisions are measured at the present value of management’s best estimate of the expenditure required to settle the present obligation at the end of the reporting period. The discount rate used to determine the present value reflects current market assessments of the time value of money and the risks specific to the liability. The increase in the provision due to the passage of time is recognised as interest expense.
Provisions for restructuring are recognised when the Group has approved a detailed and formal restructuring plan, and the restructuring has either commenced or has been announced publicly.
w) Contributed equityOrdinary securities are classified as equity. Incremental costs directly attributable to the issue of new securities or options are shown in equity as a deduction, net of tax, from the proceeds. Incremental costs directly attributable to the issue of new securities or options, or for the acquisition of a business, are not included in the cost of the acquisition as part of the purchase consideration. In accordance with AASB 2 Share-Based Payment, securities issued as part of the LTI plan and EIS are not classified as ordinary securities, until such time as the employee loans are fully repaid or the employee leaves Mirvac. If Mirvac reacquires its own equity instruments (for example, as the result of a security buy-back), those instruments are deducted from equity and the associated securities are cancelled. No gain or loss is recognised in profit or loss and the consideration paid including any directly attributable incremental costs (net of income taxes) is recognised directly in equity.
x) DistributionsProvision is made for the amount of any distribution declared at or before the end of the year but not distributed at the end of the year.
y) EPSi) Basic EPSBasic EPS is calculated by dividing the profit attributable to securityholders of the Group by the weighted average number of ordinary securities outstanding during the year. In calculating basic EPS, securities issued under the EIS have been excluded from the weighted average number of securities.
ii) Diluted EPSDiluted EPS adjusts the figures used in the determination of basic EPS to take into account the after income tax effect of interest and other financing costs associated with dilutive potential ordinary securities (including those securities issued under the EIS) and the weighted average number of securities assumed to have been issued for no consideration in relation to dilutive potential ordinary securities.
z) Parent entity financial informationThe financial information for the parent entity, Mirvac Limited, disclosed in note 18 has been prepared on the same basis as the consolidated financial statements, except as set out below:
i) Investments in controlled entities and JVAInvestments in controlled entities and JVA are accounted for at cost in the financial statements of Mirvac Limited. Dividends/distributions received from JVA are recognised in the parent entity’s profit or loss, rather than being deducted from the carrying amount of these investments.
30 Summary of significant accounting policies / continued
iii) SBPSBP are recognised for the following plans:
Current LTIThe fair value at grant date is independently determined using a Monte-Carlo simulation that takes into account the exercise price, the vesting and performance criteria, the impact of dilution, the security price at grant date and expected price volatility of the underlying security, the expected dividend yield and the risk-free interest rate for the term of the equity instrument. The fair value is then expensed on a straight line basis over the vesting period of equity instruments.
EEPSecurity based charges relating to the securities issued under the EEP are included in profit or loss in the year in which the securities are granted with a corresponding increase to Mirvac’s contributed equity.
Superseded plansThe fair value of equity instruments granted under the superseded LTI plan and EIS is recognised in employee benefits expenses with a corresponding increase in equity. The fair value is measured at grant date and recognised over the vesting period.
iv) STISTI awards for most employees are made in the form of cash, while 25 per cent of STI awards for ELT members are paid in the form of unhurdled rights over Mirvac securities. The vesting period for 50 per cent of these unhurdled rights is 12 months, with the balance vesting after 24 months. For the cash position of STI awards, a liability for STI payable is recognised in accruals where there is a present obligation to settle the liability and at least one of the following conditions is met:
— there are formal terms for determining the amount of the benefit;
— the amounts to be paid are determined before the time of completion of the consolidated financial statements; or
— past practice gives clear evidence of the amount of the obligation.
Liabilities for cash STI awards are expected to be settled within 12 months and are measured at the amounts expected to be paid when they are settled. The liabilities for the portion of STI awards paid as deferred rights over Mirvac securities are measured at the fair value and amortised to share based expenses over the relevant vesting period.
v) Termination benefitsTermination benefits are payable when employment is terminated by Mirvac before the normal retirement date, or when an employee accepts voluntary redundancy in exchange for these benefits. Mirvac recognises termination benefits at the earlier of the following dates: (a) when Mirvac can no longer withdraw the offer of those benefits; and (b) when Mirvac recognises costs for a restructuring that is within the scope of AASB 137 Provisions, Contingent Liabilities and Contingent Assets and involves the payment of terminations benefits. In the case of an offer made to encourage voluntary redundancy, the termination benefits are measured based on the number of employees expected to accept the offer. Benefits falling due more than 12 months after the end of the reporting period are discounted to present value.
vi) Retirement benefit obligationsContributions to the defined contribution fund are recognised as an expense as they become payable. Prepaid contributions are recognised as an asset to the extent that a cash refund or a reduction in the future payments is available.

MIRVAC GROUP ANNUAL REPORT 201594
Notes to the consolidated financial statements
ii) AASB 15 Revenue from Contracts with CustomersThis standard will replace AASB 118 Revenue which covers contracts for goods and services and AASB 111 Construction Contracts which covers construction contracts.
The new standard is based on the principle that revenue is recognised when control of a good or service is transferred to a customer so the notion of control replaces the existing notion of risks and rewards. The standard will have no impact on revenue recognition within the Investment segment, as the revenue is accounted for under AASB 117 Leases. With respect to the residential development business, the standard is unlikely to have a material impact as the performance obligation is the delivering of the completed product. The Group is in the process of assessing any implications for other segments of the business and is evaluating for an early adoption of the new standard.
This standard must be applied for financial years commencing on or after 1 January 2017.
There are no other standards and interpretations that are not yet effective and that are expected to have a material impact on the entity in the current or future reporting periods and on foreseeable future transactions.
31 Critical accounting judgements and estimatesJudgements and estimates are continually evaluated, based on historical experience and other factors, including expectations of future events that may have a financial impact and are believed to be reasonable under the circumstances.
a) Critical judgements in applying Mirvac’s accounting policiesThe following are the critical judgements that management has made in the process of applying the Group’s accounting policies and that have the most significant effect on the amounts recognised in the consolidated financial statements:
i) Revenue recognitionThe measurement of development revenue, which is recognised when the significant risks and rewards of ownership are transferred to the purchaser, requires management to exercise its judgement in setting selling prices, given due consideration to cost inputs and market conditions. The measurement of construction revenue, which is recognised upon construction contracts on a percentage of completion basis, requires an estimate of expenses incurred to date as a percentage of total estimated costs.
ii) Cost of goods soldInventories are expensed as cost of goods sold upon sale. Management uses its judgement in determining the apportionment of cost of goods sold, through either unit entitlement or percentage of revenue, the quantum of cost of goods sold, which includes both costs incurred to date and forecast final costs, and the nature of cost of goods sold, which may include acquisition costs, development costs, borrowing costs and those costs incurred in bringing the inventories to a saleable state.
iii) Provision for loss on inventoriesMirvac is required to carry inventories at the lower of cost and NRV. Through the use of project feasibility assessments, which are based on the most reliable evidence available at the time, and incorporate both quantitative and qualitative factors, such as estimated selling rates and costs to complete, judgement is made concerning estimated NRV, which, in some cases, have resulted in the establishment of a provision.
iv) Investment properties and OOPMirvac is required to make a judgement to determine whether a property qualifies as an investment property or PPE in the cases where part of the building is occupied by the Group. Each property is considered individually. Where more than 10 per cent of the lettable area is occupied by the Group, the property is normally treated as OOP and accounted for as part of PPE.
30 Summary of significant accounting policies / continued
ii) Tax consolidation legislationMirvac Limited and its wholly-owned Australian controlled entities have implemented the tax consolidation legislation. The head entity, Mirvac Limited, and the controlled entities in the tax consolidated group continue to account for their own current and deferred tax amounts. These tax amounts are measured as if each entity in the tax consolidated group continues to be a stand-alone taxpayer in its own right. In addition to its own current and deferred tax amounts, Mirvac Limited also recognises the current tax liabilities (or assets) and the deferred tax assets arising from unused tax losses and unused tax credits assumed from controlled entities in the tax consolidated group. Assets or liabilities arising under tax funding agreements within the tax consolidated group are recognised as amounts receivable from or payable to other entities in the Group. Details about the tax funding agreement are disclosed in note 4(d).
Any difference between the amounts assumed and amounts receivable or payable under the tax funding agreement is recognised as a contribution to (or distribution from) wholly-owned tax consolidated entities. Under the current income tax legislation, MPT is not liable for income tax, provided its taxable income is fully distributed to unitholders each year.
iii) Financial guaranteesWhere the parent entity has provided financial guarantees in relation to loans and payables of controlled entities or JVA for no compensation, the fair values of these guarantees are accounted for as contributions and recognised as part of the cost of the investment.
aa) New standards and interpretations not yet adoptedCertain new accounting standards and interpretations have been published that are not mandatory for 30 June 2015 reporting periods and have not been early adopted by the Group. The Group’s assessment of the impact of these new standards and interpretations is set out below:
i) AASB 9 Financial InstrumentsThis standard addresses the classification, measurement and derecognition of financial assets and financial liabilities and introduces new rules for hedge accounting. In December 2014, the AASB made further changes to the classification and measurement rules and also introduced a new impairment model. These latest amendments now complete the new financial instruments standard.
The Group no longer expects any impact from the new classification, measurement and derecognition rules on the Group’s financial assets and financial liabilities. There will be no impact on the Group’s accounting for financial assets as they are all currently recognised in the consolidated SoCI. There will also be no impact on the Group’s accounting for financial liabilities, as the new requirements only affect the accounting for financial liabilities that are designated at fair value through profit or loss and the Group does not have any such liabilities.
As a general rule, it will be easier to apply hedge accounting going forward as the standard introduces a more principles based approach. The new standard also introduces expanded disclosure requirements and changes in the presentation. The new impairment model is an expected credit loss model which may result in the earlier recognition of credit losses. The Group has not yet decided when to adopt AASB 9.
This standard must be applied for financial years commencing on or after 1 January 2018.

MIRVAC GROUP ANNUAL REPORT 2015 95
iii) Estimated impairment of investments accounted for using the equity method
The investments are tested for impairment, by comparing recoverable amounts (higher of value in use, and fair value less costs to sell) with the carrying amounts, whenever there is an indication that the investment may be impaired. In determining the value in use of the investment, Mirvac estimates the present value of the estimated future cash flows expected to arise from distributions to be received from the investment and from its ultimate disposal. Details of the assumptions used by management in assessing the impairment are provided in note 16.
iv) Fair value of investments not traded in active marketsThe fair value of investments not traded in an active market is determined by the unit price as advised by the fund manager. The unit price is determined by NPV calculations using future cash flows and an appropriate post-tax discount rate (refer to note 15). The carrying value of investments not traded in an active market determined using the above techniques and assumptions is $11.3m (2014: $11.8m) and is disclosed as other financial assets at fair value through profit or loss (refer to note 13.2).
v) Valuation of investment properties and OOPMirvac uses judgement in respect of the fair values of investment properties and OOP. Investment properties and OOP are revalued by external valuers on a rotation basis with approximately one-half of the portfolio being valued annually. Investment properties which are not subject to an external valuation at the end of the reporting period are fair valued internally by management. The assumptions used in the estimations of fair values include expected future market rentals, discount rates, market prices and economic conditions. The reported fair values of investment properties and OOP reflect the market conditions at the end of the reporting period. While this represents the best estimation of fair value at the reporting date, actual sale prices achieved (should the investment properties and OOP be sold) may be higher or lower than the most recent valuation. This is particularly relevant in periods of market illiquidity or uncertainty. Major assumptions used in valuation of investment properties are disclosed in note 6. The carrying value at the end of the reporting period for investment properties was $6,751.1m (2014: $6,016.4m) and OOP $244.3m (2014: $238.6m). Details on investment properties are provided in note 6 and OOP in note 8.
vi) Valuation of IPUCIPUC are valued at fair value. There are generally no active markets for IPUC and fair value is considered to be the estimated market price that would be paid for the partially completed property, reflecting the expectations of market participants of the value of the property when complete less deductions for the estimated costs to complete, with appropriate adjustments for risk and profit. The fair value is determined on the basis of either DCF or residual methods. Both methods require consideration of the project risks which are relevant to the development process, including but not limited to construction and letting risks. The estimated value of future assets is based on the expected future income from the project, using current yields of similar completed properties. The net gain on fair value of IPUC was $2.8m (2014: loss of $7.7m). The carrying value of $188.9m (2014: $126.0m) at the end of the year was included in investment properties (refer to note 6).
vii) Valuation of SBP transactionsValuation of SBP transactions is performed using judgements around the fair value of the equity instruments on the date at which they are granted. The fair value is determined using a Monte-Carlo simulation. Mirvac recognises a SBP over the vesting period which is based on the estimation of the number of equity instruments likely to vest. At the end of the vesting period, Mirvac will assess the total expense recognised in comparison to the number of equity instruments that ultimately vested.
31 Critical accounting judgements and estimates / continued
v) Fair value estimationWhere financial assets and liabilities are carried at fair value, the fair value is based on assumptions of future events and involves significant estimates. The basis of valuation is set out in note 15.
vi) SBP transactionsThe Group measures the cost of equity settled securities allocated to employees by reference to the fair value of the equity instruments at the date at which they are granted. As explained in note 25, the fair value is determined by an external valuer using the bionomial simulation pricing method; this method includes a number of judgements and assumptions. These judgements and assumptions relating to SBP would have no impact on the carrying amounts of assets and liabilities in the consolidated SoFP but may impact the SBP expense taken to profit or loss and equity.
vii) Recognition of deferred tax assetsThe recognition of deferred tax assets is based upon whether it is probable that sufficient and suitable taxable profits will be available in the future against which the reversal of temporary differences can be deducted. To determine the future taxable profits, reference is made to the latest available profit forecasts. Judgement is also required in assessing whether deferred tax assets and certain deferred tax liabilities are recognised on the consolidated SoFP. Deferred tax assets, including those arising from tax losses, capital losses and temporary differences, are recognised only when it is considered probable that they will be recovered. Recoverability is dependent on the generation of sufficient future taxable profits.
viii) Classification of investments in structured entities as an associate/joint venture
Mirvac holds 60 per cent of the overall investment within ASFI. Mirvac equity accounts for this investment as a joint venture even though it owns 60 per cent of the voting or potential voting power, due to the fact that major decisions affecting the joint venture require unanimous approval from each investor in the joint venture.
b) Key sources of estimation uncertaintyIn preparing the consolidated financial statements, management is required to make estimations and assumptions. The following are the key assumptions concerning the future, and other key sources of estimation uncertainty at the end of the reporting period, that have a significant risk of causing material adjustment to the carrying amounts of assets and liabilities within the next year:
i) InventoriesThe NRV of inventories is the estimated selling price in the ordinary course of business less estimated costs of completion and costs to sell. Such estimates take into consideration fluctuations of price or cost directly relating to events occurring after the end of the period to the extent that such events confirm conditions existing at the end of the reporting period. The key assumptions require the use of management judgement and are reviewed quarterly. During the year, Mirvac did not expense any amount (2014: $nil) in relation to inventories that were carried in excess of the NRV.
ii) Impairment of goodwillMirvac annually tests whether goodwill has suffered any impairment. Determining whether goodwill is impaired requires an estimation of the value in use of the CGUs to which goodwill has been allocated. The value in use calculation requires the entity to estimate the future cash flows expected to arise from each CGU and a suitable discount rate in order to calculate the net present value (“NPV”). The carrying amount of goodwill at the end of the reporting period was $36.4m (2014: $36.4m). There was no impairment loss recognised during the year (2014: $24.5m). Details on the assumptions used are provided in note 11.2.

MIRVAC GROUP ANNUAL REPORT 201596
Notes to the consolidated financial statements
31 Critical accounting judgements and estimates / continued
viii) Valuation of derivatives and other financial instrumentsMirvac uses judgement in selecting the appropriate valuation technique for financial instruments not quoted in an active market. Valuation of derivative financial instruments involves assumptions based on quoted market rates adjusted for specific features of the instrument. The valuations of any financial instrument may change in the event of market volatility. The valuation techniques are discussed in detail at note 15 and have been developed in compliance with requirements of AASB 139 Financial Instruments: Recognition and Measurement.
ix) Estimated future taxable profitsMirvac prepares financial budgets and forecasts on a regular basis which are reviewed, covering a five year period. Budgets and forecasts are prepared on a base case and identified new projects. These forecasts and budgets form the basis of future profitability to support the carrying of the deferred tax asset.
Mirvac’s operating and financial performance is influenced by a variety of general economic and business conditions, which are outside the control of Mirvac, including the level of inflation, interest rates, exchange rates, commodity prices, ability to access funding, oversupply and demand conditions and government fiscal, monetary and regulatory policies. A change in any of the assumptions used in the budgeting and forecasting would have an impact on the future profitability of the Group. For example, adverse fluctuations in interest rates, to the extent that they are not hedged or forecast, may impact Mirvac’s earnings and asset values due to any impact on property markets in which Mirvac operates.

MIRVAC GROUP ANNUAL REPORT 2015 97
In the Directors’ opinion:
a) the financial statements and the notes set out on pages 32 to 96 are in accordance with the Corporations Act 2001, including:
i) complying with Accounting Standards, the Corporations Regulations 2001 and other mandatory professional reporting requirements; and
ii) giving a true and fair view of the consolidated entity’s financial position at 30 June 2015 and of its performance for the financial year ended on that date;
b) there are reasonable grounds to believe that the company will be able to pay its debts as and when they become due and payable; and
c) at the date of this declaration, there are reasonable grounds to believe that the members of the extended closed group identified in note 17 will be able to meet any obligations or liabilities to which they are, or may become, subject by virtue of the deed of cross guarantee described in note 17.
The basis of preparation note confirms that the financial statements also comply with IFRS as issued by the IASB.
The Directors have been given the declarations by the CEO & Managing Director and Chief Financial Officer required by section 295A of the Corporations Act 2001.
This declaration is made in accordance with a resolution of the Directors.
Susan Lloyd-HurwitzDirector
Sydney13 August 2015
Directors’ declaration

MIRVAC GROUP ANNUAL REPORT 201598
Independent auditor’s report to the members of Mirvac Limited
Report on the financial reportWe have audited the accompanying financial report of Mirvac Limited (the Company), which comprises the consolidated statement of financial position as at 30 June 2015, consolidated statement of comprehensive income, consolidated statement of changes in equity and consolidated statement of cash flows for the year ended on that date, a summary of significant accounting policies, other explanatory notes and the directors’ declaration for the Company. The consolidated entity comprises the Company and the entities it controlled at year’s end or from time to time during the financial year.
Directors’ responsibility for the financial reportThe directors of the Company are responsible for the preparation of the financial report that gives a true and fair view in accordance with Australian Accounting Standards and the Corporations Act 2001 and for such internal control as the directors determine is necessary to enable the preparation of the financial report that is free from material misstatement whether due to fraud or error. In the basis of preparation note, the directors also state, in accordance with Accounting Standard AASB 101 Presentation of Financial Statements, that the financial statements comply with International Financial Reporting Standards.
Auditor’s responsibilityOur responsibility is to express an opinion on the financial report based on our audit. We conducted our audit in accordance with Australian Auditing Standards. These Auditing Standards require that we comply with relevant ethical requirements relating to audit engagements and plan and perform the audit to obtain reasonable assurance whether the financial report is free from material misstatement.
An audit involves performing procedures to obtain audit evidence about the amounts and disclosures in the financial report. The procedures selected depend on the auditor’s judgement, including the assessment of the risks of material misstatement of the financial report, whether due to fraud or error. In making those risk assessments, the auditor considers internal control relevant to the entity’s preparation and fair presentation of the financial report in order to design audit procedures that are appropriate in the circumstances, but not for the purpose of expressing an opinion on the effectiveness of the entity’s internal control. An audit also includes evaluating the appropriateness of accounting policies used and the reasonableness of accounting estimates made by the directors, as well as evaluating the overall presentation of the financial report.
We believe that the audit evidence we have obtained is sufficient and appropriate to provide a basis for our audit opinion.
PricewaterhouseCoopers, ABN 52 780 433 757 Darling Park Tower 2, 201 Sussex Street, GPO BOX 2650, SYDNEY NSW 1171 DX 77 Sydney, Australia T +61 2 8266 0000, F +61 2 8266 9999, www.pwc.com.au
Liability limited by a scheme approved under Professional Standards Legislation

MIRVAC GROUP ANNUAL REPORT 2015 99
Independent auditor’s reportto the members of Mirvac Limited (continued)
IndependenceIn conducting our audit, we have complied with the independence requirements of the Corporations Act 2001.
Auditor’s opinionIn our opinion:
a) the financial report of the Company is in accordance with the Corporations Act 2001, including:
i) giving a true and fair view of the consolidated entity’s financial position as at 30 June 2015 and of its performance for the year ended on that date; and
ii) complying with Australian Accounting Standards (including the Australian Accounting Interpretations) and the Corporations Regulations 2001.
b) the financial report also complies with International Financial Reporting Standards as disclosed in the basis of preparation note.
Report on the Remuneration ReportWe have audited the Remuneration Report included on pages 11 to 29 of the Directors’ Report for the year ended 30 June 2015. The directors of the Company are responsible for the preparation and presentation of the Remuneration Report in accordance with section 300A of the Corporations Act 2001. Our responsibility is to express an opinion on the Remuneration Report, based on our audit conducted in accordance with Australian Auditing Standards.
Auditor’s opinionIn our opinion, the Remuneration Report of the Company for the year ended 30 June 2015, complies with section 300A of the Corporations Act 2001.
PricewaterhouseCoopers
Matthew Lunn SydneyPartner 13 August 2015

MIRVAC GROUP ANNUAL REPORT 2015100
Securityholder information
The information set out below was prepared at 31 July 2015 and applies to Mirvac’s stapled securities (ASX code: MGR). As at 31 July 2015, there were 3,698,653,645 stapled securities on issue.
Substantial securityholdersAs disclosed in substantial holding notices lodged with the ASX at 31 July 2015:
Number of Percentage of Name Date of change stapled securities issued equity % 1
AMP Limited and its related bodies corporate 29/04/2015 381,806,702 10.33BlackRock Group 25/11/2014 270,946,137 7.32The Vanguard Group, Inc 02/06/2015 268,948,574 7.27State Street Corporation and subsidiaries 08/05/2015 202,399,711 5.47Commonwealth Bank of Australia Group 15/07/2015 185,022,971 5.00
1) Percentage of issued equity held as at the date notice provided.
Range of securityholdersRange Number of holders Number of stapled securities
1 to 1,000 6,437 3,034,0041,001 to 5,000 11,451 31,726,3925,001 to 10,000 6,146 45,068,97210,001 to 100,000 7,524 179,531,480100,001 and over 340 3,439,292,797
Total number of securityholders 31,898 3,698,653,465
20 largest securityholdersName Number of stapled securities Percentage of issued equity %
HSBC Custody Nominees (Australia) Limited 1,180,719,360 31.92JP Morgan Nominees Australia Limited 780,912,008 21.11National Nominees Limited 579,700,651 15.67BNP Paribas Noms Pty Ltd <DRP> 260,720,477 7.05Citicorp Nominees Pty Limited 257,652,281 6.97AMP Life Limited 90,035,344 2.43Citicorp Nominees Pty Limited <Colonial First State Inv A/C> 64,515,422 1.74RBC Investor Services Australia Nominees Pty Limited <APN A/C> 18,333,881 0.50RBC Investor Services Australia Nominees Pty Limited <BKCUST A/C> 11,916,978 0.32BNP Paribas Noms (NZ) Ltd <DRP> 10,081,426 0.27Bond Street Custodians Limited <ENH Property Securities A/C> 9,961,780 0.27RBC Investor Services Australia Nominees Pty Limited <PISelect> 8,619,926 0.23SBN Nominees Pty Limited <10004 ACCOUNT> 8,600,000 0.23Argo Investments Limited 6,000,551 0.16BNP Paribas Nominees Pty Ltd <Agency Lending Collateral> 5,418,854 0.15UBS Wealth Management Australia Nominees Pty Ltd 5,136,101 0.14Invia Custodian Pty Limited <GSJBW Managed A/C> 4,376,284 0.12Yalaba Pty Ltd <The Yalaba A/C> 4,331,876 0.12National Nominees Limited <N A/C> 4,018,000 0.11BNP Paribas Nominees Pty Ltd <Agency Lending Collateral> 3,855,000 0.10
Total for 20 largest securityholders 3,314,906,200 89.62Total other securityholders 383,747,445 10.38
Total stapled securities on issue 3,698,653,645 100.00
Number of securityholders holding less than a marketable parcel (being 265 stapled securities at the closing market price of $1.890 on 31 July 2015): 2,048.
Voting rightsSubject to the Constitutions of Mirvac Limited and of MPT and to any rights or restrictions for the time being attached to any class or classes of shares, units or stapled securities:
— on a show of hands, each Member present in person or by proxy, attorney, or representative has one vote; and
— on a poll, each Member has:
> in the case of a resolution of Mirvac Limited, one vote for each share in Mirvac Limited held; and
> in the case of a resolution of MPT, one vote for each whole $1.00 of unit value in MPT held.

MIRVAC GROUP ANNUAL REPORT 2015 101
Glossary of acronyms
AAS Australian Accounting Standards
AASB Australian Accounting Standards Board
AFSL Australian financial services licence
AGM Annual General and General Meeting
ANZ Australia and New Zealand Banking Group Limited
ARCC Audit, Risk and Compliance Committee
A-REIT Australian Real Estate Investment Trust
ARR Asset revaluation reserve
ARSN Australian Registered Scheme Number
ASFI Australian Sustainable Forestry Investors 1&2
ASIC Australian Securities and Investments Commission
ASX Australian Securities Exchange
CEO/MD Chief Executive Officer & Managing Director
CFO Chief Financial Officer
CGU Cash generating unit
CPI Consumer Price Index
CPSS Cents per stapled security
CR Capitalisation rate
DCF Discounted cash flow
DRP Dividend/distribution reinvestment plan
EEP Employee Exemption Plan
EIP Executive Incentive Program
EIS Employee Incentive Scheme
ELT Executive Leadership Team
EPS Earnings per stapled security
ERP Executive Retention Plan
EY Ernst & Young
FBT Fringe benefits tax
FX Foreign Exchange
FY10 Year ended 30 June 2010
FY11 Year ended 30 June 2011
FY12 Year ended 30 June 2012
FY13 Year ended 30 June 2013
FY14 Year ended 30 June 2014
FY15 Year ended 30 June 2015
FY16 Year ended 30 June 2016
FY17 Year ended 30 June 2017
GST Goods and services tax
HRC Human Resources Committee
HSE&S Health, safety, environment and sustainability
IASB International Accounting Standards Board
IFRS International Financial Reporting Standards
IPUC Investment properties under construction
JVA Joint ventures and associates
KMP Key management personnel
KPI Key performance indicators
LSL Long service leave
LTI Long term incentives
LTIP Long Term Incentive Plan
LTP Long Term Performance Plan
MAM Mirvac Asset Management
MGR Mirvac Group (and ASX code)
MIM Mirvac Investment Management
MPT Mirvac Property Trust
MTN Medium term notes
NAB National Australia Bank Limited
NABERS National Australian Built Environment Rating System
NCI Non-controlling interests
NED Non-Executive Director
NPV Net present value
NRV Net realisable value
NTA Net tangible assets
OOP Owner-occupied properties
PPE Property, plant and equipment
PwC PricewaterhouseCoopers
ROE Return on equity
ROIC Return on invested capital
SBP Security based payments
SoCI Statement of comprehensive income
SoFP Statement of financial position
STI Short term incentives
TSR Total securityholder return
WALE Weighted average lease expiry

MIRVAC GROUP ANNUAL REPORT 2015102
Directory
Registered office/Principal officeMirvac Group (comprising Mirvac Limited ABN 92 003 280 699 and Mirvac Funds Limited ABN 70 002 561 640, AFSL 233 121 as responsible entity of MPT ARSN 086 780 645)
Level 2660 Margaret StreetSydney NSW 2000Telephone +61 2 9080 8000Facsimile +61 2 9080 8111
www.mirvac.com
Securities exchange listingMirvac is listed on the Australian Securities Exchange (ASX code: MGR).
DirectorsJohn Mulcahy (Chair)Susan Lloyd-Hurwitz (CEO/MD)Christine BartlettPeter HawkinsSamantha MostynJames M. Millar AMJohn PetersElana Rubin
Company SecretarySean Ward
Stapled security registryLink Market Services Limited1A Homebush Bay DriveRhodes NSW 2138Telephone +61 1800 356 444
Securityholder enquiriesTelephone +61 1800 356 444
Correspondence should be sent to:Mirvac GroupC/- Link Market Services LimitedLocked Bag 14Sydney South NSW 1235.
Further investor information can be located in the Investor Centre tab on Mirvac’s website at www.mirvac.com.
AuditorPricewaterhouseCoopers201 Sussex StreetSydney NSW 2000
Annual General and General MeetingMirvac Group’s 2015 AGM will be held at 10.00am (Australian Eastern Standard Time) on Thursday, 12 November 2015 at the Pullman Brisbane, King George Square, Corner Ann and Roma Streets, Brisbane QLD 4000.