mirielloc - tesi-def- - imt school for advanced studies...
TRANSCRIPT

IMT Institute for Advanced Studies
Lucca, Italy
Regulating the development of renewable energy: a model-based analysis
of electricity utilities in Europe
PhD Program in Economics, Markets, Institutions
XXIII Cycle
By
Caterina Miriello
2011

The dissertation of Caterina Miriello is approved.
Program Coordinator: Prof. Fabio Pammolli, IMT Institute for Advanced Studies, Lucca
Supervisor: Prof. Carlo Cambini, Politecnico di Torino
Tutor: Jing Yuan Chiou, IMT Institute for Advanced Studies, Lucca
The dissertation of Caterina Miriello has been reviewed by:
Carlo Cambini, Politecnico di Torino
Jing Yuan Chiou, IMT Institute for Advanced Studies, Lucca
Alessandro Petretto, Università degli Studi di Firenze
IMT Institute for Advanced Studies, Lucca
2011


To my parents, Giuseppe and Sofia
To my brothers, Antonio and Fernando
To Santa Severina, home


vii
Contents
List of Figures ................................................................................................................................................................. ix
List of Tables .................................................................................................................................................................. xi
Acknowledgements ......................................................................................................................................................xii
Vita .................................................................................................................................................................................xiii
Abstract .......................................................................................................................................................................... xiv
1 Introduction .................................................................................................................................................................. 1
1. 1 Background............................................................................................................................................................ 1
1.2 The EU Renewable Energy Directive .................................................................................................................. 2
1.3 Economic implications ......................................................................................................................................... 4
1.4 Research questions and motivation ................................................................................................................... 4
2 Literature survey of orientations and modelling strategies................................................................................. 7
2.1 Electricity Market Modelling Approaches ........................................................................................................ 7
2.1.1 Equilibrium models...................................................................................................................................... 7
2.1.2 Optimisation models .................................................................................................................................. 10
2.2. Simulation models: Agent Based Simulation................................................................................................. 13
2.2.1 Tendencies in ABM approaches: a discussion....................................................................................... 16
2.3 Literature on renewables policies ..................................................................................................................... 17
2.3.1 Theoretical and empirical case studies ................................................................................................... 18
2.3.2 Model simulations ...................................................................................................................................... 19
2.4 Conclusions .......................................................................................................................................................... 21
3 Analysing the impact of wind: an agent-based model ....................................................................................... 22
3.1 Introduction ......................................................................................................................................................... 22
3.2 Literature review ................................................................................................................................................. 23
3.3 Model description................................................................................................................................................ 25
3.4 Research questions and main results ............................................................................................................... 26
3.5 Model-based analysis ......................................................................................................................................... 28
viii
3.5.1 Benchmark case with no strategic interactions...................................................................................... 28
3.5.2 Benchmark case with strategic interactions ........................................................................................... 35
3.5.3 Oligopoly case ............................................................................................................................................. 40
3.6 Model-based analysis adding asymmetry ....................................................................................................... 42
3.6.1 Asymmetry in size ...................................................................................................................................... 42
3.6.2 Asymmetry in technology portfolio with a new entrant wind firm .................................................. 44
3.7 Policy Implications............................................................................................................................................. 46
4 Wind power and security of supply ....................................................................................................................... 48
4.1 Introduction and motivation............................................................................................................................. 48
4.2 Theoretical foundations, limits and literature of the energy-only market................................................. 50
4.3 Theoretical foundations and literature of capacity mechanisms................................................................. 52
4.3.1 Capacity payments ...................................................................................................................................... 53
4.3.2 Capacity markets ......................................................................................................................................... 53
4.4 Reliability and renewable sources: what can be learnt from hydro experience ......................................... 54
4.4.1 Brazil: the need for investment................................................................................................................. 54
4.4.2 New Zealand: the importance of the security of supply...................................................................... 56
4.4.3 Colombia: a weak regulatory framework ............................................................................................... 57
4.4.4 Key problems ............................................................................................................................................... 58
4.5 Reliability and wind power............................................................................................................................... 58
4.6 Agent-based simulations.................................................................................................................................... 61
4.6.1 Model description ....................................................................................................................................... 61
4.6.2 Wind energy and demand peak................................................................................................................ 63
4.6.3 Wind as baseload unit ................................................................................................................................ 66
4.7 Conclusions and policy implications ............................................................................................................... 71
5 Summary of results and future research themes.................................................................................................. 72
References ...................................................................................................................................................................... 74

ix
List of Figures
Figure 1 Initial technology composition for each firm.............................................................................................. 28
Figure 2 Firm performances, following an increase in the share of wind power in its generation portfolio.... 31
Figure 3 IRR according to the share of wind and the policy scenario .................................................................... 31
Figure 4 Comparison of average daily prices with and without nuclear energy.................................................. 34
Figure 5 Difference in profit streams of firm 1 with or without nuclear energy in its technology portfolio .... 34
Figure 6 Average daily prices in the scenario of no wind respectively in period of high demand and low
demand, with 50% utilisation rate ...................................................................................................................... 36
Figure 7 Rates of Utilisation and Profits for high demand scenario (above) and low demand scenario (below)
................................................................................................................................................................................. 37
Figure 8 Average daily prices and profits in a scenario without wind and low demand, with 9 firms
strategically setting an utilisation target at 40% ............................................................................................... 38
Figure 9 Comparison of average daily prices of the benchmark scenario and the strategic behaviour scenario,
for a utilisation target of 50%............................................................................................................................... 39
Figure 10 Average daily prices for periods of high demand(left) and low demand (right), with 40%
utilisation rate and a price cap of 200 €, scenario of nominal capacity of wind at 30%............................... 40
Figure 11 Comparison of IRR patterns for each (non strategic) scenario............................................................... 41
Figure 12 Comparison of Average daily prices for each scenario........................................................................... 41
Figure 13 Comparison of average daily prices in oligopoly with and without strategic interactions;
Comparison of average daily prices with strategic interactions between the benchmark case and the
oligopoly case ........................................................................................................................................................ 42
Figure 14 Total capacity per company ....................................................................................................................... 43
Figure 15 Average daily prices with asymmetry in size ...................................................................................... 43
Figure 16 IRR for the scenario of asymmetry in size (left). On the right, the IRR for smaller firms is at least
nonnegative; however, it is still too low to encourage investment in renewables....................................... 44
Figure 17 Total capacity per firm, with nominal wind capacity at 30% ................................................................. 44
Figure 18 Average daily prices in the New Entrant case ......................................................................................... 45
Figure 19 IRR pattern for the new entrant wind firm ............................................................................................... 45
Figure 20 Average hourly prices in case of an unexpected increase of demand by 20%, respectively with no
wind and 10% in the technology portfolio ........................................................................................................ 64

x
Figure 21 Peaking prices (hourly averages) in the month of November according to the share of wind in the
technology portfolio ............................................................................................................................................. 64
Figure 22 Averaged peaking prices for a demand shock ......................................................................................... 64
Figure 23 Streams of profit with and without demand peak................................................................................... 65
Figure 24 Average daily prices according to the share of wind in the technology portfolio ............................ 67
Figure 25 System’s supply curve: firms' merit order, with 20% wind share ......................................................... 67
Figure 26 IRR according to the share of wind in the technology portfolio ............................................................ 68
Figure 27 Average hourly prices and system's supply function (20% wind share) with a demand peak at
around 12 am ......................................................................................................................................................... 68
Figure 28 Average daily prices for different demand peaks.................................................................................... 69
Figure 29 Averaged peaking hourly prices ................................................................................................................ 69
Figure 30 Utilisation rates for the case of 5% demand increase- 20% wind share ................................................ 70
Figure 31 Averaged peaking prices for demand peak of 20% ................................................................................. 70
xi
List of Tables
Table 1 National Renewable Energy Targets for Member States -Source: http://eur-lex.europa.eu/ 3
Table 2 Electricity Market Modelling Approaches 12
Table 3 Modelling Approaches Using Simulations 17
Table 4 Literature on renewables policies 20
Table 5 Capacity figures of the model in the benchmark scenario 29
Table 6 Marginal cost data, averaged for Europe - IEA, OECD 30
Table 7 Average wholesale prices according to the wind share 33
Table 8 Average daily prices according to wind penetration, with 9 firms strategically setting their utilisation
target at 50% 39
Table 9 Computation of theoretical peaking prices 66

xii
Acknowledgements
First and foremost, I would like to thank my supervisor, Prof. Carlo Cambini, who has
supported and adviced me throughout my PhD program with his patience and knowledge
whilst allowing me the room to work in my own way.
I also sincerely thank Dr. Chiou for his precious suggestions and comments that greatly
improved my thesis, and Prof. Petretto, who is following my work for several years now
and has always been helpful and patient.
This thesis would not even been born without the help and suggestions of Prof. Derek Bunn
of London Business School; my permanence at his Energy Markets Research Group and our
long conversations have been some of the most valuable experiences in my whole life, and I
thank him for having believed in me. He is co-author of Chapter 3 of this thesis, which is the
core and the starting point of the whole research.
A special thank you goes to Prof. Chiara Fumagalli, although she probably does not
remember me, because she for first has suggested me to do research about energy themes,
which has become a passion.
Daniela Giorgetti of IMT has given me precious support for the administrative issues. I
thank Daniela for her patience and for her kindness.
Living in Lucca has been an amazing experience thank to all the people who were there with
me: all my colleagues, especially my good friends and room-mates Sara and Peri, but also
the guys from other cycles and other PhD courses. A special thank you goes to Carlo Cirulli
that spent many early mornings studying with me in the library. I would also like to thank
Luisa and Virginia for being so nice and helpful when we were all together in London.
My friends in Florence have always been supportive and proud of me, and for this I
sincerely thank them, particularly Anna Lisa, Enrico and Jole. Another big thank you goes to
Giovanni, who always makes my day (and my life) better.
However, my biggest debt of gratitude is towards my family, who loves me and supports
my choices even when they are risky. For this, and for countless reasons, thank you.
xiii
Vita
Born April, 30 1983, Crotone, Italy
2005 Bachelor’s Degree in Business Administration
Università degli Studi di Firenze
2007 MSc (Laurea Specialistica) in Advanced Business Administration and Control
Final mark: summa, cum laude
Università degli Studi di Firenze
2009/2010 Visiting PhD student at the Energy Markets Group, London Business School
Working papers
“Regulating the development of renewable energy: Review of orientations and modelling strategies”,
mimeo, IMT – Institute for Advanced Studies, Lucca
“The Delicate Art of Regulating the Development of Renewables Generation” (jointly with Derek
Bunn), mimeo, London Business School
“Wind power and security of supply”, mimeo, IMT – Institute for Advanced Studies, Lucca
Presentations
“The Delicate Art of Regulating the Development of Renewables Generation”
Presented at -International Conference on Economics and Management of Public Utilities -
Università del Piemonte Orientale, Novara and Università Commerciale Luigi Bocconi,
Milano
xiv
Abstract
The thesis analyses some features of the liberalised electricity markets, from the perspective of its dealing with the
development of renewable energy. It does so by following essentially three broad topics.
The introduction starts from a short discussion on the debate on renewables currently in place in the EU, focusing
on the issue of financing their development through incentives for investors in the sectors. Here I also state the research
questions and the motivation behind this research.
The dissertation is composed of three parts. In the first part, I try to put the discussion in its proper frame by
analysing in detail the functioning of the electricity markets and the different approaches used by the economic literature
to address its modelling. I start by the essentials, explaining why these markets need to be regulated, why there are
subsidies to support the renewables in the first place, and how can these subsidies be economically justified. Then I
classify the different approaches that have been used to model power markets and highlight the most important works.
The second part analyses some different market structures to enhance the investment in renewable energies. An
agent-based model is utilised that represents a wholesale electricity market, characterised by ten symmetric firms that
compete through a uniform auction. The model allows us to monitor the pattern of wholesale prices, profits and,
through some indicators, the probability of investment. The simulations aim at analysing the effects of larger share of
wind power on wholesale prices and investment in the electricity market. This chapter shows many interesting results,
most notably that subsidies to enhance wind energy deployment may not be as essential as it seems after a certain stage.
Furthermore, we account for the possibility of firms to act strategically by withholding some of their capacity to
artificially increase prices, and see how the results are affected by this circumstance.
In Chapter 4, the discussion is moved towards security of supply, and how it is affected by wind penetration. Since
the very beginning of the electricity liberalisation process, one of the key questions posed has been whether the market
let on its own would have been able to provide adequate security of supply at the power generation level, or if some
additional regulatory mechanism needed to be introduced instead. The risk of underinvestment in generating capacity is
particularly severe in the case of peaking plants, i.e. the generating plants that are used in case of an unanticipated peak
of demand and that are the instrument par excellence to manage the issue of system reliability. This section discusses the
features and the limits of the energy only markets (i.e. a system with the least intervention possible by regulators) and on
the mechanisms to coordinate investments in new capacity such as capacity payments.
Then I use again the agent-based model developed in Chapter 3, adapting it for the different purposes of this
research. The simulations aim at analysing how an increasing share of wind impacts on the security of supply, and from
this the discussion is led on the implication the results have in terms of policy both to increase capacity and to increase
renewable energy.
The results show that in times of high demand the peaking price is lower for generators with wind than for
generators that do not have wind in their technology portfolio. The conclusions are the following: there is need to
coordinate incentives in renewables and incentives in new capacity, because the incentives for renewables basically are
incentives in order to build new capacity, and having two types of incentives to get the same outcome is inefficient. I
argue that an adequate and differentiated development of energy from renewable sources lessens the need for incentives
in building new capacity; existing fossil fuels plants can become peaking units and be replaced as baseload units by the
new renewable-energy units.
1
1 Introduction
“If wind power made sense, why would it need a government subsidy in the first
place? It’s a bubble which bursts as soon as the government subsidies end.”
Ben Lieberman, Senior Economic Analyst at the Heritage Foundation
1. 1 Background
Public support for renewable energy is mainly motivated by environmental concerns. In economic theory,
damages caused by emissions are considered a negative externality: the social cost of a market activity is not
covered by the private cost of the activity hence the market outcome is not efficient and may lead to over-
consumption of the product. A tax equal to the amount of the negative externality may correct the market
outcome back to efficiency (Pigouvian tax). Following the classical argument by Coase (1960), the
introduction of property rights for a clean environment and subsequent trading of pollution rights can
induce an efficient use of pollutants. When property rights do not exist, government intervention is required
under the form of taxes, subsidies, or tradable emission permits. Economic theory has usually been sceptical
about the use of subsidies, arguing that they may induce excessive entry, unnecessary investments and
general inefficiency of the market.
A second argument in favour of government intervention to promote renewable energy relates to
concerns about sustainable development, i.e. the scarcity of exhaustible raw material. Hotelling (1931)
argued that competitive markets for exhaustible goods guarantee an efficient dynamic allocation: the
increasing scarcity of these resources should be reflected in increasing prices, leading to an optimal
depletion path. However, empirical evidence does not support the predictions of this theory. On the
contrary, Solow (1974) and Hartwick (1978) argue that in a framework with finitely-lived, overlapping
generations markets do not guarantee efficient intergenerational allocation of exhaustible goods because
present generations tend to over-consume the exhaustible good. According to Hartwick (1978), for reasons of
intergenerational fairness, an (altruistic) government should invest into durable capital for later generations.

2
Of course in reality the burden of investment cannot be borne by government only; there is need for an
appropriate level of investment by private equity and by generation companies themselves. However, the
government has the important role of regulating the way in which the share of investment (with all the
consequences that it brings, such as irreversibility, risk and also profit/loss) must be distributed among
stakeholders, namely consumers, producers and investors. Theory suggests that differences in regulation are
particularly important in determining investment incentives. In classical economics of regulation literature
cost-based or rate-of-return regulation is generally thought to lead to over-investment (Averch and Johnson,
1962), while incentive price regulation is often considered as introducing the risk of under-investment in the
longer run (Armstrong and Sappington, 2006). In the case of regulation of renewables, there are several
approaches, including feed-in tariffs, fiscal incentives, competitive tender schemes, voluntary green pricing
and mandatory requirements (such as purchase obligations); yet, a general dichotomy of support models has
arisen: Feed-in tariffs on the one side and green certificates (or Renewables Obligation, RO) on the other.
Feed-in tariffs (FiT) are effectively long-term contracts where electricity companies promise to buy
renewable energy generated and fed into the grid at a certain price for long-term periods, while RO requires
electricity suppliers to source a growing percentage of the electricity they sell from renewable sources each
year; suppliers meet this obligation by purchasing renewable electricity from an accredited generator, along
with a Renewables Obligation Certificate (ROC) for each MWh of energy purchased.
Both models have their advantages and drawbacks in terms of ecological effectiveness and economic
efficiency; FiT are generally deemed to be useful to attract investment in the sector, since they provide a high
degree of insurance, while it is believed that RO lead to more efficiency. It often occurs that the two systems
are used together, in an integrated fashion. With all due differences and cautions, we can consider
instruments of the type of feed-in tariffs as a mechanism underlying the same rationale of the rate of return,
and RO as a sort of incentive regulation (only in the sense that they aim at creating competitive efficient
behaviours, since the mechanisms are very different).
1.2 The EU Renewable Energy Directive
Renewable energy development is an extremely hot topic in the European economic and political debate.
The EU's new strategy for sustainable growth and jobs, called 'Europe 2020', has innovation and green
growth at the core of its blueprint for competitiveness.
Within this program, the EU Renewables (RES) Directive requires member countries to produce a pre-
agreed proportion of energy consumption from renewable sources, such that the EU as a whole shall obtain
at least 20% of total energy from renewables (not just zero-carbon technologies) by 2020. After the European
Parliament and the Council agreed upon the RES Directive in December 2008, it entered into force in June
2009. The directive defines the RES targets for all individual Member State, based upon its share of
renewable energy production in 2005 and its per capita GDP.
The Directive has also put in place interim targets in order to ensure progress towards the 2020 target:
1. 25% of target between 2011 and 2012;
2. 35% of target between 2013 and 2014;
3. 45% of target between 2015 and 2016;

3
4. 65% of target between 2017 and 2018.
Member states are free to decide upon the most suitable mix of renewable energy sources to be used to
meet their respective targets but they are required to report their progress towards the interim and 2020
target every two years, starting from 2010.
There will be no financial penalties if a member state should fail to meet its interim targets, but the
European Commission has reserved the right to take legal action against member states that fail to
demonstrate sufficient progress towards the interim targets.
Individual member states will be able to undertake joint measures to meet their respective targets,
including import ‘physical’ renewable energy from countries outside the EU and trading any excess
renewable energy ‘credits’ it has after meeting its interim targets.
The Directive also requests that member states encourage the use of small scale renewable energy in
buildings and provide priority grid access to renewable energy sources.
National Renewable Energy Targets for Member States
Share of energy from renewable sources in
gross final consumption of energy, 2005
(S2005)
Target for share of energy from renewable
sources in gross final consumption of energy,
2020 (S2020)
Belgium 2,2 % 13 %
Bulgaria 9,4 % 16 %
Czech Republic 6,1 % 13 %
Denmark 17,0 % 30 %
Germany 5,8 % 18 %
Estonia 18,0 % 25 %
Ireland 3,1 % 16 %
Greece 6,9 % 18 %
Spain 8,7 % 20 %
France 10,3 % 23 %
Italy 5,2 % 17 %
Cyprus 2,9 % 13 %
Latvia 32,6 % 40 %
Lithuania 15,0 % 23 %
Luxembourg 0,9 % 11 %
Hungary 4,3 % 13 %
Malta 0,0 % 10 %
Netherlands 2,4 % 14 %
Austria 23,3 % 34 %
Poland 7,2 % 15 %
Portugal 20,5 % 31 %
Romania 17,8 % 24 %
Slovenia 16,0 % 25 %
Slovak Republic 6,7 % 14 %
Finland 28,5 % 38 %
Sweden 39,8 % 49 %
United Kingdom 1,3 % 15 %
Table 1 National Renewable Energy Targets for Member States -Source: http://eur-lex.europa.eu/
If properly transposed into national law throughout Europe, this will become the most ambitious piece
of legislation on renewable energy in the world. Because of slow progress in heat and fuels so far, Europe's

4
20% renewable energy target is going to require a significant contribution from the electricity sector -
potentially as much as 40% electricity from renewable sources by 2020 - (Newbery 2009).
1.3 Economic implications
From an economic perspective, this process will lead to a main consequence: a gradual substitution of the
high marginal cost fossil fuel technologies (coal and gas) which currently set market prices, with a
technology mix composed of low or zero operational costs, although high investment cost recovery needs.
This implies that the market clearing prices can no longer be determined by short-run marginal cost
considerations, because this would prejudice the sustainability of the required capital investment.
To increase the use of renewable energy and meet the targets set up by EU with the constraints recalled
above, there is quite evidently the need for an appropriate design of the market. Each member state has
selected a support mechanism or a combination of two or more instruments to support the production of
electricity from renewable energy sources. Currently the debate, as well as the interesting question, is about
which mechanism or which combination of these mechanism, is more adequate to reach long-term
mitigation targets, i.e. a financially sustainable increase of energy produced by renewable sources.
The purpose of this thesis is to contribute to this debate by analysing which is the most efficient market
structure to enhance the investment in renewable energies and how different renewables policies impact on
the pattern of electricity wholesale prices. Why wholesale prices? Because, together with the cost of capital,
they determine the profit that investors are going to get, and their return on investment. The return on
investment is the figure investors will eventually look at when deciding whether to invest or not. Therefore,
what we are ultimately trying to do is to derive some useful implication on investment decisions.
An ideal market structure should fulfil to a number of criteria: it should foster competition and entry,
leading to an efficient electricity dispatch; provide incentives for timely, efficient and adequate investment in
renewables, reflecting comparative advantage; allow R&D support without distortion and guarantee a
secure supply at an acceptable cost to final consumers. Furthermore, prices should reflect the social cost of
carbon and should embed at least part of the capital requirements for new investment.
It is clear that it is not easy, if not impossible, to design a market structure able to satisfy to all these
requirements. However, we can still look for second best options
1.4 Research questions and motivation
This research investigates on the effect of subsidies for renewable energy on the investment decisions in the
sector. In particular, it addresses the problem in the following terms:
- Which are the most probable outcomes if the market is regulated only through an auction mechanism?

5
- Are subsidies so crucial for the development of renewables? Could market power help reducing the amount of subsidies paid to firms?
- How do mechanisms to enhance renewables affect security of supply?
The relationship among market power and investment with respect to the development of generation
from renewable sources may not be straightforward, but it actually plays a crucial role.
To shed some light on the three questions, and particularly on the last two, let us start from the clear
consideration that, in order to meet the targets set by the EU, a large amount of investment is needed. The
investment in this sector is characterized by some degree of risk and uncertainty, mainly linked to:
• the future remuneration of the investment, due to investment irreversibility and specificity, and uncertainty about the mix of technologies that could be most appropriate;
• the volatility of carbon and electricity prices;
• the post-2012 European Emission Trading Scheme (ETS), i.e. the medium and long term commitment on policies concerning energy;
• the potential of competitiveness of clean energy power with respect to carbon technologies available at a lower cost.
All these aspects considered, there are, as often occurs in Economics, two opposite views on which
should be the proper market design, and particularly the role of competition to efficiently foster the
investment in RES. Many analyses show that the switch to renewable generation, particularly wind, is likely
to considerably increase the volatility of spot prices; furthermore, it is likely that the resulting market will be
more concentrated (Poyry 2009). Both volatility and market power are conditions that could induce firms to
not invest or to postpone investment, nonetheless, the presence of market power could be a sort of guarantee
of returns on firms’ investments. In other words, on one hand, it is thought that allowing generators to have
some market power could guarantee the desired level and the proper timing of investment; on the other
hand, increasing competition could be a tool to diminish the value of the option to delay investment.
Empirical results show that, indeed, competition has not a direct effect to investment but acts indirectly
through its correlation with uncertainty (Bulan and Sanyal 2009). A preferred, socially optimal outcome
would be reached only allowing a considerable rent to the firm, (measured in terms of market power or in
terms of mark up), and this fact would raise issues of desirability within a social benefit perspective.
As for reliability of supply, capacity payments have been looked at as a possible solution to face the
uncertainty associated with the switch to renewable generation and they have been adopted in some EU
countries, like Spain and Ireland, as well as in some countries with large hydro plants, like Brazil. What we
can learn from these countries’ experience is that capacity payments alone are often not a solution to manage
the sustainment of RES, mainly because their level of adequacy is not easy to assess and also because it is
questionable if they are financially sustainable in the long run.
There is a general concern in many countries that competitive wholesale markets for electricity do not
provide adequate incentives for investment in sufficient quantities of generating capacity or an efficient mix
of generating capacity consistent with acceptable reliability criteria. Furthermore, new and more stringent
targets on renewables shares are being put in place, creating new investment opportunities but also new
uncertainties. These concerns may create barriers to full implementation of efficient electricity sector
liberalization and to the development of renewable energy. Furthermore, there is now extensive empirical
evidence that these concerns are valid, at least in some wholesale markets, and thus they cannot be easily
dismissed. These two problems are intimately linked, because a larger share of renewables in the technology
portfolio may imply less security of supply, and therefore the need for adequate security of supply
mechanisms is very urgent. One important source of the problem is the failure of wholesale spot markets for
energy and operating reserves to produce prices for energy during periods when capacity is fully utilized to

6
meet the demand for energy and operating reserves that are high enough to support investment in an
efficient (least cost) portfolio of generating capacity. These themes will be thoroughly discussed in Chapter 4.
The research questions are addressed using an agent-based, computational learning model that
simulates a stylised market, looking at its key factors to see how their pattern evolves in time and changing
the policy instrument.
However, before going through this task, it will be convenient to review the existing literature on
electricity market modelling first and on renewables policies thereafter, to understand grounds, limits and
new tendencies, and so it will be done in the following chapter.

7
2 Literature survey of orientations and
modelling strategies
2.1 Electricity Market Modelling Approaches
After the wave of liberalisation that has arisen since the early 1990s electricity markets have profoundly
changed, becoming increasingly complex. Conventional economic models appeared not adequate anymore
to build up insights on the strategic behaviour of firms competing in the market. However, in those years of
profound changes, economists have attempted to revise the theory and keep it in line with the times.
In general, the theoretical framework of the modelling of electricity markets at microeconomic level
falls under three classes: equilibrium models, optimisation models and simulation models (Ventosa et al.
2005). We will examine the first two in the remainder of this section and dedicate the next section to
simulation models. At the end of each section a synoptic table summarises the main works reviewed in it.
2.1.1 Equilibrium models
Equilibrium models use equilibrium methods to derive market prices that maximize the profits of
participants. In some cases, the authors adapt data from real markets to fit the equations they derive and to
make predictions about market behaviour. In his review of equilibrium models, Kahn (1998) analyses the
main two types of equilibrium resulting from firms in oligopolistic competition: Supply Functions
Equilibrium (SFE) and Cournot equilibrium.
Supply function equilibrium models are probably the most well-known and standard approach to
model electricity markets; they rely on the model by Klemperer and Meyer (1989)1 although this it is not a
model specifically conceived to be applied on electricity markets. Klemperer and Meyer showed that, in
absence of uncertainty and knowing competitors’ strategic variables, each firm has no preference between
expressing its decisions in terms of a quantity or a price, because it faces a unique residual demand. When a
firm faces a range of possible residual demand curves, however, it expects a greater profit in return for
exposing its decision tool in the form of a supply function (or offer curve) indicating those prices at which it
1 Another work that has been influential under this aspect is Laussel (1992).

8
is willing to offer various quantities to the market. This approach has proven to be an attractive line of
research for the analysis of equilibrium in wholesale electricity markets, and have been extremely successful
in the 1990s.
The supply function equilibrium is found solving a set of differential equations instead of the typical set
of algebraic equations that arises in traditional equilibrium models, where strategic variables take the form
of quantities or prices. This fact poses severe limitations on the numerical tractability of these models.
Furthermore, they rarely include a detailed representation of the generation system under consideration; this
is a serious problem when dealing with electricity markets that are characterised by complex structures that
deeply influence firms’ behaviour. Currently it has been proposed that their main utilisation could be to
obtain reasonable medium/long-term price estimations (Ventosa et al. 2005), but as shown by Baldick (2002)
the parameterisation of the supply function model has a significant effect on the calculated results and yields
results that are a consequence of the assumptions in the parameterisation of the model.
To sum up, the major drawbacks of SFE models are that they are difficult to calculate, might have
multiple equilibria, might give unstable solutions and require strong simplifications with respect to market
and cost structures.
The most famous works adopting this approach – applying it to electricity markets in an oligopolistic
environment – have been Green and Newbery (1992), Bolle (1992) and Green (1996). Green and Newbery
(1992) present an empirical analysis for England and Wales using symmetric players to analyse the effects of
market power. They compare the duopoly of National Power and PowerGen with a hypothetical five firm
oligopoly, concluding that the latter results in a range of supply functions closer to marginal costs and hence
that allowing entry is beneficial for the market. Bolle (1992) theoretically analyses the possibility of tacit
collusion when bidding in supply functions. He concludes that if firms coordinate on bidding the highest
feasible supply function, a decrease in market concentration does not necessarily result in convergence of
aggregated profits to zero. Green (1996) has attempted to overcome some of the shortcomings of SFE
models, by developing the theory of linear supply functions. These functions are easier to solve, can also be
used in asymmetric games and generally give stable and unique equilibria, but do not account for capacity
constraints and imply a very important oversimplification of the reality: the use of continuous supply
function, assuming that it could be an approximation of the (true) discrete supply function.
Cournot models are simple to calculate, but their results often do not represent reasonable market
outcomes. Since the model outcome is based only on quantity competition, the results are highly sensitive to
assumptions about demand elasticity; for realistic values of demand elasticities, prices are too high and
output too low, because most electricity markets have few oligopolistic firms and low, short-term demand
elasticities. The assumptions underlying a Cournot solution correspond to the Nash equilibrium in game
theory. At the solution point, the game outcomes, i.e. the quantities dispatched, fall into an intermediate
zone between fully competitive and collusive solutions. In effect, a second firm becomes a monopolist over
the demand not satisfied by the first firm, a third over the demand not satisfied by the second, and so on.
Cournot and SFE models make different assumptions regarding the strategy space and the information
set of the bidding firms. In a Cournot equilibrium the demand realization is known by the firm before
bidding, while in SFE models firms cannot condition their bids on the demand realization.
SFE models are generally deemed to represent electricity markets more realistically than Cournot
because they assume that generators, instead of one single quantity, compete by bidding complete supply
functions in an oligopolistic market with demand uncertainty.
Sioshansi and Oren (2007) make an empirical analysis of a supply function equilibrium model in the
Texas spot electricity market, adding capacity constraints to the model. They find that larger firms more or
less behave according to the SFE for incremental bids, and that adding capacity constraints to SFE models is
9
useful because their outcome reflect the actual bidding behaviour of the firms: they bid low for low levels of
supply and have a steep supply function for greater levels of supply.
Willems et al. (2009) compare SFE and Cournot equilibrium by calibrating both models to the German
electricity market using identical demand and supply specifications, both models are calibrated to the
German electricity market. They find out that each model explains almost the same fractions of the observed
price variations and therefore suggest using Cournot models for short-term analysis, since these models can
accommodate additional market details, such as network constraints, and the SFE model for long-term
analysis since it is less sensitive to the calibration parameters selected.
An interesting application of SFE model is the one by Genc and Reynolds (2004) that formulate a model
in which generation capacity constraints can cause some suppliers to be pivotal. Pivotal suppliers are the
producers that can substantially raise the market price by unilaterally withholding generation output;
especially in periods of high demand, these can play a crucial role in electricity markets, but the literature
has not given much attention to these players. Genc and Reynolds propose symmetric and asymmetric
versions of the model, showing that the presence of pivotal suppliers reduces the set of supply function
equilibria and that the size of the equilibrium set depends on observable market characteristics such as the
amount of industry excess capacity and the load ratio2. As the amount of excess capacity falls or the load
ratio increases, the set of supply function equilibria becomes smaller; the equilibria that are eliminated are
the lowest-priced, most competitive equilibria.
A very famous and extended approach for modelling electricity markets is based on the work by von
der Fehr and Harbord (1993) on auctions. Their paper focuses on England and Wales post-deregulation
electricity market, analysing the bidding behaviour of two competing generation companies. They assume
constant marginal costs and constrained capacity, and assume that this information is common knowledge;
allowing for the capacity constraints is a quite relevant improvement with respect to supply function
equilibrium models, considering that it is often the constrained capacity of the generation company that
determines its strategy.
The most important contribution of this paper is probably the structure of the bid that is assumed to be
a price for a determined amount of electricity; such price is conformed to reality in the sense that it must be
strictly positive and not infinitesimal. In other words, they adopt a step supply function instead of a smooth
continuous differentiable one. Von der Fehr and Harbord “cast some doubt on the relevance of the model
analysed by Green and Newbery”3, because, they argue, their assumptions on the supply side of electricity
can lead to misleading outcomes.
Since it is so used and so innovative, let us go through this model with more accuracy. Here the
specifications of the model:
- N independent generators
- nc : constant marginal cost, n= 1, 2, …, N
- nk : total capacity of generator n; each generator has m generating units
- nm : generating unit of generator n
- nik : capacity of the ith set, i= 1, 2, …,
nm
- ∑ =i nni kk
2 The load ratio is the ratio of minimum demand to maximum demand. 3 Von der Fehr and Harbord (1993), p. 532.

10
Firms simultaneously submit their bids for the whole production capacity of each producer. After that
demand is realised and subsequently the auctioneer constructs a ranking of units that are allowed to
produce (also called merit order) on the basis of the lowest prices offered; this ranking will become the
market supply function. Finally, a system marginal price is computed by the auctioneer, based on the lowest
price at which supply matches demand. The electricity produced is paid at this system marginal price.
The model is solved by looking for Nash equilibria: they find out that the existence and the type of
equilibrium crucially depends on the structure of the demand distribution, hence they distinguish among
three cases: low demand periods, high demand periods and variable demand periods. They show that pure
equilibria exist in a limited number of cases, such as, for example, if the number of bidders necessary to
match demand is known before the auction. Pure equilibria are somehow more likely in periods of low
demand; in this case if only one firm is allowed to produce, the system marginal price will be the cost of the
competitor and there will be a unique equilibrium. The reason why pure strategy equilibria are so rarely
attained depends on the fact that in times of high demand a generator is sure that it will not be able to serve
the whole market hence it has an incentive to bid above marginal cost. In this sense, the findings by von der
Fehr and Harbord (1993) are not very different by Green and Newbery (1992); both works, in fact, predict
inefficient pricing.
Von der Fehr and Harbord model has been extended, modified, analysed by a number of authors
especially in the auction literature, but the examination of these works goes beyond the purposes of this
review.
2.1.2 Optimisation models
Optimisation models are formulated as a single optimisation program in which one firm seeks to maximise
its profit. There is a single objective function to be optimised subject to a set of technical and economic
constraints. On this respect, they substantially differ from equilibrium and simulation models that consider
the simultaneous profit maximisation problem of each firm competing in the market. An important
advantage of the use of such models is that powerful and well-known optimisation algorithms exist to solve
them. Optimisation models can be classified into two main types, according to the way in which price is
modelled: price modelled as an exogenous variable and price modelled as a function of the demand
supplied by the firm object of the study.
The first class of models is only able to represent markets under quasi-perfect competition conditions
because it does not incorporate the influence of the firm’s decisions on the market clearing price; the second
class of models explicitly considers the influence of a firm’s production on price.
In the context of microeconomic theory, the behaviour of one firm that pursues its maximum profit
taking as given the demand curve and the supply curve of the rest of competitors is described by the so-
called leader-in-price model (Varian, 1992). In such models the amount of electricity that the firm of interest
is able to sell at each price is given by its residual-demand function (Ventosa et al. 2005).
There are quite a number of authors that use optimisation models to model electricity markets; for the
purpose of this work, one interesting example is the paper by Szabò and Jaeger-Waldau (2008) that examine
how increased competition in electricity markets may reshape the future electricity generation portfolio and
its potential impact on the renewable energy within the energy mix, focusing their attention on
photovoltaics. They show that more competition can be beneficial for the development of RES, because

11
otherwise RES support would become too expensive to be sustainable and most of all because a more
competitive structure would bring more innovative power technologies into the least cost electricity
generation portfolio. They use an inter-temporal investment optimisation model using non-linear
programming algorithm.

12
Electricity Market Modelling Approaches
Author(s) / year Approach Main Findings
Klemperer and Meyer
(1989)
Theoretical model of an
oligopoly facing uncertain
demand; each firm chooses
as its strategy a "supply
function" relating its
quantity to its price
A firm facing a range of possible residual
demand curves expects a greater profit using
the form of a supply function indicating
those prices at which it is willing to offer
various quantities to the market
Green and Newbery
(1992)
SFE: Analysis of the effects
of market power Allowing entry is beneficial for the market
Bolle (1992)
SFE: theoretical analysis of
the possibility of tacit
collusion when bidding in
supply functions
If firms coordinate on bidding the highest
feasible supply function, a decrease in
market concentration does not necessarily
lead to the competitive outcome
Green (1996) SFE with linear supply
functions
Functions easier to solve, can also be used in
asymmetric games and generally give stable
and unique equilibria
Sioshansi and Oren
(2007)
Empirical analysis of SFE
model with capacity
constraints in the Texas spot
electricity market
Larger firms more or less behave according
to the SFE for incremental bids, bidding low
for low levels of supply and having a steep
supply function for greater levels of supply
Genc and Reynolds
(2004)
SFE with generation
capacity constraints that
cause some suppliers to be
pivotal
Presence of pivotal suppliers reduces the set
of supply function equilibria; as the amount
of excess capacity falls or the load ratio
increases, the set of supply function
equilibria becomes smaller; the equilibria
that are eliminated are the lowest-priced,
most competitive equilibria
von der Fehr and
Harbord (1993)
Analysis of the bidding
behaviour of two competing
generation companies in the
post deregulation scenario
of England and Wales
Pure strategy equilibria are so rarely attained
because in times of high demand a generator
has an incentive to bid above marginal cost
Szabò and Jaeger-
Waldau (2008)
Inter-temporal investment
optimisation model to
analyse how increased
competition could affect
electricity generation
portfolio
More competition beneficial for the
development of RES because a more
competitive structure would bring more
innovative power technologies into the least
cost electricity generation portfolio
Table 2 Electricity Market Modelling Approaches

13
2.2. Simulation models: Agent Based Simulation
Recently, new approaches have begun to be used to study the dynamics of the market: beyond empirical and
theoretical approach, the use of computational simulation is able to explain the functioning of the energy
market within a complex and integrated perspective.
Simulation models typically represent each agent’s strategic decision dynamics by defining a set of
sequential rules that agents have to follow. In an electricity market those rules might represent a scheduling
of generation units or the construction of offer curves that include a reaction to previous offers submitted by
competitors. The advantage of a simulation approach is that it allows program almost any kind of strategic
behaviour. On the other hand the assumptions made in the simulation must be theoretically justified
otherwise the results yield by the model might be hardly interpretable and reliable.
Some simulation models are closely related to equilibrium models. For example, Day and Bunn (2001)
propose a simulation model that constructs optimal supply functions, to analyse the potential for market
power in the England and Wales Pool. This approach has many similarities to the SFE scheme recalled
above, yet the analysis is conducted in a more flexible framework that considers actual marginal cost data
and the asymmetric behaviour of firms.
A subfield of simulation models that is attracting increased attention for the modelling of electricity
markets is agent-based simulation. To explain the rationale behind agent based models, we refer to the
remarkable work by Tesfatsion4 and Amman et al. (2006).
An agent-based model (ABM) is a class of computational models used to simulate the actions and
interactions of autonomous agents in order to assess the effects of individual decisions and interactions on
the system as a whole. It combines elements of game theory, complex systems, emergence, computational
sociology, multi-agent systems, and evolutionary programming. The models simulate the simultaneous
operations and interactions of multiple agents, in an attempt to re-create and predict the appearance of
complex phenomena. Their purpose is usually to highlight the emergence and consequences from the lower
level of systems to a higher level. As such, a key notion is that simple behavioural rules generate complex
behaviour. This principle is known as K.I.S.S. ("Keep it simple stupid", a concept first introduced by Robert
Axelrod (1997)) and together with the principle that the whole is greater than the sum of the parts, it is
extensively adopted in the modelling community.
Agents are typically characterized as boundedly rational, presumed to be acting in what they perceive
as their own interests, such as reproduction, economic benefit, or social status, using heuristics or simple
decision-making rules; furthermore, they may experience learning, adaptation, and reproduction.
The idea central to agent based models is to study systems that are complex in the sense that they are
composed of interacting units and that they exhibit emergent properties, that is, properties arising from the
interactions of the units that are not properties of the individual units themselves.
The systems resulting from the interactions of the agents create real world-like complexity. The
responsive and purposeful behaviour of agents is encoded in algorithmic form in computer programs. The
modeller makes assumptions thought most relevant to the situation at hand and then watches phenomena
emerge from the agents' interactions. The outcome of a simulation can be an equilibrium, as well as an
4 See http://www.econ.iastate.edu/tesfatsi/ace.htm for information about the different kind and possible applications of agent-based methods.

14
emergent pattern, but, as said before, to have interpretable results, it is necessary to refer to a theoretical
apparatus that is consistent with the assumptions made.
Agent-based models can explain the emergence of higher order patterns, such as the sizes of traffic
jams, wars, and stock market crashes, and social segregation that persists despite populations of tolerant
people (Schelling, 1978). These models are particularly useful to identify moments in time in which
interventions have extreme consequences, and to distinguish among types of path dependency.
In Economics, agent based models have been used since the 1990s to solve a variety of business and
technology problems. Examples of applications include supply chain optimisation and logistics, modelling
of consumer behaviour, social network effects, workforce management, and portfolio management; in
general, these tools can be used to test how changes in individual behaviours will affect some system's
emerging overall outcome.
The interactions within an electricity market constitute a repeated game, whereby a process of
experimentation and learning changes the behaviour of the firms in the market (Roth and Erev, 1995).
Therefore, as Banal-Estanol and Rupérez Micola (2010) point out, simulations have emerged as a natural
way to study the operations of deregulated electricity markets. An important part of the literature employs
behavioural methods, with firms modelled as interacting, boundedly-rational agents.
Agent-based simulation provides a flexible framework to explore the influence that the repetitive
interaction of participants exerts on the evolution of wholesale electricity markets. Static models don’t take
into account that agents have good memory and learn from past experiences to improve their decision
making and adapt to changes in several environments. This suggests that adaptive agent-based simulation
techniques can shed light on features of electricity markets that static equilibrium models ignore.
Two of the pioneer works that have employed ABM approaches in the study of electricity markets are
Curzon-Price (1997), who used a genetic algorithm to study the strategic bidding behaviour of a generating
duopoly, and Hamalainen (1996) who modelled the individual behaviour of electricity consumers in
demand-side management schemes. Curzon-Price studied the England and Wales electricity market
simulating the repetition of two sellers competing through a uniform price auction. He concluded that
deregulation does not lead to competitive prices if it still yields some residual monopoly.
Day (1999) used the supply function equilibrium approach, with each agent making the assumption
that all other agents would compete as they did in the previous period. When played through time, this
model (it is a so called “best response” model) allowed agents to learn highly complex strategic behaviour
strikingly similar to that in the England and Wales Pool and revealed a high degree of tacit collusion and
market power in the industry.
Bower and Bunn (2000) present an agent-based simulation model in which generation companies are
autonomous adaptive agents that participate in a repetitive daily market and search for strategies that
maximise their profit on the basis of the results obtained in the previous session. Each firm bids prices at
which it offers the output of its plants and is assumed to pursue two main objectives: a minimum rate of
utilisation for their generation portfolio and a higher profit than that of the previous day. The only
information available to each generation company consists of its own profits and the hourly output of its
generating units. As usual in these models, the demand side is simply represented by a linear demand
curve. Such a setting allowed the authors to test a number of potential market designs relevant for the
changes that have occurred in England and Wales wholesale electricity market. In particular, they compared
the market outcome that results under the pay-as-bid rule to that obtained when uniform pricing is
assumed. Additionally, they evaluated the influence of allowing companies to submit different offers for
each hour, instead of keeping them unchanged for the whole day. The conclusion is that daily bidding
together with uniform pricing yields the lowest prices, whereas hourly bidding under the pay-as-bid rule
leads to the highest prices.

15
Bunn and Oliveira (2001) developed a simulation platform to study the functioning of NETA after its
introduction in the UK5. The agent-based platform turned out to be an ideal environment to study the effects
of the application of a new policy, since it allows a detailed description of the market, the use of discrete
supply functions, different marginal costs for each technology and the interactions between different
generators. Bunn and Oliveira’s model represents in detail the way that market clearing in NETA was
designed to function. This platform models the interactions between the Power Exchange and Balancing
Mechanism, taking into account that generators may own different types of technologies and takes into
account the learning dynamics underlying these markets as a process by which a player selects the policy to
use in the game by interacting with its opponents. In a successive work, they adapt and extend this
simulation model to analyse if the two particular generators in the Competition Commission Inquiry had
gained enough market power to operate against the public interest (Bunn and Oliveira, 2003).
This literature review of agent based models has the aim of being as homogeneous as possible; we
include only models of wholesale electricity market with some basic common features. The reason of this
choice is that there are a lot of models built using different design and features, and it is difficult to assess
whether they are actually well founded and justified; furthermore, the intrinsic difference in the conceiving
of the models make comparisons among them hard. Even if the works that we have recalled above have
often proved to describe well the market and to have in some cases even a predictive potential from a
practical point of view, there has been little scientific attempt or chance to evaluate their relative explanatory
performance.
As a matter of fact, agent based models have received several other criticisms in the scientific
community. A basic trade-off exists between analytical tractability and descriptive accuracy; the more
accurate and consistent is the model and the more numerous the number of its parameters, the higher is the
risk that the model cannot be solved analytically. By contrast, the more abstract and simplified the model,
the more analytically tractable it is. The neoclassical paradigm has privileged analytical tractability, while
ABM aims at accuracy. Both approaches have shortcomings: oversimplification undermines the validity of
the policy implications of the models, but conversely handling too many parameters makes hard to control
for their effects that as a result are not clear and somehow difficult to track.
There is in general a perceived lack of robustness in AB modelling, and that is due to the fact that often
models are isolated one from another, and that scarce attention is dedicated to their validation. As we will
discuss later on, there is no agreement on standard techniques to build and verify AB models. It has been
argued that developing a set of commonly accepted protocols for AB model building would greatly benefit
the success of ABM among economists (Windrum et al., 2007).
Finally, there is an unclear relationship between agent based models and empirical data, in the sense
that it is not clear if and in which sense empirical data are adequate to validate ABM. Through validation the
modeller tries to evaluate the extent to which her model is a good representation of the unknown process
that generated a set of observed data in the real world, but it may well be that although procedures are
basically correct, real world data yield different outcomes with respect to reality only because of apparently
negligible details.
5 NETA (New Electricity Trading Arrangements) is the name of the system under which electricity is traded in the
United Kingdom's electricity market. NETA came into force on 27th March 2001, and since April 2005, it changed its name to BETTA, British Electricity Trading Transmission Arrangements, and expanded to become the single Great Britain electricity market of England, Wales and Scotland. For more information on NETA see Ofgem document: http://www.ofgem.gov.uk/Markets/Archive/The%20review%20of%20the%20first%20year%20of%20NETA%20A%20review%20document%20Vol%201.pdf

16
2.2.1 Tendencies in ABM approaches: a discussion
The works analysed in the literature are pioneer since they showed that agent based model can provide a
useful contribution to the research in electricity markets, and thereafter a number of authors have started to
think to electricity markets as complex adaptive systems that can be modelled through simulation platforms.
Even large firms, like Gaz de France, E.ON, Shell and the UK’s Competition Commission have started to be
interested in the potentialities of this technique, and have commissioned researches and analyses to
specialists in this field.
However, as said above, this technique is not faultless. There is one particular disadvantage that is
certainly serious: there is no consensus or systematisation on the techniques appropriate for each situation.
As a consequence, simulation results are often not comparable (Fagiolo et al., 2007).
As pointed out by Banal-Estanol and Rupèrez Micola (2010), one recurring problem in papers that use
ABM is that some of them do not specify the initial conditions, or specify them without going through detail.
As pointed out in the section on literature of electricity markets modelling, some papers use stepwise
schedules to model the supply part of the market, while in others sellers bid linearly increasing functions.
Furthermore, there are different ways in which the modeller can choose the rules to govern firm
behaviour; in general there are two main types of behavioural algorithms: reinforcement learning (RL), in
which firms tend to repeat actions that led to positive outcomes and avoid those that were detrimental, and
best response algorithms. RL is based on the law of effect and on the law of practice, meaning respectively
that actions that result in more positive consequences are more likely to be repeated in the future, and that
learning curves tend to be steep initially and then flatten out. RL has the advantage that it is not necessary to
make assumptions on the information that players have about each other’s strategies, history of play and the
payoff structure. This is consistent with the fact that, in many cases, electricity traders cannot observe one
another’s current strategies, and only imperfectly infer them from volatile prices. On the other hand, RL
might be too simplistic to fully capture the strategic opportunities available to humans (Banal-Estanol and
Rupèrez Micola, 2010).
Best response algorithms follow in general two patterns: fictitious play (FP) and "Cournot" best
response (BR). In FP each player assumes that her opponents play stationary, possibly mixed, strategies. In
each round, the player best responds to her opponent’s empirical frequency of play. BR implies that the
player only responds to her opponents’ move in the directly precedent period. Banal-Estanol and Rupèrez
Micola (2010) investigate on the reliability of the results obtained with RL, FP and BR in the electricity
context; they find out that fictitious play algorithms provide results that differ substantially from reality,
while best response and reinforcement learning give very good results, although they depend on the initial
conditions: if there is no information on bids then RL outperforms BR, because in this environment agents
base their decisions only on history, while BR gives better results in the opposite case.

17
Modelling Approaches Using Simulations
Author(s) / year Approach Main Findings
Day and Bunn (2001)
Simulation model that
constructs optimal
supply functions
Large potential for market power in the
England and Wales Pool
Curzon-Price (1997)
ABM: Genetic algorithm
to study the strategic
bidding behaviour of a
generating duopoly in
England and Wales
Deregulation does not lead to
competitive prices if it still yields some
residual monopoly
Day (1999)
ABM with supply
function equilibrium
approach (Best Response
model)
High degree of tacit collusion and
market power in England and Wales
Pool
Bower and Bunn
(2000)
ABM: generation
companies as
autonomous adaptive
agents that participate in
a repetitive daily market
Daily bidding with uniform pricing
yields the lowest prices, whereas hourly
bidding under the pay-as-bid rule leads
to the highest prices
Bunn and Oliveira
(2001)
Simulation platform to
study the functioning of
NETA in the UK
Underline of the learning dynamics of
these markets
Table 3 Modelling Approaches Using Simulations
2.3 Literature on renewables policies
The theme of the investment in renewables is relatively new in the literature. Until not so long ago, the
discussion was led along the comparison between quantity-based versus price-based systems. In other
words, the debate among climate policy scientists was about which of the two approaches is more adequate
to reach long-term mitigation targets, if renewable portfolio standards or feed-in tariffs.
It seemed to be commonplace in the early days of this analysis that quantity-based systems outperform
price-based systems in terms of economic efficiency, at least from a theoretical point of view (see among
others Drillisch and Riechmann, 1998; Kühn, 1999).
However, the practical implementation of the various systems has increasingly showed that, as often
occurs, the realities of markets and policymaking processes don’t always follow the elegance of economic

18
models. The main streams of literature use case studies and model simulations to analyse different aspects
of the interaction between RES support schemes and the electricity market.
2.3.1 Theoretical and empirical case studies
Mitchell (2000) showed that in UK Non-Fossil Fuel Obligation (NFFO) scheme (quantity-based) failed to
deliver the quantities of renewable energy generation that it had aimed for. Even though the design of the
scheme was not the only factor contributing to the scheme’s failure, a comparison of effectiveness seemed to
result in a lead for price-based systems as they had been introduced in Denmark, Germany and Spain. In a
more recent update of the UK versus Germany comparison, Butler and Neuhoff (2004) point out that not
only has the UK system been less effective, but they can also not find evidence for a higher efficiency, since
prices paid for the amount of wind power that has actually been fed into the grid are in the same order of
magnitude in both countries, despite poorer wind resources in Germany.
Attempts to explain the success of feed-in tariffs in effectively increasing the share of renewables have
highlighted the fact that it provides lower risk to investors compared to other support mechanisms
(Menanteau et al., 2003; Langniss, 1999; Lüthi and Wüstenhagen, 2008).
This view could be theoretically and empirically founded by some part of the financial literature,
showing that greater uncertainty and investment irreversibility due to capital specificity significantly reduce
investments (Bulan, 2005; Bulan et al., 2009).
Mitchell (2006) argues that the German EEG is more effective at increasing the share of renewables than
the England and Wales RO because it reduces risk for RES generators more effectively. Reducing risk for
generators is important for the simple reason that risk has a price. Reducing risk can make a larger number
of projects attractive, mainly because lowering risk reduces the cost of capital. For the same reason, risk
reduction is also one way of increasing the efficiency of a support mechanism.
However, quantity-based approach has been chosen by the EU as the most likely policy to be
implemented in the future, for feasibility reasons (FiT requires a control over prices and quantities that is
difficult to implement at EU level). Furthermore, even if FiT have proven to be more successful at this stage,
probably for the higher degree of insurance they offer against risk, as showed in Bürer and Wüstenhagen
(2009), in their analysis of policy preferences of private investors in innovative clean energy technology
firms, it is not said that they will be as appropriate in the future, due to sustainability concerns.
This dichotomy between the two systems becomes less relevant in a dynamic perspective. Midttun and
Gautesen (2007), for instance, suggest the use of both kinds of instruments, relating them to the development
stage of the sector.
Several researchers have attempted to predict which will be the effect of a larger share of renewables
(especially wind) in the electricity market. Green and Vasilakos (2010) evaluate the impact of intermittent
wind generation on hourly equilibrium prices and output in Great Britain, using data on expected wind
generation capacity and demand for 2020. In line with the mainstream theory and empirics on this issue,
they find that the volatility of prices is likely to increase. Twomey and Neuhoff (2009) consider the
relationship between wind output and market prices and how they are influenced by market power. They
theoretically show that high levels of output from wind generators will tend to depress the spot price hence
wind generators are likely to receive less than the time-weighted average price of power. In addition, they
show that this effect will be even stronger in presence of market power, since generators with market power
are likely to exercise it to a greater extent in periods of high residual demand.

19
All the analyses have several limits. The works on quantity- versus price- based policies have the limit
to focus their attention on policy instrument only, without taking into account the market design as a whole,
and in analysing their impact on investment decisions, they concentrate on price formation in the short run,
i.e., for given capacities. This leads to at least two important limitations. The first, as said above, is that short
term prices are not a consistent tool to evaluate the performance of firms when a large share of renewable
energy is put in place, because they don’t embed the cost of capital. Secondly, there may be a trade off
between achieving low prices and attracting adequate investment. In addition to this, most of these works
are based on a single country analysis (often UK and Germany).
2.3.2 Model simulations
Although there are nowadays many studies that use simulations to study the electricity market, the
literature on the policy instruments to foster the development of renewables that employs simulations is not
vast and usually limited within research groups. A remarkable example is the research team at Universität
Karlsruhe (TH) and the Fraunhofer Institute for Systems and Innovation Research of Karlsruhe, although
most of their research is focused only on the German market. Some of these researchers have tried to
combine agent-based simulation with linear optimisation models and to integrate in the model long-term
decisions such as investment into power plants. Czernohous et al. (2003) propose to use optimisation
techniques for plant dispatch and trade preparation in addition to decisions on investment. Furthermore, an
innovative aspect is the introduction of a regulator as an agent seeking to reduce emissions of harmful
substances. Sensfuß (2007) conducts an extensive though very technical analysis of the impact of renewables
on the German electric market; he adopts a simulation platform called PowerACE6 Cluster System that
consists of several modules dealing with electricity supply, demand, renewable electricity generation,
electricity markets and the simulation of pump storage plants.
Sensfuß et al. (2008) and Sàenz de Miera et al. (2008) have shown that wind generators can depress
wholesale prices by reducing the average demand for thermal generation. Sensfuß et al. study Germany
using an agent-based simulation platform, PowerACE model (see Sensfuß 2007 and Genoese et al. 2007 for
an extensive description) while Sàenz de Miera et al. study Spain, but in both cases, the estimated impact on
wholesale market prices is roughly equal to the cost of supporting renewable generators. This implies that at
least in the short term the support for renewable generators has come from thermal generators rather than
electricity consumers and that the profit of generation companies is allegedly reduced.
These works are subjected to all the limits seen before for agent based models: there is little
specification of the models and of initial conditions, making comparisons difficult to exploit and sometimes
there is not a thorough validation of the outcomes. For example, Sensfuß et al. (2008) use calibration to
validate their model, although due to the difficulties of matching theoretical and empirical observations, it is
preferable to be agnostic as to whether the details of a model (variables, parameters) can be compared with
empirically-observable ones.
Sàenz de Miera et al. are very careful in validating their model, but they make assumptions that are far
from being innocent, such as constant marginal cost for all plants and perfect competition.

20
Literature on renewables policies
Author(s) / year Approach Main Findings
Mitchell (2000)
Analysis of the Non-Fossil
Fuel Obligation (NFFO) in
the UK
NFFO scheme (quantity-based) failed to
deliver the quantities of renewable energy
generation that it had aimed for
Butler and Neuhoff
(2004)
Empirical comparison
(through interviews)
between UK and Germany
systems
UK system has been less effective, and
there's not evidence for a higher efficiency
Menanteau et al. (2003) Analysis of FiT in Germany
Better outcome in terms of capacity built
because FiT provide lower risk to investors
compared to other support mechanisms
Mitchell (2006)
Analyses two new
mechanisms in detail: the
England and Wales RO and
the German EEG
German EEG is more effective at increasing
the share of renewables than the England
and Wales RO because it reduces risk for
RES generators more effectively
Bürer and Wüstenhagen
(2009)
Analysis of policy
preferences of private
investors in innovative clean
energy technology firms
FiT seems to be preferred by private
investors, but there's sustainability concerns
Midttun and Gautesen
(2007)
Analysis of policy
instruments in a dynamic
perspective
Both kinds of instruments (FiT and RO) are
appropriate, if related to the development
stage of the sector
Green and Vasilakos
(2010)
Empirical evaluation of the
impact of wind generation
on prices and output in
Great Britain
Volatility of prices is likely to increase
Twomey and Neuhoff
(2009)
Theoretical analysis of the
relationship between wind
output and market prices
High levels of output from wind generators
will tend to depress the spot price. Stronger
effect in presence of market power
Sensfuß et al. (2008)
Study of the impact of wind
in Germany using an agent-
based simulation platform
Wind generators can depress wholesale
prices by reducing the average demand for
thermal generation
Sàenz de Miera et al.
(2008)
Empirical analysis and
simulation of the impact of
wind in Spain
Wind generators can depress wholesale
prices by reducing the average demand for
thermal generation
Table 4 Literature on renewables policies
21
2.4 Conclusions
The literature on the interaction among RES support schemes, electricity prices and investment has been
rather theoretical. To reach the ambitious goals set by EU, in terms of RES development, CO2 emissions
reductions and moderate electricity prices for consumers it is crucial that the market yields a “proper”
wholesale electricity price, able to enhance investments in RES but not too welfare-detrimental for
consumers. However, despite the profound policy implications of this topic, we have seen that the empirical
literature is rather scant.
Furthermore, as already noted, almost all the works in this context refer to a specific, typically national
market. That happens for legitimate reasons, since electricity markets are extremely different one from
another, and it would be indeed hard to model a generic market with “universal” characteristics.
Nonetheless the evolutionary pattern of EU policy is going towards a harmonised system of policies that
could be adopted in all member states. The trend is towards quantity based approach, because they provide
more efficiency (at least theoretically, but we have seen before that this is not for granted) and because they
require less control from the top.
This research tries to fill this gap, by analysing the impact of several policies on an “average” market,
of an average western European country. In addition to this, the model – based approach attempts to avoid
the shortcomings seen in other works that use simulation, at least when possible. In the next chapter, we
will describe the theoretical model underlying the simulations, and afterwards the results of the simulations
will be presented.

22
3 Analysing the impact of wind: an agent-
based model6
"The system is not designed to accept that proportion of renewables."
Jim Detmers, former COO of the California Independent Systems Operator (CAISO),
referring to California’s Renewable Portfolio Standards
3.1 Introduction
Electricity generation is experiencing a period of intense transformation: investment shifts to cleaner
technology as a result of governments’ policies for climate change containment and high fossil fuels prices,
and although fossil fuel generation is likely to stay dominant in the coming years, their share of generation is
expected to decrease from 68% to 55% within 2035, in favour of nuclear and renewable sources (WEO 2010).
In the previous chapter we have discussed the EU Renewables (RES) Directive requiring that 20% of
EU energy to be generated from renewables (not just zero-carbon) sources by 2020. From an economic
perspective, this fact translates into a gradual substitution of the high marginal cost fossil fuel technologies
(coal and gas) which currently set market prices, with a technology mix composed of low or zero operational
costs, although high investment cost recovery needs.
This chapter analyses the impact of larger share of wind power on the pattern of electricity wholesale
prices to derive implications on firms’ investments decisions. Being able to predict the behaviour of firms in
this context is crucial, because it allows a more efficient tailoring of incentives and policies.
The paper will proceed as follows: first, the literature review on the regulation of renewables is
replicated after Chapter 2, in order to clear this paper’s contribution to it. After that, a model-based analysis
is presented that, starting from a benchmark of a perfectly competitive situation, will develop several
scenarios to simulate the effects on prices and on market structure of larger shares of wind power.
6 This chapter is also a paper written jointly with Derek W. Bunn of London Business School. The title of the paper is
“The Delicate Art of Regulating the Development of Generation from Wind”.

23
3.2 Literature review
The theme of the investment in renewables is relatively new in the literature. Until not so long ago, the
discussion was led along the comparison between quantity-based versus price-based systems. In other
words, the debate among climate policy scientists was about which of the two approaches is more adequate
to reach long-term mitigation targets, if renewable portfolio standards or feed-in tariffs.
It seemed to be commonplace in the early days of this analysis that quantity-based systems outperform
price-based systems in terms of economic efficiency, at least from a theoretical point of view (see among
others Drillisch and Riechmann, 1998; Kühn, 1999).
However, Mitchell (2000) showed that in UK Non-Fossil Fuel Obligation (NFFO) scheme (quantity-
based) failed to deliver the quantities of renewable energy generation that it had aimed for. Even though the
design of the scheme was not the only factor contributing to the scheme’s failure, a comparison of
effectiveness seemed to result in a lead for price-based systems as they had been introduced in Denmark,
Germany and Spain. In a more recent update of the UK versus Germany comparison, Butler and Neuhoff
(2004) point out that not only has the UK system been less effective, but they can also not find evidence for a
higher efficiency, since prices paid for the amount of wind power that has actually been fed into the grid are
in the same order of magnitude in both countries, despite poorer wind resources in Germany.
Attempts to explain the success of feed-in tariffs in effectively increasing the share of renewables have
highlighted the fact that they provide lower risk to investors compared to other support mechanisms
(Menanteau et al., 2003; Langniss, 1999; Lüthi and Wüstenhagen, 2008). This view could be theoretically and
empirically founded by some part of the financial literature, showing that greater uncertainty and
investment irreversibility due to capital specificity significantly reduce investments (Bulan 2005; Bulan et al.
2009).
Mitchell (2006) argues that the German EEG is more effective at increasing the share of renewables
than the England and Wales RO because it reduces risk for RES generators more effectively. Reducing risk
for generators is important for the simple reason that risk has a price. Reducing risk can make a larger
number of projects attractive, mainly because lowering risk reduces the cost of capital. For the same reason,
risk reduction is also one way of increasing the efficiency of a support mechanism. However, quantity-
based approach is the most likely policy that will be chosen by the EU to be implemented in the future, for
feasibility reasons (FiT requires a control over prices and quantities that is difficult to implement at EU
level)7. Furthermore, even if FiT have proven to be more successful at this stage, probably for the higher
degree of insurance they offer against risk, as showed in Bürer and Wüstenhagen (2009), in their analysis of
policy preferences of private investors in innovative clean energy technology firms, it is not said that they
will be as appropriate in the future, due to sustainability concerns.
This dichotomy between the two systems becomes less relevant in a dynamic perspective. Midttun and
Gautesen (2007), for instance, suggest the use of both kinds of instruments, relating them to the development
stage of the sector.
Several researchers have attempted to predict which will be the effect of a larger share of renewables
(especially wind) in the electricity market. Green and Vasilakos (2010) evaluate the impact of intermittent
7 In the light of this choice made by EU, in our model we will use certificates instead of feed-in tariffs. However, this is
just a technicality that does not influence the substance of the results.

24
wind generation on hourly equilibrium prices and output in Great Britain, using data on expected wind
generation capacity and demand for 2020. In line with the mainstream theory and empirics on this issue,
they find that the volatility of prices is likely to increase. Twomey and Neuhoff (2009) consider the
relationship between wind output and market prices and how they are influenced by market power. They
theoretically show that high levels of output from wind generators will tend to depress the spot price hence
wind generators are likely to receive less than the time-weighted average price of power. In addition, they
show that this effect will be even stronger in presence of market power, since generators with market power
are likely to exercise it to a greater extent in periods of high residual demand.
Although there are nowadays many studies that use simulations to study the electricity market, the
literature on the policy instruments to foster the development of renewables that employs simulations is not
vast and usually limited within research groups. A remarkable example is the research team at Universität
Karlsruhe (TH) and the Fraunhofer Institute for Systems and Innovation Research of Karlsruhe, although
most of their research is focused only on the German market.
Some of these researchers have tried to combine agent-based simulation with linear optimisation
models and to integrate in the model long-term decisions such as investment into power plants. Czernohous
et al. (2003) propose to use optimisation techniques for plant dispatch and trade preparation in addition to
decisions on investment. Furthermore, an innovative aspect is the introduction of a regulator as an agent
seeking to reduce emissions of harmful substances. Sensfuß (2007) conducts an extensive though very
technical analysis of the impact of renewables on the German electric market; he adopts a simulation
platform called PowerACE6 Cluster System that consists of several modules dealing with electricity supply,
demand, renewable electricity generation, electricity markets and the simulation of pump storage plants.
Sensfuß et al. (2008) and Sàenz de Miera et al. (2008) have shown that wind generators can depress
wholesale prices by reducing the average demand for thermal generation. Sensfuß et al. study Germany
using an agent-based simulation platform, PowerACE model (see Sensfuß 2007 and Genoese et al. 2007 for
an extensive description) while Sàenz de Miera et al. study Spain, but in both cases, the estimated impact on
wholesale market prices is roughly equal to the cost of supporting renewable generators. This implies that at
least in the short term the support for renewable generators has come from thermal generators rather than
electricity consumers and that the profit of generation companies is allegedly reduced.
All the analyses have several limits. The works on quantity- versus price- based policies have the limit
to focus their attention on policy instrument only, without taking into account the market design as a whole,
and in analysing their impact on investment decisions, they concentrate on price formation in the short run,
i.e., for given capacities. The model-based analyses are certainly broader and capable to capture more
features of the market, but they are difficult to validate and to compare. In addition to this, most of these
works are based on a single country analysis (often UK and Germany).
Our research purposes are in line with these last branches (effects of wind energy on the market) rather
than on the specific mechanism to regulate renewables. What is new in our approach is first of all the
methodology. Our model is semi-stylised and extremely flexible and immediate to use; this means that it can
be used both to test theoretical speculation and using real data of countries. Moreover our findings and their
interpretation change with respect to the mainstream literature, because even though also our results
suggest a tendency towards lower prices we show that, under certain condition, this fact does not impair the
investments in renewable energy. We could say, in other words, that we look at the bright side.
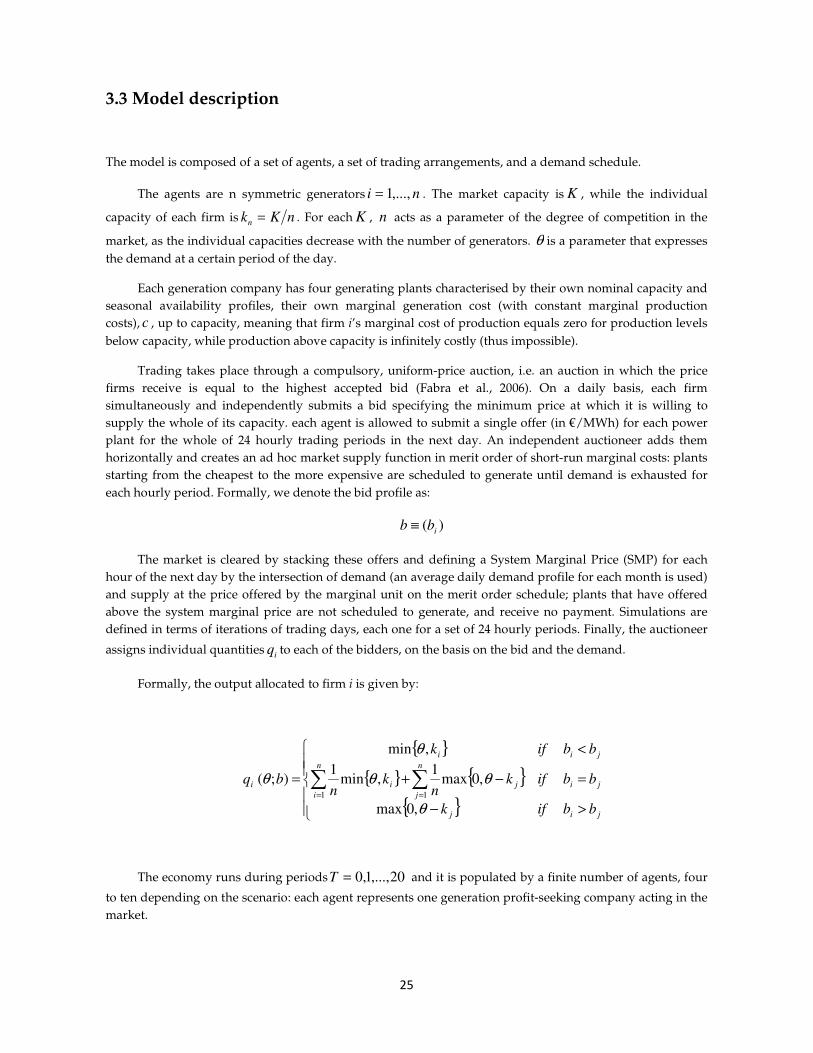
25
3.3 Model description
The model is composed of a set of agents, a set of trading arrangements, and a demand schedule.
The agents are n symmetric generators ni ,...,1= . The market capacity is K , while the individual
capacity of each firm is nKkn = . For each K , n acts as a parameter of the degree of competition in the
market, as the individual capacities decrease with the number of generators. θ is a parameter that expresses
the demand at a certain period of the day.
Each generation company has four generating plants characterised by their own nominal capacity and
seasonal availability profiles, their own marginal generation cost (with constant marginal production
costs), c , up to capacity, meaning that firm i’s marginal cost of production equals zero for production levels
below capacity, while production above capacity is infinitely costly (thus impossible).
Trading takes place through a compulsory, uniform-price auction, i.e. an auction in which the price
firms receive is equal to the highest accepted bid (Fabra et al., 2006). On a daily basis, each firm
simultaneously and independently submits a bid specifying the minimum price at which it is willing to
supply the whole of its capacity. each agent is allowed to submit a single offer (in €/MWh) for each power
plant for the whole of 24 hourly trading periods in the next day. An independent auctioneer adds them
horizontally and creates an ad hoc market supply function in merit order of short-run marginal costs: plants
starting from the cheapest to the more expensive are scheduled to generate until demand is exhausted for
each hourly period. Formally, we denote the bid profile as:
)( ibb ≡
The market is cleared by stacking these offers and defining a System Marginal Price (SMP) for each
hour of the next day by the intersection of demand (an average daily demand profile for each month is used)
and supply at the price offered by the marginal unit on the merit order schedule; plants that have offered
above the system marginal price are not scheduled to generate, and receive no payment. Simulations are
defined in terms of iterations of trading days, each one for a set of 24 hourly periods. Finally, the auctioneer
assigns individual quantitiesiq to each of the bidders, on the basis on the bid and the demand.
Formally, the output allocated to firm i is given by:
{ }
{ } { }
{ }
>−
=−+
<
= ∑ ∑= =
jij
ji
n
i
n
j
ji
jii
i
bbifk
bbifkn
kn
bbifk
bq
θ
θθ
θ
θ
,0max
,0max1
,min1
,min
);(1 1
The economy runs during periods 20,...,1,0=T and it is populated by a finite number of agents, four
to ten depending on the scenario: each agent represents one generation profit-seeking company acting in the
market.

26
Firms use a learning method to choose their supply offer, conditional on their profit history and cost
attributes. All firms immediately and simultaneously post their selected supply offer, so that no firm has a
strategic advantage through asymmetric information.
Profits for each firm are:
( ) iii qcSMP −=π
for ni ,...,1= , where SMP equals the highest accepted bid.
The strategic agents’ offering strategy is driven by a primary objective of reaching a minimum
specified utilisation rate of their plant portfolio and a secondary objective of maintaining or increasing profit
once the primary objective has been achieved. By following these objectives through a computational
learning algorithm, the agents learn the profit-maximising policy, subject to utilisation, for pricing their
plants in the daily auction.
The learning algorithm has the following scheme:
If Current Utilisation Rate • Desired Utilisation Rate �
≤=
>>
−−−
−−−
211
211
tttt
tttt
ifbb
ifbb
ππ
ππ
If Current Utilisation Rate < Desired Utilisation Rate � 1−< tt bb
While the desired rate of utilisation is defined exogenously, the profit objective is pursued
endogenously: each generator is continuously learning to improve performance in the profit objective using
the previous trading day’s profit as a benchmark to evaluate the current day’s performance. There are
several reasons why companies will want to maintain an utilisation target. This could be part of their long-
term market share strategy, or it could reflect prior contracting, or in some cases it could reflect availability
obligations promised to the regulator.
3.4 Research questions and main results
Through simulations, we want to investigate on how some key drivers for the firms’ investment decisions
are affected by a larger share of wind power, and what does this imply in terms of regulatory policies.
For the sake of the first objective, we are going to monitor the pattern of average wholesale prices,
profits and performance of the generation companies as the share of wind power in their technology
portfolio increases. To measure performance, we use the Internal Rate of Return rather than the Net Present
Value, because we are interested in the efficiency of the investment, rather than its magnitude.

27
The Internal Rate of Return is computed iteratively to find a value as precise as possible that makes
zero the sum of the list of the cost of investment spread on three years, as a negative component, plus all the
extra profits coming from the share of wind in the technology portfolio as positive component. In practice
we isolate from the total stream of profits the part that derives from wind implementation starting from the
difference in profits between a no wind scenario and a 10% wind scenario, and go on computing the extra
profit coming from every increment of wind share with respect to the precedent scenario. Finally we
compute the profitability of the investment taking into account the cost of the investment itself.
Box 1
The Internal Rate of Return (IRR)
The internal rate of return (IRR) is a rate of return used in capital budgeting to measure and
compare the profitability of investments. It is defined as the annualized effective
compounded return rate or discount rate that makes the net present value (NPV) of all cash
flows (both positive and negative) from a particular investment equal to zero. Internal rates
of return are commonly used to evaluate the desirability of investments or projects. The
higher a project's internal rate of return, the more desirable it is to undertake the project.
Assuming all projects require the same amount of up-front investment, the project with the
highest IRR would be considered the best and undertaken first. An investment is considered
acceptable if its internal rate of return is greater than an established minimum acceptable rate
of return or cost of capital. Given a collection of pairs (time, cash flow) involved in a project,
the internal rate of return follows from the net present value as a function of the rate of
return. A rate of return for which this function is zero is an internal rate of return.
Specifically, the IRR is the rate that solves this equation:
0=NPV � ∑=
=+
N
nn
n
r
C
0
0)1(
Where n and Cn are respectively period (a positive integer, usually given in years) and cash
flow; N is the total number of periods, and NPV the net present value; the internal rate of
return is given by r.
To investigate the second question, we will discuss the policy implications of the effects pictured in the
analysis described above, also from a market power perspective.
We will explore several scenarios to see if the assumptions we have made are sensitive to the different
sets of the model and if our results hold. Starting from a benchmark case with full symmetry, we will
progressively add more texture to our settings, examining the cases in which the market is an oligopoly, and
introducing asymmetries in size and technology portfolio. Finally, we will examine the case in which a firm
generating energy from wind is a new entrant in a power market with firms that only use fossil fuels.
Before going through the simulations, it is useful to present a short summary of the basic implications
that we envisaged in our results.

28
Proposition 1: in a uniform auction system, a larger share of wind power may lead to higher profits for firms having
wind in their technology portfolio, particularly in periods of high demand. This is due to two main factors. First, to
the lower average operating costs firms face: second, to the larger market share they are able to get. Since
entering in the merit order is a matter of the lowest bid, it is easy for a generation company that produces
wind energy to enter the merit order and satisfy its target demand. These considerations point to:
Proposition 2: a larger share of wind power is likely to yield lower average wholesale prices.
Proposition 3: in general, profits coming from wind energy are likely not to be enough to cover the investment costs of
increasing wind capacity. The cost of capital in wind projects is extremely high, because of the cost of wind
turbines and of the low load factor. Considering that the efficiency of wind turbines is not yet completely
satisfying, and that wind itself is variable, investment in wind power is far from being riskless.
3.5 Model-based analysis
3.5.1 Benchmark case with no strategic interactions
We start from a benchmark case of a stylised competitive market, in which agents do not have market
power, do not act strategically and own an equal share of the technology mix available in the market. Agents
are ten symmetric generation companies that produce electricity using the following technology mix: coal,
gas, oil and wind. Each firm owns 12 plants (3 plants for each technology).
Figure 1 shows the technology portfolio that is composed in the following way: 40% coal, 40% gas, 10% oil,
10% wind.
Installed Capacity by Technology
21142, 40%
5286, 10%
21142, 40%
5286, 10% , 0%, 0%, 0%, 0%, 0%, 0%, 0%Gas
Wind
Coal
Oil
Fuel 5
Fuel 6
Fuel 7
Fuel 8
Fuel 9
Fuel 10
Others
Figure 1 Initial technology composition for each firm
We make the following assumptions:

29
1. Existing plants are fully depreciated. This assumption allows us to consider in the statement of firms’ performances only profits and capital costs coming from new wind plants, in order to evaluate the profitability of an investment in new wind capacity.
2. Firms decide to invest in wind generation sequentially. First, they opt for a partial substitution of oil with wind energy, whose nominal capacity gradually increases from 10% to 15%, and then from 15% to 20% of the technology portfolio. Firms choose to replace oil because it is the technology with the highest marginal costs, hence the most expensive for them. In a second moment, firms operate another partial substitution of both oil and coal with wind energy that will increase from 20% to 30%, then from 30% to 40%, from 40% to 50%, and finally from 50% to 55% of the technology portfolio; firms choose to replace also coal because after having reduced their operating costs, they can “afford” to think about reducing the emissions, sacrificing a share of the highest carbon dioxide emitting technology. Lastly, a sharper increase of wind share in the technology portfolio, going from 55% to 60% replaces only part of coal share in the technology portfolio.
3. The new wind capacity replaces the existing fossil fuel capacity. Although it is improbable that existing plants will suddenly disappear, this assumption is necessary for the purposes of our research, at least at this stage, to fully isolate the effect of wind on wholesale prices. Therefore, substituting a technology with another becomes merely a strategic decision of the firms8.
Although the shares of wind in examination appear to be high, actual capacities are more or less a
third than the nominal ones, because the load factor of wind is usually on average 0.3. The maximum
demand in Mega Watt Hour is assumed to be 68,850, which is more or less the peak demand of a heavily
industrialised European country, like Germany.
Figures in MWh TOTAL PER FIRM PER PLANT
TOTAL CAPACITY 82,620 8,262 2,754
COAL CAPACITY 33,048 3,305 1,102
GAS CAPACITY 33,048 3,305 1,102
WIND CAPACITY 8,262 826 275
OIL CAPACITY 8,262 826 275
Table 5 Capacity figures of the model in the benchmark scenario
Marginal costs of the different technologies are non homogeneous across plants; we allow plants to be
more or less efficient even if using the same technologies. Coal and gas costs are incremented to account for
carbon price, linked to the emissions of carbon dioxide per MWh. Currently, the carbon price is oscillating
around 15 € per ton of carbon emitted, and therefore 15 € is the figure that we have used, but it is important
to bear in mind this price is far from being stable. Only wind costs 0 for all plants.
8 Actually, to have perfectly precise computations, it would be necessary to include in the analysis also the cost of dismantling non
active plants.

30
Fuel Lowest value Highest value
COAL 30 73.3
GAS 35 75
WIND 0 0
OIL 100 120
Table 6 Range of marginal costs. Data averaged for Europe, source: IEA, OECD
Since wind is a technology at practically zero marginal cost, we expect that replacing with it some
more expensive energy the profit contribution of firms would surely increase. However, it is equally clear
that we should also account for the cost of capital that is extremely high in wind projects. Actually, the main
parameters governing wind power economics are indeed investment costs, including auxiliary costs for
foundation, grid-connection, and so on. Of these, the most important parameters are the wind turbines’
electricity production and their investment costs. Even though investment costs per kW have decreased in
these last years, they are still very high. Capital costs of wind energy projects are dominated by the cost of
the wind turbine itself; a medium sized turbine (850 kW to 1,500 kW) sited on land in Western Europe
typically accounts for a little less than 80% of the total cost (EWEA 2009). The total cost per installed kW of
wind power capacity differs significantly between countries, with costs varying from approximately 900
€/kW to 1,200 €/kW. This means that for a medium size turbine, the required capital cost is approximately
1,200,000 €.
As stated in Proposition 3, there would be little chance of recovering such high capital costs in a
reasonable time, unless charging unacceptable high prices to consumers. Firms would not operate with a
positive return, and as a consequence, nobody would invest in wind generation. That is why we include in
our computations the value of green certificates (see Box 2) deriving from the current regulation in place in
several EU countries, averaging their current value to 0.5 Euro/KWh9. The amount of the certificates is really
significant, and it accounts for about ten times the “true” level of profits deriving from a larger share of
wind. Such transfers allow the generation companies not only to survive in the market, but also to get an
IRR in line with a standard average calculated over a time period of 23 years, 3 years for the project
implementation, in which they bear only capital costs, and 20 years of profit streams deriving by the share of
wind power in the technology portfolio.
Since returns from green certificates are so generous, would it be natural to presume the more wind
firms have the more their performance improves? The answer is not necessarily. Increasing the share of
wind power in the technology mix, in fact, improves firms’ IRR to really important levels, as can be seen in
Figure 2, but it is interesting to note that the IRR decreases if the firm further invests to increase its share of
wind from 20% to 30%. This result is of course due to the higher capital costs required for larger wind
projects. Looking at the graph, it can be noted that smaller increases in capacity tend to yield higher
investment performance improvements. We’ll come back later on this point.
9 The value of green certificates has a wide range across European member states, and also across technologies. It may
be low, around 20 Euro/MWh, as it happens in Scandinavian countries, or very high, around 100 Euro/MWh, as it
happens in Italy. Also in the US the price of certificates varies a lot across states.
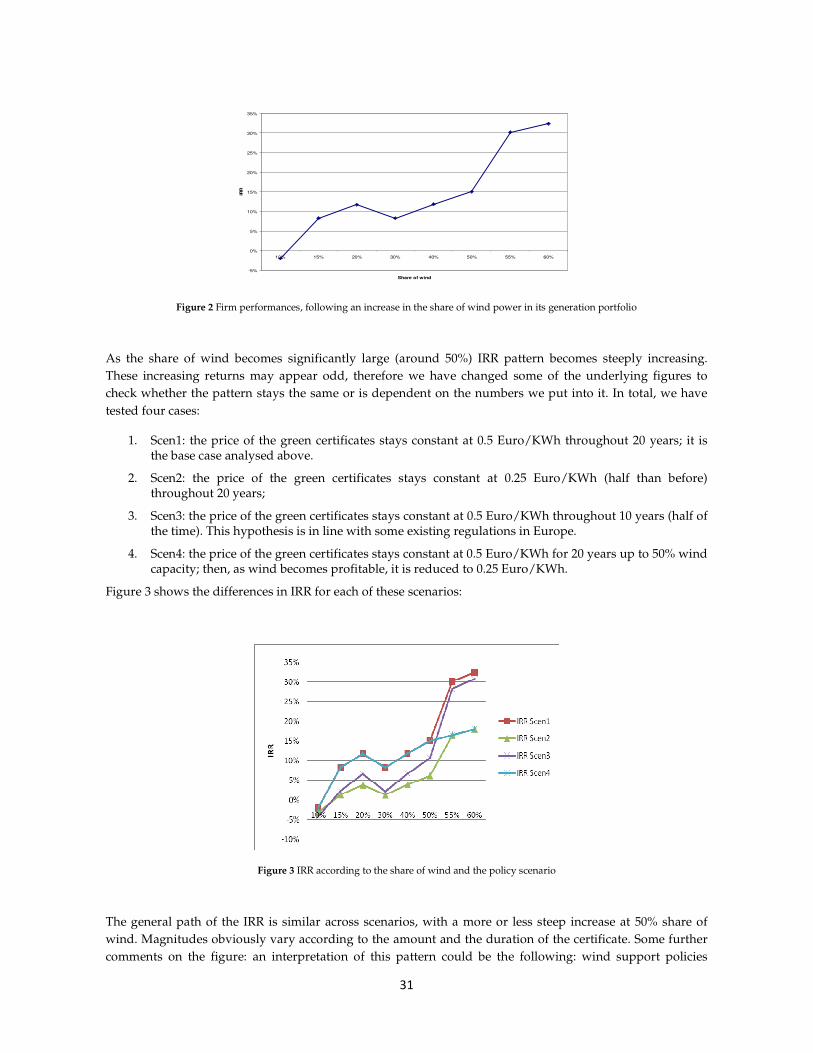
31
-5%
0%
5%
10%
15%
20%
25%
30%
35%
10% 15% 20% 30% 40% 50% 55% 60%
Share of wind
IRR
Figure 2 Firm performances, following an increase in the share of wind power in its generation portfolio
As the share of wind becomes significantly large (around 50%) IRR pattern becomes steeply increasing.
These increasing returns may appear odd, therefore we have changed some of the underlying figures to
check whether the pattern stays the same or is dependent on the numbers we put into it. In total, we have
tested four cases:
1. Scen1: the price of the green certificates stays constant at 0.5 Euro/KWh throughout 20 years; it is the base case analysed above.
2. Scen2: the price of the green certificates stays constant at 0.25 Euro/KWh (half than before) throughout 20 years;
3. Scen3: the price of the green certificates stays constant at 0.5 Euro/KWh throughout 10 years (half of the time). This hypothesis is in line with some existing regulations in Europe.
4. Scen4: the price of the green certificates stays constant at 0.5 Euro/KWh for 20 years up to 50% wind capacity; then, as wind becomes profitable, it is reduced to 0.25 Euro/KWh.
Figure 3 shows the differences in IRR for each of these scenarios:
Figure 3 IRR according to the share of wind and the policy scenario
The general path of the IRR is similar across scenarios, with a more or less steep increase at 50% share of
wind. Magnitudes obviously vary according to the amount and the duration of the certificate. Some further
comments on the figure: an interpretation of this pattern could be the following: wind support policies

32
appear to be needed at their implementation phase, while their usefulness sensibly reduces in the following
phases. The figure also suggest that the best policies would combine high certificate prices in the first
penetration phase and subsequently reduced values of the certificates as wind penetration becomes more
steady.
Box 2
What are green certificates?
Green certificates are tradable certificates giving evidence of renewable energy generation.
They provide a benefit to their holders, who may use them to comply with their obligation to
inject a certain quota of renewables into the power grid.
The certificates system aims at promoting the development of renewable electricity
production and is technology neutral, in the sense that it covers different kinds of renewable
energy sources. This should theoretically allow the enhancing of the most cost-effective
production of renewable electricity.
The electricity certificate system has a target that defines how much new renewable
electricity production must be developed by a certain date. The target is then broken down to
the annual growth rate necessary to attain the target. To create a demand for electricity
certificates, there is the so called quota obligation system. A quota obligation is an annual
obligation on the part of electricity suppliers to hold electricity certificates corresponding to
their sale and use of electricity during the previous calendar year.
Producers of electricity from renewable energy sources receive an electricity certificate for
every MWh of electricity produced. By selling these certificates, the generator receives an
extra income in addition to the sale of electricity making it profitable to invest in new
renewable electricity production. The principal idea behind a certificate system is that the
payment producers of renewable electricity receive from selling the certificates they are
awarded should cover the extra costs involved in producing renewable electricity in
comparison with conventional electricity. The certificate price should, theoretically,
correspond to the difference between the marginal cost of renewable at a determined
quantity - Q (mc*) and the market price for electricity (PE).

33
Finally, it is useful to spend some words on the pattern of average wholesale prices. As stated in Proposition
2 and as can be noted in Table 2 below, prices are sensibly affected by the larger share of wind in the
technology portfolio, with a definite trend to a decrease in prices as the share of wind increases.
Wind share Avg prices (high demand) Avg prices (low demand)
10% 68.767 63.863
15% 68.225 63.863
20% 66.771 61.363
30% 65.858 60.500
40% 65.317 59.013
50% 62.817 58.300
55% 61.971 57.438
60% 61.971 56.604
Table 7 Average wholesale prices according to the wind share
These results are in line with many studies on the subject; in particular, some simulations have showed
that a probable effect of the growing share of wind generation will be to reduce average prices and that those
prices will tend to become very spiky (see among others Poyry 2009).
Adding some other low marginal cost alternative technology such as nuclear energy (but it could as
well be hydro power) to the technology portfolio does not alter this trend; on the contrary, wholesale prices
fall further, as can be noted in the Figure 4, where average daily prices are computed assuming that 25% of
electricity in the technology portfolio is generated using nuclear energy, with low but nonzero, differentiated
across plants marginal cost.

34
Average Daily Prices
0.000
10.000
20.000
30.000
40.000
50.000
60.000
70.000
80.000
90.000
0% 10% 15% 20% 30% 40% 50% 55% 60%
Wind share
Avera
ge p
rices
Avg prices (high demand) Avg prices (low demand)
Avg prices (high demand w/nuclear) Avg prices (low demand w/nuclear)
Figure 4 Comparison of average daily prices with and without nuclear energy
A comparison of firms’ performances measured by IRR is not very informative here, because it is too heavily
influenced by the amount of green certificates; therefore it yields an IRR pattern almost identical to the case
without nuclear. To appreciate the difference, Figure 5 shows the variation in profits streams for the same
firm with and without nuclear, as the share of wind in the technology portfolio increases. It can be noted that
when nuclear energy (or an equivalent low marginal cost source) is in the technology portfolio stream of
profits when investing in wind projects tends to decrease, while it tends to increase in the scenario without
nuclear energy. This result suggests that investment in wind when there already is a significant share of
energy produced using some low marginal cost energy (like hydro or nuclear) is less attractive, apart from
being less economically justified.
Difference in profits with and without nuclear
-
10,000,000
20,000,000
30,000,000
40,000,000
50,000,000
60,000,000
0% 10% 15% 20% 30% 40% 50% 55% 60%
Share of Wind
Pro
fit
FIRM 1 PROFITS W/O NUCLEARFIRM 1 PROFITS WITH NUCLEARDifference between NUCLEAR VS W/O NUCLEAR
Figure 5 Difference in profit streams of firm 1 with or without nuclear energy in its technology portfolio
Of course, one could argue, electricity markets are certainly not perfectly competitive, and European
generation firms are indeed not symmetric, considering the fact that many incumbents still hold their
dominant position. Nevertheless, we can still draw some useful insights. First of all, this first simple sketch
seems to confirm Proposition1-3. It is indeed Proposition 3 that needs some more words to be spent. It is
clear that investing in wind is not profitable per se; if we would let the market work by itself and under
perfectly competitive conditions nobody would ever invest in wind technology, because even if it has

35
marginal costs close to zero, its capital costs are too high and its load factor too low10 to recover the
investment. What induces firms to invest in wind is the high return given by the regulatory policies (green
certificates in this case, but also feed-in tariffs).
This consideration has profound policy implications. If on one hand support policies are needed and
indispensable in the implementation phase, on the other hand it is legitimate to doubt about the
sustainability of such policies in the long run. In general, the sustainability of any support policy requires
that investment cost reductions should be monitored and, as they are realised, the subsidy in connection
should be reduced as well to offer an additional incentive for faster market penetration.
A second issue to consider from an investor perspective is the regulatory commitment. In our model,
firms operate in an incomplete information environment relying only on their “history” and learning
capacity to take their investment decisions. However, in the complexity of reality firms have some beliefs on
their rivals and the regulator’s behaviour; hence it is crucial that the schemes put in place by the regulator
are credible and that their evolution is made clear in advance.
3.5.2 Benchmark case with strategic interactions
As said above, there are at least two big simplifications in the previous scenario: perfect competition and
firms’ symmetry. Now let us analyse what would happen if we would lessen the first of the two
simplifications, and allow firms to act strategically by adjusting their utilisation rate in order to get higher
profits.
To seek higher profits, it is convenient for the firms to engage in capacity restrictions by selecting a low
minimum utilisation rate; if the company is constrained to set a high utilisation rate, it has less scope to price
up or withdraw capacity.
Our generation companies are symmetric, and they do not operate in a oligopolistic environment,
therefore they are unlikely to set market price, nor would they want to risk being out of merit for even a few
hours per day; nevertheless they may pursue a systematic, seasonal strategy of capacity withdrawal. The
best strategy for them is to withdraw capacity particularly in times of high demand, because they are sure
that they will still be in the merit order even if they use less capacity and they bid prices above the marginal
cost.
As before, it is useful to give a “taste” of the results we obtained before going through the simulations.
Proposition 4: in periods of low demand, the presence of wind lessens the incentive for firms to act strategically, because
the threshold to enter the merit order is lower, and the risk to be excluded from production is higher.
Proposition 5: in periods of high demand, the presence of wind in technology portfolio could favour firms’ decision to
act strategically.
10 The load factor is a very important figure because it is included into the computation of the cost of investment of
generating plants. In general, a high load factor reduces the unit fixed cost of a plant. For example, coal plants have more or less the same overnight cost of wind plants, but since their load factor is high, they are considered cheaper to build up.

36
To clarify these propositions we report a strategic variation of the fully competitive case, whereby each
generator unilaterally seeks to increase prices assuming that the rivals continue to behave competitively. In
each simulation two separate demand scenarios (high and low, respectively for the months of November
and August) will be considered.
We assume that all firms act strategically but one. We shall see that changing the target utilisation rates
as well as the demand scenario (high or low)11 often makes a big difference in the outcomes.
These scenarios are very interesting from a theoretical point of view at least for two reasons:
- they are a form of verification of the good functioning of the model; if the model is still consistent to the theoretical principles underneath it even under “stressful” conditions, we can proceed more safely when we will approach to more realistic cases;
- they show to what extent firms could exploit their market power without a regulator, or a regulated price, even if the market is not an oligopoly. In certain cases, as we will see, firms could be theoretically able to charge prices that are unbearably high; of course it is unlikely that firms indefinitely increase prices, but since the demand for energy is very inelastic, the mere possibility of this fact assumes particular relevance.
Assume there is no wind at all; technology portfolio is split among gas, coal and oil that hold
respectively 44%, 43% and 13% of the share of the technology portfolio.
To seek higher profits, firms strategically withhold some amount of their capacity, and set their
utilisation target low enough (typically 40%-50%). Theoretically, this strategy should work well in periods of
high demand, when firms can exploit the demand for electricity and charge high prices, and work much less
in periods of low demand, when by bidding high prices firms risk not to enter in the merit order because
there is not enough demand to serve.
Let us verify whether these theoretical predictions are confirmed in the model, starting with an
utilisation rate strategically set at 50% by firms 2-10, and firm 1 not acting strategically. As can be seen in
Figure 6 on the left, firms initially bid extremely high prices, and then they learn throughout the repetitions
to bid prices that, although still well above the average marginal cost, are more acceptable.
Average Daily Prices - High Demand
0.0
20.0
40.0
60.0
80.0
100.0
120.0
140.0
160.0
180.0
1 68 135 202 269 336 403 470 537 604 671 738 805 872 939
Iterations
Pri
ce/M
Wh
Average Daily Prices - Low Demand
0.0
10.0
20.0
30.0
40.0
50.0
60.0
70.0
80.0
1 67 133 199 265 331 397 463 529 595 661 727 793 859 925 991
Iterations
Pri
ce/M
Wh
Figure 6 Average daily prices in the scenario of no wind respectively in period of high demand and low demand, with 50% utilisation rate
11 It will be noted that scenarios of high demand receive far more emphasis than scenarios of low demand; that happens
because high demand periods often give more interesting outcomes and are more subjected to the possibility of market power.

37
In the low demand scenario (on the right of Figure 6) firms engage in a battle of prices, ending up in a
sort of Bertrand competition with average price close to marginal cost. It is indeed interesting to see how
strategic firms try to increase the price and are then forced to lower it throughout the repetitions.
Firm 1, that does not act strategically, stops producing as the average price becomes too low. In fact,
the price at which firms bid is not enough for them to get positive profits; therefore suggesting that in low
demand periods withholding capacity is definitely not a profit maximising strategy: they would be better off
if they would not act strategically, exactly as firm 1 does. Firm 1 takes advantage of the high prices and of
the lower production by its rival, producing at a very high utilisation rate in time of high demand and at
lower rates when in period of low demand, and getting higher profits than the others in both cases; we could
call this “the Onlooker effect” (from the saying: “the onlooker gets the best of a fight”).
Rates of Utilization - High Demand
0.00
0.20
0.40
0.60
0.80
1.00
1.20
1
64
127
190
253
316
379
442
505
568
631
694
757
820
883
946
Iterations
% o
f U
tilizati
on
FIRM1
FIRM2 (0.5)
FIRM3 (0.5)
FIRM4 (0.5)
FIRM5 (0.5)
FIRM6 (0.5)
FIRM7 (0.5)
FIRM8 (0.5)
FIRM9 (0.5)
FIRM10 (0.5)
Profit - High Demand
0.00
2000000.00
4000000.00
6000000.00
8000000.00
10000000.00
12000000.00
14000000.00
16000000.00
18000000.00
20000000.00
1
71
14
1
21
1
28
1
35
1
42
1
49
1
56
1
63
1
70
1
77
1
84
1
91
1
98
1
Iterations
$
FIRM1
FIRM2
FIRM3
FIRM4
FIRM5
FIRM6
FIRM7
FIRM8
FIRM9
FIRM10
Rates of Utilization - Low Demand
0.00
0.10
0.20
0.30
0.40
0.50
0.60
0.70
0.80
0.90
1
64
127
190
253
316
379
442
505
568
631
694
757
820
883
946
Iterations
% o
f U
tilizati
on
FIRM1
FIRM2 (0.5)
FIRM3 (0.5)
FIRM4 (0.5)
FIRM5 (0.5)
FIRM6 (0.5)
FIRM7 (0.5)
FIRM8 (0.5)
FIRM9 (0.5)
FIRM10 (0.5)
Profit - Low Demand
-3000000.00
-2000000.00
-1000000.00
0.00
1000000.00
2000000.00
3000000.00
1
71
141
211
281
351
421
491
561
631
701
771
841
911
981
Iterations
$
FIRM1
FIRM2
FIRM3
FIRM4
FIRM5
FIRM6
FIRM7
FIRM8
FIRM9
FIRM10
Figure 7 Rates of Utilisation and Profits for high demand scenario (above) and low demand scenario (below)
Now suppose that firms decide to set their utilisation rate at 40% (firm 1 does not act strategically).
This choice implies that in periods of high demand the electricity produced is just enough to serve the
predicted demand, and it might be not enough in case of unexpected peaks. Firms can then (theoretically)
charge an unlimitedly high price, and that is exactly what happens in our model: as the repetitions go on,
firms eventually realise that there is little limit to their power to increase prices. For the sake of realism, we
run the model with a price cap of 200 € and, as expected, firms learn fast to bid the maximum price they can,
i.e. 200 €.
In a situation of low demand, firms can still act strategically withholding their capacity, though their
ability to increase prices is considerably lower. However, they are still able to charge a very high price and to
get very high profits, as can be seen in Figure 8. Note that the learning pattern of the low demand case with
40% utilisation rate is quite similar to the graph of the high demand case with 50% utilisation rate; this
means that firms could pursue a double strategy throughout the year, adjusting their utilisation rate
according to the demand and maintaining a constant level of profits.

38
Average Daily Prices - Low Demand (40% U.R.)
0.0
20.0
40.0
60.0
80.0
100.0
120.0
140.0
160.0
180.0
1 14 27 40 53 66 79 92 105 118 131 144 157 170 183 196
Iterations
Pri
ce/M
Wh
Profit - Low Demand (40% U.R.)
0.00
2000000.00
4000000.00
6000000.00
8000000.00
10000000.00
12000000.00
14000000.00
16000000.00
18000000.00
20000000.00
1
15
29
43
57
71
85
99
113
127
141
155
169
183
197
Iterations
$
FIRM1
FIRM2
FIRM3
FIRM4
FIRM5
FIRM6
FIRM7
FIRM8
FIRM9
FIRM10
Figure 8 Average daily prices and profits in a scenario without wind and low demand, with 9 firms strategically setting an utilisation target at 40%
It is interesting to observe the behaviour of the non strategic firm that acts like a sort of free rider: it
does not withhold any capacity, but it takes advantage from the capacity withholding of the others: it
produces more as prices go high and less when prices are too low, and it is able to get the highest profits.
From a game theory perspective, firm 1’s behaviour could be seen as the behaviour of a deviating firm
in a collusive agreement without punishment mechanism; of course, in this case all other firms would react
by increasing their utilisation and prices would get lower.
Now we analyse how wind penetration affects the picture that we have drawn. Technology
composition is the one of Figure 1, with 10% of wind share that will be progressively increased up to 60%
(nominal capacity).
The presence of wind in the technology portfolio affects the outcomes because it sensibly lowers the
average marginal cost for the firms. We would expect, as in the benchmark case, a progressive decrease in
prices as the share of wind increases. Actually, as can be seen in Table 8, this event occurs only at times in
the high demand scenario, while constantly in the low demand scenario, where, as seen above, firms engage
in a competition à la Bertrand, bidding at marginal cost. As before, all firms engage in strategic behaviour by
withholding capacity to some extent, except for firm 1.

39
Wind share Average price (high demand) Average price (low
demand)
0% 92.10 61.21
10% 89.60 57.75
15% 103.47 55.44
20% 90.76 55.44
30% 100.41 54.68
40% 88.81 55.44
50% 83.22 52.84
55% 79.33 43.17
60% 79.25 41.98
Table 8 Average daily prices according to wind penetration, with 9 firms strategically setting their utilisation target at 50%
While in low demand periods prices are the lowest possible, in high demand periods with an utilisation rate
of 50%, firms are able to bid at prices higher than in the benchmark case.
Comparison of Average Daily Prices
0.000
20.000
40.000
60.000
80.000
100.000
120.000
0% 10% 15% 20% 30% 40% 50% 55% 60%
Share of Wind
Pri
ce
Avg prices (high
demand - benchmark)
Avg prices (low
demand - benchmark)
Avg prices (high
demand - strategic)
Avg prices (low
demand - strategic)
Figure 9 Comparison of average daily prices of the benchmark scenario and the strategic behaviour scenario, for a utilisation target of 50%
As it happens without wind, a strategic utilisation rate of 40% would give an even steeper outcome and
higher numbers; as before, running the simulation imposing any price cap on the price would give as an
outcome a constant bid of the exact amount of the price cap after few repetitions in times of high demand,
whilst in times of low demand firms learn to bid lower prices throughout the repetitions.

40
Average Daily Prices (30% of Wind - November)
0.0
50.0
100.0
150.0
200.0
250.0
1 12 23 34 45 56 67 78 89 100 111 122 133 144 155 166 177 188 199
Iterations
Pri
ce/M
Wh
Average Daily Prices (30% of Wind - August)
0.0
20.0
40.0
60.0
80.0
100.0
120.0
140.0
160.0
180.0
1 68 135 202 269 336 403 470 537 604 671 738 805 872 939
Iterations
Pri
ce/M
Wh
Figure 10 Average daily prices for periods of high demand(left) and low demand (right), with 40% utilisation rate and a price cap of 200 €, scenario of nominal capacity of wind at 30%
Note that all the considerations about capital cost of wind project and transfer to firms by the regulator
that we have made in the benchmark section with no strategic interactions still apply. This means that in
this scenario a firm who is capable to get high profits by exerting market power also gets transfers by the
regulator, damaging the consumers in three ways:
- by making them pay an essential good far more than a fair price;
- by producing less good than it would be optimal for consumers;
- by receiving public money that it does not actually need. In fact the IRR of a firm that replaces 10% of its capacity with wind is able to recover from the capital cost of the wind project and to get a positive though low IRR in a 20 years’ period:
Increasing the share of wind in the technology portfolio means that bids to enter in the merit order are
altered with respect to before, because a larger part of firms’ capacity is at zero marginal cost.
If firms decide to act strategically they can take advantage of periods of high demand and charge
prices well above the marginal cost. We will discuss the policy implications after having examined also the
other scenarios.
3.5.3 Oligopoly case
This scenario analyses an oligopoly of four firms, with symmetric market shares. As before, we
progressively add more wind power over the other fossil fuels technologies. Since we are in an oligopoly, of
course profits are definitely higher than in the benchmark case. The case of oligopoly is particularly
interesting, because it can be envisaged, with due differences, in real cases, as for example the increased
concentration (caused mostly by mergers) of the German electricity market after the liberalization.
In such context, especially in the case of mergers, firms are naturally subject to become more
interdependent and some or all of the newly merged firms will have an incentive as well as a scope to act
strategically and to implicitly or explicitly coordinate. Should this occur, then market prices would be
expected to rise to a level above industry marginal cost (Bower and Bunn, 2001).
Let us first assume no strategic behaviour; Figure 10 shows that as soon as a consistent share of wind
capacity is implemented, oligopolistic firms get some remarkable performance indicators.

41
IRR pattern for each scenario
-10%
0%
10%
20%
30%
40%
50%
60%
70%
10% 15% 20% 30% 40% 50% 55% 60%
IRR-benchmark-
IRR with nuclear
IRR -oligopoly-
Figure 11 Comparison of IRR patterns for each (non strategic) scenario
This result is rather counterintuitive. It can be partially justified by the lower average costs that firms face,
and also by the higher prices (although decreasing in the share of wind) they charge, as can be seen in Figure
12. Nonetheless, increasing IRR implies increasing returns to scale, but since the cost of investment is
constant and increasing wind penetration both reduces the prices and displaces increasingly more efficient
plant, it would have been natural to expect decreasing returns to scale. The increasing returns are due only
to the increasing weight of the green certificates that are strictly increasing in the MWh of wind energy
produced. The exceptional performances obtained by firms after a certain penetration of wind (namely 40%)
suggest that subsidies may not be as crucial as regulatory policy after a certain wind penetration, especially
when the market is concentrated.
Average Daily Prices
0.000
20.000
40.000
60.000
80.000
100.000
120.000
0% 10% 15% 20% 30% 40% 50% 55% 60%
Wind share
Av
era
ge
pri
ce
s
Avg prices (high demand - benchmark) Avg prices (low demand - benchmark)
Avg prices (high demand - strategic) Avg prices (low demand - strategic)
Avg prices (high demand w/nuclear) Avg prices (low demand w/nuclear)
Avg price (high demand - oligopoly) Avg price (low demand - oligopoly)
Figure 12 Comparison of Average daily prices for each scenario
As said above, the oligopolistic scenario is the classic case in which there is scope for strategic behaviours.
Therefore, it will be useful to see what happens if the firms decide to act strategically by withholding some
of their capacity to seek to get higher profits. Again, we assume that all firms but one engage in strategic
behaviour, and that the strategic firms decide to set their utilisation rate at 50%. That is what we find:
- Average prices are remarkably higher than in the competitive case, especially in times of high demand.

42
- As in the benchmark case, Firm 1 is able to exploit these high prices even more than the strategic firms that have caused them.
Average daily prices - Oligopoly
0
10
20
30
40
50
60
70
80
90
100
0% 10% 15% 20% 30% 40% 50% 55% 60%
Share of Wind
Pri
ce
Avg price (high demand) Avg price (low demand)
Avg price (high demand - strategic) Avg price (low demand - strategic)
Average daily Prices with Strategic Interactions
0
20
40
60
80
100
0% 10% 15% 20% 30% 40% 50% 55% 60%
Share of Wind
Pri
ce
Avg price (high demand - benchmark) Avg price (low demand - benchmark)
Avg price (high demand - oligopoly) Avg price (low demand - oligopoly)
Figure 13 Comparison of average daily prices in oligopoly with and without strategic interactions; Comparison of average daily prices with strategic interactions between the benchmark case and the oligopoly case
Again, setting the utilisation target at 40% allows firms to charge very high prices, (as much as the price cap
in high demand periods) and to obtain exceptionally high profits.
3.6 Model-based analysis adding asymmetry
After having relaxed the perfect competition assumption, it is time to add some asymmetry to our model.
We will add asymmetry in:
1. the size of firms;
2. technology portfolio and capacity of firms.
In this last scenario, we will examine the case of a new entrant wind firm, in a power market composed of
generators using fossil fuels, in order to study the impact of wind penetration more realistically. If we have
built our model correctly, the main results should still hold. In these scenarios, we reduce the firms from 10
to 8, only to simplify the computations.
3.6.1 Asymmetry in size
We assume that 8 generation firms compete in the market for electricity generations: firm 1 is an incumbent
ex monopolist that holds a dominant position; firm 2 and 3 hold significant shares of the market, while all
the others are sensibly smaller competitors.
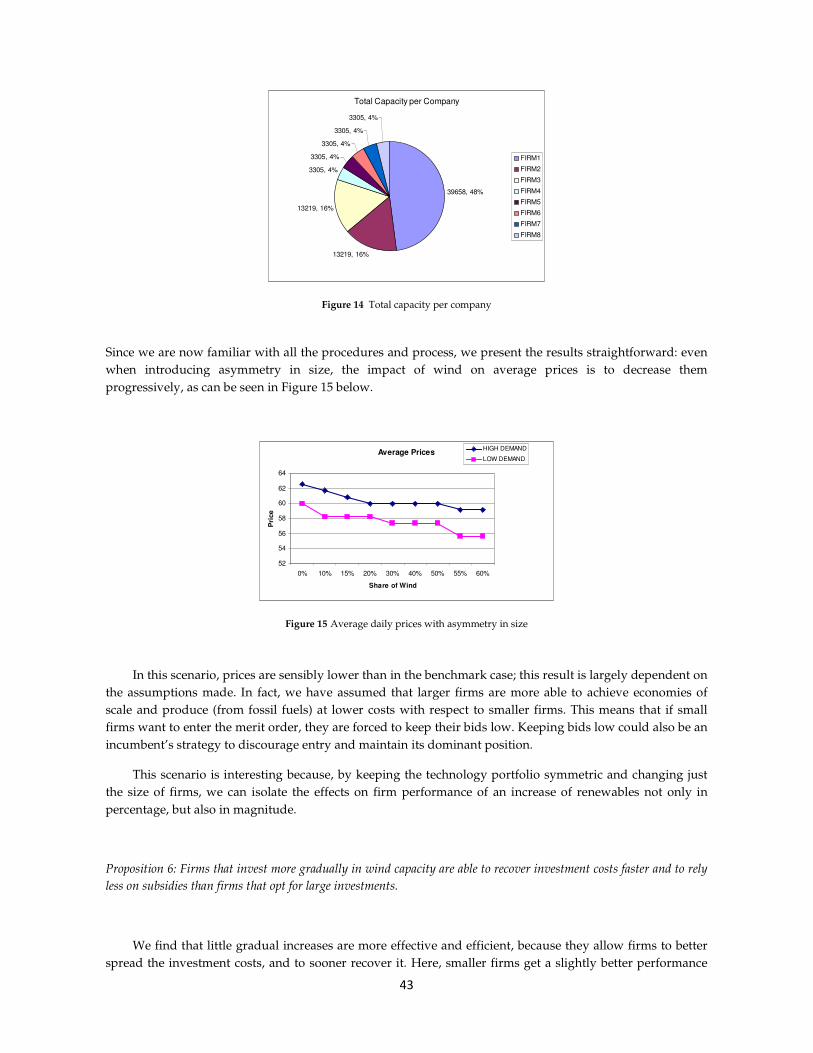
43
Total Capacity per Company
39658, 48%
13219, 16%
13219, 16%
3305, 4%
3305, 4%
3305, 4%
3305, 4%
3305, 4%
FIRM1
FIRM2
FIRM3
FIRM4
FIRM5
FIRM6
FIRM7
FIRM8
Figure 14 Total capacity per company
Since we are now familiar with all the procedures and process, we present the results straightforward: even
when introducing asymmetry in size, the impact of wind on average prices is to decrease them
progressively, as can be seen in Figure 15 below.
Average Prices
52
54
56
58
60
62
64
0% 10% 15% 20% 30% 40% 50% 55% 60%
Share of Wind
Pri
ce
HIGH DEMAND
LOW DEMAND
Figure 15 Average daily prices with asymmetry in size
In this scenario, prices are sensibly lower than in the benchmark case; this result is largely dependent on
the assumptions made. In fact, we have assumed that larger firms are more able to achieve economies of
scale and produce (from fossil fuels) at lower costs with respect to smaller firms. This means that if small
firms want to enter the merit order, they are forced to keep their bids low. Keeping bids low could also be an
incumbent’s strategy to discourage entry and maintain its dominant position.
This scenario is interesting because, by keeping the technology portfolio symmetric and changing just
the size of firms, we can isolate the effects on firm performance of an increase of renewables not only in
percentage, but also in magnitude.
Proposition 6: Firms that invest more gradually in wind capacity are able to recover investment costs faster and to rely
less on subsidies than firms that opt for large investments.
We find that little gradual increases are more effective and efficient, because they allow firms to better
spread the investment costs, and to sooner recover it. Here, smaller firms get a slightly better performance

44
than bigger ones, as can be seen in Figure 16 below. Even though the difference in the IRR appears not to be
large, considering that these firms’ competitors own altogether almost two thirds of the market share, this
result is indeed remarkable. We would expect the incumbent to have far better results than the smaller firms,
and if we look merely at the profits, that’s what we actually obtain. However, when we compute the IRR and
include investment costs for wind capacity, bigger firms who have invested more are worse performers than
smaller firms.
Even more interestingly, smaller firms would be able to recover investment costs by themselves
without subsidies, even though they would not get a satisfying rate of return to justify the investment (i.e.
some form of subsidy should still stay in place).
IRR according to the size of firms and the share of wind
0%
10%
20%
30%
40%
50%
60%
10% 15% 20% 30% 40% 50% 55% 60%
share of wind
IRR
IRR (BIG)
IRR (MEDIUM)
IRR (SMALL)
IRR for small firms
0%
0%
0%
0%
1%
1%
1%
1%
1%
2%
2%
10% 15% 20% 30% 40% 50% 55% 60%
share of wind
IRR
Figure 16 IRR for the scenario of asymmetry in size (left). On the right, the IRR for smaller firms is at least nonnegative; however, it is still too low to encourage investment in renewables
3.6.2 Asymmetry in technology portfolio with a new entrant wind firm
We consider 8 firms competing in the market, each one with different size and technology portfolio.
Firm 2 is an incumbent ex monopolist, and serves a large share of the market; firm 3 is medium sized,
(its size around 15% of total market share) and it produces mainly using oil and gas; firms from 4 to 8 are
much smaller, and produce using only gas or a mixture of oil and gas.
Firm 1 is a generation company that produces using wind and that decides to penetrate the market.
Below in Figure 17 there are the total capacities per company.
Total Capacity per Company
7000, 9%
44139, 54%
12094, 15%
4077, 5%
4460, 5%
2241, 3%
3772, 5%
3518, 4%
FIRM1
FIRM2
FIRM3
FIRM4
FIRM5
FIRM6
FIRM7
FIRM8
Figure 17 Total capacity per firm, with nominal wind capacity at 30%
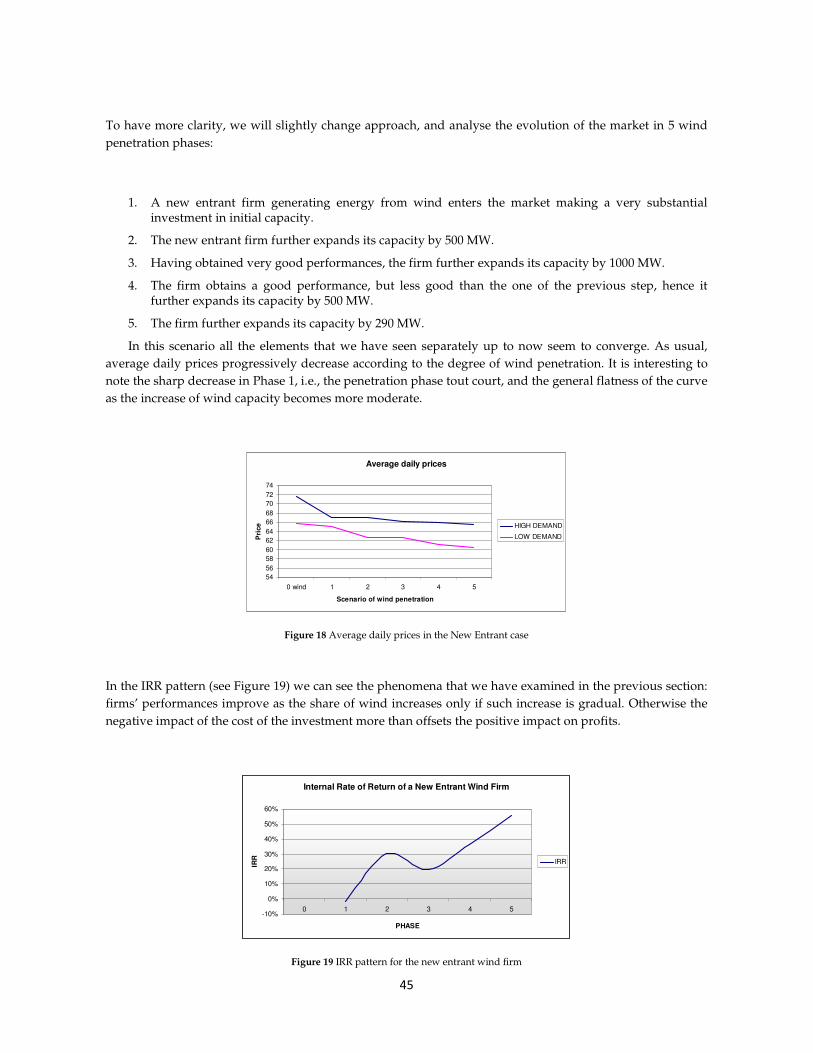
45
To have more clarity, we will slightly change approach, and analyse the evolution of the market in 5 wind
penetration phases:
1. A new entrant firm generating energy from wind enters the market making a very substantial investment in initial capacity.
2. The new entrant firm further expands its capacity by 500 MW.
3. Having obtained very good performances, the firm further expands its capacity by 1000 MW.
4. The firm obtains a good performance, but less good than the one of the previous step, hence it further expands its capacity by 500 MW.
5. The firm further expands its capacity by 290 MW.
In this scenario all the elements that we have seen separately up to now seem to converge. As usual,
average daily prices progressively decrease according to the degree of wind penetration. It is interesting to
note the sharp decrease in Phase 1, i.e., the penetration phase tout court, and the general flatness of the curve
as the increase of wind capacity becomes more moderate.
Average daily prices
54
56
58
60
62
64
66
68
70
72
74
0 wind 1 2 3 4 5
Scenario of wind penetration
Pri
ce HIGH DEMAND
LOW DEMAND
Figure 18 Average daily prices in the New Entrant case
In the IRR pattern (see Figure 19) we can see the phenomena that we have examined in the previous section:
firms’ performances improve as the share of wind increases only if such increase is gradual. Otherwise the
negative impact of the cost of the investment more than offsets the positive impact on profits.
Internal Rate of Return of a New Entrant Wind Firm
-10%
0%
10%
20%
30%
40%
50%
60%
0 1 2 3 4 5
PHASE
IRR
IRR
Figure 19 IRR pattern for the new entrant wind firm

46
From a policy perspective, this means that the regulator could be able to let the firm walk with its own
legs in a shorter period of time.
3.7 Policy Implications
The model results seem to confirm that in the context of the renewable energy technologies the energy
market liberalisation and the energy related climate change policy represent two mutually reinforcing
policies: without liberalisation renewables support would be too expensive and would prevent achievement
of the established targets. Policy instruments are necessary to reduce the risks associated with the duration
and the cost of wind projects, but concerns are arising on the sustainability of such policies in the long run.
We have showed that the impact of wind (and of low marginal cost energies in general) on the market
can be positive, because it may lead to lower prices for consumers and increased profits for firms. We have
also highlighted the crucial role played by incentive mechanisms that have allowed the implementation of
new capacity that would not have been possible otherwise. However, as the targets are met and the
implementation phase is through, it is probably time to rethink the incentives and mechanisms that are in
place, taking into account their sustainability in the long run, and stressing the role of R&D and innovation.
From the sustainability point of view, based on the model results, a cost-effective support scheme for
wind energy should meet the following criteria:
- The support given must be clearly and reliably defined in advance.
- The amount of subsidy (certificates or whatsoever) should be linked to the cost and revenue performance of producers: with a time delay, the support level has to be decreased as bigger market share results in capacity cost reductions. We have seen that as wind penetration increase, often firms no longer need to be subsidized or need less subsidies than in the implementation phase tout court. This would also give the proper indication to the investors not to delay the investment in the production lines. In Proposition 6 we claim that smaller increases in capacity are more efficient than big ones; this means that delaying investment and forcing it all at once is costly not only from an environmental perspective, but also from an economic one.
- To avoid strategic behaviours that can involve abuse of market power, the demand side must be not overlooked. Every policy should be linked to the demand level, because, as we have seen, outcomes may vary greatly according to the demand level.
It is now generally acknowledged that incentives for the investment in renewables must be lessened in
time, because since they are mostly linked to the generated share of energy from renewable sources, they are
becoming more and more unsustainable as the share of renewables increases. In Italy, for example, the
Authority for Energy has declared its concern for the exceptional costs bore to achieve the target for
photovoltaic energy. The goal set by the government on the light of the EU Directive was 7 Giga Watt within
2020; amazingly, this target has already been achieved, thanks to the very generous incentives given to
photovoltaics (Il Sole24ore, 2011).
There is the need to gradually shift incentives from direct investment in capacity to investment in
R&D, to foster technological innovation and increase the efficiency; nevertheless, although this is an
accepted idea in theory, it is very difficult in practice to harmonise together many contrasting interests.

47
Nonetheless, the challenge in the future will be to design a sustainable renewable support policy in order to
achieve a level playing field with the other power technologies.

48
4 Wind power and security of supply
“Wind energy is an integral piece of our power supply portfolio. It provides a hedge against fuel price volatility associated with other forms of electric generation.
Our studies and experiences show that wind energy integrates effectively and reliably into our power systems with regional market operations to mitigate the impact of wind variability”
Paul Bonavia, Chief Operating Officer of Xcel Energy
4.1 Introduction and motivation
The power market within European Union is experiencing a period of high transition, mainly due to three
causes. To begin with, the liberalisation process of the former regulated electricity markets, although now
almost concluded, has heavily influenced the resulting market structure.
Secondly, increasing the share of renewable energy sources for electricity generation is now a high
priority among the energy strategies of the European Commission. All member states have introduced
policies to support the market introduction of renewables and most of them are currently improving the
administrative framework conditions. Finally, most industrial countries have recognised the importance of
diminishing Greenhouse Gas (GHG) emissions.
Since the very beginning of the electricity liberalisation process, one of the key questions posed has
been whether the market let on its own would have been able to provide adequate security of supply at the
power generation level, or if some additional regulatory mechanism needed to be introduced instead. The
risk of underinvestment in generating capacity is particularly severe in the case of peaking plants, i.e. the
generating plants that are used in case of an unanticipated peak of demand and that are the instrument par
excellence to manage the issue of system reliability.

49
Reliability of supply is, at least partly, a classic public good. The North American Electric Reliability
Corporation (NERC) defines reliability as “the degree to which the performance of the elements of the
electrical system results in power being delivered to consumers within accepted standards and in the
amount desired”. Economic literature on reliability (among others Oren, 2000 and Stoft, 2002) argues that
reliability involves two different aspects that need to be examined separately and that have different
implications: security, which describes the ability of the system to withstand disturbances and adequacy,
which represents the ability of the system to meet the aggregate power and energy requirement of all
consumers at all times.
Security is provided by means of protection devices and operation standards and procedures that
include security constrained dispatch and the requirement for so called ancillary services such as: voltage
support, regulation capacity, spinning reserves and black start capability. Adequacy on the other hand
represents the systems ability to meet demand, on a longer time scale basis, considering the inherent
fluctuation and uncertainty in demand and supply, the non-storability of power and the long lead time for
capacity expansion. Generation adequacy is traditionally measured in terms of the amounts of planning and
operable reserves in the system. Oren (2000) argues that from an economic point of view security and
adequacy are quite distinct in the sense that the former is a public good while the latter can potentially be
treated as a private good.
In the early years of liberalisations, reforms were prone to follow the so called “energy-only markets”
paradigm and not much attention was paid to the problem of the investment in generating capacity.
However, as experienced with several shortages and rolling blackouts in the early years of 2000, energy only
markets do not guarantee that there will be enough installed capacity to meet the demand in the long run.
Introducing capacity payments or other forms of mechanisms for supply security can be a tool to overcome
some shortcomings of the energy only market, in particular to manage situations in which demand is near or
at its peak level and generating capacity is fully utilised. There are only a small number of unexpected peak
demand hours each year when capacity is fully utilized and operating reserve deficiency and other
reliability protocols must be implemented on the typical system. Another reason to keep reserve generation
capacity beyond security needs is also to have a hedge against high prices. In fact, in conditions of scarcity
prices will raise accordingly in a competitive wholesale market; however, the conditions that lead to high
spot market prices are also the conditions when market power problems are likely to be most severe. As
capacity constraints are approached in the presence of inelastic demand, suppliers’ unilateral incentives and
ability to increase prices above competitive levels also increase, e.g. by deliberately withholding capacity.
The paper is a contribution to the discussion on the limits of the energy only markets and on the
mechanisms to coordinate investments in new capacity. It consists of two parts: a first part presents a
comparative analysis of energy-only and capacity markets, and a second part deals with the analysis, in
terms of reliability of power systems experiencing an increasing share of renewables in their technology
portfolio. This paper is the first attempt, to the best of our knowledge, to extend the discussion on supply
adequacy to include the policies to enhance renewables in the analysis. Zucarato et al. (2009) conduct a study
based on similar premises examining hydro-based systems and examining, through a game theory
simulation model, performance indexes of energy-only and capacity markets focusing on the absence or
presence of risk aversion. The theoretical foundations of this piece of work are largely based on the book by
Stoft (2002), while the research and policy issues treated have been inspired by Joskow (2008).
The chapter is organised as follows. Section 2 illustrates the theoretical background and the literature
relative to the energy only market paradigm. Section 3 does the same for capacity mechanisms, also
describing how the most commonly used capacity markets work in practice, and what are their most
important limits. Section 4 examine three cases studies of countries that experienced large shares of
generation through a renewable source (namely hydropower), to draw some useful guidelines applicable to
the current European experience. Section 5 discusses the implications of a larger share of wind power, and of
renewables policies in general, on supply adequacy, with a particular focus on the interactions between

50
policy instruments and their sustainability. Section 6 shows the results of the quantitative analysis,
conducted through an agent-based simulation, and section 7 concludes and sums up the main points
achieved.
4.2 Theoretical foundations, limits and literature of the energy-only market
Early economic theory on the market design post-liberalisation (among others Caramanis, 1982 and Perez-
Arriaga and Meseguer, 1997) was quite supportive of the energy only markets paradigm, and used to deem
spot markets able to stimulate the proper level of investment in generation until the socially optimal level
without any regulatory intervention.
The theory underlying the energy-only market paradigm shares the same rationale behind the classical
paradigm of perfect competition: if firms are price takers, products are homogeneous, markets are
transparent, information is available and there are no barriers to enter or exit the market, then in the long
run every generator is able to recover fixed costs it incurred (Varian, 1992). According to the energy-only
model, in periods of scarcity, spot prices rise well above the marginal cost of the most expensive plant,
yielding an income to generation that is called scarcity rent. It is thanks to the scarcity rent that market clears
and generators can recover the fixed costs incurred to build the extra capacity used to withstand the demand
peak. Scarcity rent can also be defined in a more direct way as:
[1] Scarcity rent = short-run profit = TVCR − ,
Where R = PxQ = revenue, and TVC = total variable cost.
The sense behind this last formulation is that, since revenues are greater than total variable cost, the
scarcity rent can be used to cover for the fixed costs. Stoft (2002) shows that in theory the optimal volume of
generating capacity can be determined from the average value of lost load12
and the long-run marginal cost
of generation. The competitive solution would require the price spike revenue to be equal to the fixed cost to
buy the peaking technology. The duration of the price spike is a fundamental issue here; to induce the
optimal level of investment in capacity price spikes need to be large enough both in magnitude and in
duration.
This mechanism has many flaws and the simple fact that electricity is a good with peculiar
characteristics makes many of the assumptions of the classical model fail.
Problems arising from the consumers’ side are maybe the most difficult to manage. Demand in
electricity markets is extremely inelastic especially in the short run, and since in this time-frame consumers
12 The value of lost load (VOLL) is the estimated amount that customers receiving electricity with firm contracts would
be willing to pay to avoid a disruption in their electricity service. The value of these losses can be expressed as a customer damage function (CDF). A CDF is defined as:
Loss (€/kW) = f(duration, season, time of day, notice)

51
have no awareness of prices, they are not able to respond timely to spot prices. According to the energy-only
market paradigm, this problem would be only a matter of time: consumers would eventually learn that they
need to protect themselves against shortages and high prices. However, this solution is not politically
feasible, because it implies a learning period of high prices and rationing that society would probably not
tolerate. Furthermore, the system operator is unable to control the real-time flow of power to specific
customers and this fact prevents the enforcement of bilateral contracts.
On the firms’ side, problems arise from a number of practical difficulties inherent the market. To begin
with, electricity markets are not perfectly competitive, but rather concentrated. Also the assumption of free
entry/exit is often violated, due to the capital intensive nature of the sector and to environmental and
regulatory constraints. Among regulatory constraints, the same theorists of energy only markets identify in
the presence of price caps a serious obstacle to the market clearing mechanism. Price caps limit the scarcity
rent that generators can extract during peaks, and consequently discourage investments (Joskow, 2008).
Nonetheless, without price caps there is the concrete risk of firms’ abuse of market power or oligopolistic
behaviour; incumbent firms could decide to under-invest or to withhold capacity in order to keep prices
artificially high.
Furthermore, estimating the average value of lost load, required to assess the optimal level of
generation capacity, is not straightforward and many authors (see among others Kariuki and Allan, 1996,
Willis and Garrod, 1997 and Ajodhia et al., 2002) that this calculation is likely to be inaccurate. Moreover,
more relevant than the currently optimal volume of generating capacity is the optimal volume at the time
that new capacity would come on stream, several years into the future.
Risk aversion from investors is a relevant issue here, not only in the terms that are usually explored in
the financial literature, but also because in this sector the cost of investment must not be considered only in
its magnitude, but has to be compared to the effective time in which the generator unit will be active. This is
a consequence of the non storability of electricity: markets must clear continuously and therefore total costs
(capital costs plus operating costs) per unit of generating capacity for each technology vary with the number
of hours that the capacity is utilized to produce electricity each year. This in turn implies that investing in
the peaking technology, that is the one that produces only in the low probable event of demand unexpected
peaks, is perceived as particularly risky by investors (Vàzquez et al., 2002).
De Vries (2007) notes that consumers and firms face an asymmetric loss of welfare function: generating
companies have no incentive in investing in more than the socially optimal volume of generating capacity,
because this would lead to competitive prices too low to recover the investment. They have interest, on the
contrary, to keep a volume of generating capacity that is below the social optimum, because this would yield
significantly higher average prices, offsetting the lost turnover at least partly. Also consumers face an
asymmetric loss of welfare function with respect to the socially optimal volume of generating capacity, but
on the opposite direction with respect to firms (Billinton et al., 1991).
The literature that theoretically or empirically proves the flaws of the energy-only markets to deliver
the proper installed capacity is quite vast. Here we recall the work of von der Fehr and Harbord (1997) that
present a two-stage model of long-run investment choices where firms first choose capacity and then
compete to supply energy. The second stage is modelled as a non-discriminatory multiple-unit sealed bid
reserve auction. They demonstrate that, under competitive conditions, a no-intervention private outcome
will yield an insufficient level of installed capacity. Joskow (2007) finds evidence in US electricity market of
what is commonly referred to as the “missing money” problem: incremental generators (i.e. peakers) do not
earn enough revenues during the few peak hours therefore they have not incentives to invest and rely
excessively on rationing systems that are not based on price.

52
All these problems should be enough to convince that a simple market clearing mechanism is not
possible in the electricity market, at least not continuously in time. Specifically when demand for electricity
is greater than supply the market can’t be cleared.
4.3 Theoretical foundations and literature of capacity mechanisms
The reliability of the system is a direct consequence of the regulatory policies put in place. Price regulation is
essential to reliability, because we have seen above that an unregulated market is likely to under invest in
generation capacity. Capacity mechanisms belong to the set of instruments that a regulator can use to
incentivise the reliability of the system. From a policy perspective, capacity markets find a justification in the
limits of the energy-only markets paradigm, and in the risks correlated to the missing money problem.
Capacity markets have the objective of providing long-term cost recovery for capacity, especially
capacity operating at low load factors. Ideally, a capacity payment should be such that it is equal to zero
during off peak hours and it rises during periods of scarcity, in order to provide an incentive for generators
to declare their capacities available and to invest in peaking units (Oren, 2000).
A capacity payment mechanism should satisfy a number of requirements: ensuring the capacity
adequacy and the reliability of new and existing plants, enhancing price stability, helping to promote
investment through efficient signals for long term investments and fairness. Here we will not discuss
thoroughly about the different types of capacity mechanisms that can be put in place, but we will focus on
their implications on investments in new capacity and in renewables. However, it is useful to recall that
there are two main types of capacity markets: capacity obligations and capacity payments.
In practice, the main difference between the two types is that capacity obligations regulate quantities
and lets the price formation to the market, while capacity payments work in the opposite way, i.e. the price
is pre-determined by the system operator and the market sets quantity. Batlle and Rodilla (2010) prefer this
last classification (price-based versus quantity-based) to the classic denomination of capacity payments and
capacity obligations, finding it misleading, because there are some security-of-supply oriented mechanisms
that are not capacity mechanisms (e.g. long-term energy auctions). A survey of the literature and of the
different capacity mechanisms can be found in De Vries (2007) and Finon and Pignon (2008).
The method of the so called operating reserve pricing is the capacity mechanism more similar to the
energy-only market. The System Operator creates a demand for operating reserve, paying for it every time
the system is short. Due to arbitrage, the spot price will be equal to the reserve price when the reserve is
short (otherwise, the generator would prefer to provide reserve and not energy). In turn, it is not necessary
to wait for an energy shortage to have a price spike.
Vázquez et al. (2001) propose an alternative system, an organized market where the regulator requires
the System Operator to buy a determined amount of reliability contracts, a combination of a financial call
option with a high strike price and an explicit penalty for non-delivery, from generators on behalf of the
demand.
53
4.3.1 Capacity payments
A capacity payment is a subsidy per unit of available capacity; the regulator subsidises the building of new
capacity to increase the revenues/decreasing the fixed costs for peaking generators, with the aim of shifting
the long-run market equilibrium towards a larger volume of generation capacity. It is often used to
compensate for the distortions caused by a price cap (that is why many argue that eliminating or increasing
price caps would be a less complicated solution; however, they do not consider the high potential for market
power).
From a theoretical point of view, capacity payments follow directly from the peak load pricing literature
(Boiteux 1960). The basic idea is that energy and capacity are two commodities; the objective of pricing is to
recover cost while minimizing distortion of efficient consumption. Peak load users are responsible for
capacity requirements while off peak users only consume energy, hence efficient pricing must charge
marginal cost off peak and marginal cost plus a capacity charge on peak.
Their main raison d’être is to attract new investment in capacity, resulting in lower prices and
compensating for these lower prices. However, there is not consensus upon the amount to be paid to the
generators and the allocation among different facilities. Furthermore, they are not very liked by economists,
consumers and even regulating authorities, because of their regulating nature and because at present there is
nearly no empirical evidence supporting their effectiveness in actually promoting investment in new
capacity, while there are several studies showing their inefficiency both in financial terms and in terms of
output.
Castro-Rodriguez et al. (2009) use a theoretical model where firms invest strategically to simulate the
Spanish electricity market. Consistently with the literature on energy-only markets, they find that the level
of capacity resulting from firms’ private decision is below the social optimum. However, introducing
capacity payments in the model is not enough to guarantee the proper level of installed capacity, and
furthermore is extremely costly.
4.3.2 Capacity markets
Capacity obligations impose obligations to be contracted for capacity, including a reserve margin on
suppliers or customers, or just the reserve margin on a central buyer; generators compete to provide capacity
through a mechanism such as an auction.
In principle capacity markets should solve one of the main problems of the price mechanisms just
described: instead of setting administratively a price and then basically expect for the right amount to come
into the system, the regulator declares the quantity expected and lets the market mechanism reveal the right
price. This approach has been adopted in the US through the ICAP system, (with very poor results), Western
Australia and France.
In the US, PJM13 market monitor conducted an analysis to assess whether the fixed costs of the different
units were covered by the prices received by generators from the PJM markets plus the ICAP payments, and
13 PJM Interconnection LLC is a Regional Transmission Organization (RTO) which is part of the Eastern
Interconnection grid operating an electric transmission system serving all or parts of Delaware, Illinois, Indiana,
Kentucky, Maryland, Michigan, New Jersey, North Carolina, Ohio, Pennsylvania, Tennessee, Virginia, West Virginia
and the District of Columbia.
54
concluded that investments costs were not being recovered (PJM, 2007). In addition to this lack of
investment cost recovery, prices were extremely volatile. Capacity market prices tended to alternate between
very low prices, during the large periods where the system’s reserve margin was large, and extreme high
prices when not enough capacity resources were available (Chandley, 2005).
Batlle and Rodilla (2010) review and categorize thoroughly all the existing the different approaches
regulators can opt for to deal with security of supply in a market-oriented environment (energy only,
capacity payments and capacity markets), examining also the specific mechanisms used in many countries.
They also suggest some criteria to regulators in order to design an efficient security of supply mechanism.
4.4 Reliability and renewable sources: what can be learnt from hydro
experience
This section will help us understand the effects of the use of capacity payments to regulate markets which
have experienced a large development of generation by a renewable source. The large hydro plants built in
countries like Brazil, Colombia and New Zealand, and their great importance for the energy supply of these
countries provide a very good field of analysis to evaluate the instruments used to face high price volatilities
combined with low marginal cost technologies.
We will analyse the recent history of these three countries and try to draw some useful implication from
their experience, with respect to effectiveness of their market structure and their use of such tools as capacity
payments.
4.4.1 Brazil: the need for investment
Because of its own size and of the size of its hydropower endowment, Brazil has the largest electricity
market in South America, with a power consumption that is more than double the combined consumption of
Argentina, Bolivia, Chile and Uruguay. Its installed capacity is comparable to that of Italy and the United
Kingdom, although with a much larger transmission network. The country has the largest capacity for water
storage in the world, being highly dependent on hydroelectricity generation capacity, which meets over 80%
of its electricity demand (OECD, 2005). To give an example, Brazil generated 371 billion kWh of
hydroelectric power in 2007, accounting for 85% of its total electricity generation (EIA, 2009). As a
consequence, while the country's generation costs are lower relative to countries with more diverse supply
mixes, this dependence on hydropower also makes Brazil especially vulnerable to power supply shortages
in drought years, as happened during the 2001/2002 energy crisis.
In those years, a sequence of a few years drier than average and several delays in the commissioning of
new generation plants and transmission problems accounted for a third of energy shortage. Furthermore,
the world’s oil crisis in the 1970s and Latin America’s macroeconomic crisis had increased the financing
PJM, headquartered in Valley Forge, Pennsylvania, is currently the world's largest competitive wholesale electricity
market. More than 650 companies are members of PJM, which serves 51 million customers and has 167 GW of
generating capacity.
http://www.pjm.com/about-pjm/newsroom/~/media/about-pjm/newsroom/downloads/pjm-statistics.ashx
55
costs for new projects. The effect of both crises provoked a considerable fluctuation in the demand of
electricity and destabilized the income of the electricity industry. To respond to this crisis, the government
created the Crisis Management Board (CGE), chaired by then President Cardoso. The CGE received special
powers to manage the difficult situation, such as the authority to set up special tariffs, implement
compulsory rationing and blackouts, and bypass normal bidding procedures of the purchase of new plant
equipment. Instead of resorting to rolling blackouts, the government chose to apply a quota system. Despite
the losses of electricity utilities, tariffs were kept low, as politicians were unwilling to raise prices, and the
situation got worse. That is why, as the crisis got over, the government started to heavily privatise and
divest electric utilities. The negative effects of electricity rationing on the economy compelled the
government to revise the institutional and regulatory framework of the industry.
In March 2004 Congress approved a new model for the electricity sector that implemented the creation
of the “Pool” (Ambiente de Contratação Regulado, ACR), matching electricity demand and supply capacity
through long-term contracts. This system was meant to replace on a competitive bases the “initial contracts”
inherited from the 1990s. These contracts were designed as a bridge between the 1980s and the new
environment after the privatisation of most distribution companies and schedule to gradually expire after
2002 (Almeida, 2004).The new framework was inspired by the “single-buyer” model, where an entity buys
all electricity from producers and sells it to distributors. Practically, the government acts like an auctioneer,
and operates in the Pool together with the other actors, following a common mechanism for the purchase of
energy.
In parallel to the regulated long-term Pool contracts, also a “free” market (Ambiente de Contratação
Livre, ACL) has been created. Large consumers (above 10 MW) have to decide in which of these two
environments to operate. These measures were meant to reduce market volatility and allow distribution
companies to better estimate market size. If actual demand turns out to be higher than projected,
distribution companies will have to buy electricity in the free market; in the opposite case, they will sell the
excess supply in the free market.
With long-term contracts set through the Pool, price uncertainty is broadly restricted to electricity
traded in the free, short-term market and bilateral contracts between generators and large consumers. In fact,
large consumers are allowed to buy electricity directly from generators on a competitive, customised basis,
and they are also free to invest in generation, selling the energy that exceeds their needs. Their role is thus
central in ensuring the adequate balance between supply and demand. When they identify the risk of excess
investment, they are likely to purchase from the Pool, while indications of shortages will stimulate the
contracting of new investment.
Despite the reduction in demand following the 2001 rationing programme, official estimates suggest
that the demand for electricity will grow over 5% per year over the next 15 years, because of the
development of energy-intensive industry and consumers’ demand; this means that the country will need to
more than double its existing capacity by 2020 (MME 2006). There is yet a limited and continuously
decreasing excess supply: investment is therefore needed to boost generation and transmission capacity, but
the general feeling is that investing in hydro plants may be not enough.
As a result, in the last recorded auctions, there has been an ever increasing contracting of fossil fuels
generated electricity. This fact can be interpreted as a substantial failure of the current scheme to deliver
incentives for an adequate level of investment in capacity expansion of existing plants.
Considering that in the last 20 years, Brazil has been one of the main recipients of private capital
investment in its power sector, this result is quite surprising. Total investment by private actors in the power
sector between 1994 and 2006 amounted to US$ 56,586 million in 124 projects. However, despite Brazil's
deregulation and higher tariffs in the "new energy" auction system, investment, particularly in generation,
has slowed significantly, apparently due to the lack of available projects (ONS). Investors feel that the

56
process for the proposal of a project and in general the functioning of the entire action system is very
complicated and slow.
In conclusion, the results of this new market model are yet to be seen. In general, there have been
growing investments in new generation projects, but including thermal generation the new market design is
quite complicated and requires huge administrative and regulatory expertise to make the auction market
work efficiently.
4.4.2 New Zealand: the importance of the security of supply
New Zealand produces 70% of its electricity from renewable energy sources such as hydropower,
geothermal power and increasingly wind energy. Although the previous government had the goal of
increasing the share of electricity produced by renewable sources to 90% by 2025, the current National
government has put priority on security of supply (Key, 2008). These are the words of the Prime Minister
Key: “This winter [2008] was the third since 1999 that New Zealanders were asked to seriously save power.
New Zealand cannot afford to have an insecure electricity supply. […] National will make security of supply
a priority, while providing clear policy settings that favour renewable electricity generation”.
When it originally started, regulation of the electricity market had started in a light-handed fashion:
companies with market power exercised self-regulation, with the “threat” that otherwise, a heavier
regulation would have been implemented. However, in 1998 the government accepted the view that local
electricity companies, being vertically integrated natural monopolies, had both the ability and incentive to
use their market power in distribution to discourage competition in retail and generation; this led to an
increase of the extent of intervention through the Electricity Industry Reform Act, which forced power
companies to divest either their energy or their lines business, and then the Electricity Amendment Act in
2001. The latter led to another round of industry reform concentrating on achieving better governance of the
electricity market and tighter control of monopoly functions (MED 2006).
The current design of New Zealand electricity market is an energy only market exchange with prices set
through a process similar to a uniform price auction. The system shows some similarities with the Brazilian
one, as all electricity is required to be traded through a central pool, with the exception of small generating
stations of less than 10MW (NZIER 2005). It is possible to have bilateral and other hedge arrangements, but
they function as separate financial contracts. Trading develops by bids (purchaser/demand) and offers
(generator/supply) for 48 half hour periods about 250 pricing nodes on the national grid. During each half
hour period Transpower, the grid operator, publishes a new real-time price every five minutes, and a time-
weighted 30-minute average price. This price is just a sort of guidance, since the final prices are calculated
ex-post, using the offer prices as established two hours before the trading period, and volumes as
established during the trading period (NZIER 2007).
As seen for Brazil, the results of this reform are unclear. The need for long-term planning and
coordination, and the unwillingness of private companies to bear the risks associated with constructing
capital-intensive electricity infrastructure, were major reasons why governments took control of electricity in
countries such as New Zealand in the first place. Following the reform, incumbents have lost a high level of
market share, but retail competition has currently stagnated and the main independent retailer has failed. As
pointed out by a technical report released in April 2009 to the Minister of Energy and Resources by the
Electricity Technical Advisory Group, the main issues for New Zealand electricity market are excess price
increases and frequent supply crises. These two problems are deemed to be caused by the high costs of
generation and the low reliability of the hydro system, and not to a general lack of investment in capacity
expansion: “Sufficient new generation is being built to meet increased demand and the quality of investment

57
in generation is generally good. New Zealand's hydro-based system is vulnerable to dry years, and we have
experienced a series of dry years over the last decade. On occasion, public conservation campaigns are
required because demand savings can be lower cost than building expensive spare generating capacity to
cover every contingency” (Bell Gully 2009).
The report points out that some improvements can be operated on the transmission line, but the
substantial level of investment is satisfying. This means that despite the high prices charged by electric
utilities in New Zealand, at least part of the extra profit that they gain has been reinvested in the network,
thus we can conclude that the market design is effective from an investment point of view. However, the
increased competition of the generation sector has not been enough to lower the price for consumers, and
this would suggest that market power is not easy to be lowered, and its effects don’t simply disappear
introducing more competition.
4.4.3 Colombia: a weak regulatory framework
The electricity sector in Colombia is dominated by large hydropower generation (65%) and thermal
generation (35%). The electricity sector has been unbundled into generation, transmission, distribution and
commercialization since sector reforms carried out in 1994. About half of the generator sector is privately
owned, whereas in electricity distribution private participation is much lower.
The share of thermal participation in generation has increased since the mid-1990s. This has happened
in response to the 1992/1993 crisis caused by droughts and the high reliance of power generation on
hydroelectric installations that lacked multi-year storage capacity. As a result of the new policies adopted by
the country, the dominance of hydropower in the generation portfolio has been reduced from 80% in the
early 1990s to less than 65% (World Bank 2004). It is important to stress that the additional thermal capacity
has come almost entirely from private sector investment, thanks to the measures adopted by the
government. Notwithstanding this remarkable result, Colombian electricity markets is still characterised by
lack of competition and investment incentives in the generation segment, and by financial distress of a
considerable number of the distribution utilities. The reforms carried out since 1994-1995 were not able to go
as far as originally envisaged, due to several reasons, especially political resistance at the local level,
regulatory uncertainty, and loss of interest from international investors. As a result, public enterprises
continue to play a very important role in all segments of the market, leading to all the shortcomings deriving
from the asymmetries in the treatment of public and private operators and from the absence of a truly
independent regulatory authority.
From this first small picture, it is clear that the case of Columbia is really peculiar, since the country
shows a political instability and some institutional and regulatory weaknesses that cannot be ignored.
Therefore, we must be very careful in drawing conclusion from this case.
In generation and retail, i.e. the two competitive segments of the industry, the three largest firms
control around 70% of the market. Given that particular national or municipal government interests control
multiple utilities, the extent of concentration is in fact larger than what at first appears by examining the
structure of the market. Actually, there are legal dispositions that limit the market share of any participant in
any segment to no more than 25% of the market. Evidently though, these limitations are not strictly applied
in practice. As pointed out by a survey of international investors conducted by the World Bank, international
investors in electricity generation are very dissatisfied with their experience in Colombia, citing frequent
regulatory changes as a central issue. Under current conditions, it appears unlikely that further private
capital will be forthcoming to finance the next wave of thermal generation plants. As noted above, the shift
towards a more balanced thermal-hydro generation portfolio was achieved largely as a result of private
investment during the mid-1990s. The current presumption of central government is that new hydro

58
capacity will be installed by public utilities, while private investors will continue to provide new investment
in thermal capacity, but this latter assumption is highly questionable, given the high levels of dissatisfaction
of private generators operating in Colombia today, as well as the absence of an adequate mechanism to
remunerate investment in thermal plant.
In general, Colombia’s reform has led to higher investment, competition, efficiency and a reduction in
electricity losses. Nonetheless, much has still to be done in this country, especially under an institutional and
infrastructural profile; it is important to give to investors a signal of stability, and to improve the accessibility
and the reliability of the electricity for the population. Under this aspect, a regional cooperation with the
neighbouring countries could be very precious, because of the complementarities that could be exploited.
The goal of relying less upon the hydroelectric system and of diversifying the resources portfolio is good per
se, but could be less costly to be achieved if pursued in an integrated system, with countries like for example
Argentina, that has an interesting potential in wind generation.
4.4.4 Key problems
A shock of supply is the worst fear of the opponents of an energy system heavily based on renewable
energies. This fear is not unjustified: water flow, wind and sunlight cannot be controlled by human
technology. Fortunately, markets exist which have experienced a large development of generation by a
renewable source and they can be used as a term of reference. The large hydro plants built in countries like
Brazil, Colombia and New Zealand, and Austria in EU, and their great importance for the energy supply of
these countries provide a very good field of analysis to evaluate the instruments used to face high price
volatilities combined with low marginal cost technologies.
In general, we can recognise some common patterns and corresponding lessons to learn in these countries’
experiences:
- A shift from less regulation to more regulation, in response to the arising of determined problems. This behaviour of urgency, i.e. the attitude of acting only in presence of a serious crisis or problem, is an attitude that should be abandoned, in favour of a more farsighted policy.
- A shift to a more diversified energy portfolio. One of the major issues in countries that heavily rely on electricity from renewable sources is indeed the security of supply. We have seen in our brief analysis that Brazil and to a lesser extent Colombia and New Zealand have experienced periods of shortages due to climatic conditions that are not entirely predictable. Diversifying the energy portfolio is a valid tool to lessen the risk of shortages.
- The importance of the management of demand. As pointed out in the analysis of New Zealand, a reduction in the demand for electricity is surely less expensive than building new capacity. Intervening through campaign to reduce wastes and to change electricity consumption behaviours, or through smart metering, is still not very popular among regulators, but this could be the key of a more rational use of energy and money, both for investors and for consumers.
4.5 Reliability and wind power
The share of energy from renewable sources is expected to grow considerably as policy and regulations on
greenhouse gas emissions are being developed and implemented by individual member states throughout
Europe, and wind power is the most fast-growing of the clean energies. Reliably integrating high levels of

59
variable resources (wind, solar and some forms of hydro) into the European bulk power system will require
significant changes to traditional methods used for system planning and operation. A widespread concern is
that the system may not have sufficient flexible capacity to deal with intermittent wind output, and
traditional solutions designed to deliver reserve capacity alone may not be the answer. On the one hand,
energy only markets would be a poor system to manage variability; on the other hand, capacity markets are
not deemed efficient even without including the renewable issue in the picture.
In general, wind penetration could yield four main outcomes in terms of reliability:
1. Wind support policies increase total capacity, thus are beneficial for reliability. This outcome has been thoroughly verified in Chapter 4, where has been stated that wind support policies that are currently in place are extremely incentivising for generators to build new (renewable) capacity.
2. Wind increases variability and uncertainty. This point deserves more discussion. It is somehow acknowledged that wind power is uncertain and variable; the interesting question is in what sense it is uncertain, and most of all if something can be done to overcome this uncertainty. Uncertainty derives mainly from two sources: the first is technical, since all variable resources differ from conventional and fossil-fired resources for the plain reason that their fuel source (wind, sunlight, and moving water) cannot presently be controlled or stored. This is not the place to discuss technical issues, but it is worth saying that comforting signals are arriving from scientists in this sense. According to climate scientists at Stanford University, wind power is able to become a steady, dependable source of electricity and delivered at a lower cost than at present. Technically, the key is connecting wind farms throughout a given geographic area with transmission lines, thus combining the electric outputs of the farms into one powerful energy source (Archer and Jacobson, 2007). Also NERC (2009) suggests taking advantage of complementary patterns of production, locating variable resources across a large geographical region to leverage any fuel diversity that may exist. Yet, if centrally planning where to locate the plants and what should be the plants’ fuel is politically difficult but at least feasible in a federal system like the US, it is really hard to manage in a context like the European Union. A cooperation among countries to integrate the electrical systems, even if only the renewable section of the system, is at the moment highly unlikely to be implemented, hence reliability will stay within the borders of the national regulation at least for a while. The second source of uncertainty is that the output of variable resources is characterized by steep slopes as opposed to the controlled, gradual upwards or downwards slopes generally experienced with electricity demand and the output of traditional generation. Managing these “ramps” can be challenging for system operators, particularly if downwards ramps occur as demand increases and vice versa. Insufficient ramping and dispatchable capability on the remainder of the bulk power system can exacerbate these challenges.
3. Lower variable costs caused by an increased share of wind may reduce the peaking price that clears the market in peaking hours. This outcome and its implications will be tested and discussed in section 4.5.2.
4. Low wholesale prices caused by an increased share of wind could impair investment in peaking units. The downside of lower wholesale prices is of course the prospect of having less investment; in Chapter 3 we have argued that in the sector of renewable energy this seems not to be the case under certain conditions. However, this investment is directed only to the building of new wind power that, as said before, is not fit to be a peaking unit. Here we argue that this is not necessarily bad for the reliability of the system, because given that demand is stable, new wind power could replace as baseload technology old fossil fuel plants, that could be used as peaking units and we test this assertion in section 4.5.3.
Every technology has its advantages and downsides; it is sufficient to learn how to integrate the features
of the new technologies into the system and modify the system itself accordingly. For instance, coal and
nuclear are technologies able to produce a lot of power on a continuing basis, but cannot be easily ramped
down or up to meet variable demand, so they are fit to be baseload energy. Also wind power is not typically
used to meet peak electric loads but it makes a large contribution to the amount of electricity that is
generated and consumed over time: wind's benefit is in providing energy, diversifying supply, saving fuel,
and reducing carbon and other emissions. The fact that the output from wind farms is variable does not

60
mean that wind farms need dedicated storage; the power system already has reserves and typically, despite
all the concerns, only a modest amount of additional reserves may be needed to handle wind. Of course,
these need to be supplemented with dispatchable technologies like natural gas. And while natural gas and
oil power plants are flexible and easy to use, their fuel cost is volatile and increasingly high, so they are best
used for peaking and designed to remain idle if not needed, sometimes for long periods of time.
Box 3
The best peaking units: some data on gas-fired plants
Overall, 20% of the world’s electricity production is based on natural gas. The electricity
generation capacity in Europe is approximately 800 Giga Watt (GW), of which 20% is based
on natural gas. In the United States, the total generating capacity is approximately 1,000 GW,
of which 395 GW is based on gas. The world’s gas-fired generation capacity amounted to
1,124 GW at the end of 2006.
There are two main types of gas-fired plants: combined-cycle gas turbine (CCGT) and open-
cycle gas turbine (OCGT) plants. CCGT is the dominant gas-based technology for
intermediate and base-load power while OCGT plants are used for peak load. They consist of
a gas turbine and compressor connected to an electric generator via a shaft.
Recently there has been an effort aimed at increasing the efficiency by raising the gas-turbine
inlet temperature and simultaneously decrease the investment cost and emissions of CCGT
plants. Their generating efficiency is expected to increase from today’s 52–60% (lower heating
value, LHV) to some 64% by 2020. CCGT plants offer flexible operation. They may be
operated at 50% of their nominal capacity with a moderate drop of generating efficiency (50–
52% at 50% load compared to 58–59% at full load). OCGT plants have a much lower
generating efficiency that amounts at approximately 35–42% (LHV based) at full load. It is
expected that their maximum generating efficiency may be increased to a maximum of 45%
in 2020. Compared to coal-fired power plants, CCGT plants have much lower specific
investment costs. They emit roughly half as much CO2 per kWh as coal-fired power plants.
Due to their low specific investment costs but relatively high fuel costs (natural gas)
compared to coal-fired plants, CCGT plants are generally lower in the merit order, which
means they are operated in intermediate rather than in base load (whereas the opposite is
true for coal-fired power plants).
The investment cost of a CCGT power plant has increased from approximately $800/kWh in
2002 to $1,100/kWh in 2009 because of the high price of materials and equipment and the
increasing demand for new CCGT plants.
Technology learning is not expected to reduce significantly the investment cost of CCGT
plants as the technology is mature. In comparison with the 2008 peak, investment costs might
decline in the near future because of the material cost reduction induced by the current
economic crisis and the decline of demand for new capacity. Technological development may
also result in reduced investment cost. The specific investment cost of OCGT plants is
approximately $900/kWh. Also for OCGT plant, modest cost reductions are envisioned.
Source: data from IEA OECD, Energy Technology System Analysis Program (ETSAP)

61
4.6 Agent-based simulations
We use a variation of the agent-based model adopted in Chapter 3 and described in section 3.3, adapting it
for the purposes of this new investigation. For clarity, let us recall the main features of the model.
4.6.1 Model description
The model is composed of a set of agents, a set of trading arrangements, and a demand schedule. The agents
are n symmetric generators ni ,...,1= . The market capacity is K , while the individual capacity of each firm
is nKkn = . For each K , n acts as a parameter of the degree of competition in the market, as the individual
capacities decrease with the number of generators. θ is a parameter that expresses the demand at a certain
period of the day.
Each generation company has four generating plants characterised by their own nominal capacity and
seasonal availability profiles, their own marginal generation cost (with constant marginal production
costs), c , up to capacity, meaning that firm i’s marginal cost of production equals zero for production levels
below capacity, while production above capacity is infinitely costly (thus impossible).
Trading takes place through a compulsory, uniform-price auction, i.e. an auction in which the price
firms receive is equal to the highest accepted bid (Fabra et al., 2006). On a daily basis, each firm
simultaneously and independently submits a bid specifying the minimum price at which it is willing to
supply the whole of its capacity. each agent is allowed to submit a single offer (in €/MWh) for each power
plant for the whole of 24 hourly trading periods in the next day. An independent auctioneer adds them
horizontally and creates an ad hoc market supply function in merit order of short-run marginal costs: plants
starting from the cheapest to the more expensive are scheduled to generate until demand is exhausted for
each hourly period. Formally, we denote the bid profile as:
)( ibb ≡
The market is cleared by stacking these offers and defining a System Marginal Price (SMP) for each
hour of the next day by the intersection of demand (an average daily demand profile for each month is used)
and supply at the price offered by the marginal unit on the merit order schedule; plants that have offered
above the system marginal price are not scheduled to generate, and receive no payment. Simulations are
defined in terms of iterations of trading days, each one for a set of 24 hourly periods. Finally, the auctioneer
assigns individual quantities iq to each of the bidders, on the basis on the bid and the demand.
Formally, the output allocated to firm i is given by:
{ }
{ } { }
{ }
>−
=−+
<
= ∑ ∑= =
jij
ji
n
i
n
j
ji
jii
i
bbifk
bbifkn
kn
bbifk
bq
θ
θθ
θ
θ
,0max
,0max1
,min1
,min
);(1 1

62
In this section we will introduce some unexpected demand increases, which will of course affect firms’
bidding strategies and regulator’s quantity assignments.
The economy runs during periods 20,...,1,0=T and it is populated by ten agents representing
generation profit-seeking companies acting in the market.
Firms use a learning method to choose their supply offer, conditional on their profit history and cost
attributes. All firms immediately and simultaneously post their selected supply offer, so that no firm has a
strategic advantage through asymmetric information.
Profits for each firm are:
( ) iii qcSMP −=π
for ni ,...,1= , where SMP equals the highest accepted bid.
The strategic agents’ offering strategy is driven by a primary objective of reaching a minimum
specified utilisation rate of their plant portfolio and a secondary objective of maintaining or increasing profit
once the primary objective has been achieved. By following these objectives through a computational
learning algorithm, the agents learn the profit-maximising policy, subject to utilisation, for pricing their
plants in the daily auction.
The learning algorithm has the following scheme:
If Current Utilisation Rate • Desired Utilisation Rate �
≤=
>>
−−−
−−−
211
211
tttt
tttt
ifbb
ifbb
ππ
ππ
If Current Utilisation Rate < Desired Utilisation Rate � 1−< tt bb
While the desired rate of utilisation is defined exogenously, the profit objective is pursued
endogenously: each generator is continuously learning to improve performance in the profit objective using
the previous trading day’s profit as a benchmark to evaluate the current day’s performance. There are
several reasons why companies will want to maintain an utilisation target. This could be part of their long-
term market share strategy, or it could reflect prior contracting, or in some cases it could reflect availability
obligations promised to the regulator.
The model represents a setting of a semi-stylised competitive market, in which agents do not have market
power, do not act strategically and own an equal share of the technology mix available in the market. Agents
are ten symmetric generation companies that produce electricity using the following technology mix: coal,
gas, oil and wind. Each firm owns 12 plants (3 plants for each technology).
We gradually increase the wind share in the technology and observe the effects. First, wind nominal
capacity gradually increases from 10% to 15%, and then from 15% to 20% of the technology portfolio.

63
Afterwards wind energy will be increased from 20% to 30%, then from 30% to 40%, from 40% to 50%, and
finally from 50% to 55% and from 55% to 60% of the technology portfolio.
As before, these are nominal capacities; actual capacities are more or less a third than the nominal ones,
because the load factor of wind is usually on average 0.3. In normal conditions, i.e., with no unexpected
demand peaks, the maximum demand in Mega Watt Hour is assumed to be 68,850, which is more or less the
peak demand of a heavily industrialised European country, like Germany, with a 20% reserve capacity
margin.
4.6.2 Wind energy and demand peak
In this section we are going to see how the presence of wind influences the reliability of the system as a
whole, therefore we will cause unexpected demand peaks in the model and observe how the system reacts.
We simulate two scenarios:
- an unexpected demand peak of 20% more than forecasted;
- an unexpected demand peak of 30% more than forecasted;
The simulations’ results are used to verify the effects on wholesale prices with or without wind in the
technology portfolio and as the share of wind in the technology portfolio increases.
In Chapter 3 having a larger share of wind in the technology portfolio yielded three basic consequences:
1. Wholesale prices decrease since variable costs for wind generators are lower.
2. Profits increase for wind generators, because of lower costs and higher market shares.
3. Investment in wind energy without regulatory incentives is likely not to be profitable, at least in its first stages, due to the high fixed costs.
We want to see if these results, in particular the first two, still hold in case of an unanticipated peak in
demand.
If it is true that a generator with larger share of wind shows a significant decrease of variable costs as
the results in Chapter 4 and in other studies suggest, this means that the peaking price needed to clear the
market may be smaller. However, this smaller peaking price could have damaging effects on the peaking
generators, because it could be not enough to recover fixed costs.
The trend towards lower prices can be observed in the Figure below, obtained using the simulations of
our model.

64
Average Hourly Prices
0.0
20.0
40.0
60.0
80.0
100.0
120.0
1 3 5 7 9 11 13 15 17 19 21 23
Hours
Pri
ce
/MW
hno wind wind 10%
Figure 20 Average hourly prices in case of an unexpected increase of demand by 20%, respectively with no wind and 10% in the technology portfolio
As we can see in Figure 20, in times of high demand the peaking price is lower for generators with wind
than for generators that do not have wind in their technology portfolio. Not unexpectedly, this result
improves with the increase of the share of wind, but only up to a certain extent.
Peaking Prices
0
20
40
60
80
100
120
140
0% 10% 15% 20% 30% 40% 50% 55% 60%
Share of Wind
Pri
ces
Peaking price (+20%
dem)Peaking price (+30%
dem)
Figure 21 Peaking prices (hourly averages) in the month of November according to the share of wind in the technology portfolio
Figure 22 shows that the average peaking price lies within an upper and a lower bound, and that for
significant increases of demand (i.e. higher than 20%) wind makes the difference only if its share is at least of
40%.
Peaking Prices
0
50
100
150
0% 10% 15% 20% 30% 40% 50% 55% 60%
Share of Wind
Pri
ce
s
Peaking price (+20% dem)
Peaking price (+30% dem)
Figure 22 Averaged peaking prices for a demand shock
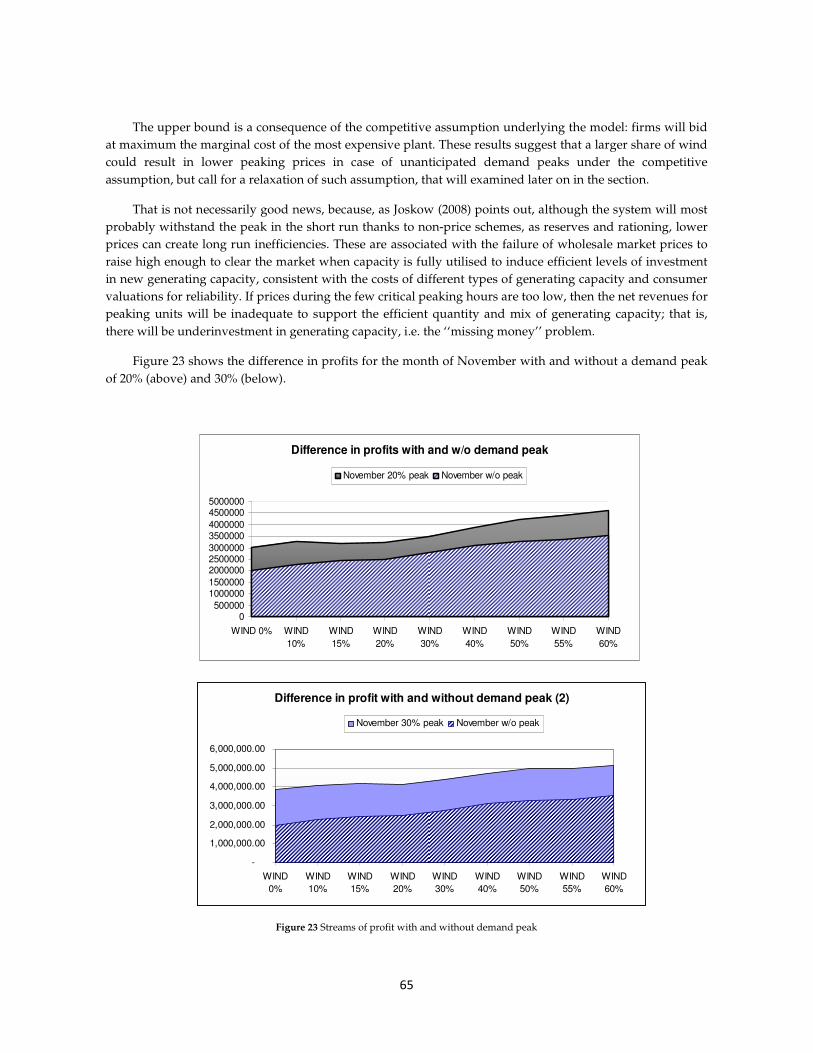
65
The upper bound is a consequence of the competitive assumption underlying the model: firms will bid
at maximum the marginal cost of the most expensive plant. These results suggest that a larger share of wind
could result in lower peaking prices in case of unanticipated demand peaks under the competitive
assumption, but call for a relaxation of such assumption, that will examined later on in the section.
That is not necessarily good news, because, as Joskow (2008) points out, although the system will most
probably withstand the peak in the short run thanks to non-price schemes, as reserves and rationing, lower
prices can create long run inefficiencies. These are associated with the failure of wholesale market prices to
raise high enough to clear the market when capacity is fully utilised to induce efficient levels of investment
in new generating capacity, consistent with the costs of different types of generating capacity and consumer
valuations for reliability. If prices during the few critical peaking hours are too low, then the net revenues for
peaking units will be inadequate to support the efficient quantity and mix of generating capacity; that is,
there will be underinvestment in generating capacity, i.e. the ‘‘missing money’’ problem.
Figure 23 shows the difference in profits for the month of November with and without a demand peak
of 20% (above) and 30% (below).
Difference in profits with and w/o demand peak
0500000
10000001500000
200000025000003000000
35000004000000
45000005000000
WIND 0% WIND
10%
WIND
15%
WIND
20%
WIND
30%
WIND
40%
WIND
50%
WIND
55%
WIND
60%
November 20% peak November w/o peak
Difference in profit with and without demand peak (2)
-
1,000,000.00
2,000,000.00
3,000,000.00
4,000,000.00
5,000,000.00
6,000,000.00
WIND
0%
WIND
10%
WIND
15%
WIND
20%
WIND
30%
WIND
40%
WIND
50%
WIND
55%
WIND
60%
November 30% peak November w/o peak
Figure 23 Streams of profit with and without demand peak
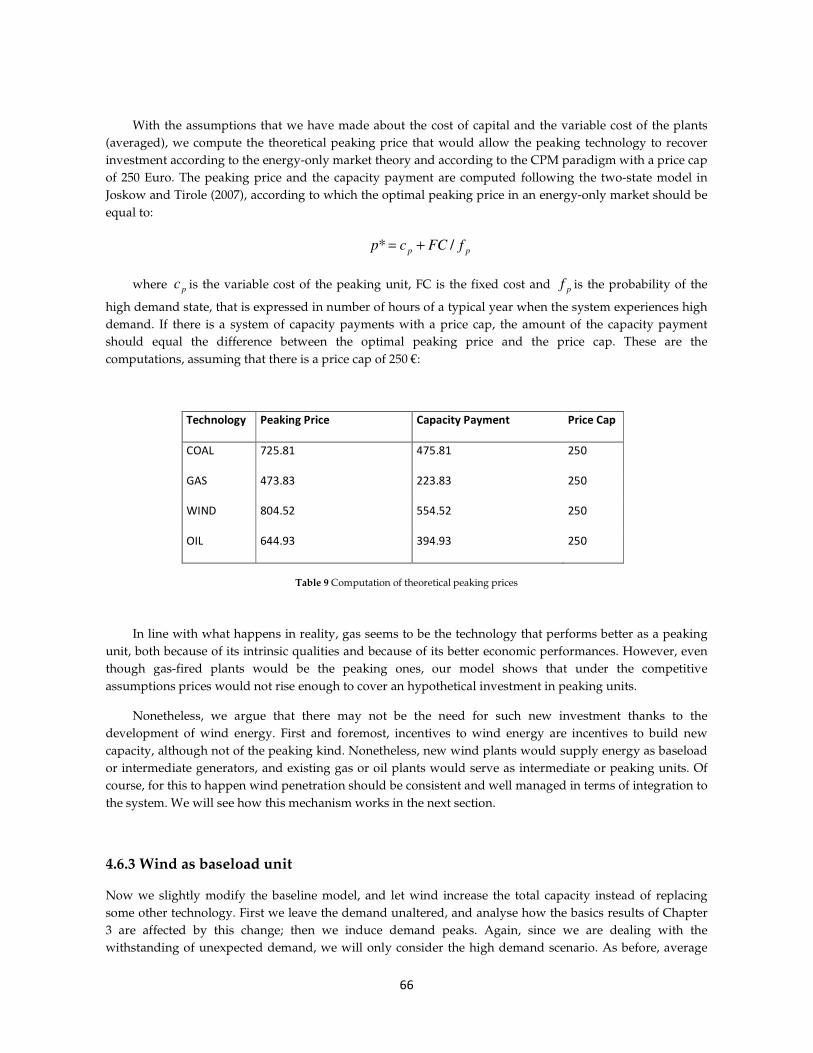
66
With the assumptions that we have made about the cost of capital and the variable cost of the plants
(averaged), we compute the theoretical peaking price that would allow the peaking technology to recover
investment according to the energy-only market theory and according to the CPM paradigm with a price cap
of 250 Euro. The peaking price and the capacity payment are computed following the two-state model in
Joskow and Tirole (2007), according to which the optimal peaking price in an energy-only market should be
equal to:
pp fFCcp /* +=
where pc is the variable cost of the peaking unit, FC is the fixed cost and pf is the probability of the
high demand state, that is expressed in number of hours of a typical year when the system experiences high
demand. If there is a system of capacity payments with a price cap, the amount of the capacity payment
should equal the difference between the optimal peaking price and the price cap. These are the
computations, assuming that there is a price cap of 250 €:
Technology Peaking Price Capacity Payment Price Cap
COAL 725.81 475.81 250
GAS 473.83 223.83 250
WIND 804.52 554.52 250
OIL 644.93 394.93 250
Table 9 Computation of theoretical peaking prices
In line with what happens in reality, gas seems to be the technology that performs better as a peaking
unit, both because of its intrinsic qualities and because of its better economic performances. However, even
though gas-fired plants would be the peaking ones, our model shows that under the competitive
assumptions prices would not rise enough to cover an hypothetical investment in peaking units.
Nonetheless, we argue that there may not be the need for such new investment thanks to the
development of wind energy. First and foremost, incentives to wind energy are incentives to build new
capacity, although not of the peaking kind. Nonetheless, new wind plants would supply energy as baseload
or intermediate generators, and existing gas or oil plants would serve as intermediate or peaking units. Of
course, for this to happen wind penetration should be consistent and well managed in terms of integration to
the system. We will see how this mechanism works in the next section.
4.6.3 Wind as baseload unit
Now we slightly modify the baseline model, and let wind increase the total capacity instead of replacing
some other technology. First we leave the demand unaltered, and analyse how the basics results of Chapter
3 are affected by this change; then we induce demand peaks. Again, since we are dealing with the
withstanding of unexpected demand, we will only consider the high demand scenario. As before, average

67
prices decrease, but slightly more than in the benchmark case, because of the combined effect of lower
variable prices and of more supply of capacity with respect to demand.
Average Daily Prices
54
56
58
60
62
64
66
68
70
72
0% 10% 15% 20% 30% 40% 50% 55% 60%
Wind share
Avera
ge p
rices
Figure 24 Average daily prices according to the share of wind in the technology portfolio
This is the supply curve of the system, the so called “merit order”, that lists the bids of the firms in
increasing order of price, assessing the quantities it can produce according to the demand.
Capacity by Merit Order
0.0
20.0
40.0
60.0
80.0
100.0
120.0
140.0
0 20000 40000 60000 80000 100000
Cumulative Capacity
Pri
ce/M
Wh
Figure 25 System’s supply curve: firms' merit order, with 20% wind share
It is interesting to spend some word on the merit order: for example at 20% wind share, the demand
intersects the supply in correspondence with the red circle, i.e. at a system marginal price of more or less 68
€/MWh. This means that all bids above this price will be excluded from production, and that automatically
rules out all plants that produce using oil, the most expensive fuel, but also some expensive plants using gas.
As for the IRR, there are no substantial differences with the benchmark case, because we have accounted for
the green certificates that are paid to firms for producing clean energy, that constitute the biggest part of the
returns that firms get.

68
Internal Rate of Return
-5%
0%
5%
10%
15%
20%
25%
30%
35%
10% 15% 20% 30% 40% 50% 55% 60%
Wind shares
IRR
Figure 26 IRR according to the share of wind in the technology portfolio
Since gas and oil-based plants have the advantage of being extremely flexible, they can be easily adjusted to
become peaking, instead of baseload plants. This is what happens with a demand peak:
Average Hourly Prices - November
0.0
20.0
40.0
60.0
80.0
100.0
120.0
1 2 3 4 5 6 7 8 9 10 11 12 13 14 15 16 17 18 19 20 21 22 23 24
Hours
Pri
ce/M
Wh
Capacity by Merit Order
0.0
20.0
40.0
60.0
80.0
100.0
120.0
140.0
0 20000 40000 60000 80000 100000
Cumulative Capacity
Pri
ce/M
Wh
Figure 27 Average hourly prices and system's supply function (20% wind share) with a demand peak at around 12 am
For instance, with 20% wind share in the technology portfolio, in correspondence with the system
marginal price goes up to 111 €, hence almost all plants generate electricity during the peak. Wind
penetration increases capacity, hence gas turbine plants can be left installed as emergency or peaking
capacity; the high running cost per hour is offset by the low capital cost and the intention to run such units
only a few hundred hours per year. They have a relatively low construction cost and modest environmental
impacts, can be built quickly, and are very efficient. Furthermore, they are at present the most flexible
technology available, and their conversion to be peaking units would be far less expensive than their
dismantling.
Not unexpectedly, the higher is the demand peak, the higher are the average prices (see Figure 28).
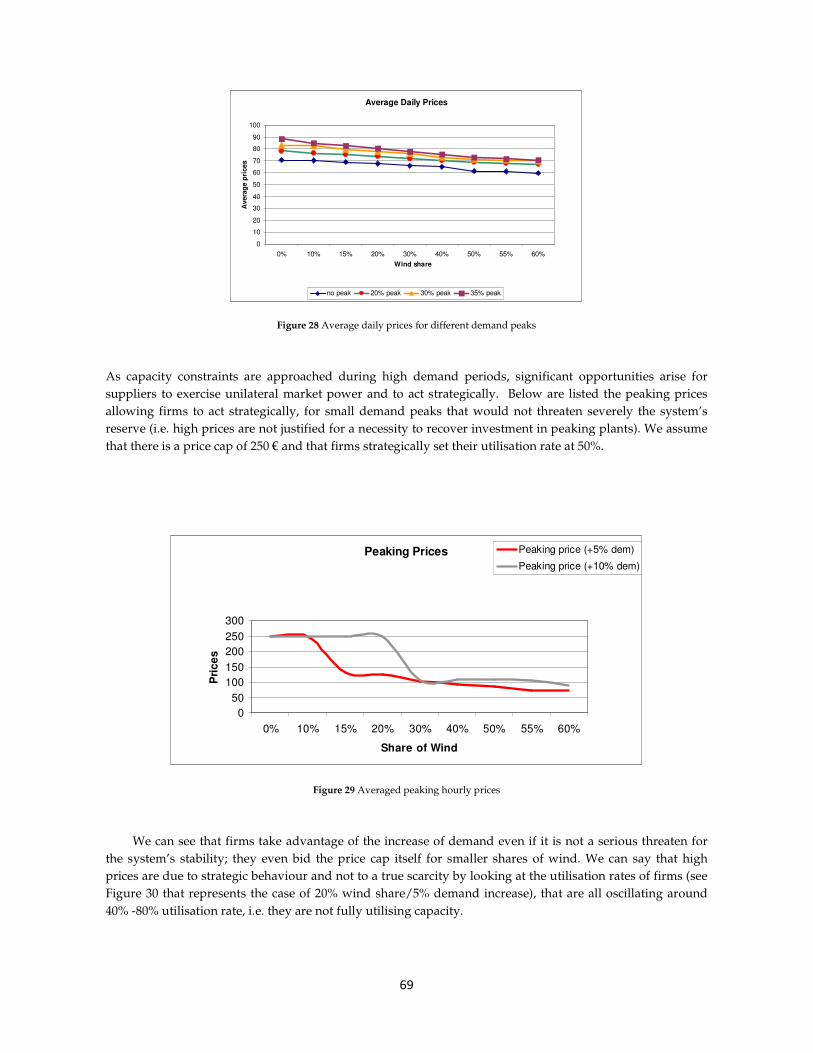
69
Average Daily Prices
0
10
20
30
40
50
60
70
80
90
100
0% 10% 15% 20% 30% 40% 50% 55% 60%
Wind share
Avera
ge p
rice
s
no peak 20% peak 30% peak 35% peak
Figure 28 Average daily prices for different demand peaks
As capacity constraints are approached during high demand periods, significant opportunities arise for
suppliers to exercise unilateral market power and to act strategically. Below are listed the peaking prices
allowing firms to act strategically, for small demand peaks that would not threaten severely the system’s
reserve (i.e. high prices are not justified for a necessity to recover investment in peaking plants). We assume
that there is a price cap of 250 € and that firms strategically set their utilisation rate at 50%.
Peaking Prices
0
50
100
150
200
250
300
0% 10% 15% 20% 30% 40% 50% 55% 60%
Share of Wind
Pri
ce
s
Peaking price (+5% dem)
Peaking price (+10% dem)
Figure 29 Averaged peaking hourly prices
We can see that firms take advantage of the increase of demand even if it is not a serious threaten for
the system’s stability; they even bid the price cap itself for smaller shares of wind. We can say that high
prices are due to strategic behaviour and not to a true scarcity by looking at the utilisation rates of firms (see
Figure 30 that represents the case of 20% wind share/5% demand increase), that are all oscillating around
40% -80% utilisation rate, i.e. they are not fully utilising capacity.

70
Rates of Utilization
0.00
0.20
0.40
0.60
0.80
1.00
1.20
1
63
125
187
249
311
373
435
497
559
621
683
745
807
869
931
993
Iterations
% o
f U
tilizati
on
FIRM1
FIRM2 (0.5)
FIRM3 (0.5)
FIRM4 (0.5)
FIRM5 (0.5)
FIRM6 (0.5)
FIRM7 (0.5)
FIRM8 (0.5)
FIRM9 (0.5)
FIRM10 (0.5)
Figure 30 Utilisation rates for the case of 5% demand increase- 20% wind share
Considering strategic behaviour for higher demand peaks makes sense only for high shares of wind (at
least 50%), because only in these cases there is enough excess reserve to allow firms to withdraw capacity.
Peaking price (+20% dem)
0
50
100
150
200
250
300
50% 55% 60%
Share of Wind
Pri
ce
Figure 31 Averaged peaking prices for demand peak of 20%
Altogether, wind seems to have a beneficial effect if there is the possibility of strategic behaviour, both
because it causes average wholesale prices to lower and because it creates new capacity.

71
4.7 Conclusions and policy implications
We run some agent-based simulations to assess the impact of a larger share of renewable energy, namely
wind, on system’s reliability, placing the results in a general discussion on mechanisms for security of
supply.
What we know from empirical and theoretical literature on this topic is that almost all the mechanisms
to deliver an adequate supply to consumers are not very popular, either because they fail to deliver the
socially optimum quantity of electricity (like the energy-only markets), or because they are perceived as cost
inefficient and not completely effective (as capacity markets).
This paper is an attempt to incorporate the development of renewable energy into the discussion, in the
belief that the considerable expansion of this sector, at least in the EU, could be at least partly a solution to
obtain system adequacy.
We show that, at least in the case of firms with composite generation portfolios, since larger shares of
wind translate in lower variable costs, the peaking price needed to maintain the system balance tend to be
lower, which is particularly favourable in presence of a price cap, but could have negative effects on the
investments in peaking units.
Nonetheless, we argue that an adequate and differentiated development of energy from renewable
sources may lessen the need for incentives in building new capacity; existing fossil fuels plants can become
peaking units and be replaced as baseload units by the new renewable-energy units.
All these considerations point to a conclusion: there is need to coordinate incentives in renewables and
incentives in new capacity, because the incentives for renewables basically are incentives in order to build
new capacity. Even though this capacity is more likely to become part of the baseload, it is still useful to
maintain system reliability, because it allows the “sparing” of fossil fuels plants that can become peaking
units.
72
5 Summary of results and future
research themes
The main themes that we dealt with in this thesis have been:
1. Are subsidies for the development of renewables crucial for the investment in wind energy?
Are firms able to recover their investment in wind power capacity?
2. How does market concentration affects the development of renewable energy?
3. How does progressive penetration of wind power affects security of supply?
The answers that we have come up to have been:
Result 1. Renewables support policies seem to be essential in the first stages of the technology
deployment, but they become less necessary as wind penetration increase, because firms become
progressively able to stand with their own strengths. That is due to the more than sufficient amount
of subsidies given at the early stage of investments, which can be used for subsequent investments,
and to the higher profits that can be exploited thanks to the lower variable cost and higher profits
deriving from a larger share of wind in the technology portfolio. An important policy implication is
to use an amount of subsidies related to the stage of development of the technology and related to
the concentration of the market and to the degree of risk of strategic behaviours by firms.
Result 2. Small increases of wind capacity are likely to be more effective in terms of firms’ ability to
recover investment with respect to big increases; hence, since EU strictly mandates the share of
energy that must be generated by renewable sources, postponing the investment in renewables is
costly, because implies larger and less performing investments in the future.
Result 3. Since wind energy leads to lower wholesale prices it could impair the investment
incentives in new capacity in order to withstand unanticipated demand peaks. However,
coordinating the incentives to invest in wind and in new capacity could at least partly solve the
problem, because incentives for renewables basically are incentives in order to build new capacity,
and having two types of incentives to get the same outcome is inefficient.
Result 4. An adequate and differentiated development of energy from renewable sources lessens the need
for incentives in building new capacity; existing fossil fuels plants can become peaking units and be replaced

73
as baseload units by the new renewable-energy units. Wind seems to be particularly beneficial if there is
possibility of strategic behaviour.
This thesis can only explore a small fraction of a complex and evolving environment like the
electricity markets. Many questions are left unanswered or incomplete. However, I am working to
push further some themes that I have started to study but not fully developed, and precisely:
- How the attractions of returns for wind may change with increasing and close to full
decarbonisation; I plan to increase the wind penetration in the simulations to see what
would happen for higher shares of wind.
- Technology diversification; more technologies and more differentiations will be added in
the baseline model.
- Wind supply shock; this theme has been widely tested by meteorologist, using complex
simulation models. Gathering information about the likelihood and the frequencies of such
occurrence, I would like to test its effects on the market, to see what it would be its effect on
prices, especially if combined with a demand shock.

74
References
1. Ajodhia, V., Hakvoort, R.A., Van Gemert, M., 2002. Electricity outage cost valuation: a survey. In: Proceedings of CEPSI 2002, Fukuoka, Japan
2. Almeida, E.L.F. 2004. Reform in Brazilian Gas and Electricity Industries: The Search for a New Model. Unpublished Background Paper, OECD, Paris
3. Amman, H.M., Tesfatsion, L., Judd, K.L., Kendrick, D.A., J. Rust, 2006. Handbook of computational economics: Agent-based computational economics. North-Holland
4. Archer, C.L., Jacobson, M.Z., 2007. Supplying Baseload Power and Reducing Transmission Requirements by Interconnecting Wind Farms. Journal of Applied Meteorology and Climatology Vol. 46, November
5. Armstrong, M. and D. Sappington. 2006. Regulation, Competition and Liberalization. Journal of Economic Literature, XLIV, 325-366
6. Averch, H. and L.L. Johnson. 1962. Behavior of the Firm under Regulatory Constraint. American Economic Review, 52: 1059-69
7. Axelrod, R. 1997. The Complexity of Cooperation: Agent-Based Models of Competition and Collaboration. Princeton: Princeton University Press
8. Baldick, R. 2002. Electricity Market Equilibrium Models: The Effect of Parametrization. IEEE Transactions on Power Systems, Vol. 17, No. 4, November, pp. 1170-1176
9. Banal-Estanol, A., Rupérez Micola, A. 2010. Behavioural simulations in spot electricity markets.
10. Battle, C. and Rodilla, P., 2010. A critical assessment of the different approaches aimed to secure electricity generation supply. Energy Policy 38, 7169–7179
75
11. Bell Gully. 2009. Improving electricity market performance: preliminary Ministerial report. Report to the Ministry of Economic Development http://www.bellgully.com/resources/resource.02395.asp
12. Billinton R., Allan, R.N., Salvaderi, L. (Eds.), 1991. Applied Reliability Assessment in Electric Power Systems. IEEE, New York
13. Boiteux, M., 1960. Peak load pricing. Journal of Business 33, 157-179 (translated from the original in French published in 1951)
14. Bolle, F. 1992. Supply function equilibria and the danger of tacit collusion: The case of spot markets for electricity”. Energy Economics, vol. 14, no. 2, pp. 94-102
15. Bower, J., Bunn, D.W. 2000. Model-based comparisons of pool and bilateral market mechanism for electricity trading, Energy Journal 21 (3), pp. 1–29
16. Bower, J., Bunn, D., Wattendrup, C. 2001. A model-based analysis of strategic consolidation in the German electricity industry. Energy Policy, Volume 29, Issue 12, October, pp. 987-1005
17. Bulan, L. T. 2005. Real Options, Irreversible Investment and Firm Uncertainty: New Evidence from U.S. Firms. Review of Financial Economics, Real Options Special Issue, Vol. 14, pp. 255-279
18. Bulan, L. T., Mayer, C., Somerville, C. T. 2009. Irreversible investment, real options, and competition: Evidence from real estate development. Journal of Urban Economics n. 65 pp. 237–251.
19. Bulan, L. T., Sanyal P. 2009. Is there room for growth? Debt, growth opportunities and the deregulation of the U.S. electric utilities.
20. Bunn, D., Oliveira, F. 2001. An Application of Agent-based Simulation to the New Electricity Trading Arrangements of England and Wales. Computing in Economics and Finance 93, Society for Computational Economics
21. Bürer, M. J., Wüstenhagen, R. 2009. Which renewable energy policy is a venture capitalist’s best friend? Empirical evidence from a survey of international cleantech investors. Energy Policy n. 37, pp. 4997–5006
22. Butler, L. Neuhoff, K. 2004. Comparison of Feed in Tariff, Quota and Auction Mechanisms to Support Wind Power Development. CMI Working Paper.
23. Caramanis,M.C., 1982. Investment decisions and long-term planning under electricity spot pricing. IEEE Transaction on Power Apparatus and Systems PAS-101 (12).

76
24. Castro-Rodriguez, F., Marìn P., Siotis, G. 2009. Capacity choices in liberalized electricity markets. Energy Policy 37
25. Chandley, J. 2005. ICAP reform proposals in New England and PJM, LECG. Report to the California ISO, September
26. Coase, R. H. 1960. The Problem of Social Cost. Journal of Law and Economics, Vol. 3 (October).
27. Curzon-Price, T., 1997. Using co-evolutionary programming to simulate strategic behaviour in markets. Journal of Evolutionary Economics 7(3) 219–254. http://link.springer.de/link/service/journals/00191/tocs/t7007003.htm
28. Czernohous, C., Fichtner, W., Veit, D., Weinhardt, C. 2003. Management decision support using long term market simulation. Journal of Information Systems and e-Business Management (ISeB), 1(4), pp. 405-423
29. Day, C., 1999. A computational approach to modelling strategic behaviour in electric power pools. PhD Thesis, London Business School, Sussex Place Regent’s Park, London NW1 4SA, United Kingdom
30. Day, C., Bunn, D. W. 2001. Divestiture of generation assets in the electricity pool of England and Wales: a computational approach to analysing market power, Journal of Regulatory Economics 19 (2), pp. 123–141
31. De Vries, L.J., 2007. Generation adequacy: Helping the market do its job. Utilities Policy 15 (1)
32. Drillisch, J., Riechmann, C. 1998. Liberalisation of the Electricity Supply Industry -Evaluation of Reform Policies. EWI Institute of Energy Economics at the University of Cologne
33. EIA. 2009. International Energy Annual - www.eia.doe.gov
34. European Wind Energy Association (EWEA). 2009. Wind Energy - the Facts. Volume 2 (March). http://www.ewea.org/fileadmin/ewea_documents/documents/publications/WETF/Facts_Volume_2.pdf
35. Fabra, N., von der Fehr, N-H., Harbord, D. 2006. Designing Electricity Auctions. The RAND Journal of Economics. Vol. 37, No. 1 (Spring), pp. 23-46
36. Fagiolo, G., Christopher Birchenhall, and Paul Windrum (Eds.). 2007. Empirical Validation in Agent-Based Models: Introduction to the Special Issue. Computational Economics, Volume 30, Number 3

77
37. Finon, D., Pignon, V. 2008. Electricity and long-term capacity adequacy: The quest for regulatory mechanism compatible with electricity market. Utilities policy 16 (3), 143-158
38. Genc, T. and Reynolds, S.S. 2004. Supply Function Equilibria with Pivotal Electricity Suppliers (July). Eller College Working Paper No.1001-04
39. Green, R. & Vasilakos, N. 2010. Market behaviour with large amounts of intermittent generation. Energy Policy , vol. 38(7), pp. 3211-3220, July
40. Green, R.J. 1996. Increasing competition in the British electricity spot market, Journal of Industrial Economics XLIV (2), pp. 205–216
41. Green, R.J. and Newbery, D.M. 1992. Competition in the British electricity spot market. Journal of Political Economy 100 (5): 929–53
42. Hamalainen, R.P. 1996. Agent-based modelling of the electricity distribution system. Proceedings of the IASTED International Conference Modelling, Identification and Control, Innsbruck, Austria, February 19–21, 1996, pp. 344–346
43. Hartwick, J. M. 1978. Investing returns from depleting renewable resource stocks and intergenerational equity. Economics Letters, Elsevier, vol. 1(1), pp 85-88
44. Hotelling, H. 1931. The Economics of Exhaustible Resources, Journal of Political Economy
45. Il Sole24Ore. 2011. Issue of January 27.
46. Joskow, P.L. 2007. Competitive electricity markets and investment in new generating capacity. In: Helm, D. (Ed.), The New Energy Paradigm. Oxford University Press
47. Joskow, P. L. 2008. Capacity payments in imperfect electricity markets: Need and design. Utilities policy 16 (3), 159-170
48. Joskow, P.L., Tirole, J., 2007. Reliability and competitive electricity markets. Rand Journal of Economics 38 (1), 60-84
49. Kahn, E. P. 1998. Numerical techniques for analyzing market power in electricity. Electricity Journal 11(6): 34–43

78
50. Kariuki, K.K., Allan, R.N.1996. Evaluation of reliability worth and value of lost load. IEE Proceedings on Generation, Transmission and Distribution 143 (2), 171e180
51. Key, H. J. 2008. Policy on Energy. http://www.national.org.nz/Article.aspx?ArticleId=28403
52. Klemperer, P.D., Meyer, M.A. 1989. Supply function equilibria in oligopoly under uncertainty. Econometrica. 57, 1243–1277
53. Kuhn, I. 1999. New competition-based support schemes for electricity generation from renewable energy sources. Paper presented at the 1st Austrian-Czech- German Conference on ‘Energy Market Liberalisation in Central and Eastern Europe’, 6–8 September 1999, Prague.
54. Langniss, O. (Ed.), 1999. Financing Renewable Energy Systems. DLR, Stuttgart
55. Laussel, D. 1992. Strategic Commercial Policy Revisited: A Supply-Function Equilibrium Model. American Economic Review. American Economic Association, vol. 82(1), pp 84-99, March
56. Lüthi, S., Wüstenhagen, R. 2008. Effective deployment of photovoltaics in Mediterranean countries: balancing policy risk and return. Paper presented at the DEMSEE 2008 International Conference on Deregulated Electricity Market Issues in South-Eastern Europe. September 22–23, 2008 Nicosia, Cyprus
57. MED, Ministry of Economic Development. 2006. Investment in Electricity Generation by Lines Companies. Discussion Paper http://www.med.govt.nz/upload/34734/discussion.pdf
58. Menanteau, P., et al. 2003. Price versus quantity: choosing policies for the promoting the development of renewable energy. Energy Policy 31 (9), 799–812
59. Midttun, A., Gautesen, K. 2007. Feed in on certificates, competition or complementarity? Combining a static efficiency and a dynamic innovation perspective on the greening of the energy industry. Energy Policy n. 35, pp. 1419-1422
60. Mitchell, C., 2000. The England and Wales non-fossil fuel obligation: history and lessons. Annual Review of Energy and the Environment 25, 285–312
61. Mitchell, C., Bauknecht, D., Connor, P.M., 2006. Effectiveness through risk reduction: a comparison of the renewable obligation in England and Wales and the feed-in system in Germany. Energy Policy 34 (3), 297–305
62. Newbery, D., 2009. Market design for a large share of wind power. Energy policy 38, No. 7. pp. 3131-3134
79
63. NERC. 2009. Special Report: Accommodating High Levels of Variable Generation. April
64. NZIER, New Zealand Institute of Economic Research. 2005. Market Design Report
65. NZIER. 2007. The markets for electricity in New Zealand. Report to the Electricity Commission
66. OECD. 2005. Economic Survey of Brazil. Chapter 3: Regulation of the Electricity Sector
67. Oren, S.S. 2000. Capacity payments and supply adequacy in competitive electricity markets. In: Proceedings of the VII Symposium of Specialists in Electric Operational and Expansion Planning, Curitiba, Brazil, May 21e26
68. PJM, 2007.NJ BPU Energy Master Plan. PJM Presentation, February
69. Perez-Arriaga, I.J., Meseguer, C. 1997. Wholesale marginal prices in competitive generation markets. IEEE Transactions on Power Apparatus and Systems, Vol. PAS-101, No. 12
70. Poyry. 2009. Impact of intermittency: How wind variability could change the shape of the British and the Irish electricity markets. Summary report
71. Roth, A.E. and I. Erev. 1995. Learning in extensive-form games: Experimental data and simple dynamic models in the intermediate term." Games and Economic Behavior, vol. 8, issue 1, pp. 164-212
72. Sàenz de Miera, G., del Rìo Gonzàlez, P., Vizcaìno, I. 2008. Analysing the impact of renewable electricity support schemes on power prices: the case of wind electricity in Spain. Energy Policy 36 (9), pp. 3345–3359
73. Sensfuß, F. 2007. Assessment of the impact of renewable electricity generation on the German electricity sector: An agent-based simulation approach. Dissertation, Universität Karlsruhe (TH)
74. Sensfuß, F., Ragwitz, M., Genoese, M. 2008. The merit-order effect: a detailed analysis of the price effect of renewable electricity generation on spot market prices in Germany. Energy Policy 36(8), pp. 3076–3084
75. Schelling, T. 1978. Micromotives and Macrobehavior. Norton, Chapter 4 “Sorting and mixing”
76. Sioshansi, R., Oren, S., 2007. How good are supply function equilibrium models: an empirical analysis of the ERCOT balancing market. Journal of Regulatory Economics 31, pp. 1–35

80
77. Solow, R. M., 1974. The economics of resources or the resources of economics. American Economic Review, 64 (2), 1-14
78. Stoft, S. 2002. Power System Economics: Designing Markets for Electricity. IEEE Press
79. Szabò S., Jaeger-Waldau, A. 2008. More Competition: Threat or chance for financing renewable electricity? Energy Policy n. 36, pp. 1436-1447
80. Twomey, P., Neuhoff, K. 2009. Wind power and market power in competitive markets. Energy Policy, doi:10.1016/j.enpol.2009.07.031
81. Varian, H.R. 1992. Microeconomic Analysis. W.W. Norton & Company. New York
82. Vázques, C, Rivier, M., Pérez-Arriaga I. J. 2002. A Market Approach to Long-Term Security of Supply”. IEEE Trans. Power Systems, vol. 17, no. 2
83. Ventosa, M., Baillo, A., Ramos, A. and M. Rivier. 2005. Electricity market modeling trends. Energy Policy 33, pp. 897–913
84. von der Fehr, N.-H., Harbord, D. 1993. Spot market competition in the UK electricity industry. Economic Journal, vol. 103, no. 418, pp. 531–546
85. von der Fehr, N-H., Harbord, D.C. 1997. Capacity investment and competition in decentralized electricity market, Department of Economics Working Paper, University of Oslo
86. WEO World Economic Outlook. 2010
87. Wildrum, P., Fagiolo, G., Moneta, A. 2007. Empirical Validation of Agent-Based Models: Alternatives and Prospects. Journal of Artificial Societies and Social Simulation vol. 10, no. 2, 8
88. Willems, B., Rumiantseva, I. and H. Weigt. 2009. Cournot versus Supply Functions: What does the data tell us? Energy Economics 31, pp. 38–47
89. Willis, K.G., Garrod, G.D.1997. Electric supply reliability estimating the value of lost load. Energy Policy 25 (1)
90. World Bank. 2004. Colombia: Recent Economic Developments in Infrastructure (REDI). Balancing
Social and Productive Needs for Infrastructure
91. Zucarato, A., da Silva, E. L. 2009. Long Term Simulation of Capacity Market Considering Uncertainty Demand and Agents’ Strategic Behavior in a Hydro-Based System. EEM 2009. 6th International Conference on the European Energy Market