miriam comparison of rolling resistance measuring equipment
TRANSCRIPT

MIRIAM 22
Comparison of Rolling Resistance Measuring
Equipment - Pilot Study
Anneleen Bergiers, BRRC Luc Goubert, BRRC Fabienne Anfosso-Lédée, IFSTTAR Niels Dujardin, DRI Jerzy A. Ejsmont, TUG Ulf Sandberg, VTI Marek Zöller, BASt MIRIAM, SP1 Deliverable No. 3 Final version 2011-12-31

Table of contents Table of contents..........................................................................................................1 Foreword ......................................................................................................................4 Acknowledgements ......................................................................................................5 Abbreviations and acronyms........................................................................................6 1. ...........................................................................................................8 Introduction2. ............................................................................................9 Purpose of the study3. ........................................................................................10 Measurement devices
3.1 ......................................................10 Trailers used in measurements on site3.2 ..........................................................12 Drum measurements in laboratories
4 .................................................................................15 Test location and surfaces4.1 ....................................................................................................15 Test track4.2 .....................................................................................15 Test track surfaces4.3 ........................................................................19 Texture of the test sections
4.3.1 .......................................................................................19 Texture spectra4.3.2 .................................................................................21 Mean Profile Depth4.3.3 ..........................................................................................22 Homogeneity4.3.3.1 .........................................................................................22 Transversal4.3.3.2 ........................................................................................23 Longitudinal4.3.4 .........................23 Intercorrelation of one-third-octave band texture levels
5 ..................................................................................................................25 Tyres5.1 ............................................................................................25 Characteristics5.2 ..............................................................................26 Tyre pressure and load5.3 .......................................................................................................26 Wheels
6 .......................................................................................27 Measurement program6.1 .....................................27 Comparison tests of the three measuring devices
6.1.1 .......................................................................................................27 BASt6.1.2 .....................................................................................................27 BRRC6.1.3 ........................................................................................................28 TUG
6.2 .................................................28 Additional tests to explore certain features6.2.1 .................................................................................28 Tyres (TUG/ BASt)6.2.2 ...........................................................................28 Speed influence (TUG)6.2.3 ...................................................................................28 Warm-up (BRRC)6.2.4 ..................................................29 Influence of wheel adjustment (BRRC)6.2.5 .......................................................................29 Cement concrete (BRRC)
7 ....................................................................................30 Measurement procedure8 ..........................................................................................31 Measurement results
8.1 ...........................................................................................................31 Wind8.2 ..............................................................................31 Temperature correction8.3 .................................................................32 Repeatability of the RR devices
8.3.1 .......................................................................................................32 BASt8.3.1.1 ......................................................................32 Short term repeatability8.3.1.2 ......................................................................33 Day-to-day repeatability8.3.2 .....................................................................................................35 BRRC8.3.2.1 ......................................................................35 Short term repeatability8.3.2.2 ......................................................................36 Day-to-day repeatability8.3.3 ........................................................................................................36 TUG8.3.3.1 ......................................................................36 Short term repeatability8.3.3.2 ......................................................................37 Day-to-day repeatability
8.4 ..............................................................37 Reproducibility of the RR devices8.4.1 ............................................................................................38 BASt – TUG8.4.1.1 ...............................................................................38 All measurements8.4.1.2 ..............39 Relation between BASt and TUG ES16 tyre measurements
1

8.4.1.3 .............41 Relation between BASt and TUG SRTT tyre measurements8.4.1.4 .............42 Relation between BASt and TUG AAV4 tyre measurements8.4.2 ..........................................................................................44 BRRC – TUG8.4.2.1 ...............................................................................44 All measurements8.4.2.2 ............45 Relation between BRRC and TUG ES14 tyre measurements8.4.3 ..........................................................................................47 BASt - BRRC8.4.3.1 ...............................................................................47 All measurements8.4.3.2 .48 Relation between ES16/BASt and ES14/BRRC tyre measurements
9 ...................................................................................................50 Additional tests9.1 ..........................................................................................................50 Tyres
9.1.1 ........................................................................................50 Measurements9.1.2 ..........................................................................51 Tyre related corrections9.1.3 .......................................................................58 Trailer related differences
9.2 ..........................................................................................61 Speed influence9.3 .....................................................................................................63 Warm-up9.4 ..............................................................................65 Influence of side forces9.5 ........................................................................................67 Cement concrete
10 ..........................................................................................68 Drum measurements10.1 ...........................................................................................................68 BASt10.2 ............................................................................................................68 TUG10.3 ................................................................................................71 BASt – TUG10.4 .....................................................................................71 Data from Michelin
11 ...............................................................72 Texture influence on rolling resistance11.1 ...................................................................72 Texture measurement devices
11.1.1 .................................................................................................72 BRRC11.1.2 ...................................................................72 IFSTTAR / CETE of Lyon11.1.3
.............................................................................................73 Comparison texture measurements performed by IFSTTAR and
BRRC on test track11.2 ..........................................................74 One-third-octave band texture levels
11.2.1 .............................................................................74 Without enveloping11.2.2 ..................................................................................75 With enveloping
11.3 ...........................................................................................................76 MPD11.3.1 .............................................................................76 Without enveloping11.3.2 ..................................................................................77 With enveloping
11.4 ...................................79 Band-limited macrotexture and megatexture levels11.4.1 .......................................................................................79 Macrotexture11.4.1.1 .........................................................................79 Without enveloping11.4.1.2 ..............................................................................81 With enveloping11.4.2 ........................................................................................82 Megatexture11.4.2.1 .........................................................................82 Without enveloping11.4.2.2 ..............................................................................84 With enveloping
11.5 .........................................................85 MPD, macrotexture and megatexture11.5.1 ........................................................................................85 Correlations11.5.1.1 .........................................................................85 Without enveloping11.5.1.2 ..............................................................................86 With enveloping11.5.2 ...............................................................................87 Slope coefficients11.5.2.1 .........................................................................87 Without enveloping11.5.2.2 ..............................................................................90 With enveloping
11.6 ...............................................................................................................92 IRI12 ........................................................................................................95 Conclusions13 .........................................................................................................97 ReferencesAnnexes .....................................................................................................................98 A. ...98 Texture spectra measured in middle, right and left wheel track direction eastB.
.............................................................................102 Correlation between MPD and C for various tyres measured by different
participants – without envelopingr
2
C. ..................................................................................105
Correlation between MPD and C for various tyres measured by different participants – with enveloping
r
D. ...............................................................108
Correlation between macrotexture and C for various tyres measured by different participants – without enveloping
r
E. ....................................................................111
Correlation between macrotexture and C for various tyres measured by different participants – with enveloping
r
F. .............................................................................114
Correlation between megatexture and C for various tyres measured by different participants – without enveloping
r
G. ..................................................................................117
Correlation between megatexture and C for various tyres measured by different participants – with enveloping
r
H. .....120 Correlation between IRI and C for various tyres and different participantsr
3
Foreword The order of co-authors on the front page, following main author Bergiers and second author Goubert, is by alphabetical order and has nothing to do with the extent or importance of the contributions. MIRIAM, an acronym for "Models for rolling resistance In Road Infrastructure Asset Management systems", is a project started and funded by twelve partners from Europe and USA. The managing partner is the Danish Road Institute. The overall purpose of MIRIAM is to provide information useful for achieving a sustainable and environmentally friendly road infrastructure. In this project, the focus is on reducing the energy consumption due to the tyre/road interaction, by selection of pavements with lower rolling resistance – and hence lowering CO2 emissions and increasing energy efficiency. A first phase of the project will contribute with investigation of pavement characteristics, energy efficiency, modelling, and raising awareness of the project in order to secure economical and political support for a second phase. The second phase will focus on development and implementation of CO2 controlling models into the road infrastructure asset management systems. The website of MIRIAM is http://www.miriam-co2.net/ where comprehensive project information can be found. MIRIAM has been divided into five sub-projects (SP), of which SP 1 is "Measurement methods and surface properties model". This report is part of task 15 within SP 1 and is the fourth Deliverable of SP 1. The Deliverables of Phase 1 are the following:
Deliverable 1: “Rolling Resistance – Basic Information and State-of-the-Art on Measurement methods” Deliverable 2: "Rolling Resistance – Measurement Methods for Studies of Road Surface Effects" Deliverable 3: “Comparison of Rolling Resistance Measuring Equipment - Pilot Study" Deliverable 4: “Road surface influence on tyre/road rolling resistance"
These are all represented by written reports. See the MIRIAM website to download the reports, or to check where the reports may be downloaded.
4

Acknowledgements The authors would like to thank IFSTTAR for their hospitality and for opening up the test tracks in Nantes for the round robin test. Thanks are especially in order for Mrs. Fabienne Anfosso-Lédée and Mr. Patrice Bernier. MIRIAM is funded by contributions by the participating organizations, mainly to cover their own work, as well as pooled funding for which contributions have been obtained collectively by some of the participating organizations and which may be used for special purposes. The work presented in this report has been funded both by the participating organizations themselves (see list of authors) and by the pooled funding.
5

Abbreviations and acronyms Abbreviation /acronym
Explanation Comment
AAV4 Test tyre Avon AV4 Specified in section 5.1 BASt Bundesanstalt für
Straßenwesen Federal Highway Research Institute, in English
BRRC Belgian Road Research Centre
Cr Rolling Resistance Coefficient Also abbreviated “RRC” CT Symbol indicating a tyre
having a corrupted tread
ES14 Michelin Energy Saver 14” tyre Specified in section 5.1 ES16 Michelin Energy Saver 16” tyre Specified in section 5.1 IFSTTAR l’Institut Français des
Sciences et Technologies des Transports, de l’Aménagement et des Réseaux
French institute of sciences and technology for transport, development and networks
IRI International Roughness Index Standardized in ASTM E1926 - 08
LMa Macrotexture level: special case of logarithmic texture profile level with the profile passing through a band-pass filter encompassing all one-third-octave bands within the macrotexture range (0.63 mm to 50 mm of centre wavelengths) [1]. Unit: dB vs 1 µm rms.
LMe Megatexture level: special case of logarithmic texture profile level with the profile passing through a band-pass filter encompassing all one-third-octave bands within the megatexture range (63 mm to 500 mm of centre wavelengths) [1]. Unit: dB vs 1 µm rms.
MPD Mean Profile Depth, a measure representing pavement texture depth
Standardized in ISO 13473-1
R2 Correlation coefficient R squared
This is a measure of the variance explained by the tested regression
RR Sometimes used as an abbreviation for Rolling Resistance
RRC In this report the symbol Cr is used for the Rolling Resistance Coefficient
6

RRT Sometimes used as an
abbreviation for Round Robin Test
Extensive test comparing a number of measuring devices or subjects; in this case rolling resistance trailers
SRTT Standard Reference Test Tyre Specified in section 5.1 TUG Technical University of
Gdansk, Poland
VTI Swedish National Road and Transport Research Institute
XXXX/YYYY
Tyre type XXXX, owned by institute YYYY, measured by institute YYYY (unless specified otherwise)
XXXX/YYYY_ZZZZ Tyre type XXXX, owned by institute YYYY, measured by institute ZZZZ
XXXX/YYYY_50 Tyre type XXXX, owned by institute YYYY, measured at 50 km/h
XXXX/YYYY_80 Tyre type XXXX, owned by institute YYYY, measured at 80 km/h
7

1. Introduction
This research is part of the MIRIAM project (Models for rolling resistance In Road Infrastructure Asset Management systems), which aims at developing methods for improved control of road transport carbon dioxide (CO2) emissions in order to obtain sustainable and environmental friendly road infrastructure. As a first part of MIRIAM, a “Phase 1” was conducted in 2010-2011. It is planned to start a “Phase 2” in 2012. MIRIAM is divided into five sub-projects. Sub-project number 1 (SP 1) is designated “Measurement methods and surface properties model”, and lead by Ulf Sandberg, VTI. Within SP 1, one of the major tasks is to study various measurement methods and the performance of available measurement equipment for rolling resistance, with a focus on measuring the pavement properties. As part of this task, in 2011 an international experiment was conducted to compare the measurement devices available within the MIRIAM project. This comparison experiment was popularly called “Round Robin Test” (RRT), which is the name used in this report. The RRT was organized from 6 to 10 June 2011 on the test track owned by IFSTTAR in Nantes, France. Three institutes participated with their rolling resistance trailers: BASt, BRRC, and TUG. The practical organization was coordinated by IFSTTAR and the technical organization by BRRC. Texture measurements were performed by BRRC to verify the homogeneity of the test sections. Measurements on drums in laboratories were performed by BASt and TUG with the same tyres as used in the RRT. At a later stage also truck rolling resistance measurements were carried out on a smaller selection of surfaces on the test track in Nantes. However, when this report was written these measurement results were not yet available1. This experiment was, as far as the authors are aware, the first time when this type of devices was compared. This report presents the RRT in terms of how it was carried out and the results obtained.
1 The results of this test are planned to be presented in January 2012 at BASt.
8

2. Purpose of the study The main purposes of the study were:
To assess the repeatability of the individual devices To evaluate how well the results of the trailers correlate with each other To assess the influence of the texture, expressed in terms of third of octave
texture levels, broad band texture levels and the Mean Profile Depth, on the rolling resistance
To measure the influence of the tyres on the rolling resistance and how they classify the pavements
9

3. Measurement devices
3.1 Trailers used in measurements on site The following organizations provided rolling resistance measuring devices in the form of towed trailers for comparison on the test track of IFSTTAR: Belgian Road Research Centre (BRRC)
- Staff: Anneleen Bergiers and Philippe Debroux Bundesanstalt für Straßenwesen (BASt)
- Staff: Marek Zöller and Jens Steinheuer Technical University of Gdansk (TUG)
- Staff: Jerzy Ejsmont and Grzegorz Ronowski
The devices are described and compared in Table 3.1 below. The trailers are further described in [2]. Photos are shown in Figure 3.1 to Figure 3.4.
Table 3.1: Essential features of trailers used during the round robin test in Nantes
Owner organization BASt BRRC TUG
Test tyre size 14”-16” 14” 14”-16”
Wind shield yes no yes
Force/angle measurement force angle angle
Number of supporting tyres 2 0 (test tyre is supporting tyre)
2
Number of test tyres 1 1 1
Self-supporting construction no no yes
Tyre load 4000 N 2000 N 4000 N
Tyre pressure 200 kPa 200 kPa 210 kPa
Exterior/Interior tyre temperature measurement
exterior exterior/interior exterior
Corrections made during measurement or afterwards?
afterwards afterwards during measurement
Measurement in wheel track or middle track?
middle track middle track middle track
10

Figure 3.1: Trailer BASt
Figure 3.2: Trailer BRRC
11

Figure 3.3: Trailer TUG
Figure 3.4: All participating trailers on test track
3.2 Drum measurements in laboratories The following organizations provided rolling resistance measurements on laboratory drums, as a supplement to the field measurements by trailers: Bundesanstalt für Straßenwesen (BASt)
- Staff: Marek Zöller and Jens Steinheuer Technical University of Gdansk (TUG)
- Staff: Jerzy Ejsmont and Grzegorz Ronowski The devices are described and compared in Table 3.2 below for the MIRIAM test conditions. The drum facilities are further described in [2]. Photos are shown in Figure 3.5 and Figure 3.6.
Table 3.2: Essential features of drums used for this research
Owner organization BASt TUG
Drum diameter 5.5 m inner diameter 1.7 m
12

Drum surface Sandpaper “Safety Walk” and Steel drum
Sandpaper “Safety Walk” and APS
Tyre load 4000 N 4000 N
Tyre pressure 200 kPa 200 kPa
Measuring principle direct force measurement (see [2] section 9.1.3)
TUG standard (see [2] section 9.3.2)
Correction for flat surface no yes
Figure 3.5: Drum BASt
Figure 3.6: Drum TUG
13
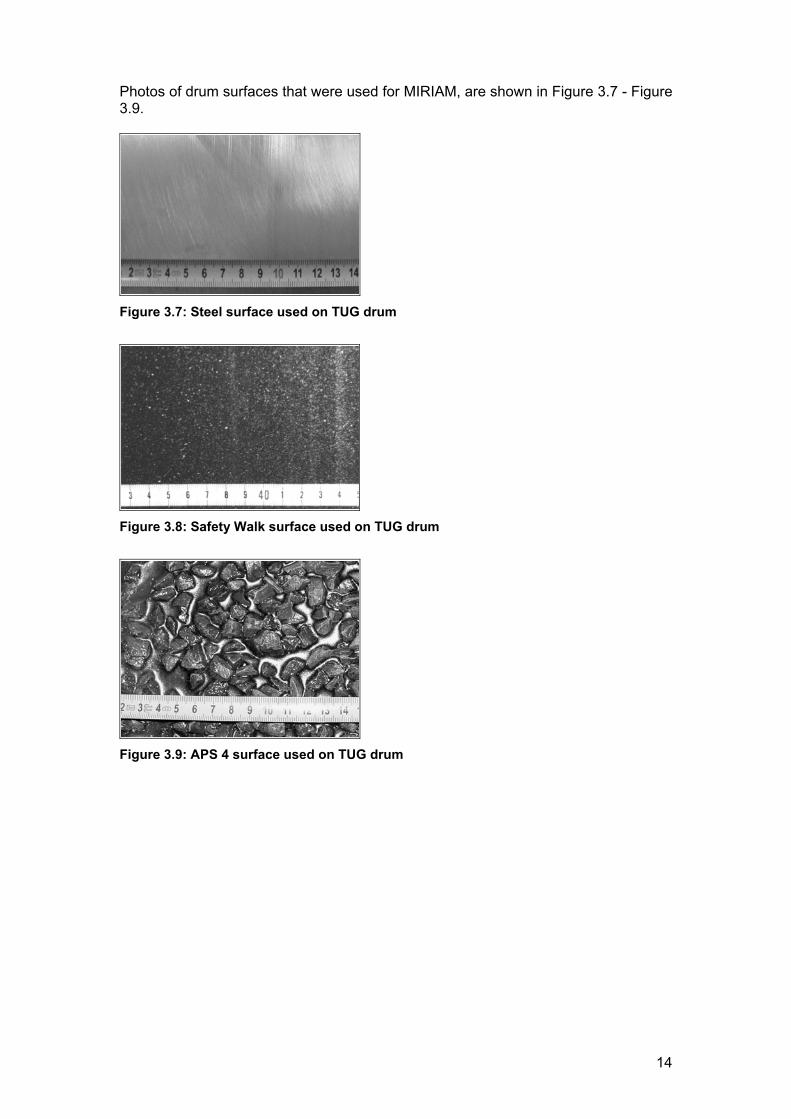
Photos of drum surfaces that were used for MIRIAM, are shown in Figure 3.7 - Figure 3.9.
Figure 3.7: Steel surface used on TUG drum
Figure 3.8: Safety Walk surface used on TUG drum
Figure 3.9: APS 4 surface used on TUG drum
14

4 Test location and surfaces
4.1 Test track The test track is situated adjacent to the IFSTTAR offices in Nantes, France. It consists of a large half circle followed by test sections with different road surfaces.
Figure 4.1: The IFSTTAR test track, with the test sections expanded below
4.2 Test track surfaces An overview of all test sections is shown in Table 4.1 and a more detailed description with pictures may be found in Table 4.2.
Table 4.1: Summary of test sections
Pavement designation
Description
M1 Very Thin Asphalt Concrete 0/10, class 1 F Colgrip: Surface Dressing 1/3 bauxite (high skid resistance) L1 Epoxy Resin (smooth section)
15

L2 Sand Asphalt 0/4 E1 Dense Asphalt Concrete 0/10 (new) E2 Dense Asphalt Concrete (old) M2 Very Thin Asphalt Concrete 0/6, class 2 C Surface Dressing 0.8/1.5 A’ Surface Dressing 8/10 A Porous Asphalt Concrete 0/6 N Porous Cement Concrete CC (Dense) Cement Concrete
Table 4.2: Description of test sections (the coin in the pictures has a diameter of 23 mm)
Section Pavement Photo Length Remarks
M1 Very Thin Asphalt Concrete 0/10, class 1
244 m Grinded in middle, steel plate at km point 1550
F Colgrip: Surface Dressing 1/3 bauxite (high skid resistance)
250 m
L1 Epoxy Resin (smooth section)
128 m Peeling
16
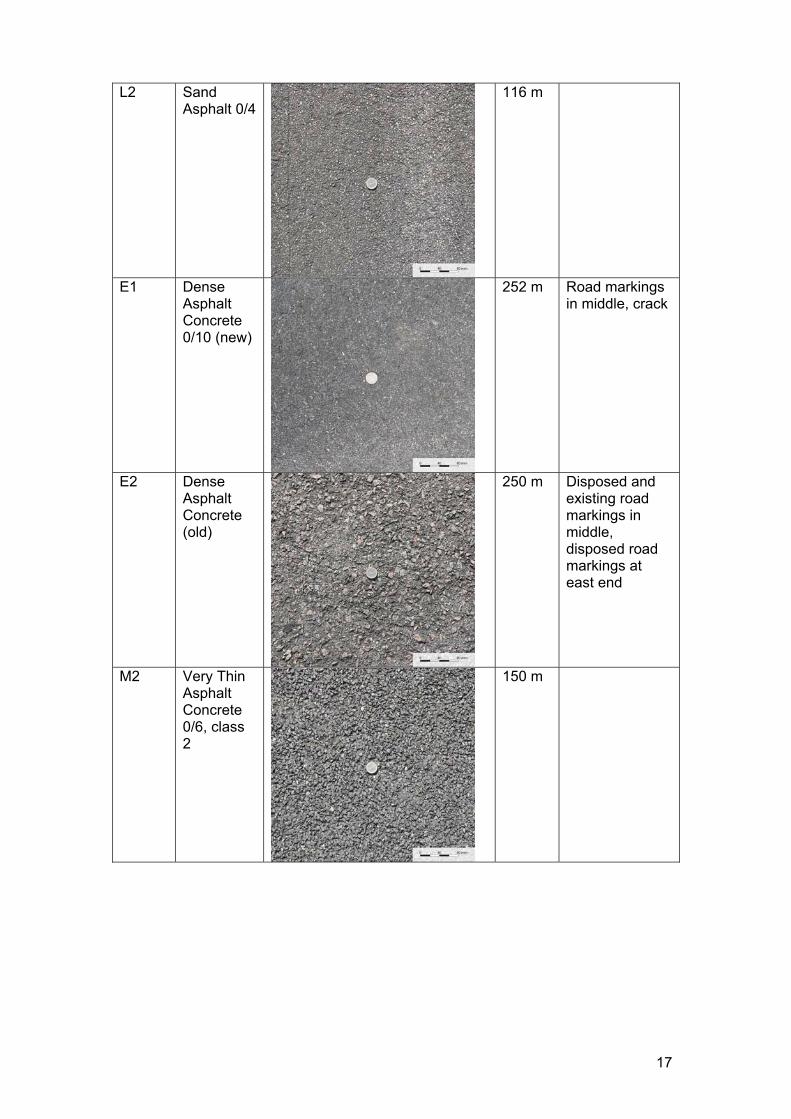
L2 Sand Asphalt 0/4
116 m
E1 Dense Asphalt Concrete 0/10 (new)
252 m Road markings in middle, crack
E2 Dense Asphalt Concrete (old)
250 m Disposed and existing road markings in middle, disposed road markings at east end
M2 Very Thin Asphalt Concrete 0/6, class 2
150 m
17
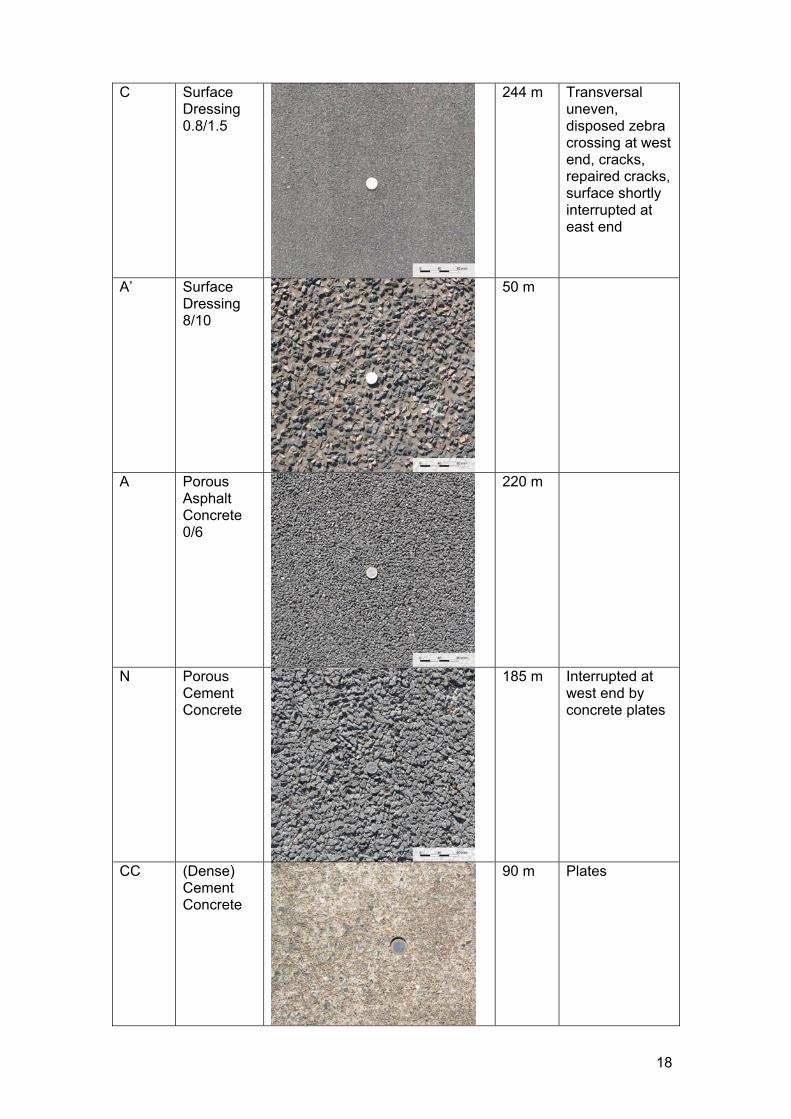
C Surface Dressing 0.8/1.5
244 m Transversal uneven, disposed zebra crossing at west end, cracks, repaired cracks, surface shortly interrupted at east end
A’ Surface Dressing 8/10
50 m
A Porous Asphalt Concrete 0/6
220 m
N Porous Cement Concrete
185 m Interrupted at west end by concrete plates
CC (Dense) Cement Concrete
90 m Plates
18
4.3 Texture of the test sections
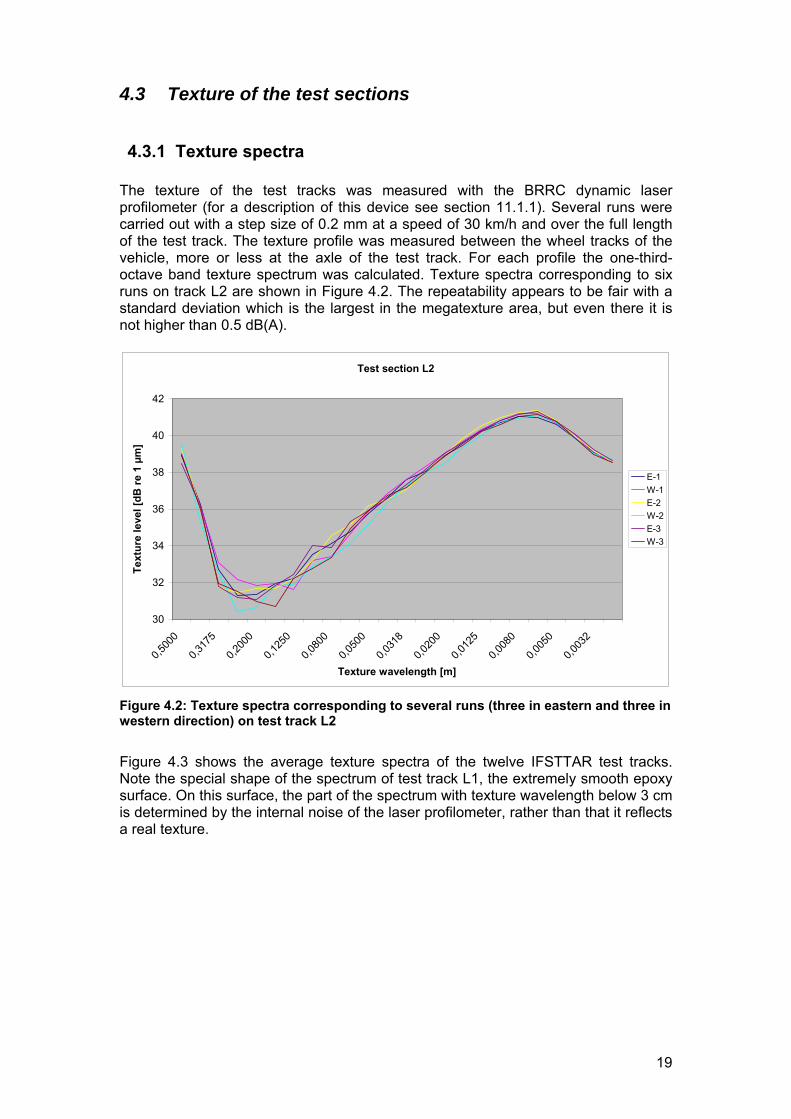
4.3.1 Texture spectra The texture of the test tracks was measured with the BRRC dynamic laser profilometer (for a description of this device see section 11.1.1). Several runs were carried out with a step size of 0.2 mm at a speed of 30 km/h and over the full length of the test track. The texture profile was measured between the wheel tracks of the vehicle, more or less at the axle of the test track. For each profile the one-third-octave band texture spectrum was calculated. Texture spectra corresponding to six runs on track L2 are shown in Figure 4.2. The repeatability appears to be fair with a standard deviation which is the largest in the megatexture area, but even there it is not higher than 0.5 dB(A).
Test section L2
30
32
34
36
38
40
42
0,50
00
0,31
75
0,20
00
0,12
50
0,08
00
0,05
00
0,03
18
0,02
00
0,01
25
0,00
80
0,00
50
0,00
32
Texture wavelength [m]
Tex
ture
lev
el [
dB
re
1 µ
m]
E-1
W-1
E-2
W-2
E-3
W-3
Figure 4.2: Texture spectra corresponding to several runs (three in eastern and three in western direction) on test track L2
Figure 4.3 shows the average texture spectra of the twelve IFSTTAR test tracks. Note the special shape of the spectrum of test track L1, the extremely smooth epoxy surface. On this surface, the part of the spectrum with texture wavelength below 3 cm is determined by the internal noise of the laser profilometer, rather than that it reflects a real texture.
19

10
15
20
25
30
35
40
45
50
55
60
0,50
00
0,40
00
0,31
75
0,25
00
0,20
00
0,15
87
0,12
50
0,10
00
0,08
00
0,06
25
0,05
00
0,04
00
0,03
18
0,02
50
0,02
00
0,01
59
0,01
25
0,01
00
0,00
80
0,00
63
0,00
50
0,00
40
0,00
32
0,00
25
Texture wavelength [m]
Tex
ture
leve
l [d
B r
e. 1
µm
]
A
E1
E2
M2
M1
CC
F
A'
L2
L1
N
C
Figure 4.3: Average texture spectra of the IFSTTAR test tracks
Due to the stiffness of the rubber, a tyre tread can not protrude very deep in the texture profile. The rubber envelopes only a part of the texture. This is called enveloping. To reach a more realistic result all data were additionally analyzed with enveloping following a method described by [3] with value d*= 0.0025 mm-1. This value was chosen quite arbitrarily, believing that it will be reasonably representative of passenger tyres, but this has not been studied closely. More information about the enveloping procedure can be found in [4]. The average texture spectra analysed after first applying the enveloping function on the profiles are shown in Figure 4.4.
10
15
20
25
30
35
40
45
50
55
60
0,50
00
0,40
00
0,31
75
0,25
00
0,20
00
0,15
87
0,12
50
0,10
00
0,08
00
0,06
25
0,05
00
0,04
00
0,03
18
0,02
50
0,02
00
0,01
59
0,01
25
0,01
00
0,00
80
0,00
63
0,00
50
0,00
40
0,00
32
0,00
25
Texture wavelength [m]
Tex
ture
leve
l [d
B r
e. 1
µm
]
A
E1
E2
M2
M1
CC
F
A'
L2
L1
N
C
Figure 4.4: Average texture spectra of the IFSTTAR test tracks – with enveloping applied on the profiles before spectrum analysis
20

The impact of applying enveloping on the texture spectra can be seen in Figure 4.5 for test sections L2 (which is rather smooth) and A’ (which is rough).
10
15
20
25
30
35
40
45
50
55
60
0,50
00
0,40
00
0,31
75
0,25
00
0,20
00
0,15
87
0,12
50
0,10
00
0,08
00
0,06
25
0,05
00
0,0
0,03
18
0,02
50
0,02
00
0,01
59
0,0
0,01
00
0,00
80
0,00
63
0,00
50
0,00
40
0,00
32
0,00
25
Texture wavelen
400
125
gth [m]
Te
xtu
re le
ve
l [d
B r
e. 1
µm
]
A' with enveloping
L2 with enveloping
A' without enveloping
L2 without enveloping
t
4.3.2 Mean Profile Depth Test section C has been excluded out of the analyses of the correlation between Cr and texture because of too many irregularities of the surface (see Table 4.2). The values of the Mean Profile Depth without and with enveloping applied on the profile before calculating the MPD (averages over the whole test track lengths) are shown in Table 4.3.
Table 4.3: MPD values of the IFSTTAR test sections used in this experiment
Figure 4.5: Average texture spectra of test section A’ and L2 with and withounveloping e
Test section
MPD [mm] MPD [mm] without with
enveloping enveloping M1 1.14 0.63 F 1.00 0.82 L1 0.08 0.09 L2 0.42 0.36 E1 0.59 0.38 E2 0.82 0.64 M2 0.86 0.48 A 0.93 0.50
CC 0.44 0.50 A' 2.77 2.24 N 1.92 1.02 C 0.35 0.34
21

4.3.3 Homogeneity
4.3.3.1 Transversal
The width of the test sec between 2.5 and 3.9 m, meaning that trailers might not measure in the same wheel track (see Table 4.4). All trailers measure the r i middle track of the vehicle. However, a slight difference in positioning of the measuring vehicle may cause different results. For example: N is ground in the middle and not in the right and left wheel tracks, E1 and E2 have road markings in the middle track. M2 is a wider test section, meaning that probably not all teams measured in exactly the same track. Therefore, transversal homogeneity was checked. Texture measurements were performed in the middle, left and right wheel track of the te ions with size 0.2 mm. Due to spatial limitations on-site, in some cases only the left or right wheel tracks could be measured.
Table 4.4: Width of the test sec
tions ranged
olling res stance in the
st sect step
tions
Test section Width [m] M1 3.00 F 3.00 L1 3.00 L2 2.50 E1 3.45 E2 3.45 M2 3.90 A 3.00
CC - A' 3.00 N 2.60 C 3.00
The results of test section C are shown in Figure 4.6:. The graphs of all other test sections can be found in Annex A. The graph of test section N shows a slight difference between middle and right wheel track (see Figure A.3). Also the graph of test section L1 reveals some difference between middle and right wheel track, which is unexpected (see Figure A.6). No significant influence of road markings can be seen on the graphs of test sections E1 and E2 (see Figure A.4 and Figure A.5).
22

0
10
20
30
40
50
60
ve
l [d
B r
e. 1
µm
]
0,5
0,31
75 0,2
0,12
50,
080,
05
0,03
180,
02
0,01
250,
008
0,00
5
0,00
320,
002
0,00
13
Texture wavelength [m]
Te
xtu
re le
C middle
C right wheel track - E
C left wheel track - E
Figure 4.6: Texture spectra of test section C measured in middle, right and left wheel track direction east (E)
4.3.3.2 Longitudinal Texture has been analyzed per 20 m. The standard deviation of the 20 m sections in percentage (standard deviation in dB divided by the average level in dB) has been calculated for the various wavelengths. The results are shown in Figure 4.7.
0%
2%
4%
6%
8%
and
ard
de
via
t
10%
14%
0,5
0,31
75 0,2
0,12
50,
080,
05
0,03
18 0,02
0,01
250,
008
0,00
5
0,00
320,
002
0,00
13
Texture wavelength [m]
St
ion
[
C12%
%] A
L1
L2
N
A'
M2
E2
F
E1
M1
Figure 4.7: Standard deviation (in percentage) of the 20 m sections for various wavelengths and test tracks
The calculated standard deviation may be used to give an idea about the longitudinal homogeneity of the test tracks. E2 can be considered as the least homogene test track for most wavelengths, which may be due to the road markings. F is the least homogene test track for the largest wavelengths. L1, N and C are less homogene in
4.3.4 Intercorrelation of one-third-octave band texture levels
the megatexture area.
In order to study the influence of the texture on the rolling resistance, it is ideal to use a set of test tracks for which the texture levels in any of the one-third-octave bands
23

are not correlated with the levels in any other band. Suppose e.g. that the rolling resistance is strongly correlated with the texture levels belonging to texture
avelengths 0.5 m and 0.01 m. If the texture levels of these two bands are strongly correlated with each other, then it is unclear to which texture wavelength band the w
rolling resistance is correlated to. Therefore it was checked how well the texture levels of the different one-third-octave bands of the sample of test tracks correlate with each other. Table 4.5 shows the correlations for the relevant one-third-octave bands.
Table 4.5: Correlations (R²) among the texture levels measured in the various one-third-octave bands; where high correlation > 0.7 is indicated in red, medium correlation > 0.4 but ≤ 0.7 is indicated in yellow and low correlation ≤ 0.4 is indicated in green.
0.5
0.4
0.31
75
0.25
0.2
0.15
87
0.12
5
0.1
0.08
0.06
25
0.05
0.04
0.03
18
0.02
5
0.02
0.01
59
0.01
25
0.01
0.00
8
0.00
63
0.00
5
0.00
32
0.00
25
0.00
4
0.5 1.0 0.9 0.7 0.6 0.5 0.5 0.4 0.4 0.4 0.3 0.3 0.3 0.3 0.3 0.3 0.2 0.2 0.2 0.1 0.1 0.1 0.1 0.1 0.1
0.4 0.9 1.0 0.9 0.8 0.7 0.7 0.6 0.6 0.6 0.6 0.5 0.5 0.5 0.5 0.5 0.4 0.4 0.4 0.3 0.3 0.3 0.3 0.3 0.3
0.3175 0.7 0.9 1.0 1.0 0.9 0.9 0.8 0.7 0.7 0.7 0.7 0.7 0.6 0.6 0.6 0.6 0.6 0.5 0.5 0.4 0.4 0.4 0.4 0.4
0.25 0.7 0.8 1.0 1.0 1.0 0.9 0.9 0.9 0.8 0.8 0.8 0.8 0.7 0.7 0.7 0.7 0.7 0.6 0.5 0.5 0.4 0.4 0.4 0.4
0.2 0.6 0.7 0.9 1.0 1.0 1.0 0.9 0.9 0.9 0.9 0.8 0.8 0.8 0.8 0.8 0.8 0.7 0.7 0.6 0.6 0.6 0.5 0.5 0.5
0.1587 0.5 0.7 0.9 0.9 1.0 1.0 1.0 1.0 1.0 0.9 0.9 0.9 0.9 0.9 0.9 0.9 0.8 0.8 0.7 0.7 0.6 0.6 0.5 0.5
1.0 1.0 0.9 0.9 0.9 0.9 0.8 0.7 0.70.125 0.4 0.6 0.8 0.9 0.9 1.0 1.0 1.0 1.0 1.0 0.9 0.9 0.7 0.6 0.6
0.1 0.4 0.6 0.7 0.9 0.9 1.0 1.0 1.0 1.0 1.0 1.0 1.0 1.0 1.0 1.0 1.0 0.9 0.9 0.8 0.8 0.7 0.7 0.6 0.6
0.08 0.4 0.6 0.7 0.8 0.9 1.0 1.0 1.0 1.0 1.0 1.0 1.0 1.0 1.0 1.0 1.0 0.9 0.9 0.9 0.8 0.8 0.7 0.7 0.6
0.0625 0.3 0.6 0.7 0.8 0.9 0.9 1.0 1.0 1.0 1.0 1.0 1.0 1.0 1.0 1.0 1.0 1.0 0.9 0.9 0.8 0.8 0.8 0.7 0.7
0.05 0.3 0.5 0.7 0.8 0.8 0.9 1.0 1.0 1.0 1.0 1.0 1.0 1.0 1.0 1.0 1.0 1.0 0.9 0.9 0.9 0.8 0.8 0.7 0.7
0.04 0.3 0.5 0.7 0.8 0.8 0.9 1.0 1.0 1.0 1.0 1.0 1.0 1.0 1.0 1.0 1.0 1.0 1.0 0.9 0.9 0.8 0.8 0.7 0.7
0.0318 0.3 0.5 0.6 0.7 0.8 0.9 0.9 1.0 1.0 1.0 1.0 1.0 1.0 1.0 1.0 1.0 1.0 1.0 0.9 0.9 0.8 0.8 0.7 0.7
0.025 0.3 0.5 0.6 0.7 0.8 0.9 0.9 1.0 1.0 1.0 1.0 1.0 1.0 1.0 1.0 1.0 1.0 1.0 0.9 0.9 0.9 0.8 0.8 0.7
0.02 0.3 0.5 0.6 0.7 0.8 0.9 0.9 1.0 1.0 1.0 1.0 1.0 1.0 1.0 1.0 1.0 1.0 1.0 0.9 0.9 0.9 0.8 0.8 0.7
0.0159 0.2 0.4 0.6 0.7 0.8 0.9 0.9 1.0 1.0 1.0 1.0 1.0 1.0 1.0 1.0 1.0 1.0 1.0 1.0 0.9 0.9 0.8 0.8 0.8
0.0125 0.2 0.4 0.6 0.7 0.7 0.8 0.9 0.9 0.9 1.0 1.0 1.0 1.0 1.0 1.0 1.0 1.0 1.0 1.0 1.0 0.9 0.9 0.8 0.8
0.01 0.2 0.4 0.5 0.6 0.7 0.8 0.9 0.9 0.9 0.9 0.9 1.0 1.0 1.0 1.0 1.0 1.0 1.0 1.0 1.0 1.0 0.9 0.9 0.8
0.008 0.1 0.3 0.5 0.5 0.6 0.7 0.8 0.8 0.9 0.9 0.9 0.9 0.9 0.9 0.9 1.0 1.0 1.0 1.0 1.0 1.0 1.0 0.9 0.9
0.0063 0.1 0.3 0.4 0.5 0.6 0.7 0.7 0.8 0.8 0.8 0.9 0.9 0.9 0.9 0.9 0.9 1.0 1.0 1.0 1.0 1.0 1.0 0.9 0.9
0.005 0.1 0.3 0.4 0.4 0.6 0.6 0.7 0.7 0.8 0.8 0.8 0.8 0.8 0.9 0.9 0.9 0.9 1.0 1.0 1.0 1.0 1.0 1.0 0.9
0.004 0.1 0.3 0.4 0.4 0.5 0.6 0.7 0.7 0.7 0.8 0.8 0.8 0.8 0.8 0.8 0.8 0.9 0.9 1.0 1.0 1.0 1.0 1.0 1.0
0.0032 0.1 0.3 0.4 0.4 0.5 0.5 0.6 0.6 0.7 0.7 0.7 0.7 0.7 0.8 0.8 0.8 0.8 0.9 0.9 0.9 1.0 1.0 1.0 1.0
0.0025 0.1 0.3 0.4 0.4 0.5 0.5 0.6 0.6 0.6 0.7 0.7 0.7 0.7 0.7 0.7 0.8 0.8 0.8 0.9 0.9 0.9 1.0 1.0 1.0
It is clear from Table 4.5 ure levels of the different one-third-octave bands ar o t d t u h aimpossible t o e gfor the rollin t s I e ocorrelation o t bD h a n ) Mlevel over the macrotext .
that the textd oe str ngly correlate ver ra her wi e ext re wavelengt r nges, making it
o identify a narrow area f the t xture wavelength ran e as responsible g resis ance, if that would be the ca e. n s cti n 12, therefore, also the f the rolling resistance wi h wide and descriptors, as MPD (Mean Profile
epth), LMe (global texture level of t e meg texture ra ge and L a (global texture ure range) are calculated
24
5 Tyres
5.1 Characteristics An attempt was made to find tyres from the same batch (as identified by the DOT marking on the tyre) for all teams in order to minimize differences that are due to a variation in tyre properties. Only the SRTT tyres came from different batches. Each team used his own set of tyres. Moreover TUG performed measurements with all sets of tyres to detect possible variations per tyre type. In Table 5.1 more details may be found about the tyres that were used on the test track. Shore hardness of all tyres was measured in the TUG laboratory.
Table 5.1: Overview of tyres used during RRT
Symbol Producent Tyre tread Tyre size Index DOT Hard-ness
AAV4/BASt Avon Supervan AV4
195 R14 C 106/104N ATJ8 PC2810 64 Sh
AAV4/TUG Avon Supervan AV4
195 R14 C 106/104N ATJ8 PC2810 62 Sh
AAV4_CT/ TUG
Avon Supervan AV4
195 R14 C 106/104N - 64 Sh
ES16/BASt Michelin Energy Saver
225/60 R16 98V HC 3V 00KX1511 66 Sh
ES16/TUG Michelin Energy Saver
225/60 R16 98V HC 3V 00KX1511 63 Sh
ES14/BRRC
Michelin Energy Saver
195/70 R14 91T F1 J9 681X3010 66 Sh
ES14/TUG Michelin Energy Saver
195/70 R14 91T F1 J9 681X3010 63 Sh
SRTT/BASt Uniroyal Tiger paw M+S
P225/60 R16 97S ANX0 EVUU4608 68 Sh
SRTT/TUG Uniroyal Tiger paw M+S
P225/60 R16 97S …0404 65 Sh
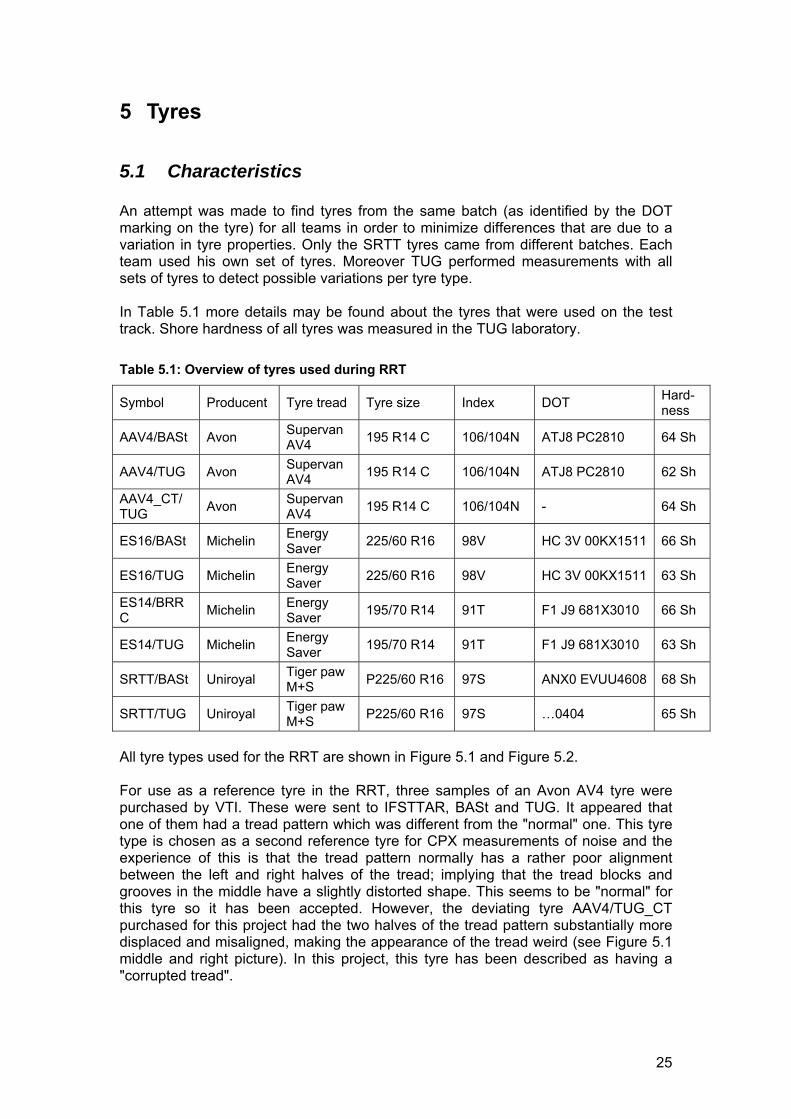
All tyre types used for the RRT are shown in Figure 5.1 and Figure 5.2. For use as a reference tyre in the RRT, three samples of an Avon AV4 tyre were purchased by VTI. These were sent to IFSTTAR, BASt and TUG. It appeared that one of them had a tread pattern which was different from the "normal" one. This tyre type is chosen as a second reference tyre for CPX measurements of noise and the experience of this is that the tread pattern normally has a rather poor alignment between the left and right halves of the tread; implying that the tread blocks and grooves in the middle have a slightly distorted shape. This seems to be "normal" for this tyre so it has been accepted. However, the deviating tyre AAV4/TUG_CT purchased for this project had the two halves of the tread pattern substantially more displaced and misaligned, making the appearance of the tread weird (see Figure 5.1 middle and right picture). In this project, this tyre has been described as having a "corrupted tread".
25
Strange enough, it appeared in the tests that the Cr of this tyre sample did not differ om the samples having a "normal" tread. This is shown later in this significantly fr
report.
Figure 5.1: SRTT (left), AAV4 (middle) and AAV4_CT (right)
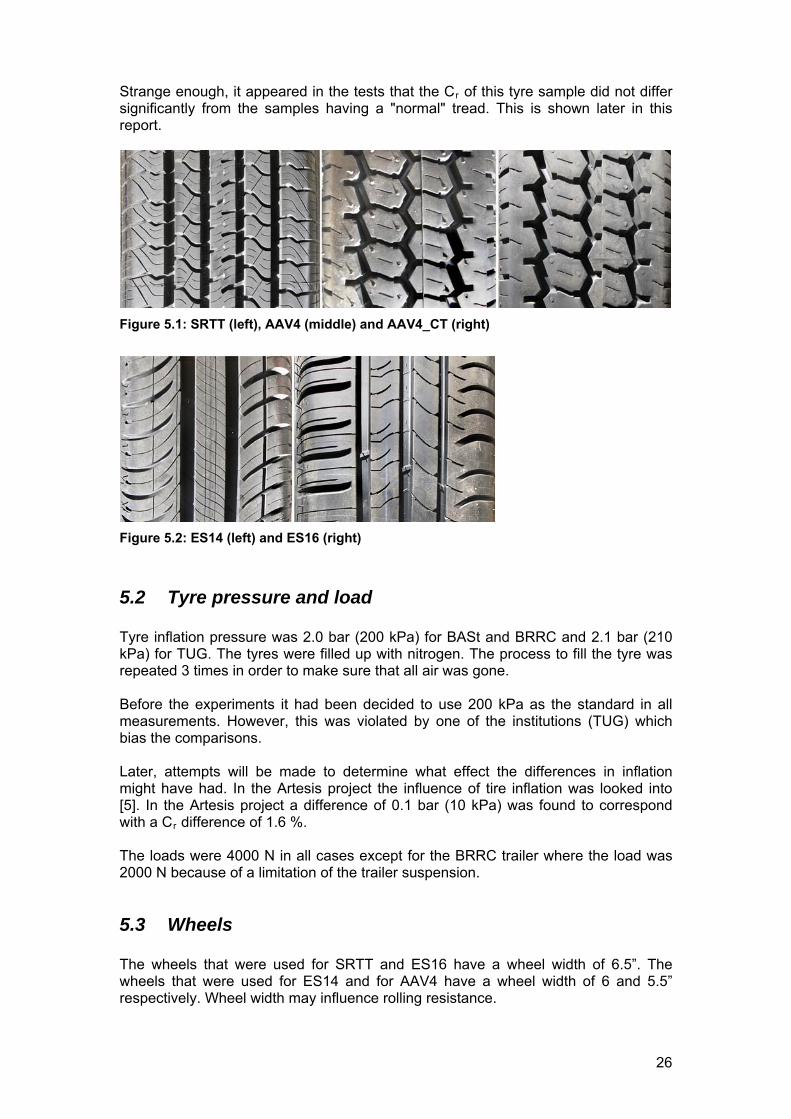
Figure 5.2: ES nd ES16 (right)
re ure load
n w ar (2 BA nd BRR 21s were filled up with nitrogen. The process to fill
im der r a e.
experiments i e kPa a ndard in n ver was v e e insti TUG) whic
ias the comparisons.
ater, attempts will be made to determine what effect the differences in inflation
used for ES14 and for AAV4 have a wheel width of 6 and 5.5” spectively. Wheel width may influence rolling resistance.
14 (left) a
5.2 Ty
press and
Tyre inflatiokPa) for TUG. The tyre
pressure as 2.0 b 00 kPa) for St a C and 2.1 bar ( the tyre wa
0 s
repeated 3 t
es in or to make su e that all air w s gon
Before the measureme
t had been, this
decided to usiolated by on
200 of th
s the statutions (
all h ts. Howe
b Lmight have had. In the Artesis project the influence of tire inflation was looked into [5]. In the Artesis project a difference of 0.1 bar (10 kPa) was found to correspond with a Cr difference of 1.6 %. The loads were 4000 N in all cases except for the BRRC trailer where the load was 2000 N because of a limitation of the trailer suspension.
5.3 Wheels The wheels that were used for SRTT and ES16 have a wheel width of 6.5”. The wheels that were re
26

6 Measurement program The number of runs that were performed in east (E) and west (W) direction per team is specified in the tables hereunder.
6.1 Comparison tests of the three measuring devices The number of test runs performed per speed and direction by all institutes can be found in Table 6.1 to Table 6.3.
Table 6.1: Number of runs performed by BASt in east (E) and west (W) direction
Pavement AAV4 SRTT ES16 ES14
6.1.1 BASt
50 km/h E-W
80 km/h E-W
50 km/h E-W
80 km/h E-W
50 km/h E-W
80 km/h E-W
50 km/h E-W
80 km/h E-W
M1 4 - 4 4 - 4 4 - 4 6 - 6 4 - 4 4 - 4 - - F 1 - 1 1 - 1 2 - 2 2 - 2 1 - 1 1 - 2 - - L1 1 - 1 1 - 2 2 - 2 3 - 3 1 - 1 1 - 1 - - L2 4 - 4 4 - 4 6 - 5 6 - 6 2 - 3 4 - 4 - - E1 1 - 1 1 - 1 2 - 3 2 - 2 1 - 1 0 - 2 - - E2 - - - - - - - - M2 1 - 1 1 - 0 1 - 1 2 - 0 1 - 1 1 - 0 - - C 1 - 2 1 - 2 2 - 2 2 - 2 1 - 1 1 - 1 - - A’ 1 - 1 - 2 - 2 3 - 2 1 - 1 - - - A 2 - 1 1 - 1 3 - 2 2 - 2 1 - 2 0 - 1 - - N 2 - 2 4 - 0 5 - 5 4 - 0 1 - 1 1 - 0 - -
CC - - - - - - - -
6.1.2 BRRC
Table 6.2: Number of runs performed by BRRC in east (E) and west (W) direction
Pavement AAV4 SRTT ES16 ES14 50 80
km/h km/h 50
km/h 80
km/h 50
km/h 80
km/h 50
km/h 80
km/h E-W E-W E-W E-W E-W E-W E-W E-W
M1 - - - - - - 10 - 10 10 - 11F - - - - - - 10 - 10 10 - 11L1 - - - - - - 10 - 11 10 - 10L2 - - - - - - 10 - 11 10 - 10E1 - - - - - - 4 - 4 4 - 4 E2 - - - - - - 4 - 4 4 - 4 M2 - - - - - - 4 - 4 4 - 4 C - - - - - - 11 - 11 11 - 9 A’ - - - - - - 16 - 16 15 - 14
27

A - - - - - - 11 - 11 10 - 9 N - - - - - - 10 - 11 12 - 10
CC - - - - - - 4 - 4 4 - 5
6.1.3 TUG
able 6.3: Number of runs performed by TUG in east (E) and west (W) direction
T
Pavement AAV4 SRTT ES16 ES14 50 80
km/h W
km/h E-W
50 km/h E-W
80 km/h E-W
50 km/h E-W
80 km/h E-W
50 km/h E-W
80 km/h E-W E-
M1 2 - 2 2 - 2 8 - 2 6 - 1 2 - 2 2 - 2 2 - 2 2 - 2 F 2 - 2 2 - 2 8 - 2 6 - 1 2 - 2 2 - 2 2 - 2 2 - 2 L1 2 - 4 2 - 2 9 - 3 2 - 2 2 - 2 2 - 2 2 - 2 4 - 3 L2 2 - 4 9 - 3 2 - 2 2 - 2 2 - 2 2 - 2 2 - 2 4 - 3 E1 2 - 2 - 2 2 - - 2 2 - 2 - 2 2 - 2 - 2 2 7 2 2 2E2 2 - 2 2 - 2 2 - 7 2 - 2 2 - 2 2 - 2 2 - 2 2 - 2 M2 4 - 6 2 - 2 17 - 5 2 - 2 4 - 4 2 - 6 4 - 6 6 - 4 C 2 - 2 2 - 2 2 - 8 2 - 2 2 - 2 2 - 2 2 - 2 2 - 2 A’ 2 - 2 2 - 2 2 - 8 2 - 2 2 - 2 2 - 2 2 - 2 2 - 2 A 2 - 2 2 - 2 2 - 8 2 - 2 2 - 2 2 - 2 2 - 2 2 - 2 N 0 0 0 0 0 0 0 0
CC 0 0 0 0 0 0 0 0
6.2 ddi l t to lor ta atu
6.2.1 Tyres (TUG/ BASt) All tyres were tested on the test track to have an idea of differences between tyres of the same type. Also measurements with various trailers (BASt and TUG) with exactly the same tyre can be compared to show trailer related differences. Additionally
s were tested on the TUG drum and three tyres on the BASt drum itions.
eed i e (TUG Test sections d re re gh in to min influence of speed.
6.2.3 Warm p (BR C) To determine the influenhighway. The exterior te t the tyre shoulder and the interior temperature inside the tyre were reg ered c tinuous while ving 45 inut 80 Tyre essure w meas d each 5 minu during short s nds tedone with air and with nitrogen in the tyre. The process to f the nitrogen respectively was repeated 3 times.
A tiona ests exp e cer in fe res
afterwards all tyre laboratory condin
6.2.2 Sp nfluenc )
L1 an L2 we measu d at hi speed order deter e the
-u R
ce of warm-up, measurements have been performed on the mperature aist on ly dri m es at km/h.
pr as ure 1 tes a ta till. This st was ill tyre with air and
28

6.2.4 Influe e of w eel a stme t (BRR ) To simulate the effect of wheel adjustment, measure nts hav been rme shallow curb on dense asphalt 0/10 at various speeds: 30, 50 and 70 km/h. However there was some doubt whether this really would give a similar result.
6.2.5 Cement concrete (BRRC)
urements have been p d on ceme rete on the ack. ere rtaint sults.
nc h dju n C
me e perfo d in a
Some measHowever th
erformebout th
nt conc test tris some unce y a e re
29

7 Measurement procedure
s every team had a different measurement method, everyone performed his test by walkie-talkie with the other teams. …) were registered continuously by a
eather station and could thereby be linked to the measurement results afterwards.
The warm-up procedure consisted of driving at approximately 80 km/h during 15 minutes. Aprogram individually while communicatingWeather conditions (temperature, wind,w
30

8 Measurement results
8.1 Wind Wind direction and speed were studied, using data registered by the weather station of IFSTTAR. Maximum wind speed registered during BRRC measurements was for example 5,4 m/s. The direction of the wind ranged between 216° (southwest) and
54° (northwest); 180°, 270° and 360° being the south, west and north respectively. I3 t as not considered further as a disturbing factor because wind speeds were low and nly a wind direction west was registered.
.2 Temperature correction
was verified if temperature correction would have a large influence on easurement results.
RRC and BASt linked all measurement runs to the ambient air temperature gistered by the weather station of IFSTTAR.
UG measured ambient air temperature and reported an average value per tyre-peed combination (for example one average temperature for all measurements erformed with SRTT at 50 km/h).
emperature correction is applied following ISO 28580 [6]:
wo
8 Itm Bre Tsp T
FRC
TTkC
r
refTrr
1,25,
ith
= rolling resistance, expressed in Newtons = tyre load, expressed in Newtons = constant = 0.008 = temperature during measurement, expressed in °C ref = reference temperature = 25 °C
able 8.1 demonstrates the linked temperatures and their influence on Cr. The fluence on Cr was calculated using following formula:
C
W RFkTT Tin TrrTr CCC ,25,,
Table 8.1: Temperatures linked to various institutes with influence on Cr
BASt BRRC TUG
inimum temperature [°C] 14.2 15.2 16.5 M
aximum temperature [°C] 18.0 17.8 21.0 M
Temperature interval minimum – maximum [°C]
3.8 2.6 4.5
31
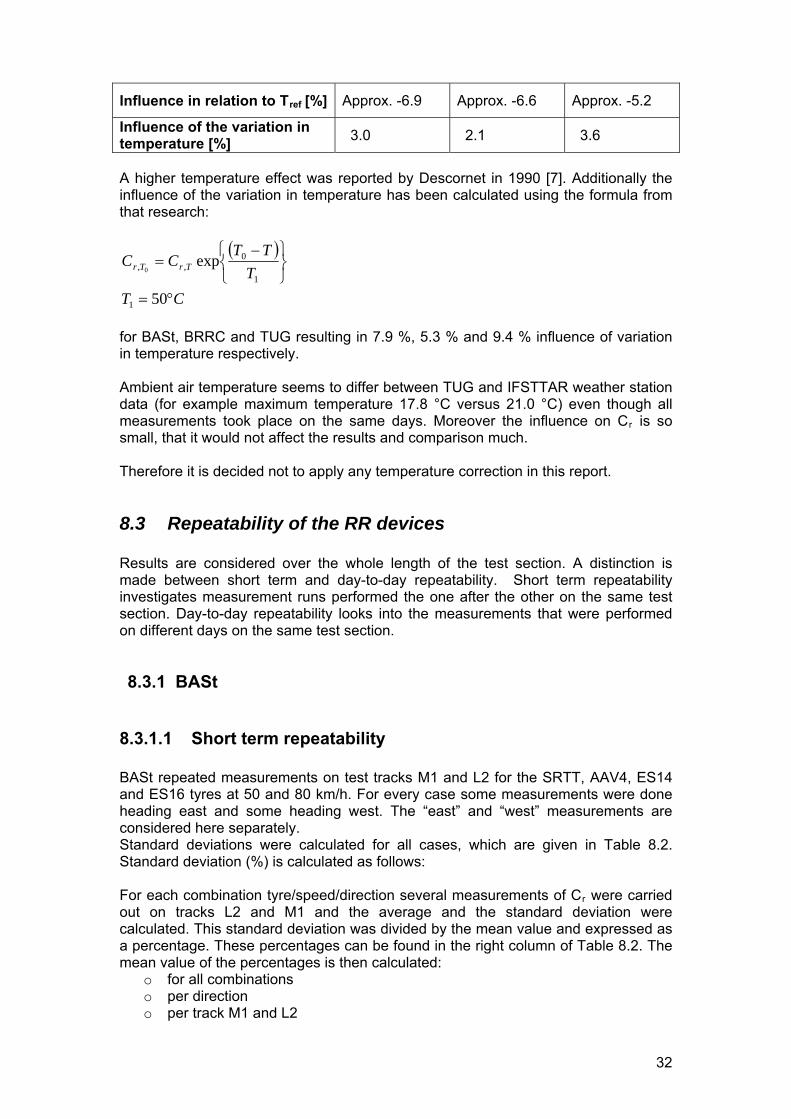
Influence in relation to Tref [%] Approx. -6.9 Approx. -6.6 Approx. -5.2
Influence of the variation in ]
3.0 2.1 3.6 temperature [% A higher temperature effect was reported by Descornet in 1990 [7]. Additionally the influence of the variation in temperature has been calculated using the formula from that research:
C
T
TTCC TrTr
exp1
0,, 0
T 501
9 %, 5.3 % and 9.4 % influence of variation temperature respectively.
seems to differ between TUG and IFSTTAR weather station ata (for example maximum temperature 17.8 °C versus 21.0 °C) even though all
mparison much.
.3 Repeatability of the RR devices
over the whole length of the test section. A distinction is made between short term and day-to-day repeatability. Short term repeatability investigates measurement runs performed the one after the other on the same test ection. Day-to-day repeatability looks into the measurements that were performed
ferent days on the same test section.
lity
e measurements were done st and some heading west. The “east” and “west” measurements are
considered here separately. ed for all cases, which are given in Table 8.2.
tandard deviation (%) is calculated as follows:
For each combination tyre/speed/direction several measurements of C were carried ut on tracks L2 and M1 and the average and the standard deviation were
calculated. This standard deviation was divided by the mean value and expressed as ges e found in t t column o 8.2. The
mean value of the percentages is then calculated:
for BASt, BRRC and TUG resulting in 7.in Ambient air temperaturedmeasurements took place on the same days. Moreover the influence on Cr is so small, that it would not affect the results and co Therefore it is decided not to apply any temperature correction in this report.
8 Results are considered
son dif
8.3.1 BASt
8.3.1.1 Short term repeatabi BASt repeated measurements on test tracks M1 and L2 for the SRTT, AAV4, ES14 and ES16 tyres at 50 and 80 km/h. For every case somheading ea
Standard deviations were calculatS
r
o
a percentage. These percenta can b he righ f Table
o for all combinations o per direction o per track M1 and L2
32

o per speed 50 and 8 km/ho per tyre
0
epeatability expressed as standard deviations for the BASt ailer
Table 8.2: Short term rtr
Tyre Speed [km/h] Test track Direction Standard deviation [%]
SRTT 50 L2 E 2.0 W 3.5 M1 E 1.9 W 2.5 80 L2 E 2.0 W 5.6 M1 E 3.1 W 2.5
AAV4 50 L2 E 2.4 W 3.1 M1 E 2.3 W 1.1 80 L2 E 3.8 W 2.1 M1 E 3.3 W 3.0
ES16 50 L2 E 0.5 W 1.8 M1 E 2.4 W 2.6 80 L2 E 1.9 W 2.9 M1 E 1.8 W 4.7 overall2 2.6 2.3 E 3.0 W 2.6 L2 2.6 M1 2.2 50 3.1 80 SRTT 2.9 AAV4 2.6 ES16 2.3
The overall short term repeatability of the BASt trailer is 2.6 %, which appears to be tyre and surface independent.
8.3.1.2 Day-to-day repeatability BASt carried out measurements on the tracks with the SRTT tyre at 50 and 80 km/h both on 6 and 9 June 2011. Figure 8.1 shows the measured Cr at 50 km/h and Figure
ean 2 Arithmetic m
33

8.2 at 80 km/h. The overall relative RMS variation σ is 7 % for both speed values, as follows:
with
the ber of test tracks o Cr,i,x the rolling resistance coefficie easured on track date x
. Measurements performed on 9 June at 50 km/h appear to be higher compared to measuremen erformed June, while those at 80 km/h tend to be lower. The authors do no now how to plain this.
which is calculated σ² = ∑ [ (Cr,i,6 June – Cr,i,9 June)/ Cr,i,6 June ]² / N all tracks i
o N num nt m i on
ts p on 6t k ex
SRTT/BASt - 50 km/h
0000
0020
0
0060
0080
0100
0120
0140
0160
A-Eas
t
A-W -Eas
t
A'-Wes
t
C-East es
t
E1-Eas
t
E1-W
est
F- Wes
t
L1-E
ast
L1-W
est
L2-E
ast
L2-W
e st
N-Wes
t
Test trac irection
Cr
0,
0,
0,004
0,
0,
0,
0,
0,
0,
est
A'C-W Eas
t
F-st
EaN-
k + d
6 June
9 June
Figure 8.1: Da o-day variability for the BA t ailer with the SRTT/BASt mounted and at 50 km/h.
y-t St r
SRTT/BASt - 80 km/h
0,0000
0080
0100
0120
0140
0160
A'E1
st
L1-E
ast
L1-W
est
L2-E
ast
L2-W
est
M1-
East
M1-
Wes
t
M2-
East
N-East
Cr 0,
0,
0,
0,
0,
6 June
9 June
0,0020
0,0040
0,0060
A-Eas
t
A-West
A'-Eas
t
-Wes
t
C-East
C-Wes
t
E1-Eas
t
-Wes
t
F-Eas
t
F-We
Test track + direction
Figure 8.2: Day-to-day variability for the BASt trailer with the SRTT/BASt mounted and at 80 km/h.
34

8.3.2 BRRC
8.3.2.1 Short term repeatability BRRC repeated measurements on test tracks M1 and L2 for the ES14 tyre at 50 and
0 km/h. For every case eight runs were done heading east and eight heading west. nts are considered here separately. Standard
Cr. e values are given in Table 8.3.
8The “east” and “west” measuremedeviation (%) is the standard deviation of all Cr divided by the average of allTh
Table 8.3: Repeatability expressed as standard deviations for the BRRC trailer
Speed Tyre [lm/h] Test track Direction Standard deviation [%]
E 2.5 L2 W 1.2
E 3.6
50
M1 W 1.1
E 2.6 L2 W 2.8
E 5.1
80
M1 W 2.7
overall 2.7 E 3.5 W 2.0 L2 2.3 M1 3.1 50 2.1
ES14 3.3 80
epeatability seems to be better for 50 km/h than for 80 km/h, which may e due to the influence of the wind.
Two measurement runs are shown in Figure 8.3. The graph reveals a good short term repeatability.
One may conclude that the short term repeatability of the BRRC trailer is 2.7 %.The short term rb
0,000
0,002
0,004
0,006
0,008
0,010
0,012
0,014
0,016
0,018
0 100 200
Distance [m]
Cr
A east run 1
A east run 2
Figure 8.3: C as a function of distance – Two measurement runs performed by BRRC r
t section A direction east at 50 km/h on tes
35

8.3.2.2 Day-to-day repeatability
r test tracks. Only part of the results is
RRC measB ured C on 6 and 9 June on all therelevant as during the measurement campaign on the 9th the trailer hit an object, disrupting the device.
Table 8.4: Identical measurements carried out on different dates
Speed Cr Test track [km/h] Direction Date Change between 6 and 9 June
F 80 E 6/jun 0.0197 F 80 W 6/jun 0.0205 F 80 E 9/jun 0.0232 17.8 % F 0 9/jun 0.0242 18.0 % 8 W L1 0 6/jun 0.0160 8 E L1 80 6/jun 0.0169 W L1 0 9/jun 0.0188 17.5 % 8 E L1 0 9/jun 0.0196 16.0 % 8 W L2 0 6/jun 0.0169 8 E L2 0 6/jun 0.0183 8 W L2 0 9/jun 0.0189 11.8 % 8 E L2 0 0.0202 10,4 % 8 W 9/jun A 0 6/jun 0.0170 8 EA 0 9/jun 0.0206 21.2 % 8 EC 0 6/jun 0.0174 8 EC 0 9/jun 0.0217 24.7 % 8 EA' 0 6/jun 0.0203 8 EA' 0 9/jun 0.0240 18.2 % 8 E
There appears to be a systematic increase of the measurement results of 10 up to 25 %, most probably caused by a calibration error. For more information about calibration procedures, see [4]. This will be investigated further.
8.3.3 TUG
8.3.3.1 Short term repeatability TUG did a number of runs on ten test tracks in both directions, at two speeds and with four types of tyres. The repeatability values are summarized in Table 8.5. The overall short term repeatability for the TUG trailer is 1.1 %. There is no significant difference due to speed or direction. The repeatability is expressed as standard deviation (%) which is the standard deviation of all Cr (of different runs) divided by the average of all Cr.
Table 8.5: Short term repeatability values of the TUG trailer (%)
SRTT AAV4 ES16 ES14
50 80 50 80 50 80 50 80
Section East West East West East West East West East West East West East West East West
M1 0.1% 0.8% 0.7% 2.6% 3.2% 0.3% 0.6% 0.4% 1.4% 0.3% 1.6% 1.2% 3.1% - 0.8% 0.6%
36

F 1.1% 0.2% 2.0% - 0.1% 0.8% 0.7% 0.6% 0.3% 1.0% 2.3% 1.1% 0.5% 0.1% 1.8% 0.6%
M2 3.1% 1.5% 1.3% 0.6% 0.8% 1.0% 0.5% 0.9% 1.1% 1.8% 2.3% 2.5% 3.0% 1.6% 1.7% 0.8%
L1 5.0% 0.8% 4.2% 2.5% 0.5% 0.7% 0.3% 0.3% 0.0% 1.0% 1.7% 3.9% 0.1% 1.0% 0.2% 0.8%
L2 3.0% 1.6% 1.7% 2.3% 1.5% 0.8% 0.1% 0.4% 1.0% 1.3% 0.7% 0.7% 0.5% 0.2% 1.0% 0.5%
E1 0.7% 1.0% 0.7% 2.0% 0.2% 0.5% 0.3% 0.6% 3.1% 0.5% 3.6% 5.5% 1.0% 1.2% 0.0% 0.4%
E2 1.0% 0.8% 1.3% 1.4% 0.6% 0.6% 0.3% 0.3% 0.5% 0.5% 2.5% 0.3% 0.8% 1.4% 0.3% 0.4%
C 0.5% 1.8% 2.5% 0.5% 0.0% 0.4% 0.3% 0.2% 0.4% 0.2% 1.1% 1.1% 0.8% 0.9% 0.4% 0.3%
A' 0.9% 1.7% 2.2% 1.5% 0.2% 0.7% 0.1% 0.7% 1.3% 0.4% 1.0% 3.5% 0.2% 0.6% 0.5% 0.2%
A 1.4% 2.3% 4.4% 1.8% 0.4% 0.4% 0.1% 0.6% 0.4% 0.8% 1.8% 0.9% 0.1% 0.2% 0.9% 0.9%
overall 1.1%
E 1.2%
W % 1.0
50 % 1.0
80 % 1.2
Two asurem runs sho Fig aph reveals an excellent short term repeatability.
me ent are wn in ure 8.4. The gr
0,000
0,002
0,004
0,006
8
0
2
4
6
8
10 20 30 40 50 60 70 80 90 100 110 120 130
Distance [m]
Cr
0,00
0,01
0,01
0 1,0
0,01
0,01
A east run 1
A east run 2
0
o measurement runs performed by TUG on
st section A direction east at 50 km/h
easurements on different days.
8.4 Reproducibility of the RR devices R considered over the wh n o t se n
Figure 8.4: Cr as a function of distance – Twte
8.3.3.2 Day-to-day repeatability As TUG already had a full test program by performing measurements with all tyres,
UG did not repeat mT
esults are ole le gth f the est ctio .
37

8.4.1 S T
8. .1 l r All measurements performed by BASt and TUG with AAV4, ES16 and SRTT are plo d g d u . r n S e e t drawn with full line, while the TUG g BASt performed SRTT/BASt measurements on 2 section 8.3.1.2). Both results are shown in the graphs. Except for two inconsistent BASt values for surfaces M1 and L2 at 80 km/h, the absolute values of AAV4 for TUG and BASt are situated not too far from each other (the difference is approx. 10 %) at 50 km/h bu a peed influence on the similarity of results is difficult to explain.
All graphs show similar patterns with respect to the effect of road surface.
BA t – UG
4.1 A l measu ements
tte in Fi ure 8.5 an Fig re 8 6. G aphs representi g BA t m asur men s areraphs are drawn with dashed line.
days: 6 June and 9 June (see also
t much closer at 80 km/h. Such s SRTT and ES16 values measured by BASt are substantially higher than measured
y TUG at both speeds. b
Summary 50 km/h
SRTT/BASt_0606 AAV4/BASt ES16/BASt SRTT/BASt_0906
AAV4/TUG ES16/TUG SRTT/TUG
0
0,002
0,004
0,006
0,008
0,012
0,014
0,016
0,018
0,02
0,022
0,024
0,026
M1 F L1 L2 E1 E2 M2 A C A' N
0,01
St and TUG at 50 km/h Figure 8.5: Cr for different test sections measured by BA
38

Summary 80 km/h
0
0,002
0,004
0,006
0,008
SRTT/BASt_0606 AAV4/BASt ES16/BASt SRTT/BASt_0906
AAV4/TUG ES16/TUG SRTT/TUG
0,024
0,026
0,02
0,022
0,014
0,016
0,018
0,01
0,012
M1 F L1 L2 E1 E2 M2 A C A' N
Figure 8.6: Cr for different test sections measured by BASt and TUG at 80 km/h
8.4.1.2 Relation between BASt and TUG ES16 tyre measurements Very good correlations between the TUG and BASt ES16 tyres are found for both speeds (see Figure 8.7 and Figure 8.8). However, the difference to a 1:1 line is substantial, indicating a poor reproducibility.
39

50 km/h
y = 0,8492x - 0,0017
R2 = 0,8128
0
0,005
0,01
0,015
0,02
0,025
0,03
0 0,005 0,01 0,015 0,02 0,025 0,03
ES16/BASt_BASt
ES
16/T
UG
_TU
G
Figure 8.7: Correlation between Cr measured by BASt and TUG with ES16 at 50 km/h
80 km/h
y = 1,1039x - 0,0035
R2 = 0,8798
0
0,005
0,01
0,015
0,02
0 0,005 0,01 0,015 0,02 0,025 0,03
ES16/BASt_BASt
ES
16/T
UG
_TU
G
0,03
0,025
Figure 8.8: Correlation between Cr measured by BASt and TUG with ES16 at 80 km/h
40
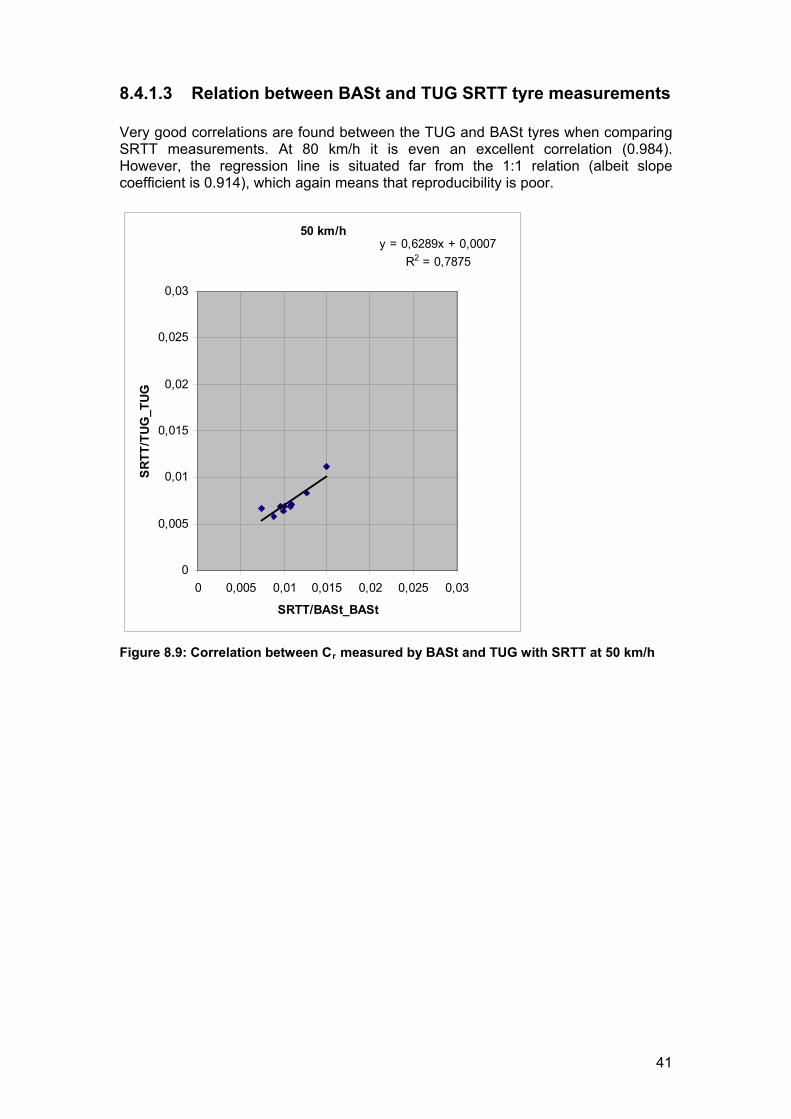
8.4.1.3 Relation between BASt and TUG SRTT tyre measurements Very good correlations are found between the TUG and BASt tyres when comparing SRTT measurements. At 80 km/h it is even an excellent correlation (0.984). However, the regression line is situated far from the 1:1 relation (albeit slope coefficient is 0.914), which again means that reproducibility is poor.
50 km/hy = 0,6289x + 0,0007
R2 = 0,7875
0
0,005
0,01
0,015
0,02
0,025
0,03
0 0,005 0,01 0,015 0,02 0,025 0,03
SRTT/BASt_BASt
SR
TT
/TU
G_T
UG
Figure 8.9: Correlation between Cr measured by BASt and TUG with SRTT at 50 km/h
41

80 km/h
y = 0,9139x - 0,0015
R2 = 0,9840
0,03
0
0,005
0,01
0,015
0,02
0,025
0 0,005 0,01 0,015 0,02 0,025 0,03
SRTT/BASt_BASt
SR
TT
/TU
G_T
UG
Figure 8.10: Correlation between Cr measured by BASt and TUG with SRTT at 80 km/h
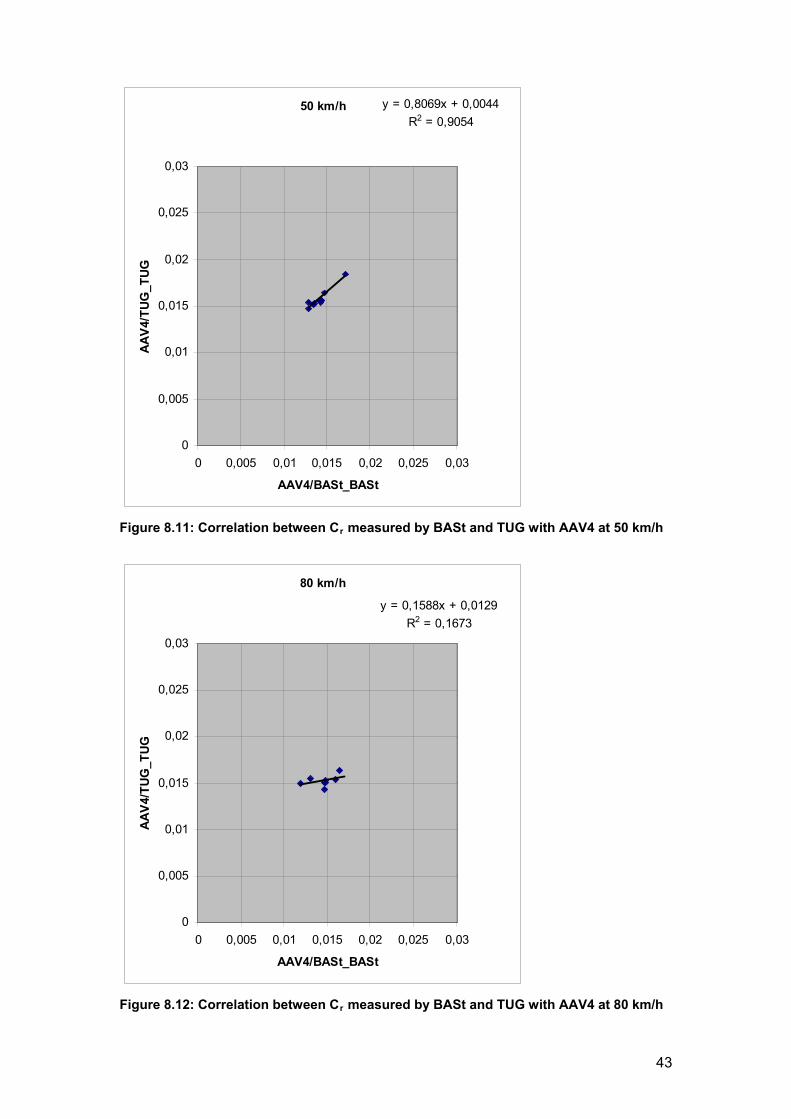
8.4.1.4 Relation between BASt and TUG AAV4 tyre measurements The correlation chart of 50 km/h demonstrates a very good correlation, while the one
). of 80 km/h indicates that there is no correlation (see Figure 8.11 and Figure 8.12This is due to the two inconsistent BASt values (see Figure 8.6).
42
50 km/h y = 0,8069x + 0,0044
R2 = 0,9054
0
0,005
0,01
0,015
0,02
0,025
0,03
0 0,005 0,01 0,015 0,02 0,025 0,03
AAV4/BASt_BASt
AA
V4/
TU
G_T
UG
Figure 8.11: Correlation between Cr measured by BASt and TUG with AAV4 at 50 km/h
80 km/h
y = 0,1588x + 0,0129
0
0,005
0,01
0,015
0,02
0,025
0 0,005 0,01 0,015 0,02 0,025 0,03
AAV4/BASt_BASt
AA
V4/
TU
G_T
UG
R2 = 0,1673
0,03
Figure 8.12: Correlation between Cr measured by BASt and TUG with AAV4 at 80 km/h
43

8.4.2 BRRC – TUG
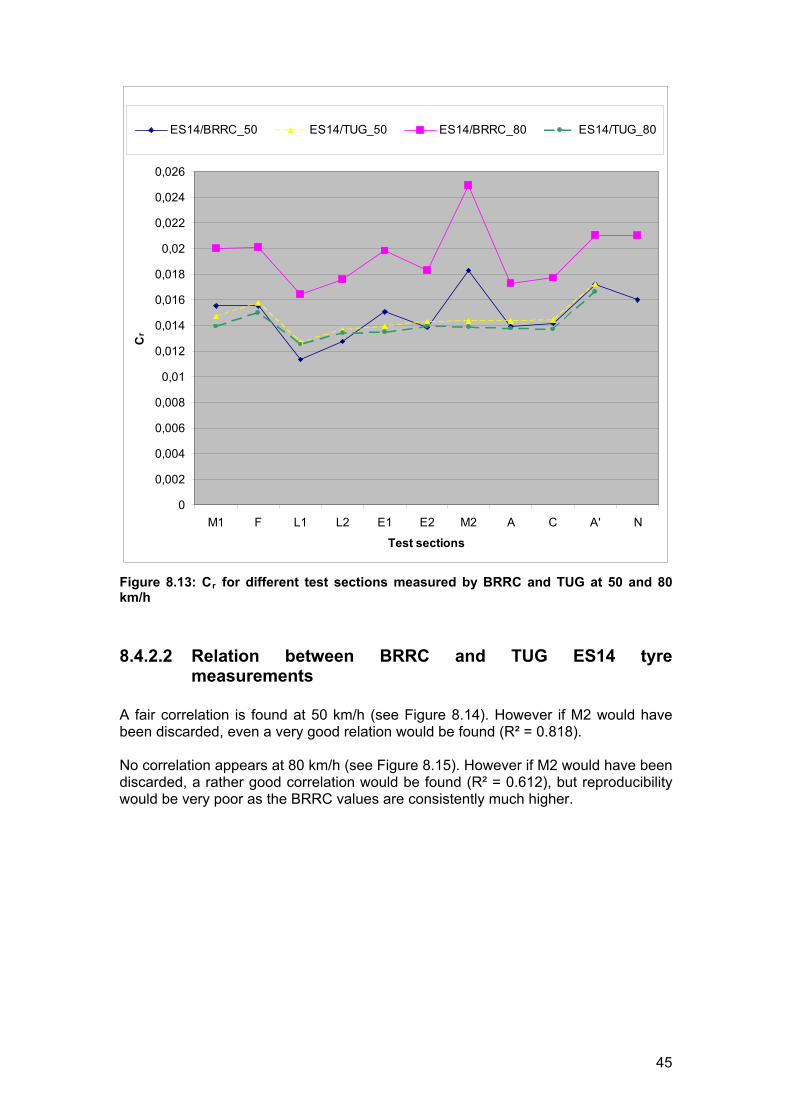
8.4.2.1 All measurements All measurements performed by BRRC and TUG with ES14 are plotted in Figure 8.13. Graphs representing BRRC are drawn with full line, while those representing TUG are drawn with dashed line. It can clearly be seen that BRRC has an outlier for test section M2. The Cr values are too high. This may be due to the fact that BRRC measured this surface separately, turning with the vehicle with a small turning radius and accelerating very strongly on a small distance. These manipulations of the trailer even caused an impact with the vehicle at a certain moment. The acceleration may have caused higher Cr values for M2. This problem will be verified by BRRC in the near future. At 50 km/h the absolute values of ES14 lie together very closely, when discarding outlier M2. However, TUG drum measurements show a difference between ES14/BRRC and ES14/TUG (see Figure 10.2 and Figure 10.3), which is surface and speed dependent (Cr 0.001 – 0.003). Also a different load was used. TUG used a load of 4000 N while BRRC used only a load of 2000 N due to suspension limitations of the trailer. A higher difference
similar pattern can be seen for all graphs.
because of this was expected, which is not the case. A
44
ES14/BRRC_50 ES14/TUG_50 ES14/BRRC_80 ES14/TUG_80
0,022
0,024
0,012
0,014
0,016
0,018
0,02
Cr
0,008
0,01
0,004
0,006
0
0,002
M1 F L1 L2 E1 E2 M
0,026
2 A C A' N
Test sections
igure 8.13: Cr for different test sections measured by BRRC and TUG at 50 and 80 km/h
8.4.2.2 Relation between BRRC and TUG ES14 tyre measurements
A fair correlation is found at 50 km/h (see Figure 8.14). However if M2 would have been discarded, even a very good relation would be found (R² = 0.818). No correlation appears at 80 km/h (see Figure 8.15). However if M2 would have been discarded, a rather good correlation would be found (R² = 0.612), but reproducibility would be very poor as the BRRC values are consistently much higher.
F
45

50 km/h
y = 0,4191x + 0,0083
R2 = 0,4718
0
0,005
0,01
0,015
0,02
0,025
0,03
0 0,005 0,01 0,015 0,02 0,025 0,03
ES14/BRRC_BRRC
ES
14/T
UG
_TU
G
Figure 8.14: Correlation between Cr measured by BRRC and TUG with ES14 at 50 km/h
80 km/h
y = 0,1949x + 0,0103
R2 = 0,1869
0
0,005
0,01
0 0,005 0,01 0,015 0,02 0,025 0,03
ES14/BRRC_BRRC
ES
U
0,025
0,03
0,02G
0,015
14/T
UG
_T
Figure 8.15: Correlation between Cr measured by BRRC and TUG with ES14 at 80 km/h
46

8.4.3 BASt - BRRC
8.4.3.1 All measurements Even though BASt and BRRC did not perform measurements with the same tyre type and thereby no conclusions about reproducibility can be made, it is interesting to compare the measurement results. All measurements performed by BASt and BRRC with ES16 and ES 14 are plotted in Figure 8.16. To make a clearer distinction between institutes, all measurements of BASt are plotted with full line, while those of BRRC are plotted with dashed line. BRRC values are clearly higher, which is due to the tyre size. Based on TUG measurements performed with ES14 and ES16, it can be assumed that the difference in Cr at 50 km/h is about 0.006 to 0.007 (see Figure 9.3). The graphs of the measurements at 50 km/h show a Cr difference of the same order of magnitude see Figure 8.16). The higher values at 80 km/h are also partly caused by the lack of wind shielding of the BRRC trailer.
0
0,002
0,004
0,006
0,008
0,01
0,012
0,014
0,016
0,018
0,02
0,022
0,024
0,026
M1 F L1 L2 E1 E2 M2 A C A' N
Test sections
Cr
ES14/BRRC_50 ES16/BASt_50 ES14/BRRC_80 ES16/BASt_80
Figure 8.16: Cr for different test sections measured by BASt and BRRC
47

8.4.3.2 Relation between ES16/BASt and ES14/BRRC tyre measurements
nd ES14/BRRC are analyzed. A good correlation achieved at 50 km/h while there is not found any correlation at 80 km/h (see Figure .17 and Figure 8.18). This may be due to the high influence of wind at higher speed
ed, a very good relation at 50 km/h (R² = 0.838) nd a rather low correlation at 80 km/h would be found (R² = 0.429).
Correlations between ES16/BASt ais8of the BRRC trailer. If outlier M2 would have been discarda No conclusions about reproducibility can be drawn.
50 km/h
y = 0,5523x + 0,0030
R2 = 0,6306
0,03
0
0,005
0,01
0,015
0,02
0,025
0 0,005 0,01 0,015 0,02 0,025 0,03
ES14/BRRC_BRRC
ES
16/B
AS
t_B
AS
t
Figure 8.17: Correlation between Cr ES16/BASt and ES14/BRRC at 50 km/h
48

80 km/h
y = 0,1318x + 0,0079
0
0,005
0,01
0,015
0 0,005 0,01 0,015 0,02 0,025 0,03
ES14/BRRC_BRRC
ES
16/B
AS
BA
SR2 = 0,1750
0,025
0,03
0,02tt_
Figure 8.18: Correlation between Cr ES16/BASt and ES14/BRRC at 80 km/h
49

9 Additional tests
9.1 Tyres
9.1.1 Measurements TUG performed measurements on the test track with all tyres to detect differences between tyres of the same type. However ES14/BRRC and ES16/BASt were not measured. The measurement results are shown in Figure 9.1 and Figure 9.2.
Speed 50 km/h, aver. dir E & W
0,000
0,002
0,004
0,006
0,008
0,010
0,012
0,014
0,016
0,018
0,020
M1 F M2 L1 L2 G E1 E2 C A' A
Test sections
Cr
AAV4/BASt AAV4/TUG AAV4/TUG_CT ES14/TUG ES16/TUG SRTT/BASt SRTT/TUG
Figure 9.1: Measurements performed by TUG with all tyres at 50 km/h on test track
Speed 80 km/h, aver. dir E & W
0,000
0,002
0,004
0,006
0,008
0,010
0,012
0,014
0,016
0,018
0,020
M1 F M2 L1 L2 G E1 E2 C A' A
Test sections
Cr
AAV4/BASt AAV4/TUG AAV4/TUG_CT ES14/TUG ES16/TUG SRTT/BASt SRTT/TUG
Figure 9.2: Measurements performed by TUG with all tyres at 80 km/h on test track
50

It appears that the AAV4 tyresBASt SRTT tyres differ substa
give values close to each other, but the TUG and ntially.
lated corrections
between tyres of the same type (SRTT. AAV4). only a etween the two AAV4 tyres (see Figure 9.3 and Figure from the same batch unlike the SRTT tyres and one of
es with ifferent sizes. It is amazing that tyre size may have such a dramatic influence.
9.1.2 Tyre re When looking at differencessmall difference was noted b
.4). The AAV4 tyres came 9them even had a corrupted tread pattern. At 80 km/h the differences are slightly larger than at 50 km/h. The two SRTT’s differ by approx. 30 %, which is alarming. The reason must be studied. The difference between ES14 and ES16 can be found in the graph for TUG test tyres. These may be used when comparing tyrd
50 km/h
-0,001
0,000
0,001
0,002
0,003
0,004
0,005
0,006
0,007
0,008
M1 F M2 L1 L2 E1 E2 C A' A
Test sections
Mea
sure
d d
iffe
ren
ce
Cr
AAV4 BASt-TUG
SRTT BASt-TUG
ES14-ES16 TUG
Figure 9.3: Cr difference between tyres measured by TUG on test sections
51

80 km/h
-0,001
0,000
0,001
0,007
0,008
0,002
0,003
0,004
0,005
0,006
Mea
sure
d d
iffe
ren
ce C
r
AAV4 BASt-TUG
SRTT BASt-TUG
ES14-ES16 TUG
M1 F M2 L1 L2 E1 E2 C A' A
Test sections
Figure 9.4: Cr difference between tyres measured by TUG on test sections
The relative difference expressed in percentage is shown in Table 9.1. A positive value means that Cr measured with the BASt tyre is higher. It can clearly be seen that the SRTT’s differ the most at 50 km/h: 19.7 - 39.5 %. The difference is slightly smaller at 80 km/h: 15.5 - 28.7 %. The highest difference between the two AAV4’s with normal tread is only 3.8 % at 80 km/h.
Table 9.1: Relative difference in percentage between tyres measured by TUG on test sections
Speed 50 km/h 80 km/h
Test section AAV4 BASt-TUG
SRTT BASt-TUG
AAV4 BASt-TUG
SRTT BASt-TUG
M1 1.0% 37.1% -0.5% 24.7% F 1.3% 33.4% -0.8% 22.4% M2 0.8% 34.6% 1.2% 22.7% L1 0.8% 37.5% 1.5% 28.7% L2 0.8% 31.9% 1.2% 26.6% E1 2.0% 37.5% 0.8% 25.5% E2 1.5% 39.5% 0.9% 24.6% C 1.7% 29.1% 3.8% 23.0% A' 2.6% 24.7% 3.6% 23.7% A 1.8% 19.7% 3.1% 15.5% Table 9.2 shows the relative difference in percentage between the AAV4/TUG tyre with normal and with corrupted tread. A positive value means that Cr measured with the tyre with normal tread is higher. The difference between the tyres is higher at higher speed: approximately 3 % at 50 km/h and approximately 15 % at 80 km/h.
52

Table 9.2: Relative difference in percentage between AAV4/TUG_CT and AAV4/TUG
Test section 50 km/h 80 km/h M1 3.2% 15.0% F 3.2% 12.9% M2 3.1% 13.8% L1 3.1% 16.6% L2 2.6% 15.2% E1 2.8% 15.6% E2 4.3% 15.2% C 3.7% 15.3% A' 1.9% 14.3% A 1.1% 14.0% Analyses were made to explore the influence of this difference between tyres. This was done for tyres of the same type, namely AAV4 and SRTT. AAV4/BASt_BASt and SRTT/BASt_BASt were corrected to AAV4/TUG_BASt and SRTT/TUG_BASt by subtracting the difference found in Figure 9.3 and Figure 9.4. For SRTT the graphs are now situated rather close to each other. They almost show
at 50 km/h nd approximately 7 % at 80 km/h.
the same absolute values (see Figure 9.5) within about 20 %. However the relative
difference between the institutes is still quite high: approximately 16 %a The tyre correction also improves the correlation at 50 km/h (see Figure 9.6 and Figure 8.9). The correlation at 80 km/h remains the same, which is excellent (see Figure 9.7 and Figure 8.10).
53

With tyre correction
0,002
0,016
0,018
0,02
0,022
0,024
0,026
Test sections
SR _50_correctiTT/BASt on SRTT/TUG_50
SR _80_correctiTT/BASt on SRTT/TUG_80
0,01
0,012
0,014
Cr
0,004
0,006
0,008
0
M1 F L1 L2 E1 E2 M2 A C A'
Figure 9.5: Cr for different test sections measured by BASt and BRRC with SRTT tyre correction
54

50 km/h with tyre correction
y = 0,6295x + 0,0021
R2 = 0,8405
0
0,005
0,01
0,015
0,02
0,025
0,03
0 0,005 0,01 0,015 0,02 0,025 0,03
SRTT/BASt_BASt_correction
SR
TT
/TU
G_T
UG
Figure 9.6: Correlation Cr measured by TUG and BASt with SRTT corrected for tyre difference at 50 km/h
80 km/h with tyre correction
y = 0,9224x + 0,0001
R2 = 0,9841
0
0,005
0,01
0,015
0,02
0,025
0,03
0 0,005 0,01 0,015 0,02 0,025 0,03
SRTT/BASt_BASt_correction
SR
TT
/TU
G_T
UG
Figure 9.7: Correlation Cr measured by TUG and BASt with SRTT corrected for tyre difference at 80 km/h
55

The tyre correction does not improve the comparison between absolute AAV4 values much (see Figure 9.8). The relative difference between the institutes is quite high: approximately 12 % at 50 km/h and approximately 6 % at 80 km/h. Moreover the correlation at 50 km/h is lower than without corrections (see Figure 9.9 and Figure 8.11). The correlation at 80 km/h on the contrary did improve (see Figure 9.10 and Figure 8.12).
With tyre correction
0
0,002
0,004
0,006
0,008
AAV4/BASt_50_correction AAV4/TUG_50
AAV4/BASt_80_correction AAV4/TUG_80
0,01
0,012
0,014
0,016
0,018
0,02
0,022
0,024
0,026
M1 F L1 L2 E1 E2 M2 A C A'
Test sections
Cr
Figure 9.8: Cr for different test sections measured by BASt and BRRC with AAV4 tyre correction
56

50 km/h with tyre correction
y = 0,8231x + 0,0043
R2 = 0,8770
0,025
0,03
0
0,005
0,01
0,015
0,02
0 0,005 0,01 0,015 0,02 0,025 0,03
AAV4/BASt_BASt_correction
AA
V4/
TU
G_T
UG
Figure 9.9: Correlation Cr measured by TUG and BASt with SRTT corrected for tyre difference at 50 km/h
80 km/h with tyre correction
y = 0,1822x + 0,0126
R2 = 0,2283
0
0,005
0,01
0,015
0,02
TU
G
0,025
0,03
0 0,005 0,01 0,015 0,02 0,025 0,03
AAV4/BASt_BASt_correction
AA
V4/
TU
G_
Figure 9.10: Correlation Cr measured by TUG and BASt with SRTT corrected for tyre difference at 80 km/h
57

9.1.3 Trailer related differences Trailer related differences between measurements can be detected by comparing measurements performed by TUG and BASt with exactly the same tyres. For SRTT/BASt_BASt the average value of measurements performed on 6 and 9 June is used. The trend of the AAV4 graphs measured by TUG and BASt are very similar at 50 km/h. There appears to be a significant offset (see Figure 9.11). As TUG used higher inflation pressure than BASt, the difference should have been the opposite.
50 km/h
0,000
0,002
0,004
0,006
0,008
0,010
0,012
0,014
0,016
0,018
0,020
M1 F M2 L1 L2 E1 C A' A
Test sections
Cr
AAV4/BASt_TUG
AAV4/BASt_BASt
SRTT/BASt_TUG
SRTT/BASt_BASt
Figure 9.11: Cr for different test sections measured by BASt and TUG with AAV4/BASt and SRTT/BASt at 50 km/h
The SRTT graphs measured by TUG and BASt lie somewhat closer to each other. At 50 km/h, the TUG values are lower than the BASt values, which is opposite to the case for the AAV4 tyre. The offset that was noted at 50 km/h doesn’t appear for 80 km/h (see Figure 9.12). The graph of AAV4/BASt_BASt shows some strange values for test sections M1 and L2. The results of the other test sections lie close to the TUG measurements. Overall, these results are inconsistent; as the differences depend on tyre and speed. It is difficult to find an explanation.
58
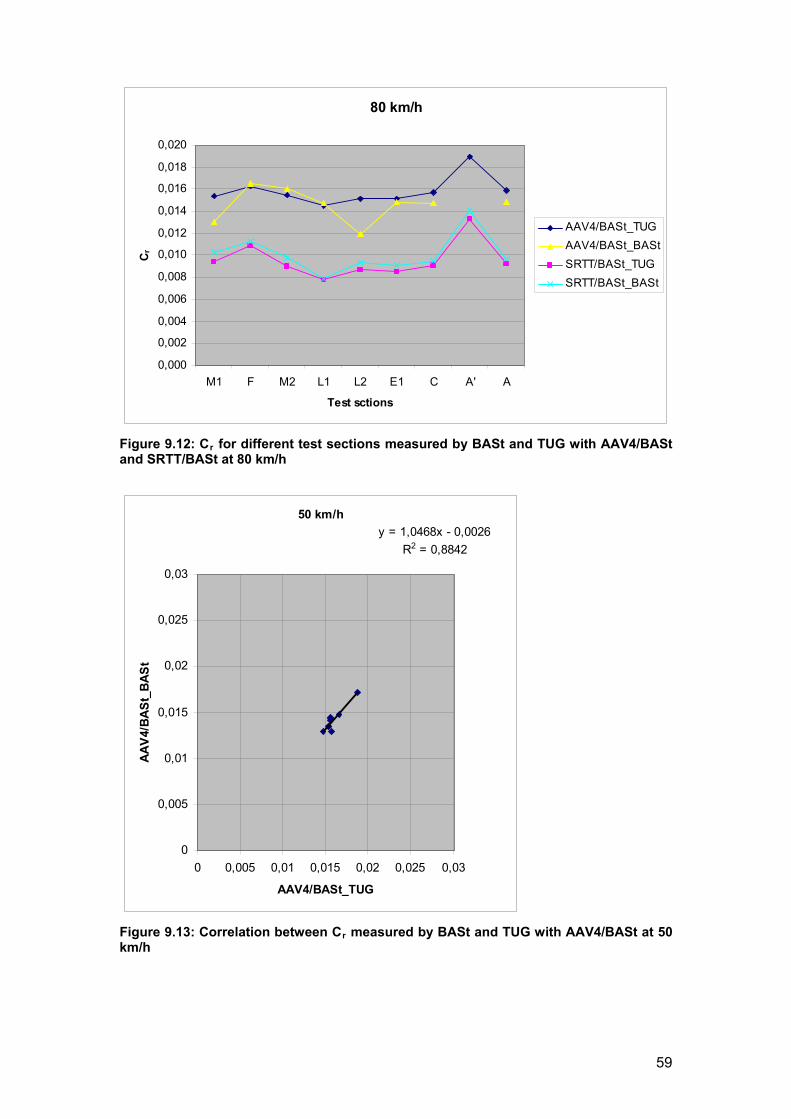
80 km/h
0,000
0,002
0,004
0,006
0,008
0,
0,018
0,020
0,010
0,012
0,014
Cr
016
M1 F M2 L1 L2 E1 C A' A
Test sctions
AAV4/BASt_TUG
AAV4/BASt_BASt
SRTT/BASt_TUG
SRTT/BASt_BASt
Figure 9.12: Cr for different test sections measured by BASt and TUG with AAV4/BASt and SRTT/BASt at 80 km/h
50 km/h
y = 1,0468x - 0,0026
R2 = 0,8842
0
0,01
0,015
AA
V4/
BA
St_
BA
0,005
0,02
0,025
0,03
0 0,005 0,01 0,015 0,02 0,025 0,03
AAV4/BASt_TUG
St
Figure 9.13: Correlation between Cr measured by BASt and TUG with AAV4/BASt at 50 km/h
59

80 km/hy = 1,2802x - 0,0052
R2 = 0,2004
0
0 0,005 0,01
0,005
0,01
0,015
0,02
0,025
0,03
0,015 0,02 0,025 0,03
AAV4/BASt_TUG
AA
V4/
BA
St_
BA
St
Figure 9.14: Correlation between Cr measured by BASt and TUG with AAV4/BASt at 50 km/h
50 km/h
y = 1,3799x - 0,0027
R2 = 0,8371
0
0,005
0,01
0,015
0,02
0,025
0,03
0 0,005 0,01 0,015 0,02 0,025 0,03
SRTT/BASt_TUG
SR
TT
/BA
St_
BA
St
Figure 9.15: Correlation between Cr measured by BASt and TUG with SRTT/BASt at 50 km/h
60

80 km/h
y = 1,0643x - 0,0001
R2 = 0,9842
0
0,005
0,01
0,015
0,02
0,025
0,03
0 0,005 0,01 0,015 0,02 0,025 0,03
SRTT/BASt_TUG
SR
TT
/BA
St_
BA
St
Figure 9.16: Correlation between Cr measured by BASt and TUG with SRTT/BASt at 80 m/h
The charts show very good correlations except for measurements with AAV4/BASt at 80 km/h (see Figure 9.13 to Figure 9.16). This may be due to the measurements performed by BASt with AAV4 at 80 km/h which are not in line with the others (see Figure 9.12). An excellent correlation can be noted for measurements with SRTT at 80 km/h. The different offset at 50 km/h versus 80 km/h may be an indication of a different speed dependency of these trailers.
9.2 Speed influence Only a small speed influence can be noted (see Figure 9.17 and Figure 9.18). The best correlation between speed and Cr is given by SRTT/TUG. The difference between SRTT/BASt and SRTT/TUG becomes smaller at higher speeds.
k
61
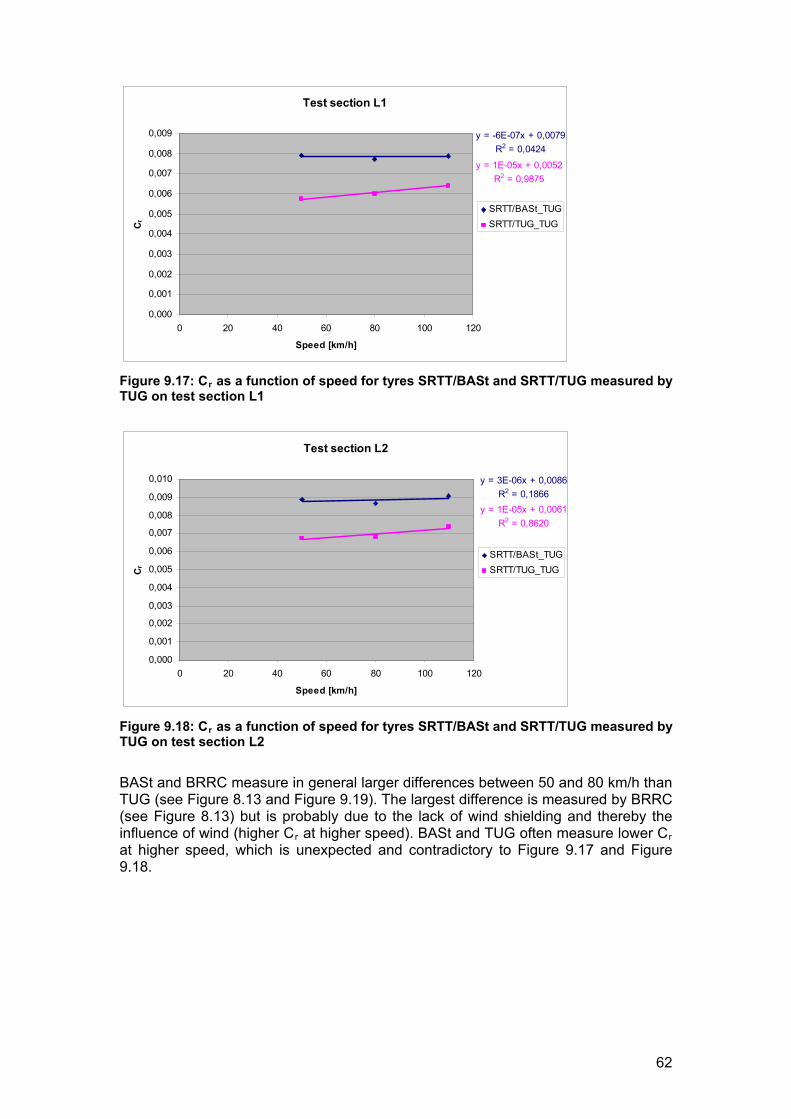
Test section L1
y = -6E-07x + 0,0079
R2 = 0,0424
y = 1E-05x + 0,0052
R2 = 0,9875
0,000
0,001
0,002
0,003
0,004
0,005
0,006
0,007
0,008
0,009
0 20 40 60 80 100 120
Speed [km/h]
Cr
SRTT/BASt_TUG
SRTT/TUG_TUG
Figure 9.17: Cr as a function of speed for tyres SRTT/BASt and SRTT/TUG measured by TUG on test section L1
Test section L2
y = 3E-06x + 0,0086
R2 = 0,1866
y = 1E-05x +
0,
0,0061
R2 = 8620
0,005
0,008
0,009
0,010
C
0,006
0,007
r
SRTT/BASt_TUG
SRTT/TUG_TUG
0,000
0,001
0,002
0,003
0,004
0 20 40 60 80 100 120
Speed [km/h]
speed for tyres SRTT/BASt and SRTT/TUG measured by
thereby the fluence of wind (higher Cr at higher speed). BASt and TUG often measure lower Cr
at higher speed, which is unexpected and contradictory to Figure 9.17 and Figure 9.18.
Figure 9.18: Cr as a function of TUG on test section L2
BASt and BRRC measure in general larger differences between 50 and 80 km/h than TUG (see Figure 8.13 and Figure 9.19). The largest difference is measured by BRRC see Figure 8.13) but is probably due to the lack of wind shielding and (
in
62

0
0,002
0,004
0,006
0,008
SRTT/BASt_TUG_50 SRTT/BASt_BASt_50
SRTT/BASt_TUG_80 SRTT/BASt_BASt_80
0,01
0,012
0,014
0,016
0,018
0,02
0,022
0,024
0,026
M1 F M2 L1 L2 G E1 E2 C A' A
Test sections
Cr
Figure 9.19: Cr for different test sections measured by BASt and TUG with SRTT at 50 and 80 km/h
9.3 Warm-up Measurements were performed by BRRC on a highway near Nantes to gain
site, the vehicle stood still for 15 and 25 minutes before
red every 15 minutes during a short standstill (4-5 minutes). The precision of e tyre inflation measuring tool is +- 0.05 bar. he measurement was repeated two times: one time with air inside the tyre, the
second time with nitrogen inside the tyre. The tyre was filled up three times to make sure all air/nitrogen was gone before inserting another. After 15 minutes the maximum tyre inflation is already reached (2.15 bar) in both cases (see Figure 9.20 and Figure 9.21).
knowledge about the evolution of tyre temperature and the difference between measuring temperature at the shoulder of the tyre or at the interior of the tyre. After driving to the teststarting the measurement with nitrogen and air respectively to allow the tyre to cool down before the start. The measurements were performed by driving at a constant speed of 80 km/h for 45 minutes, however due to other traffic and road works the vehicle sometimes had to slow down (70 km/h) and accelerate again for a short period. Tyre inflation, ambient air temperature, interior and exterior tyre temperature were measuthT
63

Air
2,05 2,15 2,15 2,10
24,026,0 25,726,5
33,2 33,7
21,2 20,822,8
34,9
20,0
0
5
10
15
20
25
30
35
40
0 10 20 30 40 50 60
Time [minutes]
Tem
per
atu
re [
°C]
/ In
flat
ion
[b
ar]
Tyre inflation
Exterior temperature
Interior temperature
Ambient air temperature
Figure 9.20: Warm-up test with air inside ES14/BRRC tyre: data measured during short standstill 0 – 15 – 30 – 45 minutes
Nitrogen
2,05 2,15 2,15 2,150
5Tem
p
22,4
31,5 32,1
19,0 19,017,6
30,4
22,1
10
20
35
40
er°C
] /
Ib
ar]
24,6 25,522,725
30
nfl
atio
n [
Tyre inflation
Exterior temperature
Interior temperature
15
atu
re [
Ambient air temperature
0 10 20 30 40 50 60
Time [minutes]
Figure 9.21: Warm-up test with nitrogen inside ES14/BRRC tyre: data measured during short standstill 0 – 15 – 30 – 45 minutes
Temperature measured at the tyre shoulder fluctuates a lot and is more subject to radiation of the sun (see Figure 9.22 and Figure 9.23). Temperature seems to be more stable with nitrogen inside the tyre. Interior temperature drops less at standstill with nitrogen than with air. A higher interior temperature is reached with air than with nitrogen and temperature increases faster while driving.
64

Figure 9.22: Warm-up test with air inside ES14/BRRC tyre – Continuous measurement of temperatures while driving 2 times 15 minutes
Figure 9.23: Warm-up test with nitrogen inside ES14/BRRC tyre – Continuous measurement of temperatures while driving 2 times 15 minutes
9.4 Influence of side forces
to the steering by developing a slip angle Θ ee Figure 9.24). More information about side forces and slip angle can be found in
When driving in a curve, the tyre reacts(s[8] (section 9.2.2). Even a half degree slip angle may change Cr by a significant amount [2].
65

Figure 9.24: Tyre moving in direction of red line [8]
To simulate the effect of wheel adjustment and to see the effect of side forces measurements have been performed at various speeds (30, 50 and 70 km/h) by BRRC in the small bend at the east end of the test track. All measurements were performed three times at each speed in direction west. The average values and standard deviation per speed are shown in Figure 9.25. Due to a lack of wind shielding, measurements performed by BRRC at higher speed are found to be strongly influenced by the wind. The difference in Cr between 50 and 80 km/h is about 0.005 (see Figure 8.13). This is more than the difference that was measured for this test (see Figure 9.25) so it is believed by the authors that this test is not very reliable as the change in Cr might be caused by the effect of the wind only. The test should be performed with appropriate wind shielding on the trailer.
y = 7E-05x + 0,0163
R2 = 0,98740,0210
0,0180
0,0205
0,0215
0,0220
0 10 20 30 40 50 60 70 80
Speed [km/h]
0,0200Cr
0,0185
0,0190
0,0195
Figure 9.25: Cr as a function of speed. measured by BRRC with tyre ES14/BRRC in small bend
66

9.5 Cement concrete A very low rolling resistance was measured on cement concrete (0.009) while porous cement concrete (N) gave a very high rolling resistance (0.016). The Cr of cement concrete is even lower than on epoxy resin (L1) which is unexpected. When considering texture spectra it can be seen that cement concrete has very low texture levels for most wavelengths (see Figure 4.3). Porous cement concrete has the highest texture levels for most wavelengths. It is believed by the authors that something is wrong with this value for cement concrete so follow-up will be made.
67

10 Drum measurements
t 80 km/h: steel drum, cold tyre inflation 210 kPa and tyre load 5890 N. No temperature corrections were applied. See Figure 10.1 for measurement results.
Figure 10.1: Average Cr values of BASt test tyres measured in laboratory on drum BASt
10.2 TUG Drum measurements were performed with a tyre load of 4000 N to conform to the measurement conditions on-site in Nantes. Tyre inflation was 210 kPa. Drum results were corrected to correspond to a flat surface (drum curvature correction). The results were not corrected for temperature. Results are shown in Figure 10.2.
10.1 BASt Drum measurements were performed with a tyre inflation after warm-up of 200 kPa and a tyre load of 4000 N to conform to the measurement conditions on site in
antes. N Additionally a drum measurement was performed with the conditions specified by ISO 28580 [6] with ES16/BASt tyre a
Average Cr values of BASt test tyres(measured at BASt drum test facílity "PFF")
0,923
1,312
0,926
1,297
1,018
1,093
1,027
1,109
0,908
0,9600,963
1,3821,377
0,4
0,6
0,8
1,0
1,2
1,4
1,6
ES16/BASt SRTT/BASt
80 km/h steel drum according to ISO conditions50 km/h steel drum according to MIRIAM conditions80 km/h steel drum according to MIRIAM conditions50 km/h Safety Walk according to MIRIAM conditions80 km/h Safety Walk according to MIRIAM conditions
AAV4/BASt Test tyre
C r
[%]
68

APS-4 is a rough-textured surface used in the TUG laboratory, imitating a surface dressing with 11 mm max. aggregate.
50 km/h Safety Walk 80 km/h Safety Walk 110 km/h Safety Walk
50 km/h APS-4 80 km/h APS-4 110 km/h APS-4
0,0200
0,0160
0,0180
0,0000
0,0020
0,0040
0,0060
0,0140
RTT/B
0,0100
0,0120
Cr
0,0080
ASt GUG C
SRT 16ES16
14/ 4/A
EST
is
14/TU
G
AAV4/BASt
AAV4/TUG
V
UG_CT
Test tyre
/TU
/BASt
/T BRRrte
s
S ESES
ES1
AAG/T
Figure 10.2: Average Cr values of various te measured in laboratory on drum
The Cr differences between test tyres of the same type vary between 0.0003 and 0.0028 (see Figure 10.3). Expressed in percentage this is 2.3 to 17.3 % (see Figure 10.4 The largest difference is found between ES14/TUG and ES14/BRRC on APS-4 surface for all speeds (see Figure 10.3). Because of this, the comparison in section 8.4.2 should be interpreted with care. Differences between test tyres are clearly speed and surface dependent.
st tyres TUG
).
69
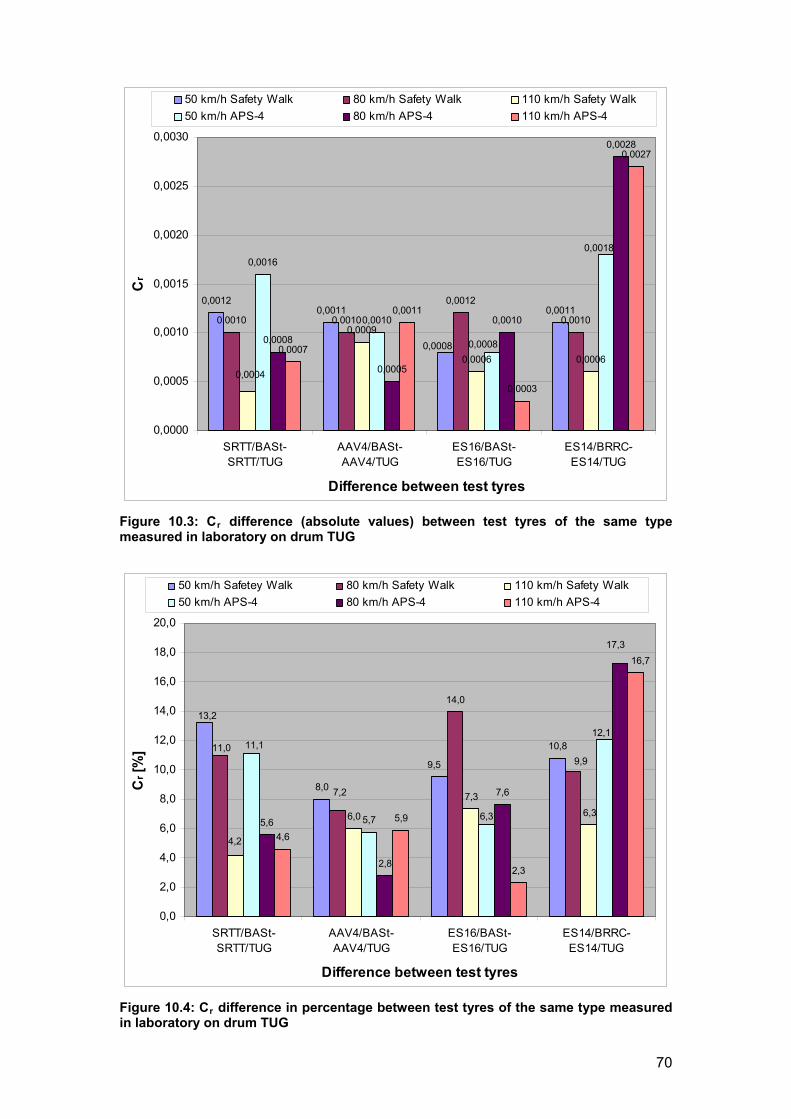
0,00120,0011 0,0011
0,0010 0,0010
0,0012
0,00100,0009
0,0006 0,0006
0,0016
0,0010
0,0008
0,0005
0,0010
0,0028
0,0007
0,0011
0,0003
0,0027
0,0008
0,0004
0,0018
0,0008
0,0000
0,0005
0,0010
0,0015
0,0020
0,0025
0,0030
SRTT/BASt-SRTT/TUG
AAV4/BASt-AAV4/TUG
ES16/BASt-ES16/TUG
ES14/BRRC-ES14/TUG
Difference between test tyres
Cr
50 km/h Safety Walk 80 km/h Safety Walk 110 km/h Safety Walk
50 km/h APS-4 80 km/h APS-4 110 km/h APS-4
Figure 10.3: Cr difference (absolute values) between test tyres of the same type measured in laboratory on drum TUG
8,0
10,8
50 km/h Safetey Walk 80 km/h Safety Walk 110 km/h Safety Walk
50 km/h APS-4 80 km/h APS-4 110 km/h APS-4
14,0
13,2
12,0
14,0
6,0
7,3
5,75,6
2,8
7,6
4,6
5,9
2,3
11,0
7,2
4,2
6,3
11,1
6,3
12,1
16,7
0,0
2,0
4,0
6,0
8,0
16,0
SRTT/BASt-SRTT/TUG
AAV4/BASt-AAV4/TUG
ES16/BASt-ES16/TUG
ES14/BRRC-ES14/TUG
Difference between test tyres
Cr
17,318,0
20,0
9,5 9,910,0[%
]
Figure 10.4: Cr difference in percentage between test tyres of the same type measured in laboratory on drum TUG
70

10.3 BASt – TUG BASt and TUG performed drum measurements on the same tyres: AAV4/BASt. ES16/BASt and SRTT/BASt. The comparing graph is shown in Figure 10.5.
0,000
0,002
0,004
0,006
0,008
0,010
0,012
0,014
0,016
SRTT/BASt_
50
ES16/BASt_5
0
AAV4/BASt_
50
SRTT/BASt_
80
ES16/BASt_8
0
AAV4/BASt_
80
Test tyre
Cr
TUG
BASt
Figure 10.5: Comparison drum measurements performed by TUG and BASt on BASt test tyres on Safety Walk
- drum methods (outer drum BASt versus flat surface correction TUG) - absence of temperature correction - different tyre inflation (200 kPa BASt versus 210 kPa TUG)
10.4 Data from Michelin Two test reports from Michelin were obtained of a SRTT and an ES16 tyre that came from other batches than the tyres used for MIRIAM. A drum with diameter 1.7 m was used for the test but the results are expressed for a drum with diameter 2.0 m. Results were corrected for drum curvature to a 1.7 m drum and to flat (as TUG) according to ISO 28580 [6]. All results are specified in Table 10.1. Unfortunately they can not be compared with TUG because a different tyre load and pressure was used during the test. BASt however measured ES16/BASt in ISO conditions so this test may be used to get an impression of the value, although it was not performed with exactly the same tyre. The Michelin test result is similar to the BASt test result (see also Figure 10.1).
Table 10.1: Results from measurements on a drum by Michelin
Tyre Speed Tyre load
Tyre pressure
Ambient air
temperature
Nominaldesign radius r
Drum diameter
R1 Cr_drum1
Drum diameter
R2 Cr_drum2 CR_flat
Some differences may be due to:
[km/h] [N] [kPa] [°C] [m] [m] [m]
SRTT/Michelin 80 5730 ? 25 0.338 2.0 0.0087 1.7 0.0088 0.0080
ES16/Michelin 80 5890 210 25 0.338 2.0 0.0079 1.7 0.0080 0.0073
71
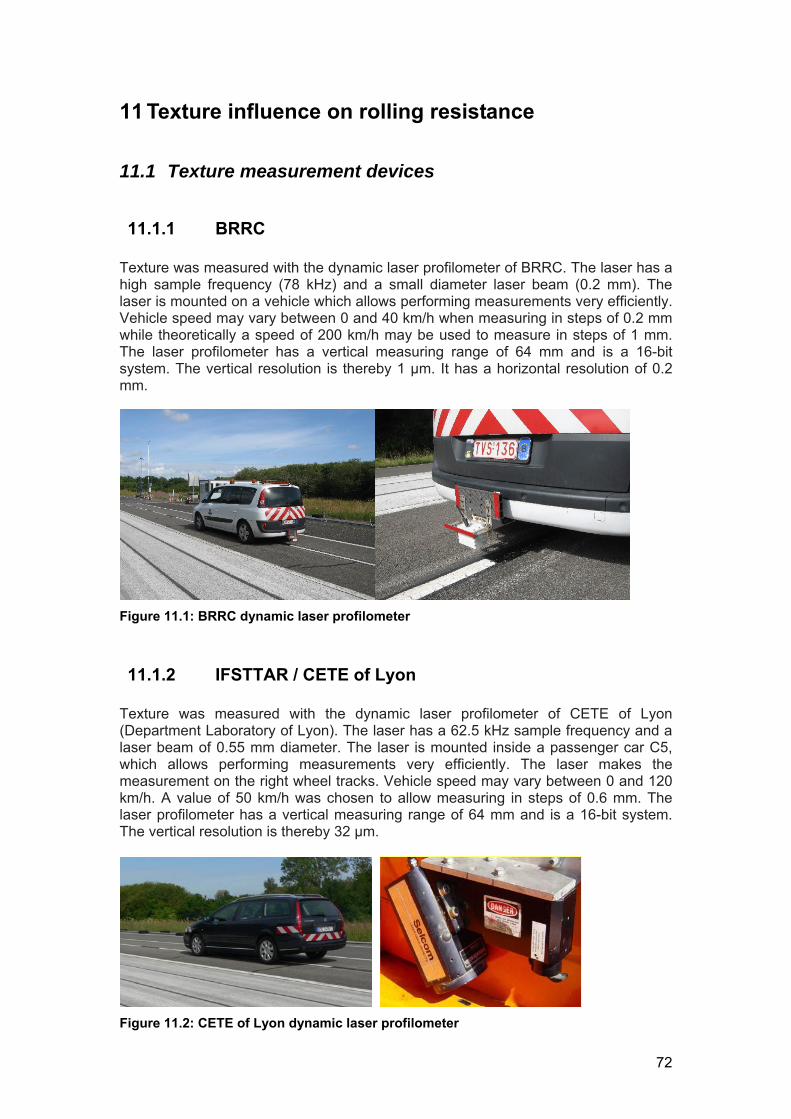
11 Texture influence on rolling resistance
1.1 Texture measurement devices
11.1.1 BRRC Texture was measured with the dynamic laser profilometer of BRRC. The laser has a high sample frequency (78 kHz) and a small diameter laser beam (0.2 mm). The laser is mounted on a vehicle which allows performing measurements very efficiently. Vehicle speed may vary between 0 and 40 km/h when measuring in steps of 0.2 mm while theoretically a speed of 200 km/h may be used to measure in steps of 1 mm. The laser profilometer has a vertical measuring range of 64 mm and is a 16-bit system. The vertical resolution is thereby 1 μm. It has a horizontal resolution of 0.2 mm.
1
Figure 11.1: BRRC dynamic laser profilometer
exture was measured with the dynamic laser profilometer of CETE of Lyon
efficiently. The laser makes the easurement on the right wheel tracks. Vehicle speed may vary between 0 and 120
11.1.2 IFSTTAR / CETE of Lyon T(Department Laboratory of Lyon). The laser has a 62.5 kHz sample frequency and a laser beam of 0.55 mm diameter. The laser is mounted inside a passenger car C5, which allows performing measurements very mkm/h. A value of 50 km/h was chosen to allow measuring in steps of 0.6 mm. The laser profilometer has a vertical measuring range of 64 mm and is a 16-bit system. The vertical resolution is thereby 32 μm.
F E of dy ic laser profilomigure 11.2: C TE Lyon nam eter
72

11.1.3 Comparison texture measurements performed by
Texture measurements were verified by comparing measurements performed by ons are shown in Figure 11.3 and
en texture spectra in the megatexture range is fairly good. e BRRC equipment, the values at the shorter
avelengths are more reliable. In general wavelengths higher than 6.3 mm can be
IFSTTAR and BRRC on test track
BRRC and IFSTTAR. Two examples of comparisigure 11.4. F
The comparison betweDue to the higher accuracy of thwconsidered as accurate for both laser profilometers. Texture measurements performed by BRRC were used for all further analyses in this report as they were performed on the same days as the rolling resistance measurements.
A'
0
10
20
30
40
50
60
0,5
00
0
0,4
00
0
0,3
17
5
0,2
50
0
0,2
00
0
0,1
58
7
0,1
25
0
0,1
00
0
0,0
80
0
0,0
62
5
0,0
50
0
0,0
40
0
0,0
31
8
0,0
25
0
0,0
20
0
0,0
15
9
0,0
12
5
0,0
10
0
0,0
08
0
0,0
06
3
0,0
05
0
0,0
04
0
0,0
03
2
0,0
02
5
Wavelength [m]
Te
xtu
re le
ve
l [d
B r
e. 1
µm
]
BRRC
IFSTTAR
Figure 11.3: Comparison texture spectrum A’ measured by BRRC and IFSTTAR
L2
0
BRRC
IFSTTAR
10
20
30
40
50
60
re le
ve
l [d
B r
e. 1
µm
]
0,5
00
0
0,4
00
0
0,3
17
5
0,2
50
0
0,2
00
0
0,1
58
7
0,1
25
0
0,1
00
0
0,0
80
0
0,0
62
5
0,0
50
0
0,0
40
0
0,0
31
8
0,0
25
0
0,0
20
0
0,0
15
9
0,0
12
5
0,0
10
0
0,0
08
0
0,0
06
3
0,0
05
0
0,0
04
0
0,0
03
2
0,0
02
5
Wavelength [m]
Te
xtu
Figure 11.4: Comparison texture spectrum L2 measured by BRRC and IFSTTAR
73

11.2 One-third-octave band texture levels The correlation between rolling resistance one-third-octave band texture levels
ion C has been excluded because of the many irregularities of the urface. The correlation has been calculated for texture levels without and with
(measured by BRRC) has been determined based on rolling resistance measurements performed by TUG on test sections A, A’, F, E1, E2, M1, M2, L1 and L2. Test sectsenveloping.
11.2.1 Without enveloping
Without enveloping - 50 km/h
0
0,1
0,2
0,3
0,4
0,5
0,6
0,7
0,8
0,9
1
0,50
00
0,40
00
0,31
75
0,25
00
0,20
00
0,15
87
0,12
50
0,10
00
0,08
00
0,06
25
0,05
00
0,04
00
0,03
18
0,02
50
0,02
00
0,01
59
0,01
25
0,01
00
0,00
80
0,00
63
0,00
50
0,00
40
0,00
32
0,00
25
Texture wavelength [m]
R²
AAV4/TUG
SRTT/TUG
ES16/TUG
ES14/TUG
Figure 11.5: Correlations at various texture wavelengths and tyres for measurements performed at 50 km/h – without enveloping
Without enveloping - 80 km/h
0
0,1
0,2
0,3
0,4
0,5
0,6
0,7
0,8
0,9
1
0,50
00
0,40
00
0,31
75
0,25
00
0,20
00
0,15
87
0,12
50
0,10
00
0,08
00
0,06
25
0,05
00
0,04
00
0,03
18
0,02
50
0,02
00
0,01
59
0,01
25
0,01
00
0,00
80
0,00
63
0,00
50
0,00
40
0,00
32
0,00
25
Texture wavelength [m]
R²
AAV4/TUG
SRTT/TUG
ES16/TUG
ES14/TUG
Figure 11.6: Correlations at various texture wavelengths and tyres for measurementsperformed at 80 km/h – without enveloping
ichelin Energy Saver tyres show the highest correlations for all texture avelengths. The highest correlations for all tyres are found at the longest texture
wavelengths. The results for SRTT/TUG and AAV4/TUG lie very close together.
Mw
74

11.2.2 With enveloping
With enveloping - 50 km/h
0,8
0,9
1
0
0,1
0,2
0,3
0,4
0,5
0,6
0,7
0,50
00
0,40
00
0,31
75
0,25
00
0,20
00
0,15
87
0,12
50
0,10
00
0,08
00
0,06
25
0,05
00
0,04
00
0,03
18
0,02
50
0,02
00
0,01
59
0,01
25
0,01
00
0,00
80
0,00
63
0,00
50
0,00
40
0,00
32
0,00
25
Texture wavelength [m]
R²
AAV4/TUG
SRTT/TUG
ES16/TUG
ES14/TUG
Invalid range
Figure 11.7: Correlations at various texture wavelengths and tyres for measurements performed at 50 km/h – with enveloping
With enveloping - 80 km/h
0
0,1
0,2
0,3
0,4
0,6
0,7
0,8
0,9
1
0,50
00
0,40
00
0,31
75
0,25
00
0,20
00
0,15
87
0,12
50
0,10
00
0,08
00
0,06
25
0,05
00
0,04
00
0,03
18
0,02
50
0,02
00
0,01
59
0,01
25
0,01
00
0,00
80
0,00
63
0,00
50
0,00
40
0,00
32
0,00
25
Texture wavelength [m]
0,5 R²
AAV4/TUG
SRTT/TUG
ES16/TUG
ES14/TUG
Invalid range
Figure 11.8: Correlations at various texture wavelengths and tyres for measurements performed at 80 km/h – with enveloping
Michelin Energy Saver tyres show the highest correlations for most texture wavelengths. The correlations are better than without enveloping. Results of SRTT/TUG and AAV4/TUG are situated very closely together. In the macrotexture range a peak can be noted at 0.0040 m. The highest correlations are found in the megatexture range. Please do not pay any attention to the range at shorther wavelengths than 0.02 m
ly the part with wavelengths longer than pproximately 0.02 m should be considered.
since the strange shape of the curve with a peak and a dip there is entirely due to an artefact of the enveloping procedure. Ona
75
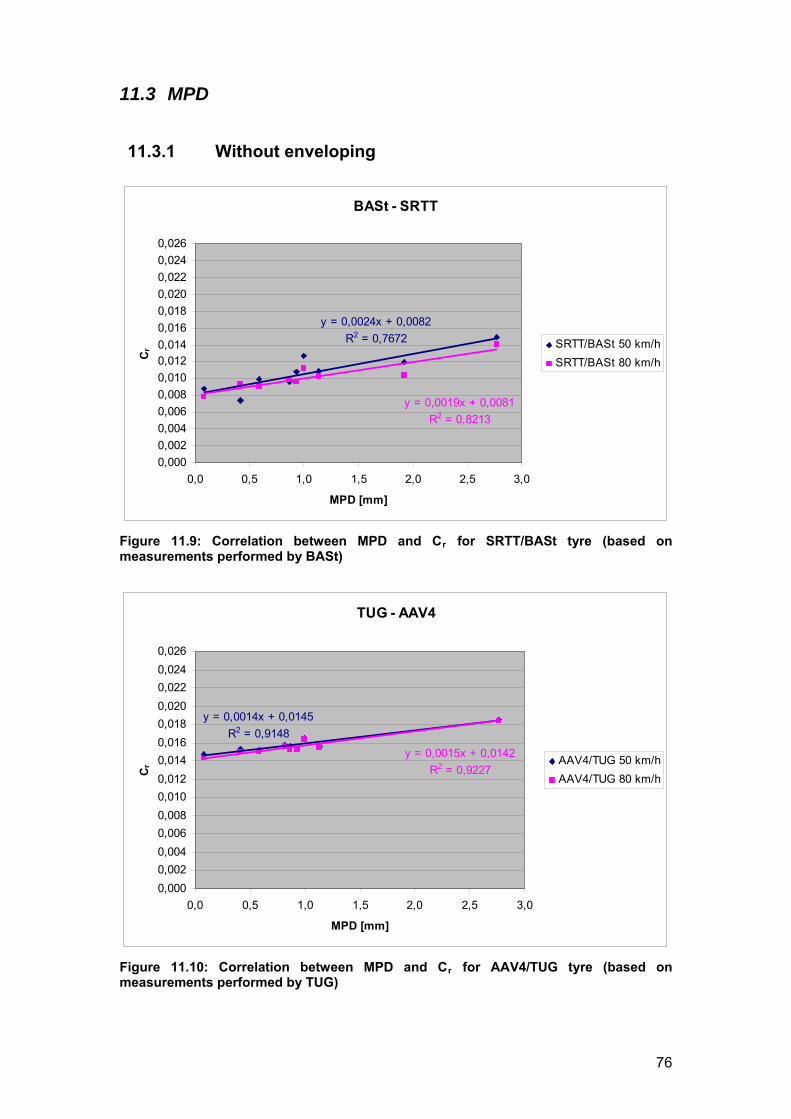
11.3 MPD
11.3.1 veloping
Without en
BASt - SRTT
y = 0,0024x + 0,0082
R2 = 0,7672
y = 0,0019x + 0,0081
R2 = 0,82130,004
0,006
0,000
0,002
0,008
0,010
0,0120,014
0,016
0,018
0,020
0,022
0,024
0,026
0,0 0 1,5 2,0 2,5 3,0
MPD [mm]
Cr SRTT/BASt 50 km/h
SRTT/BASt 80 km/h
0,5 1,
Figure 11.9: Correlation between MPD and Cr for SRTT/BASt tyre (based on measurements performed by BASt)
TUG - AAV4
y = 0,0014x + 0,0145
R = 0,9148
y = 0,0015x + 0,01420,014
0,016
r
2
R2 = 0,92270,012
0,018
0,020
0,022
0,024
0,026
C
AAV4/TUG 50 km/h
AAV4/TUG 80 km/h
0,002
0,004
0,006
0,008
0,010
0,000
0,0 0,5 1,0 1,5 2,0 2,5 3,0
MPD [mm]
igure 11.10: Correlation between MPD and Cr for AAV4/TUG tyre (based on easurements performed by TUG)
Fm
76

SRTT/BASt_BAPD. Table 11.1
St and AAV4/TUG_TUG have very good correlations between Cr and and Table 11.2 summarize all results. Other graphs that are not
hown in Figure 11.9 and Figure 11.10 can be found in Annex B.
s between MPD and Cr for various tyres, stitutes and speeds
BRRC BASt TUG
Ms
able 11Tin
.1: Summarizing table of correlation
Speed [km/h] 50 80 50 80 50 80 AAV4 - - 0.79 0.27 0.91 0.92 SRTT - - 0.77 0.82 0.91 0.92 ES16 - - 0.87 0.40 0.88 0.81 ES14 0.43 0.19 - - 0.88 0.90
Table 11.2: Summarizing table of slope coefficients of regression lines of MPD as a unction of Cr for various tyres, institutes and speeds
BRRC BASt TUG Speed [km/h] 50 80 50 80 50 80 AAV4 - - 0.0014 0.0016 0.0014 0.0015 SRTT - - 0.0024 0.0019 0.0020 0.0020 ES16 - - 0.0017 0.0010 0.0017 0.0018 ES14 0.0017 0.0014 - - 0.0016 0.0015
11.3.2 With enveloping
BASt - SRTT
y = 0,0031x + 0,0085
R2 = 0,7800
y = 0,0027x + 0,0082
R2 = 0,9333
0,000
0,002
0,004
0,006
0,008
0,010
0,0120,014
0,016
0,018
0,020
0,022
0,024
0,026
0,0 0,5 1,0 1,5 2,0 2,5 3,0
MPD [mm]
Cr SRTT/BASt 50 km/h
SRTT/BASt 80 km/h
Figure 11.11: Correlation between MPD and Cr for SRTT/BASt tyre (based on measurements performed by BASt) – with enveloping
77

TUG - AAV4
y = 00,022
0,024
,0018x + 0,0146
0
,00 012 0
0,002
0,008
14
0,020
0,026
0 1,0 1 2, 2,5 0
PD
R2 = 0,979
y = 0 19x + 0, 44
R = 0,971
0,010
0,012
0,0
Cr
0,016
0,018
AAV4/TUG 50 km/h
AAV4/TUG 80 km/h
0,004
0,006
0,000
0,0 ,5 ,5 0 3,
M [mm]
Figure 11.12: Co n MPD and fo / e (based on measurements performed by TUG) – with enveloping
SRTT/BASt_BASt and AAV4/TUG_TUG have even better correlations between Cr
.3 and Table 11.4 summarize all results. Other and Figure 11.12 can be found in Annex
measurements are very accurate.
Table 11.3: Summarizing table of correlations between MPD and Cr for various tyres, institutes and speeds – with enveloping
BRRC BASt TUG
rrelation betwee Cr r AAV4 TUG tyr
and MPD with enveloping. Table 11raphs that are not shown in Figure 11.11g
C. Excellent correlations must be a sign that the
Speed [km/h] 50 80 50 80 50 80 AAV4 - - 0.91 0.29 0.98 0.97 SRTT - - 0.70 0.93 0.98 0.97 ES16 - - 0.82 0.60 0.92 0.84 ES14 0.33 0.12 - - 0.87 0.93
Table 11.4: Summarizing table of slope coefficients of regression lines of MPD as a unction of Cr for various tyres, institutes and speeds – with enveloping
BRRC BASt TUG Speed [km/h] 50 80 50 80 50 80 AAV4 - - 0.0020 0.0032 0.0018 0.0019 SRTT - - 0.0031 0.0027 0.0025 0.0025 ES16 - - 0.0021 0.0023 0.0021 0.0022 ES14 0.0020 0.0015 - - 0.0020 0.0018
78

11.4 Band-limited macrotexture and megatexture levels Broad band mega- and macrotexture levels LMe and LMa [1], are defined as follows: LMe = 10 log ∑ 10Li/10 i with Li the level of the i-th one-third-octave band in the megatexture range of the texture scale. An analogue definition goes for LMa. Megatexture range is from 63 mm to 500 mm of centre wavelengths. Macrotexture range is from 0.63 mm to 50 mm of centre wavelengths. The correlations of Cr with LMa and LMe have been calculated for the different tyre/trailer combinations. The following graphs show their correlation with the rolling resistance coefficient.
11.4.1 Macrotexture
11.4.1.1 Without enveloping
BASt - SRTT
0,020
0,022
0,024
0,026
y = 0,00015x + 0,0020,014
0,016
0,018
248
= 0,38660
y = 3x 18
0,4
000
0,012
30 35 40 45 50 55 60 65
Cr SRTT/BASt 50 km/h
R
0,0001 + 0,003
R2 = 5306
0,
0,002
0,004
0,006
0,008
0,010SRTT/BASt 80 km/h
LMa [dB re. 1 µm]
Figure 11.13: Correlatio en macrot Cr for SRTT/BASt tyre (based on m erfo y BASt)
n betwe exture and easurements p rmed b
79

TUG - AAV4
0,026
0,024
0,022
y = 0,00008x + 0,01160
R2 = 0,36621
0,012
0,014
0,016
0,018
0,020
Cr AAV4/TUG 50 km/h
AAV4/TUG 80 km/h
y = 0,00009x + 0,01090
R2 = 0,411630,006
0,008
0,010
0,000
0,002
0,004
30 35 40 45 50 55 60 65
LMa [dB re. 1 µm]
igure 11.14: Correlation between macrotexture and Cr for AAV4/TUG tyre (based on
measurements performed by TUG)
SRTT/BASt_BASt and AAV4/TUG_TUG give rather low correlations between Cr and macrotexture. Table 11.5 and Table 11.6 summarize all results. Other graphs that are not shown in Figure 11.13 and Figure 11.14 can be found in Annex D.
Table 11.5: Summarizing table of correlations between macrotexture and Cr for various tyres, institutes and speeds
BRRC BASt TUG
F
Speed [km/h] 50 80 50 80 50 80 AAV4 - - 0.33 0.08 0.37 0.41 SRTT - - 0.39 0.45 0.37 0.41 ES16 - - 0.65 0.54 0.48 0.51 ES14 0.62 0.35 - - 0.55 0.49
Table 11.6: Summarizing table of slope coefficients of regression lines of LMa as a unction of Cr for various tyres, institutes and speeds
BRRC BASt TUG Speed [km/h] 50 80 50 80 50 80 AAV4 - - 0.00008 0.00005 0.00008 0.00009 SRTT - - 0.00015 0.00013 0.00011 0.00012 ES16 - - 0.00013 0.00007 0.00011 0.00012 ES14 0.00019 0.00017 - - 0.00011 0.00010
80

11.4.1.2 With enveloping
BASt - SRTT
y = 0,00023x - 0,00087
R2 = 0,59604
y = 0,00020x + 0,00015
R2 = 0,72596
0,000
0,002
0,004
0,006
0,008
0,010
0,0120,014
0,016
0,018
0,020
0,022
0,024
0,026
30 35 40 45 50 55 60 65
LMa [dB re. 1 µm]
Cr SRTT/BASt 50 km/h
SRTT/BASt 80 km/h
Figure 11.15: Correlation between macrotexture and Cr for SRTT/BASt tyre (based on
easurements performed by BASt) – with enveloping m
TUG - AAV4
y = 0,000
0,026
13x + 0,00942
R2
842
00
0,004
0,010
0,012
18
20
0,024
30 35 40
e
= 0,66504
0,014
Cr
0,016
0,0
0,0
0,022
AAV4/TUG 50 km/h
AAV4/TUG 80 km/h
y = 0,00014x + 0,00865
R2 = 0,700,006
0,008
0,0
0,002
45 50 55 60 65
LM B ra [d . 1 µm]
igure 11.16: Correlation between macrotexture and Cr for AAV4/TUG tyre (based on easurements performed by TUG) – with enveloping
RTT/BASt_BASt and AAV4/TUG_TUG have good correlations between Cr and macrotexture, much better than without enveloping. Table 11.7 and Table 11.8
Fm
S
81

summarize all results. Other graphs that are not shown in Figure 11.15 and Figure 1.16 can be found in Annex E.
Table 11.7: Summarizing table of correlations between macrotexture and Cr for various tyres, institutes and speeds – with enveloping
BRRC BASt TUG
1
Speed [km/h] 50 80 50 80 50 80 AAV4 - - 0.60 0.10 0.67 0.71 SRTT - - 0.60 0.73 0.66 0.70 ES16 - - 0.80 0.61 0.77 0.79 ES14 0.57 0.28 - - 0.80 0.77
Table 11.8: Summarizing table of slope coefficients of regression lines of LMa as a unction of Cr for various tyres, institutes and speeds – with enveloping
BRRC BASt TUG Speed [km/h] 50 80 50 80 50 80 AAV4 - - 0.00014 0.00008 0.00013 0.00014 SRTT - - 0.00023 0.00020 0.00018 0.00019 ES16 - - 0.00018 0.00010 0.00017 0.00019 ES14 0.00022 0.00018 - - 0.00017 0.00015
11.4.2.1 Without enveloping
11.4.2 Megatexture
BASt - SRTT
y = 0,00025x - 0,00185
R2 = 0,59100
y = 0,00019x + 0,00034
R2 = 0,58963
0,000
0,002
0,004
0,006
0,008
0,010
0,0120,014
0,016
0,018
0,020
0,022
0,024
0,026
30 35 40 45 50 55 60 65
LMe [dB re. 1 µm]
Cr SRTT/BASt 50 km/h
SRTT/BASt 80 km/h
Figure 11.17: Correlation between megatexture and Cr for SRTT/BASt tyre (based on
easurements performed by BASt) m
82

TUG - AAV4
0,024
0,026
y = 0,18
0,020000 0,00
R2 = 634
0 00
R2 = 3010
16
0,022
30 35 40
LM B re
15x + 850
0,62
y = 0,00 16x + 0, 760
0,67350,
0,012
0,014
Cr
0,0
0,0
AAV4/TUG 50 km/h
AAV4/TUG 80 km/h
0,004
0,006
0,008
0,000
0,002
45 50 55 60 65
e [d . 1 µm]
igure 11.18: Correlation between megatexture and Cr for AAV4/TUG tyre (based on
ents performed by TUG)
RTT/BASt_BAST and AAV4/TUG_TUG have rather good correlations between Cr and megatexture. Table 11.9 and Table 11.10 summarize all results. Other graphs
d Figure 11.18 can be found in Annex F.
Table 11.9: Summarizing table of correlations between megatexture and Cr for various tyres, institutes and speeds
BRRC BASt TUG
Fmeasurem
S
that are not shown in Figure 11.17 an
Speed [km/h] 50 80 50 80 50 80 AAV4 - - 0.53 0.17 0.63 0.67 SRTT - - 0.59 0.59 0.62 0.66 ES16 - - 0.79 0.43 0.69 0.72 ES14 0.56 0.30 - - 0.76 0.71
Table 11.10: Summarizing table of slope coefficients of regression lines of LMe as a unction of Cr for various tyres, institutes and speeds
BRRC BASt TUG Speed [km/h] 50 80 50 80 50 80 AAV4 - - 0.00014 0.00011 0.00015 0.00016 SRTT - - 0.00025 0.00019 0.00020 0.00022 ES16 - - 0.00019 0.00009 0.00019 0.00021 ES14 0.00024 0.00021 - - 0.00019 0.00017
83

11.4.2.2 With enveloping
BASt - SRTT
y = 0,00029x - 0,00338
R2 = 0,77489
y = 0,00023x - 0,00128
R2 = 0,83485
0,000
0,002
0,004
0,006
0,008
0,010
0,0120,014
0,016
0,018
0,020
0,022
0,024
0,026
30 35 40 45 50 55 60 65
LMe [dB re. 1 µm]
Cr SRTT/BASt 50 km/h
SRTT/BASt 80 km/h
Figure 11.19: Correlation between megatexture and Cr for SRTT/BASt tyre (based on
easurements performed by BASt) – with enveloping m
TUG - AAV4
0,024
0,026
y = 0,0,020
000 0,00
R2 = 599
y 19 06
= 0,
0,002
0,010
12
14
16
18
0,022
30 35 40
LM B re
17x + 754
0,91
= 00,00
R2
x + 0,0
94307
740,0
C
0,0r
0,0
0,0
AAV4/TUG 50 km/h
AAV4/TUG 80 km/h
0,004
0,006
0,008
0,000
45 50 55 60 65
e [d . 1 µm]
1.20: Correla gatexture and Cr r AAV4/TUG on
easurements performed by TUG) – with enveloping
RTT/BASt_BAST and AAV4/TUG_TUG have very good correlations between Cr nd megatexture, even better than without enveloping. Table 11.11 and Table 11.12
summarize all results. Other graphs that are not shown in Figure 11.19 and Figure 11.20 can be found in Annex G.
Figure 1 tion between me fo tyre (basedm
Sa
84

Table 11.11: Summarizing table of correlations between megatexture and Cr for various tyres, institutes and speeds – with enveloping
BRRC BASt TUG Speed [km/h] 50 80 50 80 50 80 AAV4 - - 0.80 0.22 0.92 0.94 SRTT - - 0.77 0.83 0.91 0.93 ES16 - - 0.84 0.50 0.94 0.93 ES14 0.44 0.20 - - 0.94 0.94
Table 11.12: Summarizing table of slope coefficients of regression lines of LMe as a unction of Cr for various tyres, institutes and speeds – with enveloping
BRRC BASt TUG Speed [km/h] 50 80 50 80 50 80 AAV4 - - 0.00017 0.00016 0.00017 0.00019 SRTT - - 0.00029 0.00023 0.00024 0.00025 ES16 - - 0.00020 0.00012 0.00022 0.00023 ES14 0.00021 0.00017 - - 0.00021 0.00019
11.5.1 Correlations
11.5.1.1 Without enveloping A summary of all correlations with MPD, macrotexture and megatexture can be found in Figure 11.21. A better correlation is found with megatexture than with macrotexture. The best correlation is obtained with MPD. This may be related with the effects of positive/negative texture. The worst correlation is found for AAV4/BASt at 80 km/h. This is probably due to the “strange” measurement results for this tyre/speed which are not in line with the others. ES14/BRRC also has a low correlation which is probably due to the lack of wind shielding and the high influence of wind at a speed of 80 km/h. Also the outlier M2 causes a low correlation. If this outlier would have been discarded, correlations for BRRC would be between 0.60 and 0.85.
11.5 MPD, macrotexture and megatexture
85
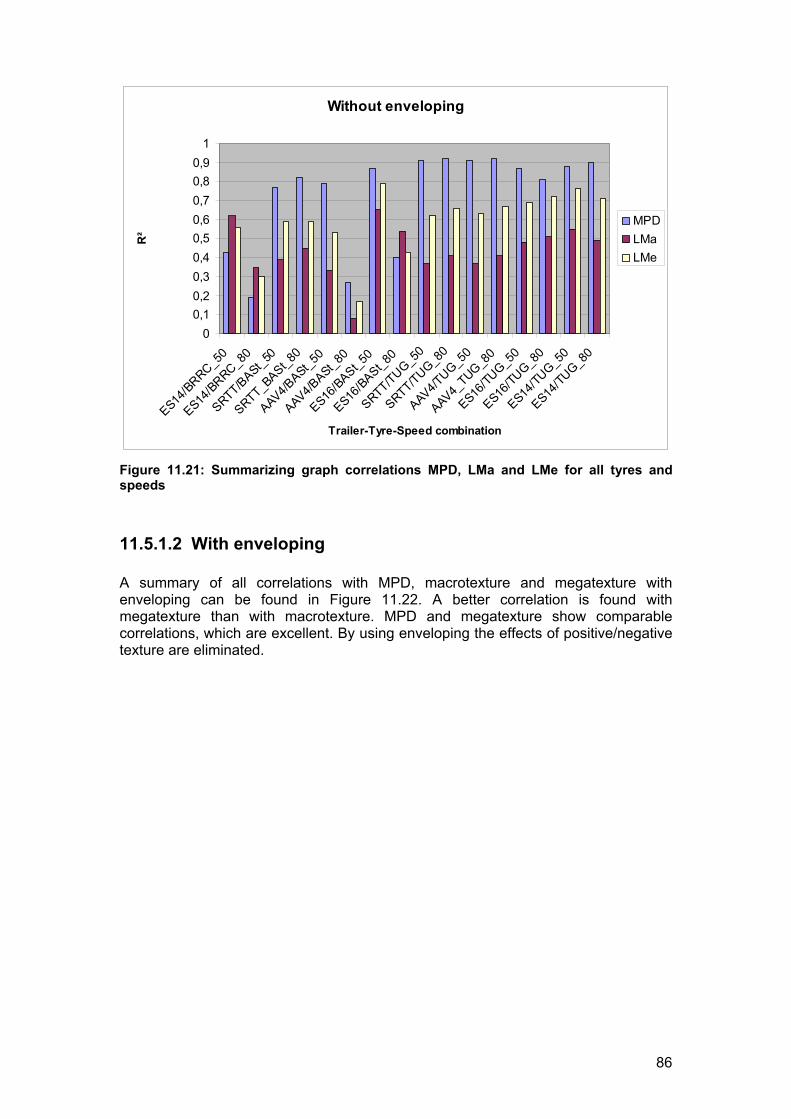
Without enveloping
1
0,8
0,9
0
0
0,1
0,4
0,5
0,6
0,7
4/BRRC_5
ES14/B
RRC_80
SRTT/BASt_
SRTT_
0
BASt_50
V4/BASt
16
t_50
/BAS
R
MPD
LMaR²
LMe
0,2
0,3
ES1
50t_
8
BAS
AA AAV4/
_80
ES ES S
/BAS
16
t_80
G_50
G_
TT
80
TU
AA
_5
6/
_
Trailer-Tyre-Speed combination
/TU TU
/
SRTT/
AAV4
GTUG
/TUG_5
0_8
0
V4_
ES16ES1
0_8
0G_5
0
TUG
/TU
/TUG
ES14ES14
80
nd LMe for all tyres and
h MPD, macrotexture and megatexture with e 11.22. A better correlation is found with
egatexture than with macrotexture. MPD and megatexture show comparable
Figure 11.21: Summarizing graph correlations MPD, LMa aspeeds
11.5.1.2 With enveloping A summary of all correlations witenveloping can be found in Figurmcorrelations, which are excellent. By using enveloping the effects of positive/negative texture are eliminated.
86

With enveloping
0
0,1
0,2
0,3
0,4
0,5
0,6
0,7
0,8
0,9
1
ES14/B
RRC_50
ES14/B
RRC_80
SRTT/BASt_
50
SRTT_BASt_
80
AAV4/BASt_
50
AAV4/BASt_
80
ES16/B
ASt_50
ES16/B
ASt_80
SRTT/TUG_5
0
SRTT/TUG_8
0
AAV4/TUG_5
0
AAV4_TUG
_80
ES16/T
UG_50
ES16/T
UG_80
ES14/T
UG_50
ES14/T
UG_80
Trailer-Tyre-Speed combination
R²
MPD
LMa
LMe
Figure 11.22: Summarizing graph correlations MPD, LMa and LMe for all tyres and speeds – with enveloping
11.5.2 Slope coefficients
All slope coefficients of regression lines found in sections 11.3 - 11.4 for analyses without enveloping and with correlations equal to or higher than 0.7, are summarized in Figure 11.23 and Figure 11.24.
To eliminate uncertainties, only the measurements of section 11.5.1 with correlations equal to or higher than 0.7 are considered in this section 11.5.2.
11.5.2.1 Without enveloping
87

MPD - Without enveloping
0
0,0005
0,001
0,0015
0,002
0,0025
0,003
0,0035
SRTT/BASt_
50
SRTT_BASt_
80
AAV4/BASt_
50
ES16/BASt_5
0
SRTT/TUG_5
0
SRTT/TUG_8
0
AAV4/TUG_50
AAV4_TUG_8
0
ES16/TU
G_50
ES16/TU
G_80
ES14/TU
G_50
ES14/TU
G_80
Trailer - tyre - speed combination
Slo
pe
coef
fici
ent
Figure 11.23: Summarizing graph slope coefficients MPD for various tyres and speeds
trailer – tyre – speed combinations no values are given ecause of lack of data with high correlations.
In Figure 11.24 for someb
LMa and LMe - Without enveloping
0
0,00005
0,0003
SRTT/BASt_
50
SRTT_BASt_
80
AAV4/BASt_
50
ES16/BASt_5
0
SRTT/TUG_5
0
SRTT/TUG_8
0
AAV4/TUG_50
AAV4_TUG_8
0
ES16/TU
G_50
ES16/TU
G_80
ES14/TU
G_50
ES14/TU
G_80
Trailer - tyre - speed combination
eft
0,00035
0,0002
0,00025
fici
en
LMa
0,0001
0,00015
Slo
pe
co LMe
Figure 11.24: Slope coefficients LMa and LMe for various tyres and speeds
Based on Figure 11.25 and Figure 11.26 one can state that the slope coefficients without enveloping are independent of speed or institute but possibly dependent of tyre type. MPD, LMa and LMe have an overall average slope coefficient of 0.00174, 0.00013 and 0.00019 respectively.
88
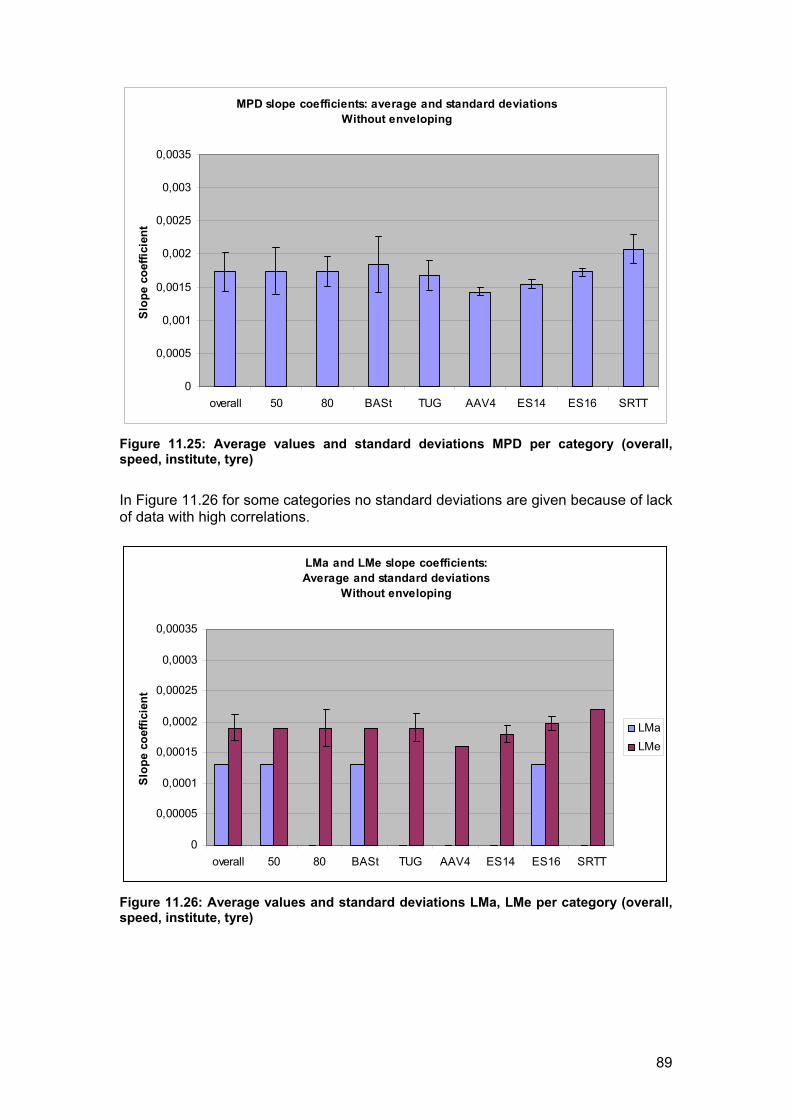
MPD slope coefficients: average and standard deviationsWithout enveloping
0
0,0005
0,001
0,0015
0,002
0,0025
0,003
0,0035
overall 50 80 BASt TUG AAV4 ES14 ES16 SRTT
Slo
pe
coef
fici
ent
Figure 11.25: Average values and standard deviations MPD per category (overall, speed, institute, tyre)
d deviations are given because of lack f data with high correlations.
In Figure 11.26 for some categories no standaro
LMa and LMe slope coefficients:Average and standard deviations
Without enveloping
0
0,00005
0,0001
0,00015
0,0002
0,00025
0,0003
0,00035
overall 50 80 BASt TUG AAV4 ES14 ES16 SRTT
Slo
pe
coef
fici
ent
LMa
LMe
Fs
igure 11.26: Average values and standard deviations LMa, LMe per category (overall, peed, institute, tyre)
89

11.5.2.2 With enveloping All slope coefficients of regression lines found in section 11.3 - 11.4 for analyses with enveloping and with correlations equal to or higher than 0.7, are summarized in Figure 11.27 and Figure 11.28. All slope coefficients are larger with enveloping than without enveloping.
MPD - With enveloping
0,0005
0,001
0,0015
0,002
0,0025
0,003
0,0035
0
_50t_
80 0 0 0 0 0
SRTT/BASt
_BAS
/BASt_
50
/BASt_5
TUG_5
T/TUG_8
/TUG_50
_TUG_8
/TUG_5
/TUG_8
0
/TUG_5
0
/TUG_8
0
Trailer - tyre - speed combination
Slo
pe
coef
fici
ent
SRTT
AAV4ES16
SRTT/
SRTAAV4
AAV4ES16
ES16ES14
ES14
Figure 11.27: Summarizing graph slope coefficients MPD for various tyres and speeds – with enveloping
LMa and LMe - With enveloping
0
0,00005
0,0001
0,00015
0,0002
0,00025
0,0003
0,00035
SRTT/B
SRT
ASt_50
TBASt_
80
ASt_50
ASt_50
TUG_50
TUG_80
UG_50
UG_80
UG_50
UG_80
UG_50
UG_80
Trailer - tyre - speed combination
Slo
pe
coef
fici
ent
_
AAV4/B
ES16/B
SRTT/
SRTT/
AAV4/T
AAV4_T
ES16/T
ES16/T
ES14/T
ES14/T
LMa
LMe
igure 11.28: Slope coefficients LMa and LMe for various tyres and speeds – with
enveloping
F
90

Based on Figure 11.29 and Figure 11.30 one can conclude that the slope coefficients ith enveloping are independent of speed or institute, but dependent of tyre type. w
MPD, LMa and LMe have an overall average slope coefficient of 0.00223, 0.00017 and 0.00022 respectively, which is higher than without enveloping.
MPD slope coefficients: average and standard deviationsWith enveloping
0
0,0005
0,001
0,0015
0,002
0,0025
0,003
0,0035
overall 50 80 BASt TUG AAV4 ES14 ES16 SRTT
Slo
pe
coef
fici
ent
Figure 11.29: Average values and standard deviations MPD per category (overall, speed, institute, tyre) – with enveloping
LMa and LMe slope coefficients: Average and standard deviations
With enveloping
0
0,00005
0,0001
0,00015
0,0002
0,00025
0,0003
overall 50 80 BASt TUG AAV4 ES14 ES16 SRTT
Slo
pe
coef
fici
ent
LMa
LMe
Figure 11.30: Average values and standard deviations LMa, LMe per category (overall, speed, institute, tyre) – with enveloping
91
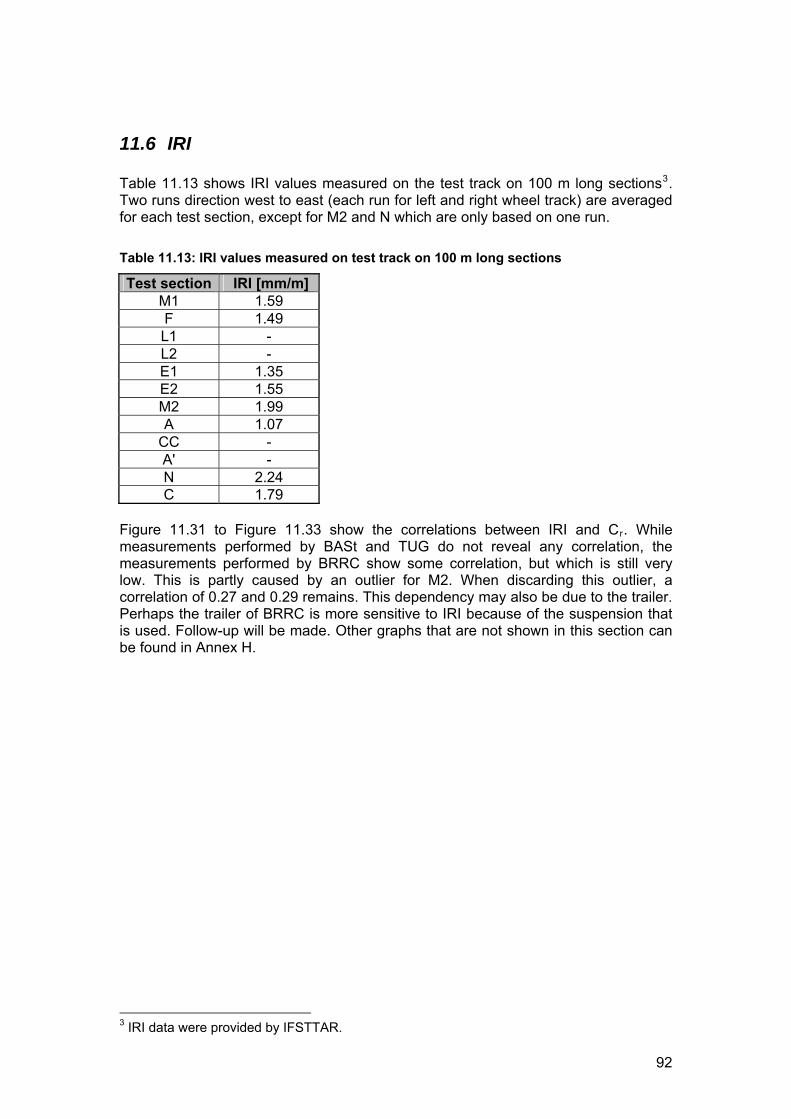
11.6 IRI Table 11.13 shows IRI values measured on the test track on 100 m long sections3. Two runs direction west to east (each run for left and right wheel track) are averaged for each test section, except for M2 and N which are only based on one run.
Table 11.13: IRI values measured on test track on 100 m long sections
Test section IRI [mm/m] M1 1.59 F 1.49 L1 - L2 - E1 1.35 E2 1.55 M2 1.99 A 1.07
CC - A' - N 2.24 C 1.79
d TUG do not reveal any correlation, the easurements performed by BRRC show some correlation, but which is still very
outlier for M2. When discarding this outlier, a correlation of 0.27 and 0.29 remains. This dependency may also be due to the trailer. Perhaps the trailer of BRRC is more sensitive to IRI because of the suspension that is used. Follow-up will be made. Other graphs that are not shown in this section can be found in Annex H.
Figure 11.31 to Figure 11.33 show the correlations between IRI and Cr. While measurements performed by BASt anmlow. This is partly caused by an
d by IFSTTAR. 3 IRI data were provide
92

BASt - SRTT
0,026
y = 0,00008x + 0,010700,016
0,018
0,020
0,022
R2 = 0,00077
y = 0,00040x + 0,00933
R2 = 0,04942
0,024
0,00 0,5 1,00 1,50 2,00 2,50 3,00
IRI
SRTT/BASt 50 km/h
0,0120,014
Cr
SRTT/BASt 80 km/h
0,000
0,002
0,004
0 6
0,008
,00
0,010
0
Figure 11.31: Correla n between IRI and Cr for SRTT/BASt tyre (based on measurements perform y BASt)
tioed b
BRRC - ES14
y = 0,00392x + 0,01348
R2 = 0,35506
0,014
0,016
0,018
0,0200,022
0,024
0,026
r ES14/BRRC 50 km/h
y = 0,00233x + 0,01150
R2 = 0,35091
0,000
0,002
0,0040,006
0,008
0,010
0,012
0,00 0,50 1,00 1,50 2,00 2,50 3,00
IRI
C
ES14/BRRC 80 km/h
Figure 11.32: Correlation between IRI and Cr for ES14/BRRC tyre (based on measurements performed by BRRC)
93

TUG - AAV4
y = 0,00013x + 0,01541
R2 = 0,00971
y = -0,00007x + 0,01557
R2 = 0,00197
0,000
0,002
0,004
0,006
0,008
0,010
0,012
0,014
0,016
0,018
0,020
0,022
0,024
0,026
0,00 0,50 1,00 1,50 2,00 2,50 3,00
IRI
Cr AAV4/TUG 50 km/h
AAV4/TUG 80 km/h
Figure 11.33: Correlation between IRI and Cr for AAV4/TUG tyre (based on
easurements performed by TUG) m
94
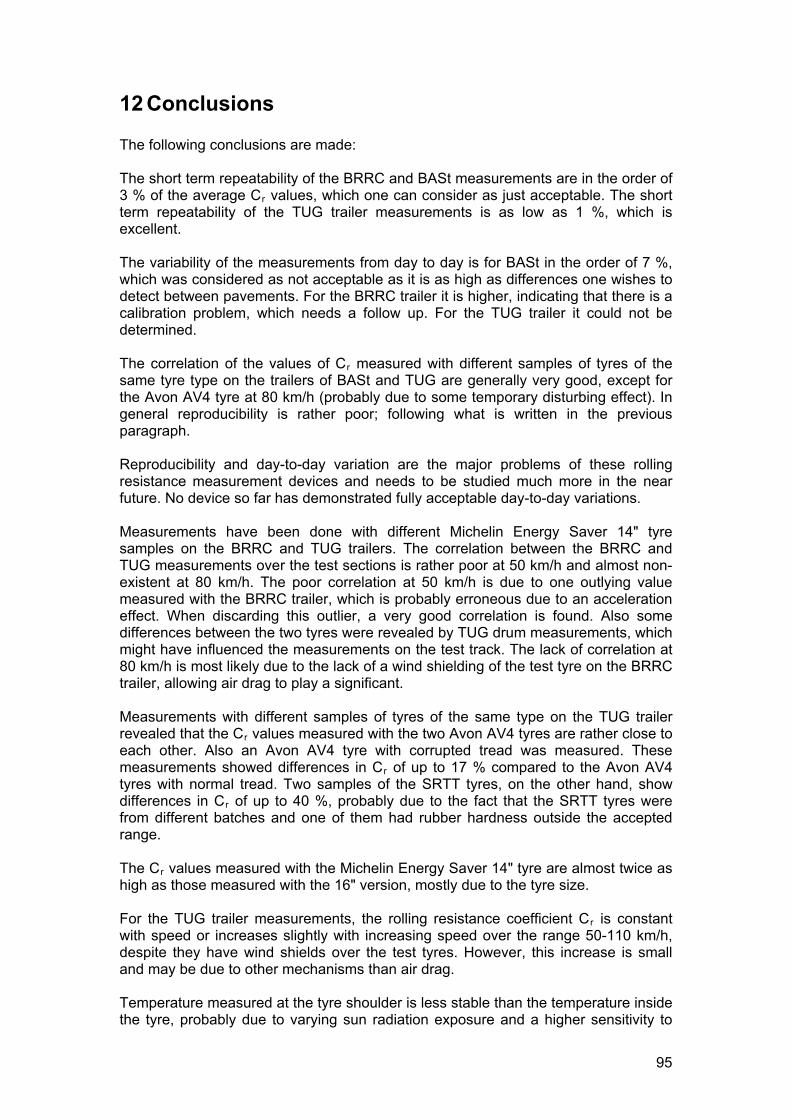
12 Conclusions The following conclusions are made: The short term repeatability of the BRRC and BASt measurements are in the order of 3 % of the average Cr values, which one can consider as just acceptable. The short term repeatability of the TUG trailer measurements is as low as 1 %, which is excellent. The variability of the measurements from day to day is for BASt in the order of 7 %, which was considered as not acceptable as it is as high as differences one wishes to detect between pavements. For the BRRC trailer it is higher, indicating that there is a calibration problem, which needs a follow up. For the TUG trailer it could not be determined. The correlation of the values of Cr measured with different samples of tyres of the same tyre type on the trailers of BASt and TUG are generally very good, except for the Avon AV4 tyre at 80 km/h (probably due to some temporary disturbing effect). In general reproducibility is rather poor; following what is written in the previous paragraph.
and needs to be studied much more in the near future. No device so far has demonstrated fully acceptable day-to-day variations. Measurements have been done with different Michelin Energy Saver 14" tyre samples on the BRRC and TUG trailers. The correlation between the BRRC and TUG measurements over the test sections is rather poor at 50 km/h and almost non-existent at 80 km/h. The poor correlation at 50 km/h is due to one outlying value measured with the BRRC trailer, which is probably erroneous due to an acceleration effect. When discarding this outlier, a very good correlation is found. Also some differences between the two tyres were revealed by TUG drum measurements, which might have influenced the measurements on the test track. The lack of correlation at 80 km/h is most likely due to the lack of a wind shielding of the test tyre on the BRRC trailer, allowing air drag to play a significant. Measurements with different samples of tyres of the same type on the TUG trailer revealed that the Cr values measured with the two Avon AV4 tyres are rather close to each other. Also an Avon AV4 tyre with corrupted tread was measured. These measurements showed differences in Cr of up to 17 % compared to the Avon AV4 tyres with normal tread. Two samples of the SRTT tyres, on the other hand, show differences in Cr of up to 40 %, probably due to the fact that the SRTT tyres were from different batches and one of them had rubber hardness outside the accepted range. The Cr values measured with the Michelin Energy Saver 14" tyre are almost twice as high as those measured with the 16" version, mostly due to the tyre size. For the TUG trailer measurements, the rolling resistance coefficient Cr is constant with speed or increases slightly with increasing speed over the range 50-110 km/h, despite they have wind shields over the test tyres. However, this increase is small and may be due to other mechanisms than air drag. Temperature measured at the tyre shoulder is less stable than the temperature inside the tyre, probably due to varying sun radiation exposure and a higher sensitivity to
Reproducibility and day-to-day variation are the major problems of these rolling resistance measurement devices
95

wind and heating mechanbe more stable when the
isms while rolling. Moreover, the tyre temperature seems to tyre is inflated with nitrogen: the interior temperature drops
ss quickly at standstill with nitrogen than with air. Driving at 80 km/h, a constant tyre ached after about 10 minutes or 13 km.
e before processing it into frequency spectra or calculating MPD. The ighest correlations are found in the megatexture range.
80 km/h show poor correlations with all texture parameters, and this ight be an indication that this data set is erroneous. All TUG results, on the other
as an "outlier", but poor correlation at 80 km/h. The latter is most robably due to a bias by air drag on the non-shielded test tyre.
rre-tions between Cr and MPD, LMa and LMe when applying enveloping have an
itive to unevenness.
leinflation and interior temperature is re Michelin Energy Saver tyres show the highest correlations of the tested tyres between rolling resistance and texture for most texture wavelengths. The correlations are better when applying a special procedure called enveloping to the road texture profile curvh The Cr values measured by BASt and TUG show good to excellent correlations with the considered texture parameters, especially with macrotexture expressed as MPD and with the megatexture level (LMe). Only the BASt measurements with the Avon AV4 tyre at mhand, correlate extremely well with both MPD and LMe. The best results are obtained with the Michelin Energy Saver tyre and the application of enveloping on the texture profile further improves the correlations. The BRRC results show moderate corre-lation at 50 km/h, which would improve drastically if one “suspect” data point would be removedp Correlations between Cr and MPD, LMa and LMe without enveloping give an overall average slope coefficient of 0.00174, 0.00013 and 0.00019, respectively. Colaoverall average slope coefficient of 0.00223, 0.00017 and 0.00022 respectively. The slope increase when enveloping is applied, is probably due to the increasing correlation. No correlation is found between Cr and the road evenness measure IRI, for the IRI range of 1.07 - 2.24 mm/m for the TUG trailer in this study. However, the BRRC trailer seems to have some weak correlation with IRI, and the BASt trailer too in one case. However, the influence may also be due to other circumstances. Nevertheless, this does not mean that unevenness does not affect rolling resistance; it may well be that these trailer systems are relatively insens For the range of surfaces on the test track (MPD from 0.08 to 2.77 mm) the Cr for the test tyres increased from the smoothest to the roughest of the surfaces by 21 - 55 %, depending on the tyre type. Such rolling resistance differences correspond to roughly 7 - 18 % in fuel consumption differences, using calculations made in SP 2 of MIRIAM for light vehicles driving on a typical two-lane highway at 90 km/h (to be published in January 2012).
96

13 References
] ISO 13473-5:2009, Characterization of pavement texture by use of surface[1 profiles - Part 5: Determination of megatexture [2] Sandberg. U. (ed), Rolling Resistance – Basic information and State-of-the-Art on Measurement methods, Deliverable No. 1 in MIRIAM SP1, version 1 June 2011, downloadable from http://miriam-co2.net and from www.transguide.org [3] Von Meier. A.; van Blokland. G.J.; Descornet. G.; The influence of texture and sound absorption on the noise of porous road surfaces, PIARC 2nd International Symposium on Road Surface Characteristics, 1992 [4] Sandberg, Ulf; Ejsmont, Jerzy A.; Bergiers, Anneleen; Goubert, Luc; Zöller, Marek, Rolling Resistance – Measurement Methods for Studies of Road Surface Effects, Deliverable No. 2 in MIRIAM SP1, 2011, downloadable from http://miriam-co2.net and from www.transguide.org [5] De Bie, H., Hofmans, C., Masterproef: Rolweerstand van Belgische wegdekken, Artesis Antwerp, Belgium, 2010-2011 [6] ISO 28580:2009, Passenger car, truck and bus tyres – Methods of measuring rolling resistance – Single point test and correlation of measurement results [7] Descornet, G., Road-Surface Influence on Tire Rolling Resistance, Surface Characteristics of Roadways: International Research and Technologies, ASTM STP 1031, W.E. Meyer and J. Reichert, Eds., American Society for Testing and Materials,
hiladelphiaP , USA, 1990 [8] Sandberg, U.; Ejsmont, Jerzy A., Tyre/Road Noise Reference Book, Informex, SE-59039 Kisa, Sweden (www.informex.info)
97

Annexes
A. Texture spectra measured in middle, right and left wheel track direction east
60
A' middle
0
0,5
,317
50,
20,
125
0,08
0,05
,031
8 2 5 8 5 2
10
20
Te
xtu
re le
ve
l 30
0 00,
00,
012
0,00
0,00
0,00
320,
00
0,00
13
[
40
50
dB
re
. 1 µ
m] A' right wheel track - E
Texture wavelength [m]
Figure A.1: Texture spectra test section A’
0
10
20
30
50
60A middle
A right wheel track - E
40
B r
e. 1
µm
]
0,5
0,31
75 0,2
0,12
50,
080,
05
0,03
180,
02
0,01
250,
008
0,00
5
0,00
320,
002
0,00
13
Texture wavelength [m]
Te
xtu
r [
de
lev
el
Figure A.2: Texture spectra test section A
98

0
10
20
60
30
40
l [d
B r
e. 1
µm
50
0,5
0,31
75 0,2
0,12
50,
080,
05
0,03
18 0,02
0,01
250,
008
0,00
5
0,00
320,
002
0,00
13
Texture wavelength [m]
Te
xtu
re le
ve
]
N middle
N right wheel track - E
Figure A.3: Texture spectra test section N (ground in middle)
0
10
20
30 [d
40
50
60
0,5
0,31
75 0,2
0,12
50,
080,
05
0,03
18 0,02
0,01
250,
008
0,00
5
0,00
320,
002
0,00
13
Texture wavelength [m]
Te
xtu
B r
e. 1
µm
]
E1 middle
E1 right wheel track - E
E1 left wheel track - E
re le
ve
l
Figure A.4: Texture spectra test section E1 (road marking in middle)
0
10
20
30l [d
40
50
60
0,5
0,31
75 0,2
0,12
50,
080,
05
0,03
18 0,02
0,01
250,
008
0,00
5
0,00
320,
002
0,00
13
Texture wavelength [m]
Te
xtu
re le
ve
B r
e. 1
µm
]
E2 middle
E2 right wheel track - E
E2 left wheel track - E
Figure A.5: Texture spectra test section E2 (road marking in middle)
99

0
10
20
30
40
50
60
0,5
0,31
75 0,2
0,12
50,
080,
05
0,03
18 0,02
0,01
250,
008
0,00
5
0,00
320,
002
0,00
13
Texture wavelength [m]
Te
xtu
re le
ve
l [d
B r
e. 1
µm
]L1 middle
L1 right wheel track - E
Figure A.6: Texture spectra test section L1
0
10
20
30
40
50
60
0,5
0,31
75 0,2
0,12
50,
080,
05
0,03
180,
02
0,01
250,
008
0,00
5
0,00
320,
002
0,00
13
L2 middle
L2 right wheel track - E
Te
xtu
re le
ve
l [d
B r
e. 1
µm
]
L2 left wheel track - E
Texture wavelength [m]
igure A.7: Texture spectra test section L2 F
0
10
20
30
40
50
60
0,5
0,31
75 0,2
0,12
50,
080,
05
0,03
18 0,02
0,01
250,
008
0,00
5
0,00
320,
002
0,00
13
Texture wavelength [m]
Te
xtu
re le
vel
[d
B r
e. 1
µm
]
M2 middle
M2 right wheel track - E
M2 left wheel track - E
Figure A.8: Texture spectra test section M2
100

0
10
20
30
40
50
60
0,5
0,31
75 0,2
0,12
50,
080,
05
0,03
18 0,02
0,01
250,
008
0,00
5
0,00
320,
002
0,00
13
Texture wavelength [m]
Te
xtu
re le
ve
l [d
B r
e. 1
µm
]M1 middle
M1 left wheel track - E
Figure A.9: Texture spectra test section M1
0
10
20
30
40
50
60
0,5
0,31
75 0,2
0,12
50,
080,
05
0,03
18 0,02
0,01
250,
008
0,00
5
0,00
320,
002
0,00
13
Texture wavelength [m]
Te
xtu
re le
ve
l [d
B r
e. 1
µm
]
F middle
F left wheel track - E
Figure A.10: Texture spectra test section F
101
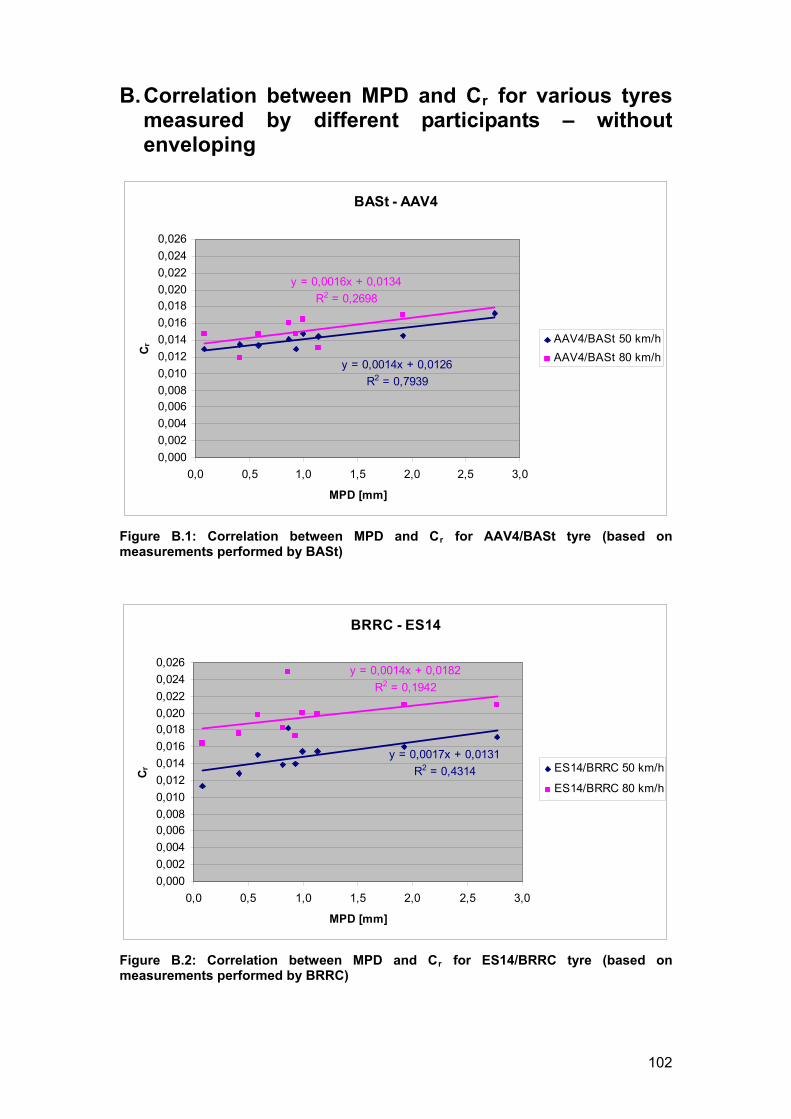
B. Correlation between MPD and Cr for various tyres measured by different participants – without enveloping
BASt - AAV4
y = 0,0014x + 0,0126
R2 = 0,7939
y = 0,0016x + 0,0134
R2 = 0,2698
0,000
0,002
0,004
0,0060,008
0,010
0,012
0,014
0,016
0,0180,020
0,022
0,024
0,026
0,0 0,5 1,0 1,5 2,0 2,5 3,0
MPD [mm]
Cr AAV4/BASt 50 km/h
AAV4/BASt 80 km/h
Figure B.1: Correlation between MPD and Cr for AAV4/BASt tyre (based on measurements performed by BASt)
BRRC - ES14
y = 0,0014x + 0,0182
R2 = 0,1942
y = 0,0017x + 0,0131
R2 = 0,4314
0,000
0,002
0,004
0,0060,008
0,010
0,012
0,014
0,016
0,0180,020
0,022
0,024
0,026
0,0 0,5 1,0 1,5 2,0 2,5 3,0
MPD [mm]
Cr ES14/BRRC 50 km/h
ES14/BRRC 80 km/h
Figure B.2: Correlation between MPD and Cr for ES14/BRRC tyre (based on measurements performed by BRRC)
102

TUG - ES14
0,024
0,026
y = 0,0016x + 0,013
R2 = 0,8786
y = 0,0015x + 0,0126
R2 = 0,9030
0,000
0,002
0,004
0,006
0,008
0,010
0,012
0,014
0,016
0,018
0,020
0,022
0,0 0,5 1,0 1,5 2,0 2,5 3,0
MPD [mm]
Cr ES14/TUG 50 km/h
ES14/TUG 80 km/h
Figure B.3: Correlation between MPD and Cr for ES14/TUG tyre (based on measurements performed by TUG)
BASt - ES16
y = 0,0017x + 0,0095
R2 = 0,8736
y = 0,0010x + 0,0096
R2 = 0,4005
0,000
0,002
0,004
0,006
0,008
0,010
0,0120,014
0,016
0,018
0,020
0,022
0,024
0,026
ES16/BASt 50 km/h
0,0 0,5 1,0 1,5 2,0 2,5 3,0
MPD [mm]
Cr
ES16/BASt 80 km/h
Figure B.4: Correlation between MPD and Cr for ES16/BASt tyre (based on measurements performed by BASt)
103

TUG - ES16
y = 0,0017x + 0,0062
R2 = 0,8751
y = 0,0018x + 0,0068
R2 = 0,8088
0,000
0,002
0,004
0,006
0,008
0,010
0,012
0,014
0,016
0,018
0,020
0,022
0,024
0,026
0,0 0,5 1,0 1,5 2,0 2,5 3,0
MPD [mm]
Cr ES16/TUG 50 kpm/h
ES16/TUG 80 km/h
Figure B.5: Correlation between MPD and Cr for ES16/TUG tyre (based on measurements performed by TUG)
TUG - SRTT
y = 0,0020x + 0,0055
R2 = 0,9145
y = 0,0020x + 0,0058
R2 = 0,9225
0,000
0,002
0,004
0,006
0,008
0,010
0,012
0,014
0,016
0,018
0,020
0,022
0,024
0,026
0,0 0,5 1,0 1,5 2,0 2,5 3,0
MPD [mm]
Cr ES16/SRTT 50 km/h
ES16/SRTT 80 km/h
Figure B.6: Correlation between MPD and Cr for SRTT/TUG tyre (based on measurements performed by TUG)
104

C. Correlation between MPD and Cr for various tyres measured by different participants – with enveloping
BASt - AAV4
y = 0,0020x + 0,0127
R2 = 0,9148
y = 0,0032x + 0,0131
R2 = 0,2857
0,000
0,002
0,004
0,0060,008
0,010
0,012
0,014
0,016
0,0180,020
0,022
0,024
0,026
0,0 0,5 1,0 1,5 2,0 2,5 3,0
MPD [mm]
Cr AAV4/BASt 50 km/h
AAV4/BASt 80 km/h
Figure C.1: Correlation between MPD and Cr for AAV4/BASt tyre (based on measurements performed by BASt) – with enveloping
BRRC - ES14
y = 0,0020x + 0,0136
R2 = 0,3291
y = 0,0015x + 0,0186
R2 = 0,1248
0,000
0,002
0,0040,006
0,008
0,010
0,0120,014
0,016
0,018
0,0200,022
0,024
0,026
0,0 0,5 1,0 1,5 2,0 2,5 3,0
MPD [mm]
Cr
ES14/BRRC 50 km/hES14/BRRC 80 km/h
igure C.2: Correlation between MPD and Cr for ES14/BRRC tyre (based on easurements performed by BRRC) – with enveloping
Fm
105
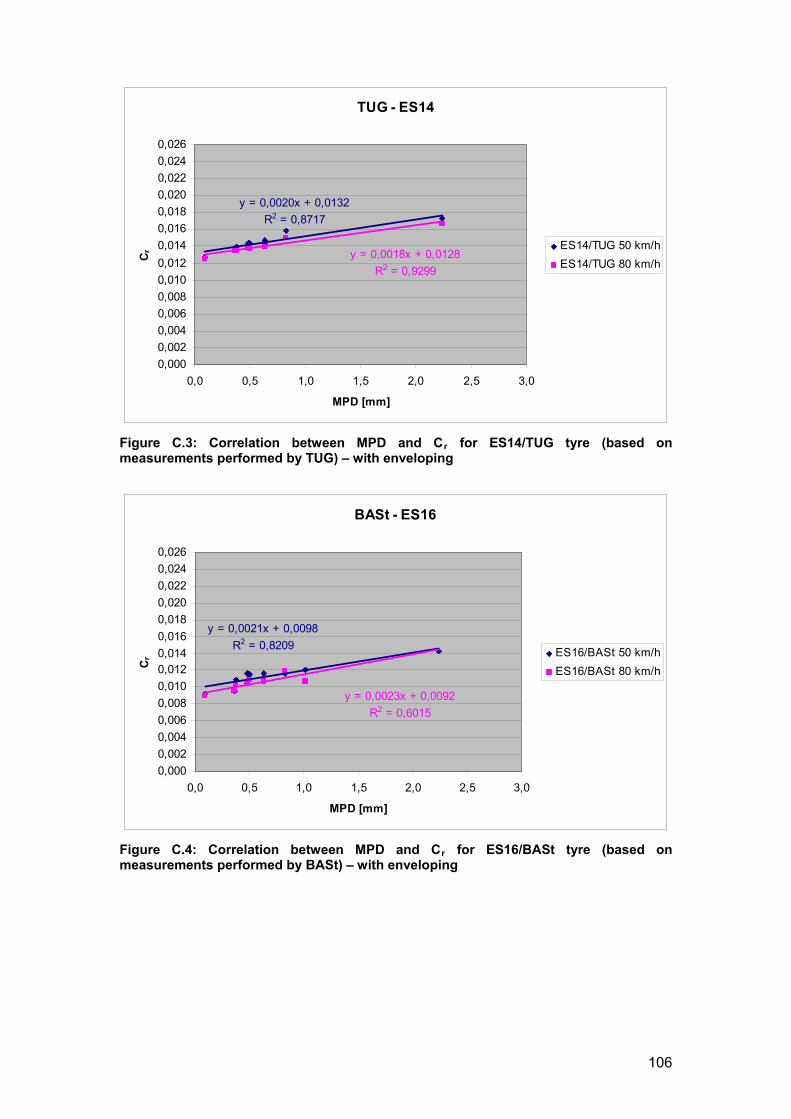
TUG - ES14
0,024
0,026
y = 0,0020x + 0,0132
R2 = 0,8717
y = 0,0018x + 0,0128
R2 = 0,9299
0,000
0,002
0,004
0,006
0,008
0,010
0,012
0,014
0,016
0,018
0,020
0,022
0,0 0,5 1,0 1,5 2,0 2,5 3,0
MPD [mm]
Cr ES14/TUG 50 km/h
ES14/TUG 80 km/h
Figure C.3: Correlation between MPD and Cr for ES14/TUG tyre (based on measurements performed by TUG) – with enveloping
BASt - ES16
y = 0,0021x + 0,0098
R2 = 0,8209
y = 0,0023x + 0,0092
R2 = 0,6015
0,000
0,002
0,004
0,006
0,008
0,010
0,0120,014
0,016
0,018
0,020
0,022
0,024
0,026
ES16/BASt 50 km/h
0,0 0,5 1,0 1,5 2,0 2,5 3,0
MPD [mm]
Cr
ES16/BASt 80 km/h
Figure C.4: Correlation between MPD and Cr for ES16/BASt tyre (based on measurements performed by BASt) – with enveloping
106

TUG - ES16
y = 0,0021x + 0,0064
R2 = 0,9190
y = 0,0022x + 0,0070
R2 = 0,8440
0,000
0,002
0,004
0,006
0,008
0,010
0,012
0,014
0,016
0,018
0,020
0,022
0,024
0,026
0,0 0,5 1,0 1,5 2,0 2,5 3,0
MPD [mm]
Cr ES16/TUG 50 km/h
ES16/TUG 80 km/h
Figure C.5: Correlation between MPD and Cr for ES16/TUG tyre (based on measurements performed by TUG) – with enveloping
TUG - SRTT
y = 0,0025x + 0,0057
R2 = 0,9768
y = 0,0025x + 0,0061
R2 = 0,9658
0,000
0,002
0,004
0,006
0,008
0,010
0,012
0,014
0,016
0,018
0,020
0,022
0,024
0,026
0,0 0,5 1,0 1,5 2,0 2,5 3,0
MPD [mm]
Cr ES16/SRTT 50 km/h
ES16/SRTT 80 km/h
Figure C.6: Correlation between MPD and Cr for SRTT/TUG tyre (based on measurements performed by TUG) – with enveloping
107

D. Correlation between macrotexture and Cr for various tyres measured by different participants – without enveloping
BASt - AAV4
y = 0,00008x + 0,00967
R2 = 0,32524
y = 0,00005x + 0,01195
R2 = 0,08292
0,000
0,002
0,004
0,0060,008
0,010
0,012
0,014
0,016
0,0180,020
0,022
0,024
0,026
30 35 40 45 50 55 60 65
LMa [dB re. 1 µm]
Cr AAV4/BASt 50 km/h
AAV4/BASt 80 km/h
Figure D.1: Correlation between macrotexture and Cr for AAV4/BASt tyre (based on measurements performed by BASt)
BRRC - ES14
y = 0,00019x + 0,00475
R2 = 0,61742
y = 0,00017x + 0,01046
R2 = 0,34666
0,000
0,0020,004
0,0060,008
0,010
0,0120,014
0,016
0,0180,020
0,0220,024
0,026
30 35 40 45 50 55 60 65
LMa [dB re. 1 µm]
Cr
ES14/BRRC 50 km/h
ES14/BRRC 80 km/h
igure D.2: Correlation between macrotexture and Cr for ES14/BRRC tyre (based on easurements performed by BRRC)
Fm
108

TUG - ES14
y = 0,00011x + 0,00844
R2 = 0,54833
y = 0,00010x + 0,00887
R2 = 0,48871
0,000
0,002
0,004
0,006
0,008
0,010
0,012
0,014
0,016
0,018
0,020
0,022
0,024
0,026
ES14/TUG 50 km/h
30 35 40 45 50 55 60 65
LMa [dB re. 1 µm]
Cr
ES14/TUG 80 km/h
Figure D.3: Correlation between macrotexture and Cr for ES14/TUG tyre (based on measurements performed by TUG)
BASt - ES16
y = 0,00013x + 0,00421
R2 = 0,64508
y = 0,00007x + 0,00674
R2 = 0,54240
0,000
0,002
0,004
0,006
0,008
0,010
0,0120,014
0,016
0,018
0,020
0,022
0,024
0,026
30 35 40 45 50 55 60 65
LMa [dB re. 1 µm]
Cr ES16/BASt 50 km/h
ES16/BASt 80 km/h
Figure D.4: Correlation between macrotexture and Cr for ES16/BASt tyre (based on measurements performed by BASt)
109
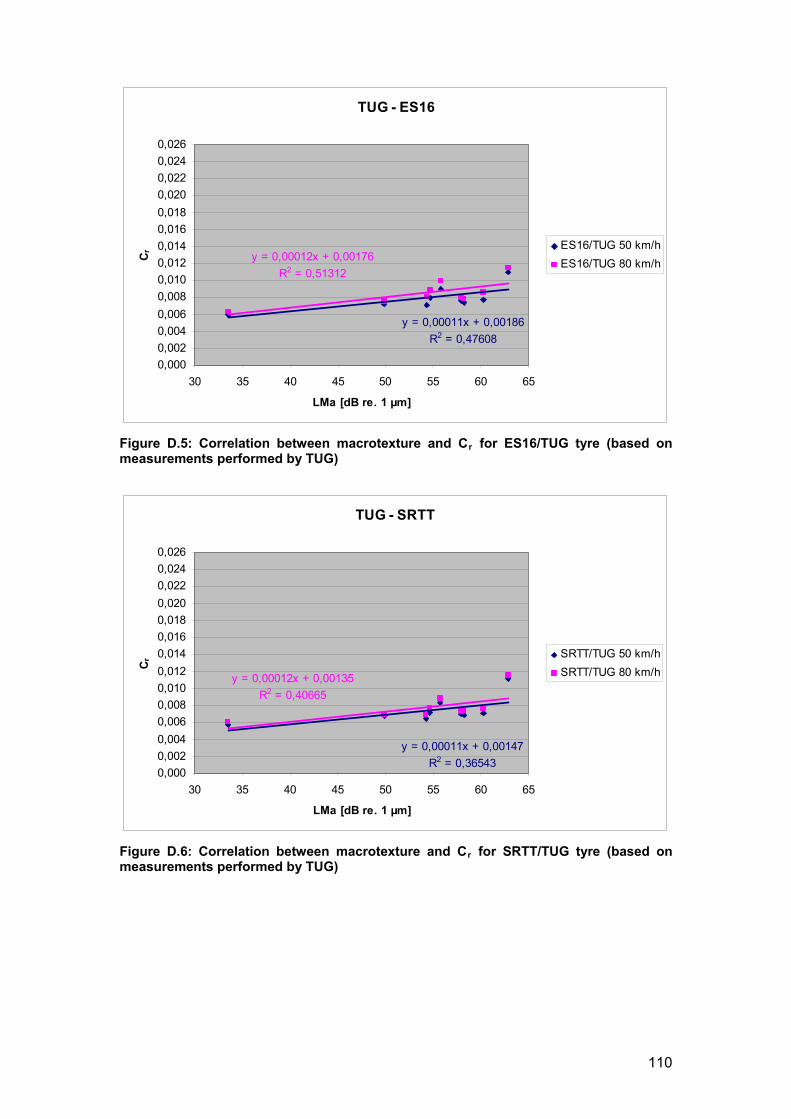
TUG - ES16
y = 0,00011x + 0,00186
R2 = 0,47608
y = 0,00012x + 0,00176
R2 = 0,51312
0,000
0,002
0,004
0,006
0,008
0,010
0,012
0,014
0,016
0,018
0,020
0,022
0,024
0,026
30 35 40 45 50 55 60 65
LMa [dB re. 1 µm]
Cr ES16/TUG 50 km/h
ES16/TUG 80 km/h
Figure D.5: Correlation between macrotexture and Cr for ES16/TUG tyre (based on measurements performed by TUG)
TUG - SRTT
y = 0,00011x + 0,00147
R2 = 0,36543
y = 0,00012x + 0,00135
R2 = 0,40665
0,000
0,002
0,004
0,006
0,008
0,010
0,012
0,014
0,016
0,018
0,020
0,022
0,024
0,026
30 35 40 45 50 55 60 65
LMa [dB re. 1 µm]
Cr SRTT/TUG 50 km/h
SRTT/TUG 80 km/h
Figure D.6: Correlation between macrotexture and Cr for SRTT/TUG tyre (based on measurements performed by TUG)
110
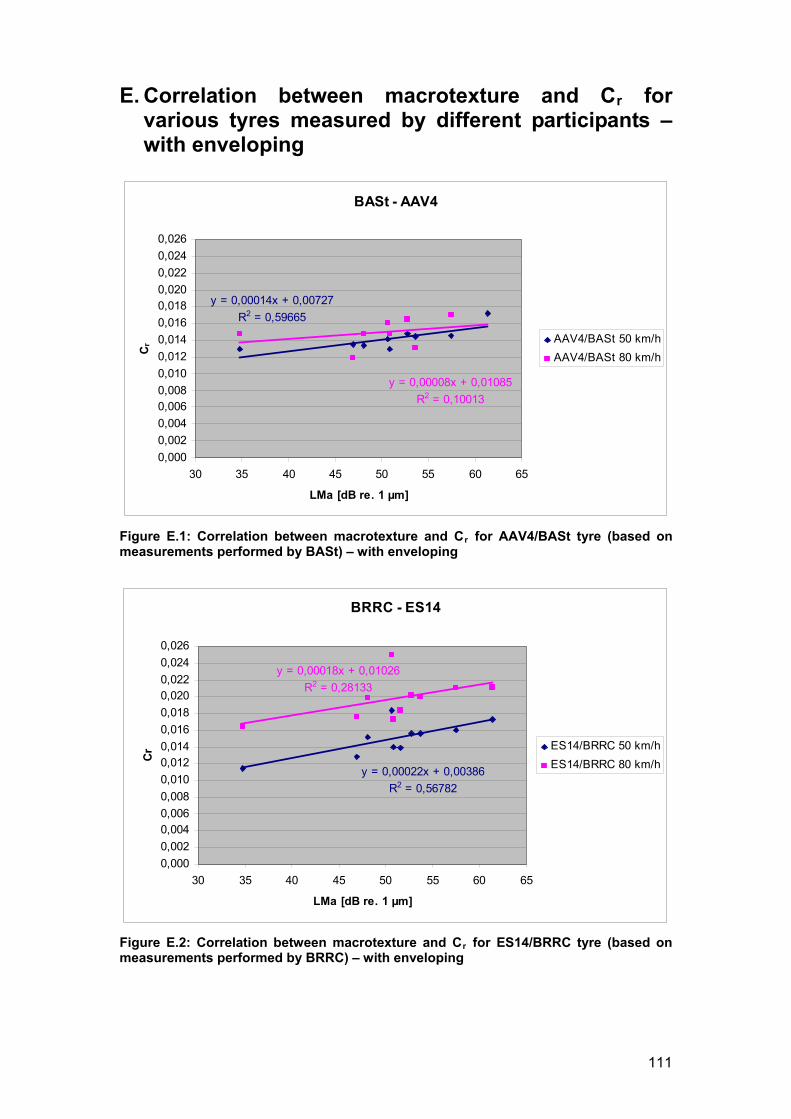
E. Correlation between macrotexture and Cr for various tyres measured by different participants – with enveloping
BASt - AAV4
y = 0,00014x + 0,00727
R2 = 0,59665
y = 0,00008x + 0,01085
R2 = 0,10013
0,000
0,002
0,004
0,0060,008
0,010
0,012
0,014
0,016
0,0180,020
0,022
0,024
0,026
30 35 40 45 50 55 60 65
LMa [dB re. 1 µm]
Cr AAV4/BASt 50 km/h
AAV4/BASt 80 km/h
Figure E.1: Correlation between macrotexture and Cr for AAV4/BASt tyre (based on measurements performed by BASt) – with enveloping
BRRC - ES14
y = 0,00022x + 0,00386
R2 = 0,56782
y = 0,00018x + 0,01026
R2 = 0,28133
0,000
0,002
0,0040,006
0,008
0,010
0,0120,014
0,016
0,018
0,0200,022
0,024
0,026
30 35 40 45 50 55 60 65
LMa [dB re. 1 µm]
Cr ES14/BRRC 50 km/h
ES14/BRRC 80 km/h
igure E.2: Correlation between macrotexture and Cr for ES14/BRRC tyre (based on easurements performed by BRRC) – with enveloping
Fm
111

TUG - ES14
0,024
0,026
y = 0,00017x + 0,00626
R2 = 0,79744
y = 0,00015x + 0,00675
R2 = 0,76780
0,000
0,002
0,004
0,006
0,008
0,010
0,012
0,014
0,016
0,018
0,020
0,022
30 35 40 45 50 55 60 65
LMa [dB re. 1 µm]
Cr ES14/TUG 50 km/h
ES14/TUG 80 km/h
Figure E.3: Correlation between macrotexture and Cr for ES14/TUG tyre (based on measurements performed by TUG) – with enveloping
BASt - ES16
y = 0,00018x + 0,00234
R2 = 0,80333
y = 0,00010x + 0,00549
R2 = 0,61067
0,000
0,002
0,004
0,006
0,008
0,010
0,0120,014
0,016
0,018
0,020
0,022
0,024
0,026
ES16/BASt 50 km/h
30 35 40 45 50 55 60 65
LMa [dB re. 1 µm]
Cr
ES16/BASt 80 km/h
Figure E.4: Correlation between macrotexture and Cr for ES16/BASt tyre (based on measurements performed by BASt) – with enveloping
112
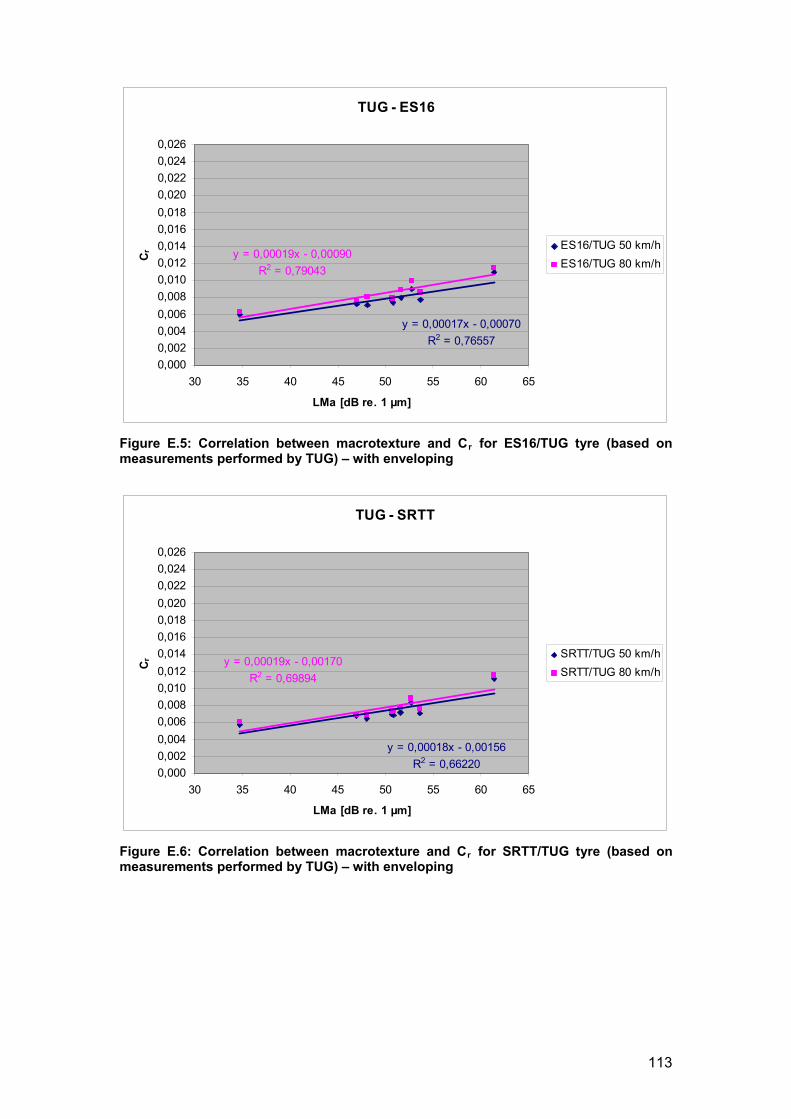
TUG - ES16
y = 0,00017x - 0,00070
R2 = 0,76557
y = 0,00019x - 0,00090
R2 = 0,79043
0,000
0,002
0,004
0,006
0,008
0,010
0,012
0,014
0,016
0,018
0,020
0,022
0,024
0,026
30 35 40 45 50 55 60 65
LMa [dB re. 1 µm]
Cr ES16/TUG 50 km/h
ES16/TUG 80 km/h
Figure E.5: Correlation between macrotexture and Cr for ES16/TUG tyre (based on measurements performed by TUG) – with enveloping
TUG - SRTT
y = 0,00018x - 0,00156
R2 = 0,66220
y = 0,00019x - 0,00170
R2 = 0,69894
0,000
0,002
0,004
0,006
0,008
0,010
0,012
0,014
0,016
0,018
0,020
0,022
0,024
0,026
30 35 40 45 50 55 60 65
LMa [dB re. 1 µm]
Cr SRTT/TUG 50 km/h
SRTT/TUG 80 km/h
Figure E.6: Correlation between macrotexture and Cr for SRTT/TUG tyre (based on measurements performed by TUG) – with enveloping
113

F. Correlation between megatexture and Cr for various tyres measured by different participants – without enveloping
BASt - AAV4
y = 0,00014x + 0,00709
R2 = 0,52996
y = 0,00011x + 0,00940
R2 = 0,16552
0,000
0,002
0,004
0,0060,008
0,010
0,012
0,014
0,016
0,0180,020
0,022
0,024
0,026
30 35 40 45 50 55 60 65
LMe [dB re. 1 µm]
Cr AAV4/BASt 50 km/h
AAV4/BASt 80 km/h
Figure F.1: Correlation between megatexture and Cr for AAV4/BASt tyre (based on measurements performed by BASt)
BRRC - ES14
y = 0,00021x + 0,00906
R2 = 0,30323
y = 0,00024x + 0,00294
R2 = 0,56443
0,000
0,002
0,0040,006
0,008
0,010
0,0120,014
0,016
0,018
0,0200,022
0,024
0,026
30 35 40 45 50 55 60 65
LMe [dB re. 1 µm]
Cr ES14/BRRC 50 km/h
ES14/BRRC 80 km/h
igure F.2: Correlation between megatexture and Cr for ES14/BRRC tyre (based on
measurements performed by BRRC)
F
114
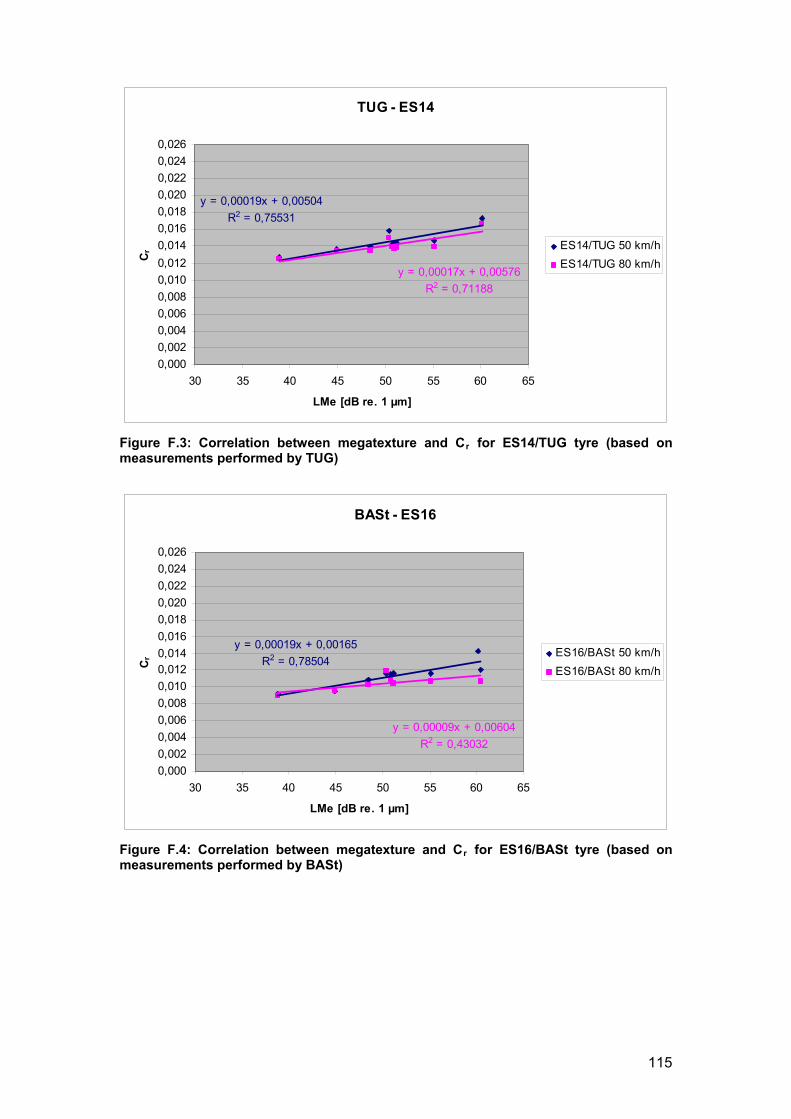
TUG - ES14
0,024
0,026
y = 0,00019x + 0,00504
R2 = 0,75531
y = 0,00017x + 0,00576
R2 = 0,71188
0,000
0,002
0,004
0,006
0,008
0,010
0,012
0,014
0,016
0,018
0,020
0,022
30 35 40 45 50 55 60 65
LMe [dB re. 1 µm]
Cr ES14/TUG 50 km/h
ES14/TUG 80 km/h
Figure F.3: Correlation between megatexture and Cr for ES14/TUG tyre (based on measurements performed by TUG)
BASt - ES16
y = 0,00019x + 0,00165
R2 = 0,78504
y = 0,00009x + 0,00604
R2 = 0,43032
0,000
0,002
0,004
0,006
0,008
0,010
0,0120,014
0,016
0,018
0,020
0,022
0,024
0,026
ES16/BASt 50 km/h
30 35 40 45 50 55 60 65
LMe [dB re. 1 µm]
Cr
ES16/BASt 80 km/h
Figure F.4: Correlation between megatexture and Cr for ES16/BASt tyre (based on measurements performed by BASt)
115

TUG - ES16
y = 0,00019x - 0,00171
R2 = 0,68789
y = 0,00021x - 0,00205
R2 = 0,71559
0,000
0,002
0,004
0,006
0,008
0,010
0,012
0,014
0,016
0,018
0,020
0,022
0,024
0,026
30 35 40 45 50 55 60 65
LMe [dB re. 1 µm]
Cr ES16/TUG 50 km/h
ES16/TUG 80 km/h
Figure F.5: Correlation between megatexture and Cr for ES16/TUG tyre (based on measurements performed by TUG)
TUG - SRTT
y = 0,00020x - 0,00282
R2 = 0,62052
y = 0,00022x - 0,00313
R2 = 0,66486
0,000
0,002
0,004
0,006
0,008
0,010
0,012
0,014
0,016
0,018
0,020
0,022
0,024
0,026
30 35 40 45 50 55 60 65
LMe [dB re. 1 µm]
Cr SRTT/TUG 50 km/h
SRTT/TUG 80 km/h
Figure F.6: Correlation between megatexture and Cr for SRTT/TUG tyre (based on measurements performed by TUG)
116

G. Correlation between megatexture and Cr for various tyres measured by different participants – with enveloping
BASt - AAV4
y = 0,00017x + 0,00564
R2 = 0,80055
y = 0,00016x + 0,00745
R2 = 0,22039
0,000
0,002
0,004
0,0060,008
0,010
0,012
0,014
0,016
0,0180,020
0,022
0,024
0,026
30 35 40 45 50 55 60 65
LMe [dB re. 1 µm]
Cr AAV4/BASt 50 km/h
AAV4/BASt 80 km/h
Figure G.1: Correlation between megatexture and Cr for AAV4/BASt tyre (based on measurements performed by BASt) – with enveloping
BRRC - ES14
y = 0,00017x + 0,01119
R2 = 0,20135
y = 0,00021x + 0,00454
R2 = 0,44124
0,000
0,002
0,0040,006
0,008
0,011
0,0130,015
0,017
0,019
0,0210,023
0,025
0,027
30 35 40 45 50 55 60 65
LMe [dB re. 1 µm]
Cr ES14/BRRC 50 km/h
ES14/BRRC 80 km/h
igure G.2: Correlation between megatexture and Cr for ES14/BRRC tyre (based on
measurements performed by BRRC) – with enveloping
F
117
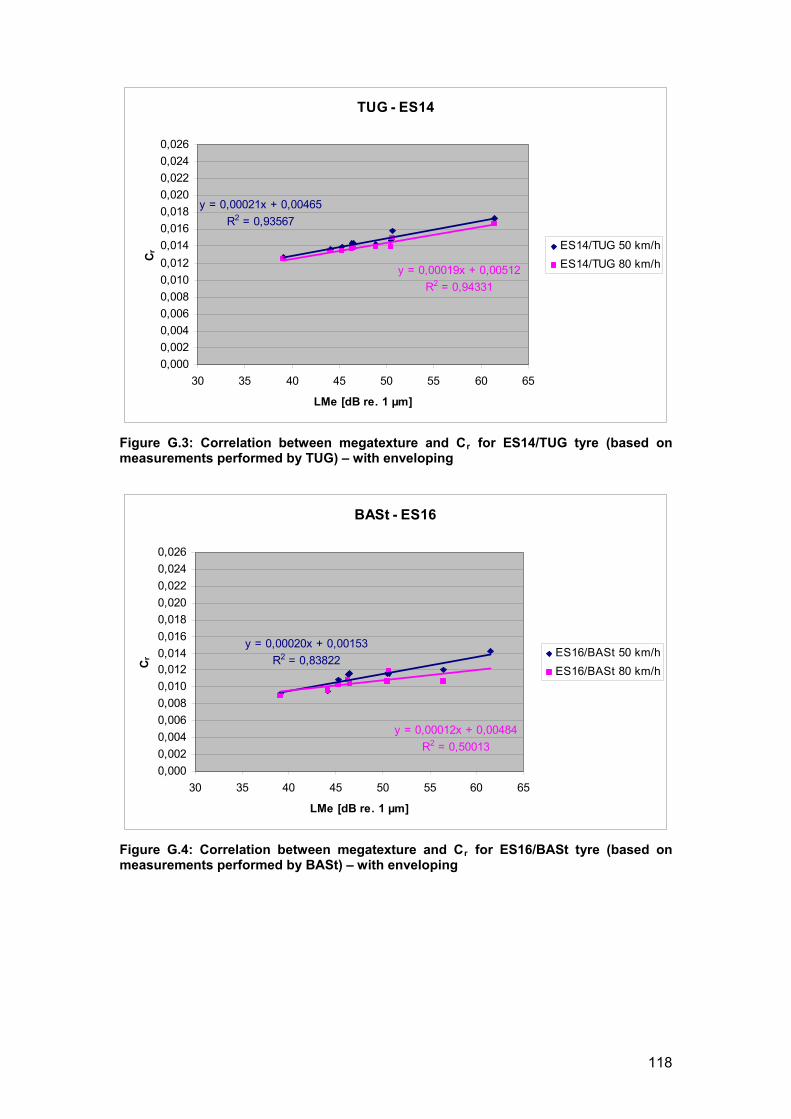
TUG - ES14
0,024
0,026
y = 0,00021x + 0,00465
R2 = 0,93567
y = 0,00019x + 0,00512
R2 = 0,94331
0,000
0,002
0,004
0,006
0,008
0,010
0,012
0,014
0,016
0,018
0,020
0,022
30 35 40 45 50 55 60 65
LMe [dB re. 1 µm]
Cr ES14/TUG 50 km/h
ES14/TUG 80 km/h
Figure G.3: Correlation between megatexture and Cr for ES14/TUG tyre (based on measurements performed by TUG) – with enveloping
BASt - ES16
y = 0,00020x + 0,00153
R2 = 0,83822
y = 0,00012x + 0,00484
R2 = 0,50013
0,000
0,002
0,004
0,006
0,008
0,010
0,0120,014
0,016
0,018
0,020
0,022
0,024
0,026
ES16/BASt 50 km/h
30 35 40 45 50 55 60 65
LMe [dB re. 1 µm]
Cr
ES16/BASt 80 km/h
Figure G.4: Correlation between megatexture and Cr for ES16/BASt tyre (based on measurements performed by BASt) – with enveloping
118

TUG - ES16
y = 0,00022x - 0,00259
R2 = 0,93666
y = 0,00023x - 0,00277
R2 = 0,93367
0,000
0,002
0,004
0,006
0,008
0,010
0,012
0,014
0,016
0,018
0,020
0,022
0,024
0,026
30 35 40 45 50 55 60 65
LMe [dB re. 1 µm]
Cr ES16/TUG 50 km/h
ES16/TUG 80 km/h
Figure G.5: Correlation between megatexture and Cr for ES16/TUG tyre (based on measurements performed by TUG) – with enveloping
TUG - SRTT
y = 0,00024x - 0,00419
R2 = 0,91202
y = 0,00025x - 0,00430
R2 = 0,93240
0,000
0,002
0,004
0,006
0,008
0,010
0,012
0,014
0,016
0,018
0,020
0,022
0,024
0,026
30 35 40 45 50 55 60 65
LMe [dB re. 1 µm]
Cr SRTT/TUG 50 km/h
SRTT/TUG 80 km/h
Figure G.6: Correlation between megatexture and Cr for SRTT/TUG tyre (based on
easurements performed by TUG) – with enveloping
m
119

H. Correlation between IRI and Cr for various tyres and different participants
BASt - AAV4
y = 0,00112x + 0,01220
R2 = 0,45854
y = 0,00163x + 0,01256
R2 = 0,22941
0,000
0,002
0,004
0,0060,008
0,010
0,012
0,014
0,016
0,0180,020
0,022
0,024
0,026
AAV4/BASt 50 km/h
Cr
AAV4/BASt 80 km/h
0,00 0,50 1,00 1,50 2,00 2,50 3,00
IRI
H.1: Correlation between IRI and Cr for AAV4/BASt tyre (based on measurements performed by BASt)
Figure
TUG - ES14
y = 0,00005x + 0,01446
R2 = 0,00075
y = 0,00004x + 0,01390
R2 = 0,00045
0,000
0,002
0,004
0,006
0,008
0,010
0,012
0,014
0,016
0,018
0,020
0,022
0,024
0,026
0,00 0,50 1,00 1,50 2,00 2,50 3,00
ES14/TUG 50 km/h
Cr
ES14/TUG 80 km/h
IRI
igure H.2: Correlation between IRI and Cr for ES14/TUG tyre (based on measurements erformed by TUG)
Fp
120

BASt - ES16
y = 0,00039x + 0,01077
R2 = 0,11828
y = -0,00035x + 0,01132
R2 = 0,06096
0,000
0,002
0,004
0,006
0,008
0,010
0,0120,014
0,016
0,018
0,020
0,022
0,024
0,026
0,00 0,50 1,00 1,50 2,00 2,50 3,00
IRI
Cr ES16/BASt 50 km/h
ES16/BASt 80 km/h
Figure H.3: Correlation between IRI and Cr for ES16/BASt tyre (based on measurements performed by BASt)
TUG - ES16
y = 0,00008x + 0,00763
R2 = 0,00151
y = -0,00026x + 0,00883
R2 = 0,00955
0,000
0,002
0,004
0,006
0,008
0,010
0,012
0,014
0,016
0,018
0,020
0,022
0,024
0,026
0 1 1 2 2 3 3
IRI
Cr ES16/TUG 50 km/h
ES16/TUG 80 km/h
Figure H.4: Correlation between IRI and Cr for ES16/TUG tyre (based on measurements performed by TUG)
121

TUG - SRTT
y = 0,00009x + 0,00697
R2 = 0,00210
y = -0,00007x + 0,00769
R2 = 0,00126
0,000
0,002
0,004
0,006
0,008
0,010
0,012
0,014
0,016
0,018
0,020
0,022
0,024
0,026
0,00 0,50 1,00 1,50 2,00 2,50 3,00
IRI
Cr SRTT/TUG 50 km/h
SRTT/TUG 80 km/h
Figure H.5: Correlation between IRI and Cr for TUG/SRTT tyre (based on mperformed by TUG)
easurements
122