minutes of the forty eighth meeting of forum of …
TRANSCRIPT
1
MINUTES OF THE FORTY EIGHTH MEETING
OF
FORUM OF REGULATORS (FOR) HELD AT NEW DELHI
Venue : “TAMARIND” HALL, Convention Centre
India Habitat Centre, Lodhi Road
New Delhi- 110 003.
Dates : 10th
- 11th
June, 2015
List of Participants : At Annexure-I (enclosed).
The meeting was chaired by Shri Gireesh B. Pradhan, Chairperson,
Central Electricity Regulatory Commission (CERC) and Forum of Regulators
(FOR). He extended a warm welcome to all members of the Forum.
The FOR thereafter took agenda items for consideration.
Day – 1: 10th
June, 2015
Business Session – I
Agenda Item No. 1 : Confirmation of the Minutes of the 47th
Meeting of
"FOR" held on 6th
April, 2015 at CSOI, New Delhi.
The Forum noted and endorsed the minutes of the 47th Meeting of "FOR"
held at Civil Services Officers’ Institute (CSOI), New Delhi on 6th
April, 2015.

2
Agenda Item No. 2 : Consideration and approval of Balance Sheet and
Audited Accounts of "FOR" for FY 2014-15.
Smt. Shubha Sarma, Secretary, CERC/FOR explained the salient features
of the Balance Sheet of FOR for the FY 2014-15. The balance sheet and the
audited accounts were considered and approved.
Agenda Item No. 3 : Reference from MoP on “Reviewing and
determination of energy charges for supply of
electricity by a generating company to a
distribution licensee under already concluded
Power Purchase Agreements (PPAs) and where the
coal is being sourced from coal mines auctioned or
allotted under Coal Mines (Special Provisions)
Second Ordinance, 2014 and Rules framed
thereunder".
The Forum considered the reference received from Ministry of Power,
GOI on Reviewing and Determination of energy charges for supply of
electricity by a generating company to a distribution licensee under already
concluded Power Purchase Agreements (PPAs) and where the coal is being
sourced from coal mines auctioned or allotted under Coal Mines (Special
Provisions) Second Ordinance, 2014 and Rules framed thereunder". The same
was noted by the Forum for further necessary action by the Appropriate ERCs.
Agenda Item No. 4 : Presentation and Discussion on “Electricity Supply
Monitoring Initiative”.
A presentation (enclosed as Annexure - II) on “Electricity Supply
Monitoring Initiative (ESMI)” was made by Shri Shantanu Dixit, on the
Electricity Supply Monitoring Initiative taken up by Prayas Energy Group, a
Pune based NGO.

3
During the presentation, it was conveyed that low voltage, frequent
interruptions and load shedding is a concern for electricity consumers in India.
Moreover reliable data about supply quality is often missing, which hampers
consumers’ ability to hold distribution companies accountable. In this
backdrop, Electricity Supply Monitoring Initiative has been undertaken, which
accesses real-time, reliable data that fills this crucial knowledge gap in
empowering consumers. ESMI can be utilized to assess hours of power supply
as well as perform comparative analysis of supply quality across different
locations. At present, ESMI has been launched at 60 locations across 8 States
including 5 mega cities, with a few hundred more locations to be covered in the
coming months.
It was also stated that ESMI employs state-of-art internet of things (IoT)
technology and a plug-in device that combines a voltage recorder and a
communication modem. The devise can be installed at any location in an
ordinary power supply socket. The ESM records voltage every minute at its
location and sends the data to a central server using a standard mobile data
network. This initiative is aimed at providing Regulatory Commissions and
other stakeholders with evidence-based feedback to improve effectiveness of
various programs. The initiative also provides for sharing the overall supply
quality information through its website.
The Forum appreciated the initiative. Some of the ERCs volunteered to
use the system for monitoring standards of performance of utilities.
Agenda Item No. 5 : Presentation and Discussion on the Study
commissioned by "FOR" on “Roll-out Plan for
Introduction of Competition in Retail Sale of
Electricity”.

4
DR. Sushanta K. Chatterjee, Joint Chief (RA), CERC, explained the
context of the study and highlighted that in the light of the proposal for a
framework bringing in competition in retail electricity supply in India through
separation of carriage and content in electricity distribution as part of the
Electricity (Amendment) Bill, 2014, MoP, requested the FOR to evolve model
transfer scheme. Accordingly, "FOR" has commissioned a study to recommend
on "Roll out Plan for Introduction of Competition in Retail Sale of Electricity
(Separation of Carriage & Content)”.
After following due process, the "FOR" Secretariat engaged M/s.
Pricewaterhouse Coopers (PwC) as Consultant to undertake this study.
Simultaneously, the "FOR" Secretariat also constituted a Core Group consisting
of experts from academia, industry, NGOs working in the area of energy /
electricity, Government / Private utilities, Regulatory officers etc. to examine
the options suggested by the Consultant, hold deliberations and provide their
expert advice / opinion to suggest various options to roll out separation of
carriage and content. A presentation (enclosed as Annexure - III) based on the
draft report "Roll out Plan for Introduction of Competition in Retail Sale of
Electricity” was made by the Consultant on the findings of the study
undertaken.
The presentation majorly included the objectives for introducing
competition in retail supply of electricity, different stages for introducing retail
supply competition and alternative roll-out plans.
Stages:-
o Stage-1 – “Functional Separation of Distribution
Utilities” : It was proposed that during this stage (with a
time-line of 1-2 years), the current discoms would be
segregated into distribution and retail supply companies
clearly defining their roles and responsibilities while

5
equipping them with sufficient financial and human
resources to take on their roles. Various activities under this
stage inter alia include defining functional entities, their
roles and responsibilities, allocation of financial losses,
transfer of existing PPAs, consumer interface, CGRF
mechanism, standards of performance, universal service
obligation, tariff determination mechanism, balance sheet
segregation, human resource planning and other appropriate
technical studies etc.
o Stage-2 – “Preparation for Competition” : It was
proposed that during this stage (with a time-line of 2-3 years,
after completion of stage-1) steps would be taken to make
the market conducive for retail supply competition, while
removing the entry barriers for new retail supply companies,
thereby creating a level playing field for all. Various
activities under this stage inter alia include allocation of
technical and commercial losses, reduction of cross-
subsidies, up-gradation of metering, consumer database etc.
o Stage-3 – “Onset of Competition” : It was proposed that
during this stage (this will be after completion of stage-2,
and an ongoing activity till the time all categories are open
for competition) new retail supply companies would be
given licenses to facilitate the retail consumer with choice.
Various activities under this stage inter alia include
allocation of existing PPAs, consumer switching mechanism,
procurement of new PPAs, balancing and settlement, tariff
determination, provider of last resort, extension of universal
service obligation etc.
Variants of roll-out plan were proposed based on loss reduction and
power procurement as drivers of efficiency and competition. In each of the
approaches, pros and cons in respect of various critical issues were detailed and
recommendations made. The critical issues inter alia include defining
distribution functions (i.e., network operations, planning operations, system
operations, market operations etc.) cross-subsidy (through universal charge
(UC) fund or direct Government subsidy), loss allocation (technical and
commercial losses between the distribution and supply companies), cherry-
6
picking, phasing of competition (top-down approach), universal service
obligation, allocation of regulatory assets and losses, allocation of PPAs,
metering, balancing and settlement, provider of last resort, consumer interface,
consumer switching between the supply companies, standards of performance,
determination of tariff, consumer database, etc.
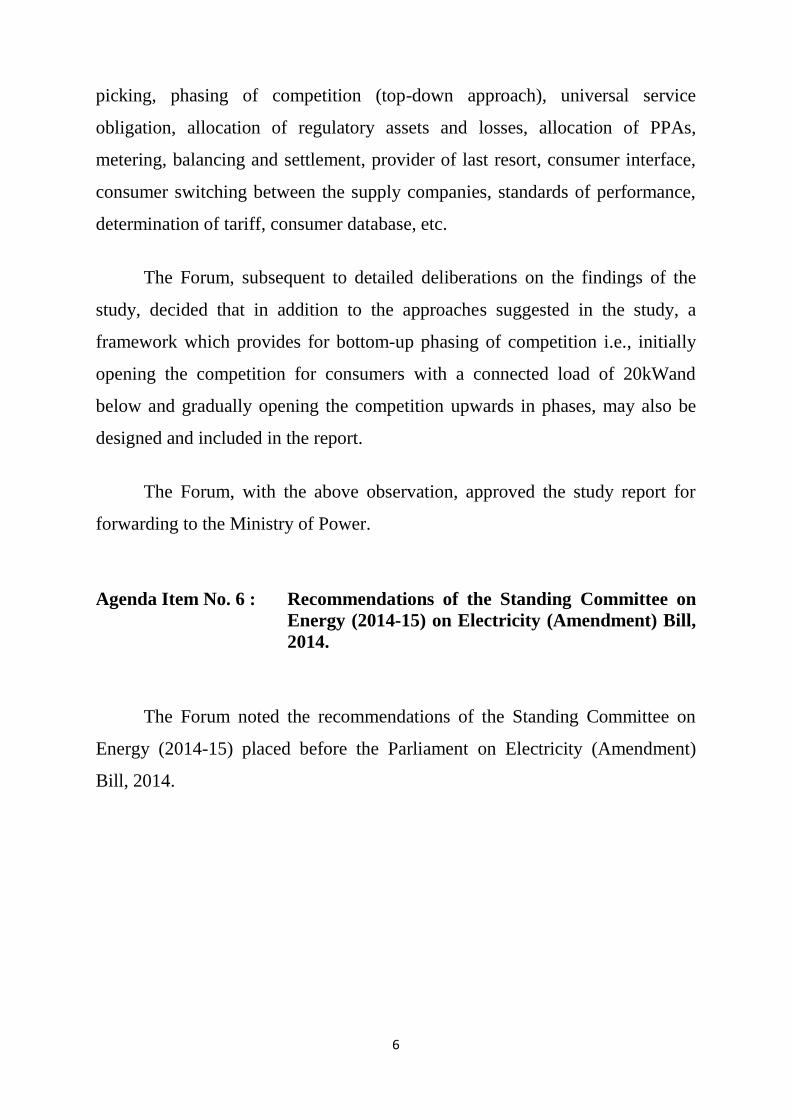
The Forum, subsequent to detailed deliberations on the findings of the
study, decided that in addition to the approaches suggested in the study, a
framework which provides for bottom-up phasing of competition i.e., initially
opening the competition for consumers with a connected load of 20kWand
below and gradually opening the competition upwards in phases, may also be
designed and included in the report.
The Forum, with the above observation, approved the study report for
forwarding to the Ministry of Power.
Agenda Item No. 6 : Recommendations of the Standing Committee on
Energy (2014-15) on Electricity (Amendment) Bill,
2014.
The Forum noted the recommendations of the Standing Committee on
Energy (2014-15) placed before the Parliament on Electricity (Amendment)
Bill, 2014.
7
Day – 2 : 11th
June, 2015
Business Session – I
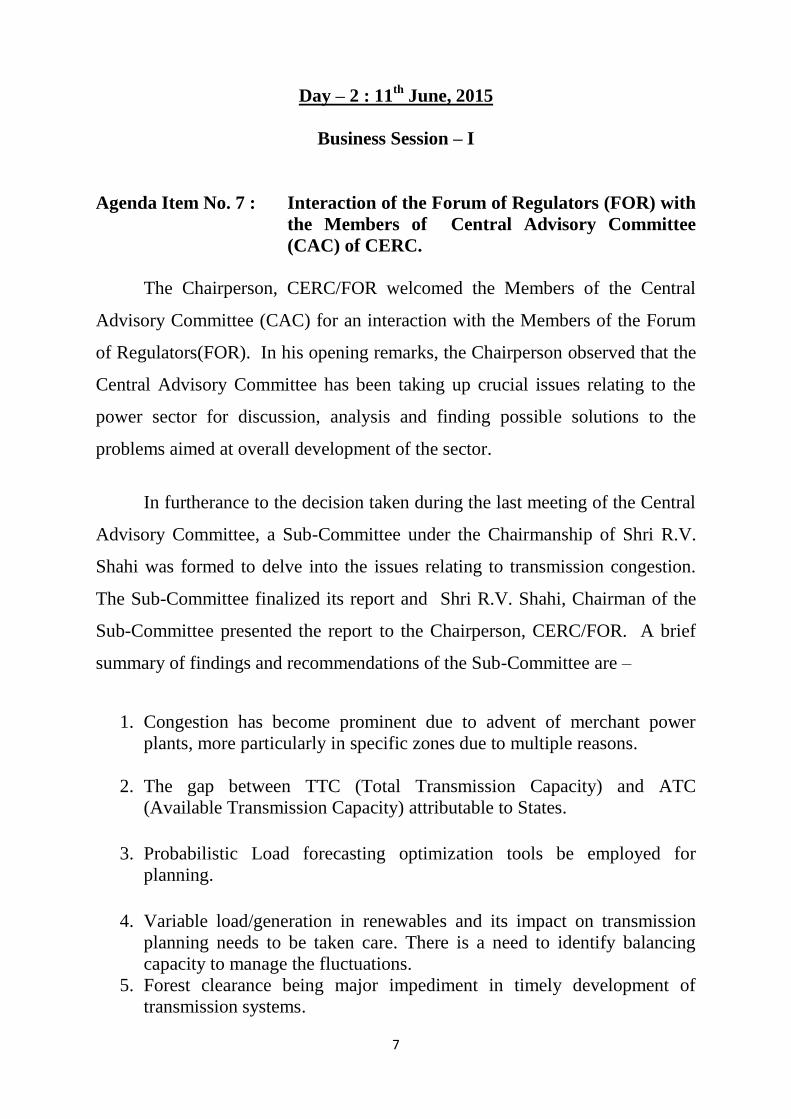
Agenda Item No. 7 : Interaction of the Forum of Regulators (FOR) with
the Members of Central Advisory Committee
(CAC) of CERC.
The Chairperson, CERC/FOR welcomed the Members of the Central
Advisory Committee (CAC) for an interaction with the Members of the Forum
of Regulators(FOR). In his opening remarks, the Chairperson observed that the
Central Advisory Committee has been taking up crucial issues relating to the
power sector for discussion, analysis and finding possible solutions to the
problems aimed at overall development of the sector.
In furtherance to the decision taken during the last meeting of the Central
Advisory Committee, a Sub-Committee under the Chairmanship of Shri R.V.
Shahi was formed to delve into the issues relating to transmission congestion.
The Sub-Committee finalized its report and Shri R.V. Shahi, Chairman of the
Sub-Committee presented the report to the Chairperson, CERC/FOR. A brief
summary of findings and recommendations of the Sub-Committee are –
1. Congestion has become prominent due to advent of merchant power
plants, more particularly in specific zones due to multiple reasons.
2. The gap between TTC (Total Transmission Capacity) and ATC
(Available Transmission Capacity) attributable to States.
3. Probabilistic Load forecasting optimization tools be employed for
planning.
4. Variable load/generation in renewables and its impact on transmission
planning needs to be taken care. There is a need to identify balancing
capacity to manage the fluctuations.
5. Forest clearance being major impediment in timely development of
transmission systems.
8
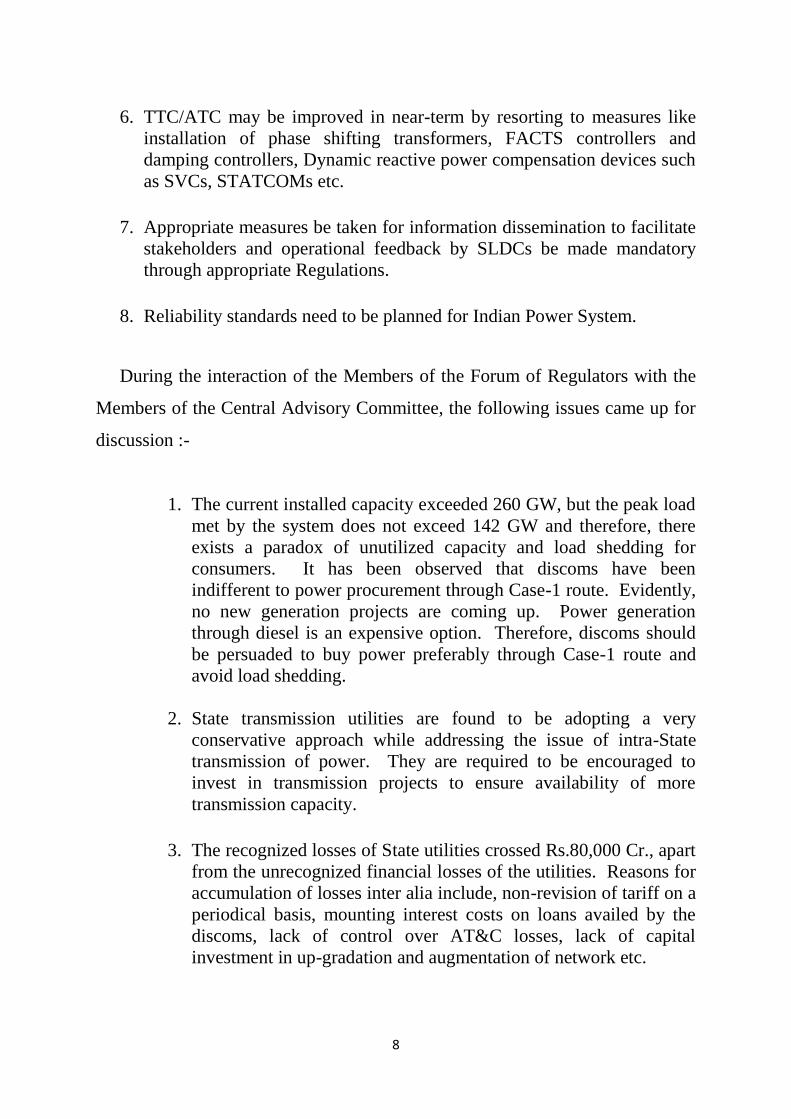
6. TTC/ATC may be improved in near-term by resorting to measures like
installation of phase shifting transformers, FACTS controllers and
damping controllers, Dynamic reactive power compensation devices such
as SVCs, STATCOMs etc.
7. Appropriate measures be taken for information dissemination to facilitate
stakeholders and operational feedback by SLDCs be made mandatory
through appropriate Regulations.
8. Reliability standards need to be planned for Indian Power System.
During the interaction of the Members of the Forum of Regulators with the
Members of the Central Advisory Committee, the following issues came up for
discussion :-
1. The current installed capacity exceeded 260 GW, but the peak load
met by the system does not exceed 142 GW and therefore, there
exists a paradox of unutilized capacity and load shedding for
consumers. It has been observed that discoms have been
indifferent to power procurement through Case-1 route. Evidently,
no new generation projects are coming up. Power generation
through diesel is an expensive option. Therefore, discoms should
be persuaded to buy power preferably through Case-1 route and
avoid load shedding.
2. State transmission utilities are found to be adopting a very
conservative approach while addressing the issue of intra-State
transmission of power. They are required to be encouraged to
invest in transmission projects to ensure availability of more
transmission capacity.
3. The recognized losses of State utilities crossed Rs.80,000 Cr., apart
from the unrecognized financial losses of the utilities. Reasons for
accumulation of losses inter alia include, non-revision of tariff on a
periodical basis, mounting interest costs on loans availed by the
discoms, lack of control over AT&C losses, lack of capital
investment in up-gradation and augmentation of network etc.
9
4. Valuable suggestions received from stakeholders are often rejected
by the ERCs citing mere technical reasons, although such
suggestions require the attention of the ERCs on merit basis.
5. Timely regulatory interventions will definitely help in mitigating
the problems.
6. Large number of petitions are pending with ERCs and templates
could be prepared to reduce the pendency.
7. Discoms should resort to using technology extensively to achieve
success in bringing down the losses. If recovery of CoS is not
possible for the entire discom areas, at least measures should be
taken to initiate recovery of CoS initially in cities / urban areas.
The above realities were noted. However, the following observations
were made by the regulators :-
1. Financial health of discoms does remain a concern.
Fundamentally, structural changes in the basic framework are
required to be taken up for addressing this problem.
2. For the past four years, all the ERCs have been issuing tariff
orders / true up orders ( including suo-motu orders) annually .
3. Number of petitions received in the Commissions has increased
exponentially (viz. CERC alone received 652 petitions in 2014-15
in comparison to 196 in 2008-09). The enormity and complexity
of the petitions cannot be undermined. Besides, simple petitions
like determination of provisional tariff are also leading to lengthy
hearings and substantial efforts of the Commission go into
disposing of the petitions.
4. As regards AT&C losses, the utilities are generally directed to
achieve specific targets and trajectory. Such losses owing to non-
adherence to the directions have to be borne by the utilities.
5. If tariffs are to be determined truly reflecting the cost of supply,
tariff for domestic consumers will be higher than commercial tariff
due to difference of losses in transmission. Therefore, regulators
take a cautious approach while designing the tariff.

10
6. In most of the States, agricultural consumers are not metered and
are highly subsidized. Metering of this segment of consumers
would result in (a) correct measurement of loss levels, (b) better
power procurement planning and (c) accurate estimation of subsidy
required for the category. All this can be achieved if the
segregation of agriculture feeders is carried out. However, such
segregation has been carried out in a few States and cost involved
for such segregation is high.
7. The Financial viability of distribution business is also affected due
to high cost of power purchase. Increasing costs of fuel and other
costs have been resulting in higher generation costs and it is
required to be debated as to how the generation costs could be
brought down.
8. It was also suggested that the possibility of allocation of cheapest
power to the low paying capacity consumer categories may be
debated extensively.
Business Session – II
Agenda Item No. 8 : Presentation and Discussion on “Model
Regulations on Smart Grid”.
The Forum considered the “Draft Model Regulations on Smart Grid”
placed before it during the 47th Meeting held on 6.4.2015 at New Delhi and
constituted a Working Group which could study the proposed draft regulations
in detail and submit its recommendations to the Forum for final decision.
In furtherance to the above decision, a Working Group was constituted by
the Chairperson, CERC/FOR. The Working Group met on 24.4.2015 at New
Delhi and on 22.5.2015 at Jaipur and discussed the draft model regulations
threadbare. Based on the recommendations of the Working Group, the draft
model regulations were revised (enclosed as Annexure - IV) and a presentation
11
on the revised draft regulations (enclosed as Annexure - V) was made by the
"FOR" Secretariat.
During the presentation, the issues relating to objective and scope of
model regulations, constitution of Smart Grid Cell, its role and responsibilities,
life cycle of smart grid plan / programme / projects and other miscellaneous
provisions of the model regulations, were discussed.
During the course of discussion, the Forum observed that the terms
“Smart Meter”, “Wide Area Measurement Systems (WAMS)” should be
defined appropriately.
After discussion, the Forum approved the draft model smart grid
regulations for dissemination amongst the SERCs / JERCs.
Agenda Item No. 9 : Reference from DERC on “Rise in electricity tariff
in Delhi – Response of DERC to the clarifications
sought by Government of NCT of Delhi”.
The Forum noted the matter related to the clarifications sought by
Government of NCT of Delhi (GNCTD) from DERC on “Rise in electricity
tariff in Delhi” and the reply of DERC to GNCTD.
Agenda Item No. 10 : Reference of Deviation Settlement Mechanism / UI
Charge for tariff purposes.
The Forum considered the matter related to using the Deviation
Settlement Mechanism Charge / UI Charge as a reference for tariff purposes.
The Forum, observed that CERC vide its CERC (Deviation Settlement
Mechanism and related matters) Regulations, 2014 repealed the CERC UI
Regulations 2009 and accordingly, all references to UI in any Regulations,
12
Standards, Codes or Procedures of CERC are deemed to be replaced with the
"Deviation Settlement Mechanism" (DSM).
The Forum noted that some PPAs between generating companies
(especially based on RE sources like co-gen etc.) and the distribution companies
are in existence for sale of electricity at a tariff rate linked to Unscheduled
Interchange (UI) charges.
CERC has issued Deviation Settlement Mechanism (DSM) Regulations
which provide inter alia for deterrents in the form of DSM charges for deviation
from schedule. Accordingly, the DSM / UI mechanism needs to be seen as a
deterrent, and not as a regular power sourcing option.
In the light of the above, the Forum agreed that DSM / UI charge cannot
be used as a reference for payment of tariff for any generation.
Agenda Item No. 11 : Presentation and Discussion on the Study
commissioned by "FOR" on “Performance of
Distribution Utilities”.
In furtherance to the decision of the Forum for carrying out a study on
“Performance of Distribution Utilities”, the Secretariat of "FOR", after
following due process, appointed M/s Ernst & Young LLP as the Consultant for
carrying out the study.
The Consultant submitted the draft report and made a presentation
(enclosed as Annexure - VI) on the findings of the study. The presentation
included, key performance indicators (technical, financial and commercial
aspects), weights given to these key performance indicators and finally
categorization of the distribution licensees into five different categories, based
on their scores.
13
The distribution licensees under consideration were compared against
each other and their performance evaluated based on 4 constructs (Profitability,
Channel efficiency, Solvency and Techno-commercial efficiency) and related
12 parameters and grouped into five categories. The 12 parameters, inter alia
include, Gross Margin without subsidy, Profit per unit input energy, Difference
in CAGR between Revenue and expenses, number of days of receivable and
number of days of payable, ratio of capex and depreciation, interest service
coverage ratio and debt to equity ratio, fixed assets coverage ratio, AT&C losses
and Employee cost per unit input energy and trend of AT&C losses. Based on
the importance of each performance indicator (derived from its impact on the
overall performance of the utilities) weights were assigned. The findings have
been compared to national level estimates for a detailed analysis of the
performance of the utilities. Relevant gaps in the performance of DISCOMs
were identified and appropriate measures/mechanisms for enhancing the
efficacy of the utilities have been suggested.
It was decided that the ERCs will validate the data (as referred to in the
draft report) within a month. Based on the validated data, the report may be
finalized.
A vote of thanks was extended by Smt. Shubha Sarma, Secretary,
CERC/FOR. She conveyed sincere thanks to all the dignitaries present in the
meeting. She also thanked the staff of “FOR” Secretariat for their arduous
efforts at organizing the meeting. The meeting ended with a vote of thanks to
the Chair.
*********
14
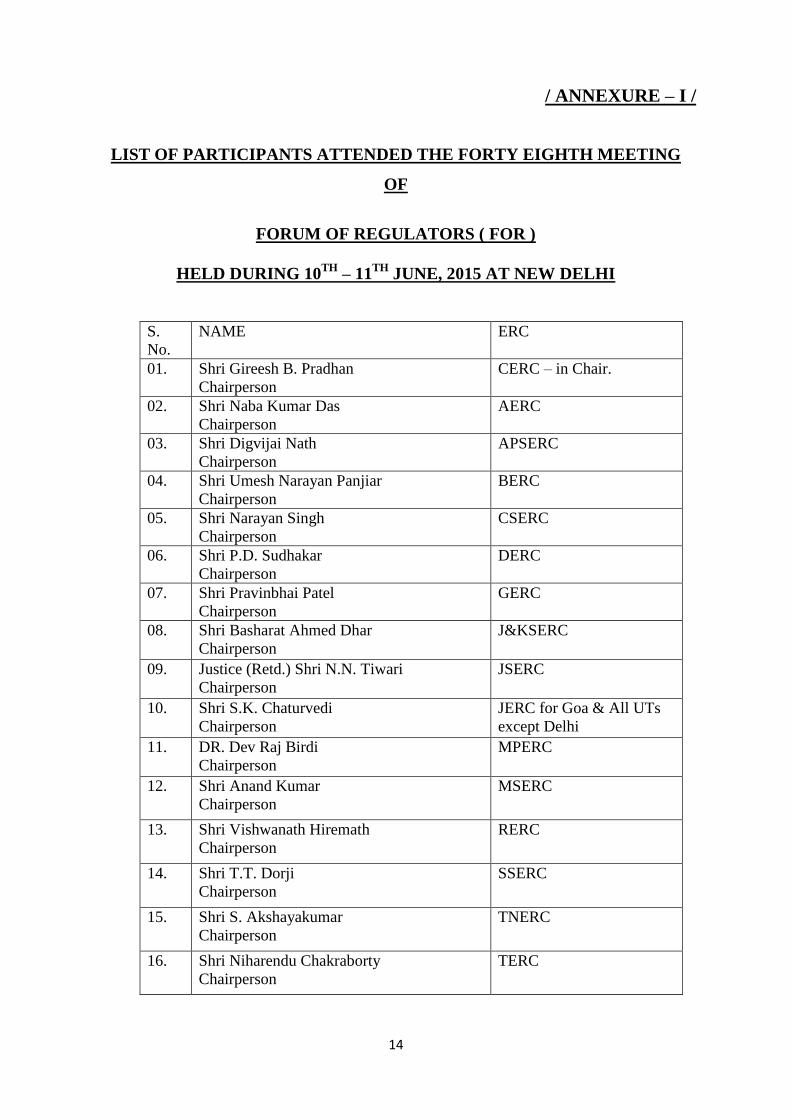
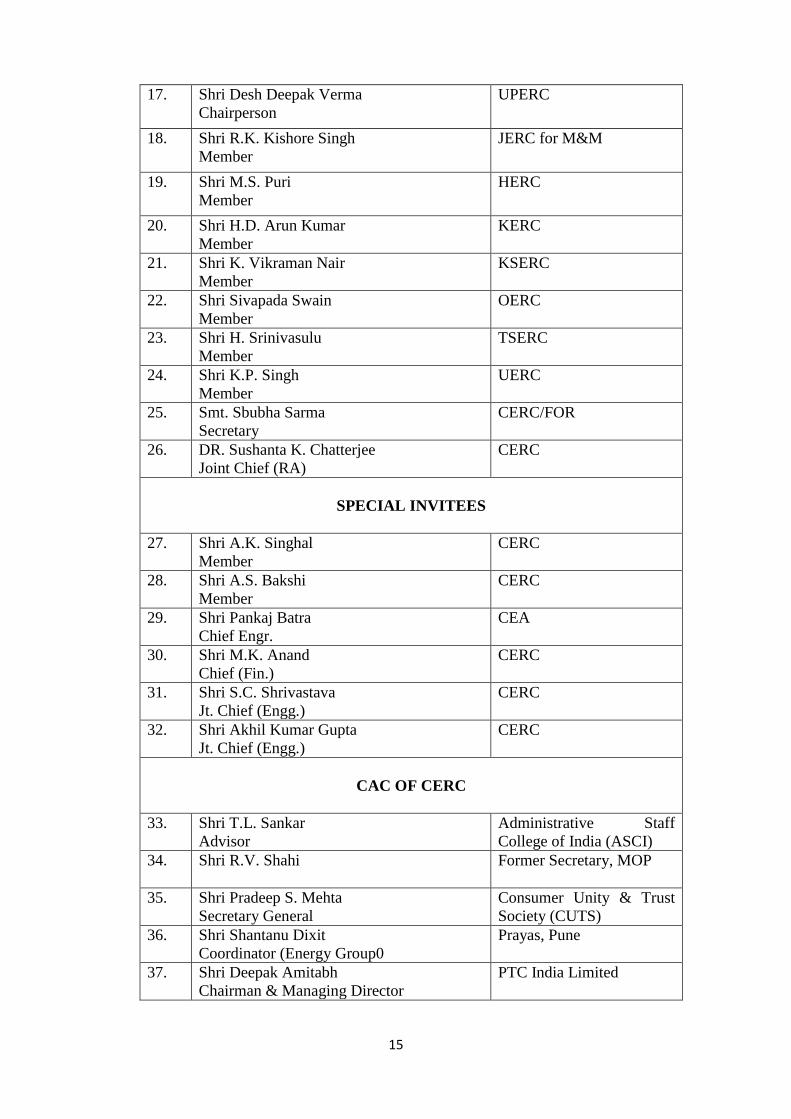
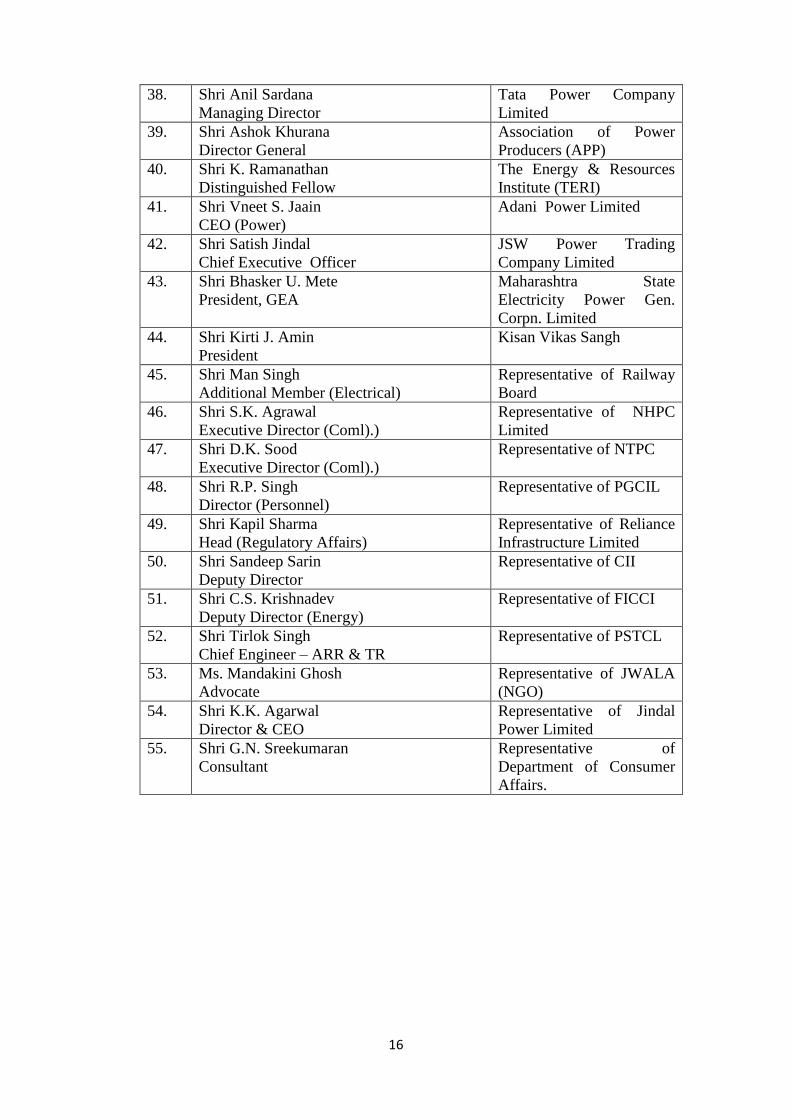
/ ANNEXURE – I /
LIST OF PARTICIPANTS ATTENDED THE FORTY EIGHTH MEETING
OF
FORUM OF REGULATORS ( FOR )
HELD DURING 10TH
– 11TH
JUNE, 2015 AT NEW DELHI
S.
No.
NAME ERC
01. Shri Gireesh B. Pradhan
Chairperson
CERC – in Chair.
02. Shri Naba Kumar Das
Chairperson
AERC
03. Shri Digvijai Nath
Chairperson
APSERC
04. Shri Umesh Narayan Panjiar
Chairperson
BERC
05. Shri Narayan Singh
Chairperson
CSERC
06. Shri P.D. Sudhakar
Chairperson
DERC
07. Shri Pravinbhai Patel
Chairperson
GERC
08. Shri Basharat Ahmed Dhar
Chairperson
J&KSERC
09. Justice (Retd.) Shri N.N. Tiwari
Chairperson
JSERC
10. Shri S.K. Chaturvedi
Chairperson
JERC for Goa & All UTs
except Delhi
11. DR. Dev Raj Birdi
Chairperson
MPERC
12. Shri Anand Kumar
Chairperson
MSERC
13. Shri Vishwanath Hiremath
Chairperson
RERC
14. Shri T.T. Dorji
Chairperson
SSERC
15. Shri S. Akshayakumar
Chairperson
TNERC
16. Shri Niharendu Chakraborty
Chairperson
TERC
15
17. Shri Desh Deepak Verma
Chairperson
UPERC
18. Shri R.K. Kishore Singh
Member
JERC for M&M
19. Shri M.S. Puri
Member
HERC
20. Shri H.D. Arun Kumar
Member
KERC
21. Shri K. Vikraman Nair
Member
KSERC
22. Shri Sivapada Swain
Member
OERC
23. Shri H. Srinivasulu
Member
TSERC
24. Shri K.P. Singh
Member
UERC
25. Smt. Sbubha Sarma
Secretary
CERC/FOR
26. DR. Sushanta K. Chatterjee
Joint Chief (RA)
CERC
SPECIAL INVITEES
27. Shri A.K. Singhal
Member
CERC
28. Shri A.S. Bakshi
Member
CERC
29. Shri Pankaj Batra
Chief Engr.
CEA
30. Shri M.K. Anand
Chief (Fin.)
CERC
31. Shri S.C. Shrivastava
Jt. Chief (Engg.)
CERC
32. Shri Akhil Kumar Gupta
Jt. Chief (Engg.)
CERC
CAC OF CERC
33. Shri T.L. Sankar
Advisor
Administrative Staff
College of India (ASCI)
34. Shri R.V. Shahi
Former Secretary, MOP
35. Shri Pradeep S. Mehta
Secretary General
Consumer Unity & Trust
Society (CUTS)
36. Shri Shantanu Dixit
Coordinator (Energy Group0
Prayas, Pune
37. Shri Deepak Amitabh
Chairman & Managing Director
PTC India Limited
16
38. Shri Anil Sardana
Managing Director
Tata Power Company
Limited
39. Shri Ashok Khurana
Director General
Association of Power
Producers (APP)
40. Shri K. Ramanathan
Distinguished Fellow
The Energy & Resources
Institute (TERI)
41. Shri Vneet S. Jaain
CEO (Power)
Adani Power Limited
42. Shri Satish Jindal
Chief Executive Officer
JSW Power Trading
Company Limited
43. Shri Bhasker U. Mete
President, GEA
Maharashtra State
Electricity Power Gen.
Corpn. Limited
44. Shri Kirti J. Amin
President
Kisan Vikas Sangh
45. Shri Man Singh
Additional Member (Electrical)
Representative of Railway
Board
46. Shri S.K. Agrawal
Executive Director (Coml).)
Representative of NHPC
Limited
47. Shri D.K. Sood
Executive Director (Coml).)
Representative of NTPC
48. Shri R.P. Singh
Director (Personnel)
Representative of PGCIL
49. Shri Kapil Sharma
Head (Regulatory Affairs)
Representative of Reliance
Infrastructure Limited
50. Shri Sandeep Sarin
Deputy Director
Representative of CII
51. Shri C.S. Krishnadev
Deputy Director (Energy)
Representative of FICCI
52. Shri Tirlok Singh
Chief Engineer – ARR & TR
Representative of PSTCL
53. Ms. Mandakini Ghosh
Advocate
Representative of JWALA
(NGO)
54. Shri K.K. Agarwal
Director & CEO
Representative of Jindal
Power Limited
55. Shri G.N. Sreekumaran
Consultant
Representative of
Department of Consumer
Affairs.
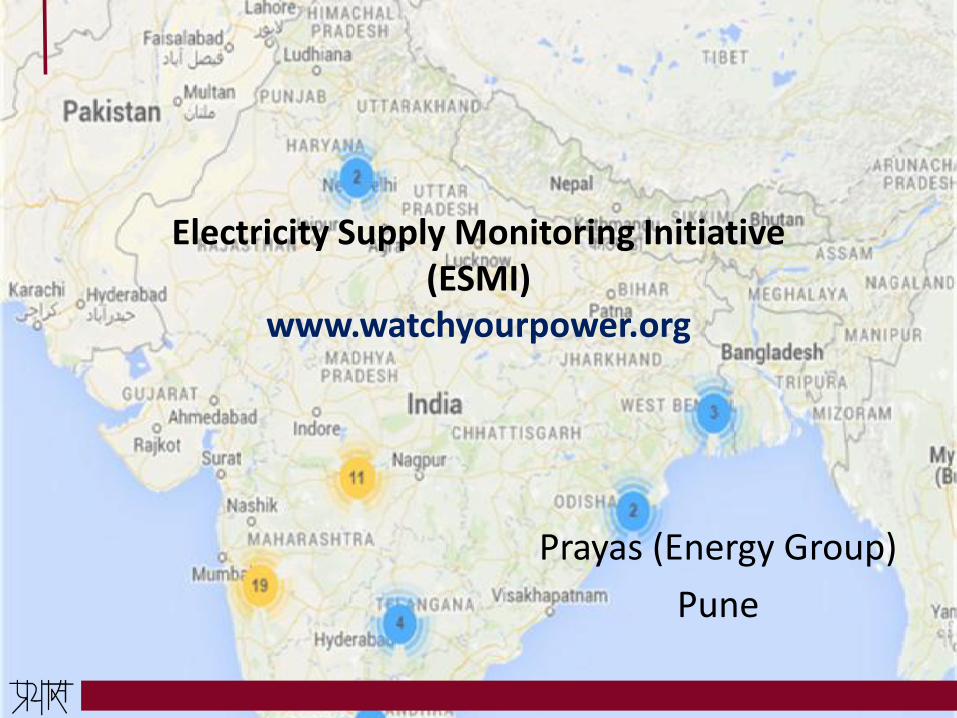
Electricity Supply Monitoring Initiative(ESMI)
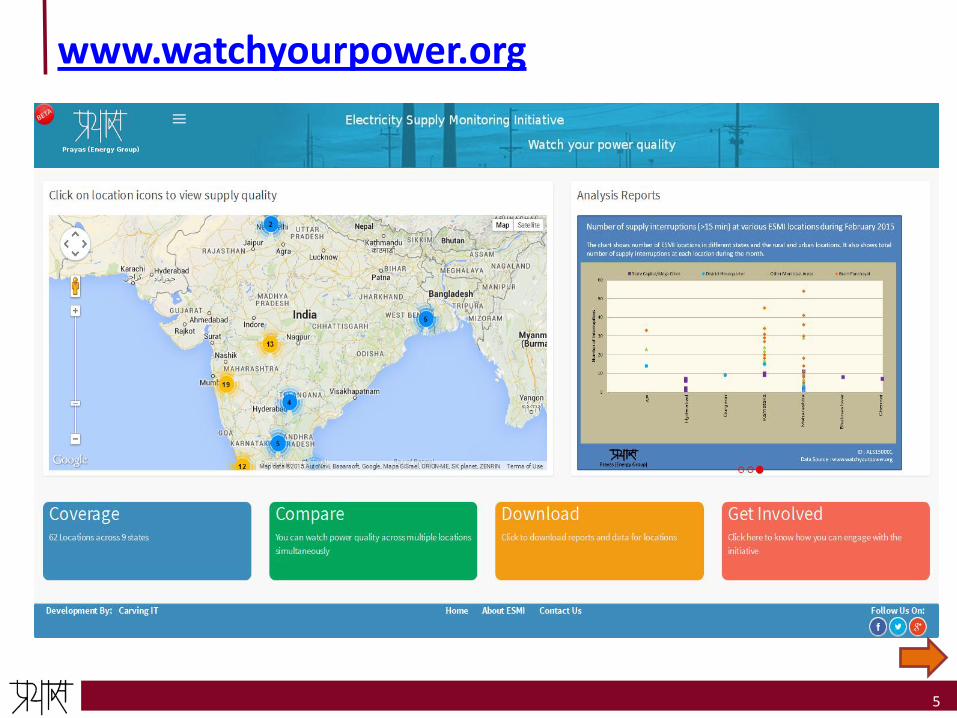
www.watchyourpower.org
Prayas (Energy Group)
Pune
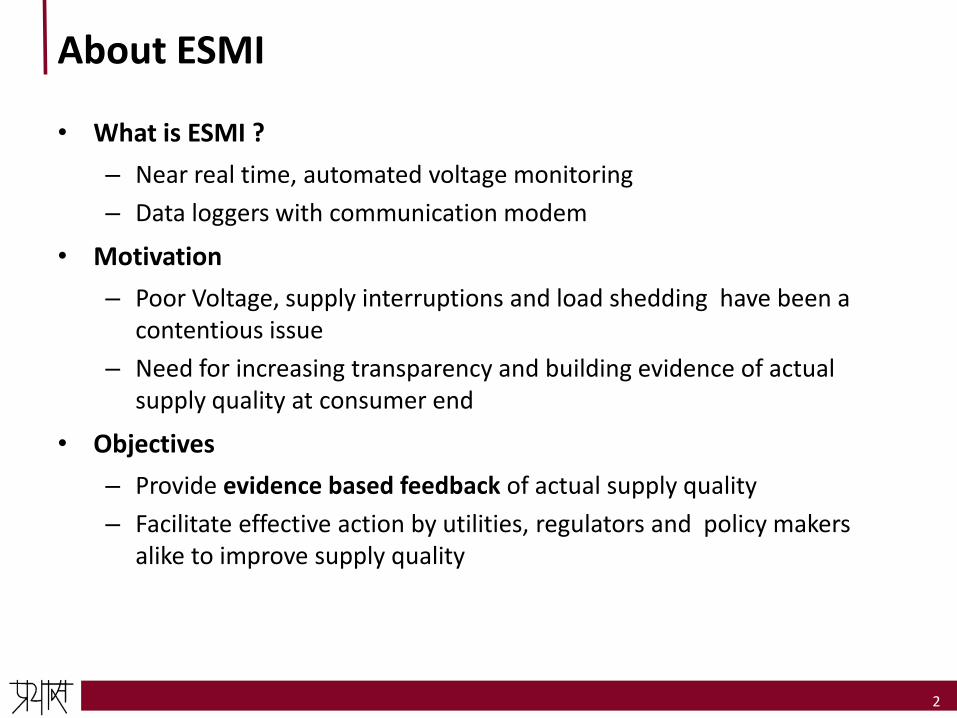
About ESMI
• What is ESMI ?
– Near real time, automated voltage monitoring
– Data loggers with communication modem
• Motivation
– Poor Voltage, supply interruptions and load shedding have been a contentious issue
– Need for increasing transparency and building evidence of actual supply quality at consumer end
• Objectives
– Provide evidence based feedback of actual supply quality
– Facilitate effective action by utilities, regulators and policy makers alike to improve supply quality
2
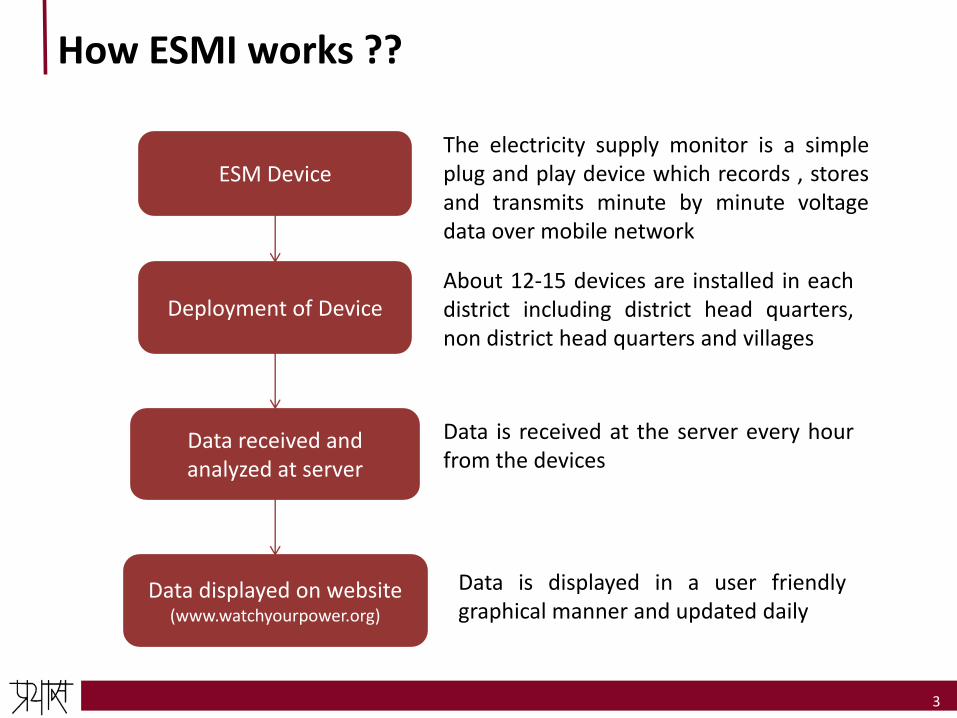
How ESMI works ??
3
ESM Device
Deployment of Device
Data received and analyzed at server
Data displayed on website(www.watchyourpower.org)
The electricity supply monitor is a simpleplug and play device which records , storesand transmits minute by minute voltagedata over mobile network
About 12-15 devices are installed in eachdistrict including district head quarters,non district head quarters and villages
Data is received at the server every hourfrom the devices
Data is displayed in a user friendlygraphical manner and updated daily
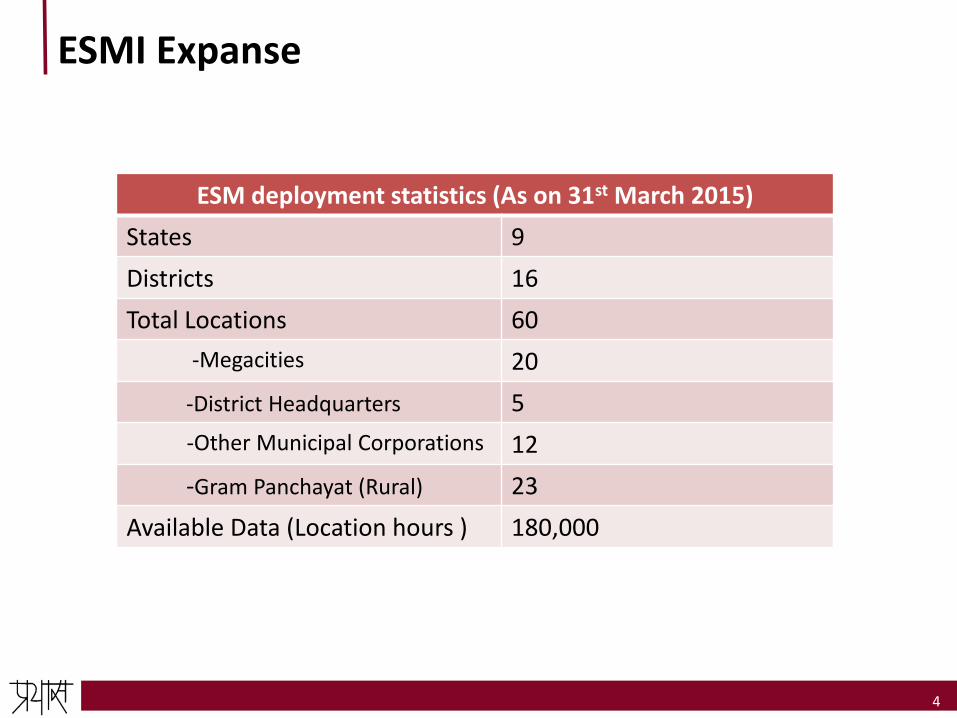
ESMI Expanse
4
ESM deployment statistics (As on 31st March 2015)
States 9
Districts 16
Total Locations 60
-Megacities 20
-District Headquarters 5
-Other Municipal Corporations 12
-Gram Panchayat (Rural) 23
Available Data (Location hours ) 180,000

Typical ESMI Location Report
6
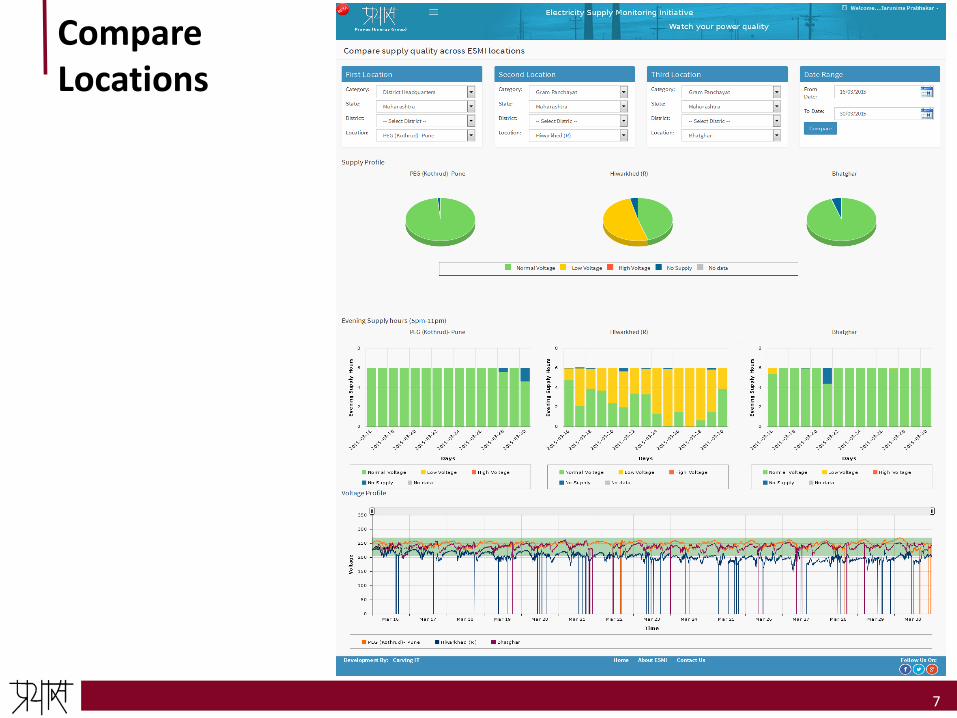
Compare Locations
7

ESMI FAQ
8
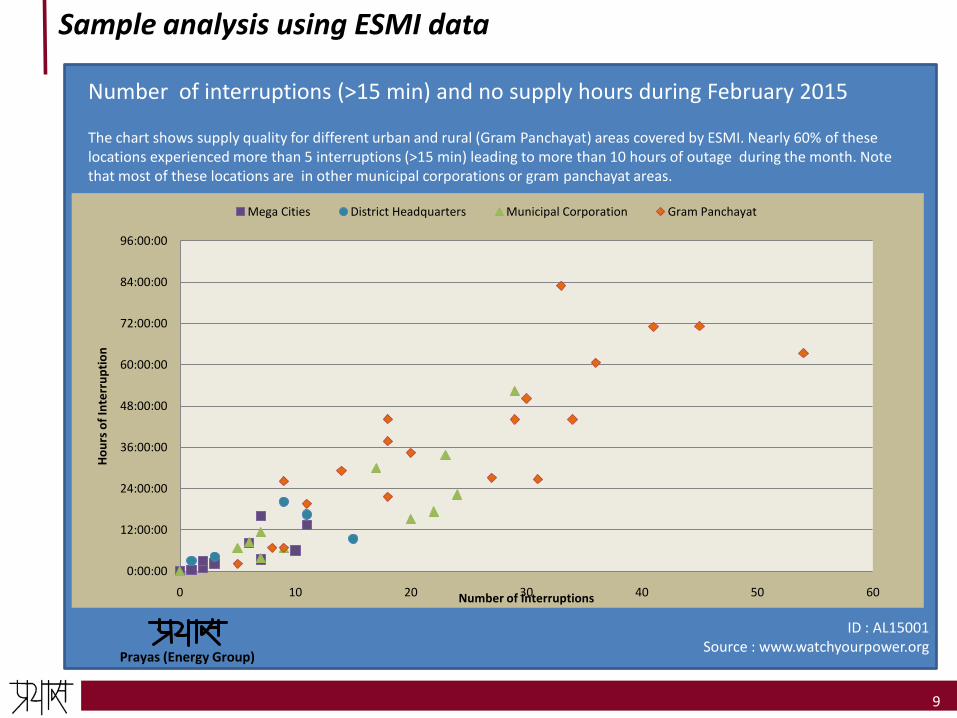
Sample analysis using ESMI data
9
Number of interruptions (>15 min) and no supply hours during February 2015
The chart shows supply quality for different urban and rural (Gram Panchayat) areas covered by ESMI. Nearly 60% of these locations experienced more than 5 interruptions (>15 min) leading to more than 10 hours of outage during the month. Note that most of these locations are in other municipal corporations or gram panchayat areas.
Prayas (Energy Group)
ID : AL15001Source : www.watchyourpower.org
0:00:00
12:00:00
24:00:00
36:00:00
48:00:00
60:00:00
72:00:00
84:00:00
96:00:00
0 10 20 30 40 50 60
Ho
urs
of
Inte
rru
pti
on
Number of Interruptions
Mega Cities District Headquarters Municipal Corporation Gram Panchayat
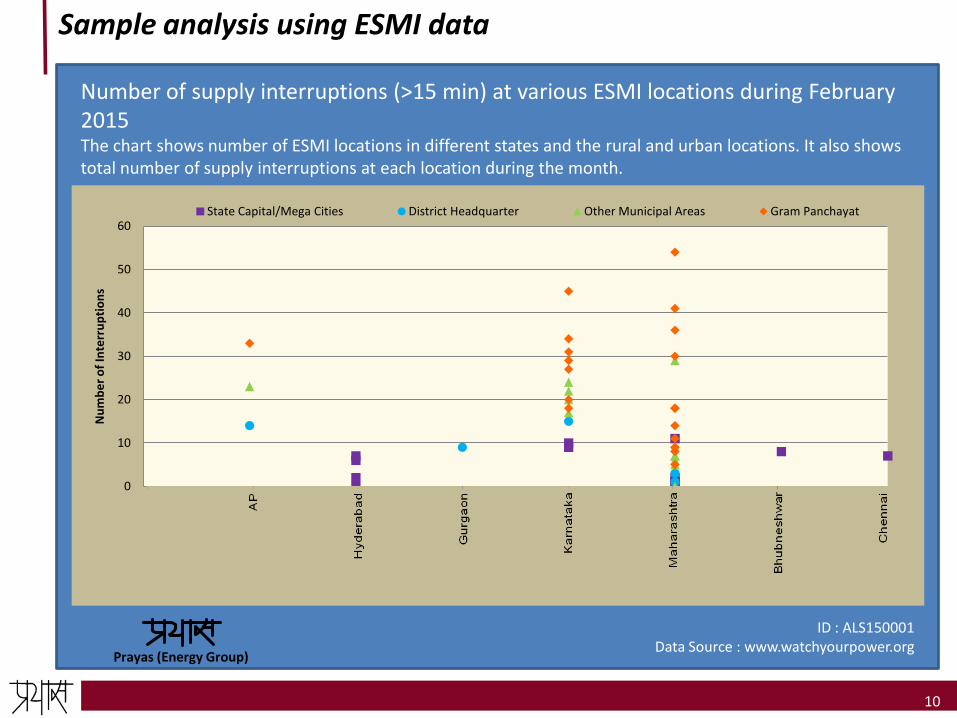
Sample analysis using ESMI data
10
Number of supply interruptions (>15 min) at various ESMI locations during February 2015The chart shows number of ESMI locations in different states and the rural and urban locations. It also shows total number of supply interruptions at each location during the month.
Prayas (Energy Group)
ID : ALS150001Data Source : www.watchyourpower.org
0
10
20
30
40
50
60
Nu
mb
er
of
Inte
rru
pti
on
s
State Capital/Mega Cities District Headquarter Other Municipal Areas Gram Panchayat
11
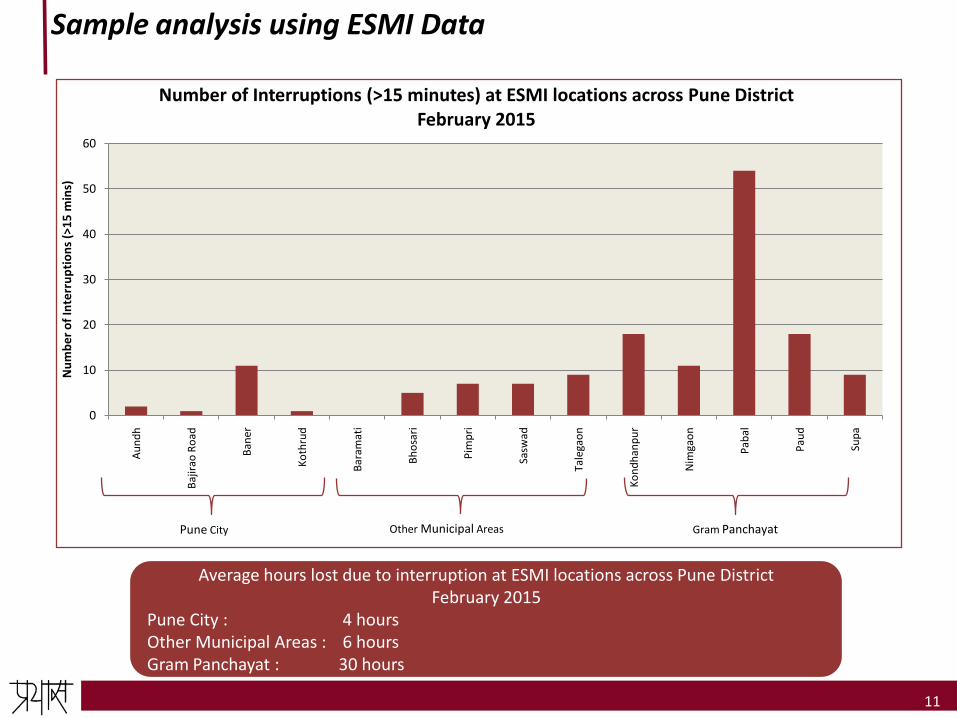
Sample analysis using ESMI Data
0
10
20
30
40
50
60A
un
dh
Baj
irao
Ro
ad
Ban
er
Ko
thru
d
Bar
amat
i
Bh
osa
ri
Pim
pri
Sasw
ad
Tale
gao
n
Ko
nd
han
pu
r
Nim
gao
n
Pab
al
Pau
d
Sup
a
Nu
mb
er
of
Inte
rru
pti
on
s (>
15
min
s)
Number of Interruptions (>15 minutes) at ESMI locations across Pune District February 2015
Other Municipal Areas Gram PanchayatPune City
Average hours lost due to interruption at ESMI locations across Pune District February 2015
Pune City : 4 hoursOther Municipal Areas : 6 hoursGram Panchayat : 30 hours
Sample analysis using ESMI Data
12
0
2
4
6
01
-Feb
03
-Feb
05
-Feb
07
-Feb
09
-Feb
11
-Feb
13
-Feb
15
-Feb
17
-Feb
19
-Feb
21
-Feb
23
-Feb
25
-Feb
27
-Feb
Ajekar-Dheputtu
0
2
4
6
01-Feb 08-Feb 15-Feb 22-Feb
Guddiangadi
0
2
4
6
01
-Feb
03
-Feb
05
-Feb
07
-Feb
09
-Feb
11
-Feb
13
-Feb
15
-Feb
17
-Feb
19
-Feb
21
-Feb
23
-Feb
25
-Feb
27
-Feb
Idu
0
2
4
6
01
-Feb
03
-Feb
05
-Feb
07
-Feb
09
-Feb
11
-Feb
13
-Feb
15
-Feb
17
-Feb
19
-Feb
21
-Feb
23
-Feb
25
-Feb
27
-Feb
Karkala
0
2
4
6
01
-Feb
03
-Feb
05
-Feb
07
-Feb
09
-Feb
11
-Feb
13
-Feb
15
-Feb
17
-Feb
19
-Feb
21
-Feb
23
-Feb
25
-Feb
27
-Feb
Kundapur
0
2
4
6
01
-Feb
03
-Feb
05
-Feb
07
-Feb
09
-Feb
11
-Feb
13
-Feb
15
-Feb
17
-Feb
19
-Feb
21
-Feb
23
-Feb
25
-Feb
27
-Feb
Mudur
0
2
4
6
01
-Feb
03
-Feb
05
-Feb
07
-Feb
09
-Feb
11
-Feb
13
-Feb
15
-Feb
17
-Feb
19
-Feb
21
-Feb
23
-Feb
25
-Feb
27
-Feb
Nakre
0
2
4
6
01
-Feb
03
-Feb
05
-Feb
07
-Feb
09
-Feb
11
-Feb
13
-Feb
15
-Feb
17
-Feb
19
-Feb
21
-Feb
23
-Feb
25
-Feb
27
-Feb
Shirva
0
2
4
6
01
-Feb
03
-Feb
05
-Feb
07
-Feb
09
-Feb
11
-Feb
13
-Feb
15
-Feb
17
-Feb
19
-Feb
21
-Feb
23
-Feb
25
-Feb
27
-Feb
Siddhapura
0
2
4
6
01
-Feb
03
-Feb
05
-Feb
07
-Feb
09
-Feb
11
-Feb
13
-Feb
15
-Feb
17
-Feb
19
-Feb
21
-Feb
23
-Feb
25
-Feb
27
-Feb
Yadthare
0
2
4
6
01
-Feb
03
-Feb
05
-Feb
07
-Feb
09
-Feb
11
-Feb
13
-Feb
15
-Feb
17
-Feb
19
-Feb
21
-Feb
23
-Feb
25
-Feb
27
-Feb
Brahmavar
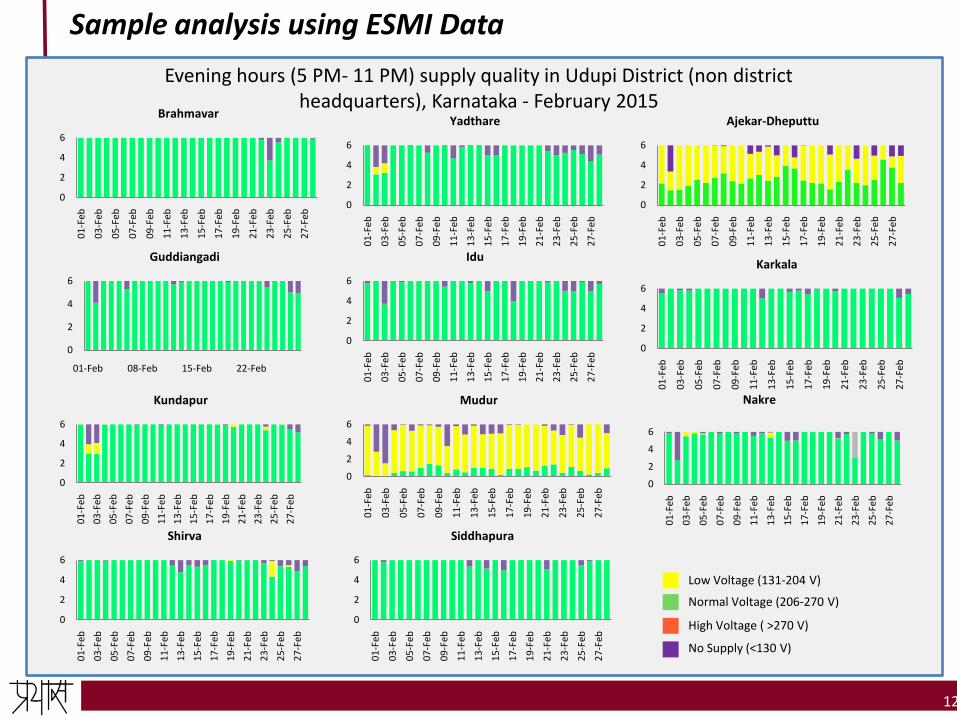
Evening hours (5 PM- 11 PM) supply quality in Udupi District (non district headquarters), Karnataka - February 2015
Normal Voltage (206-270 V)
High Voltage ( >270 V)
No Supply (<130 V)
Low Voltage (131-204 V)
13
Sample analysis using ESMI DataSample analysis using ESMI Data
13
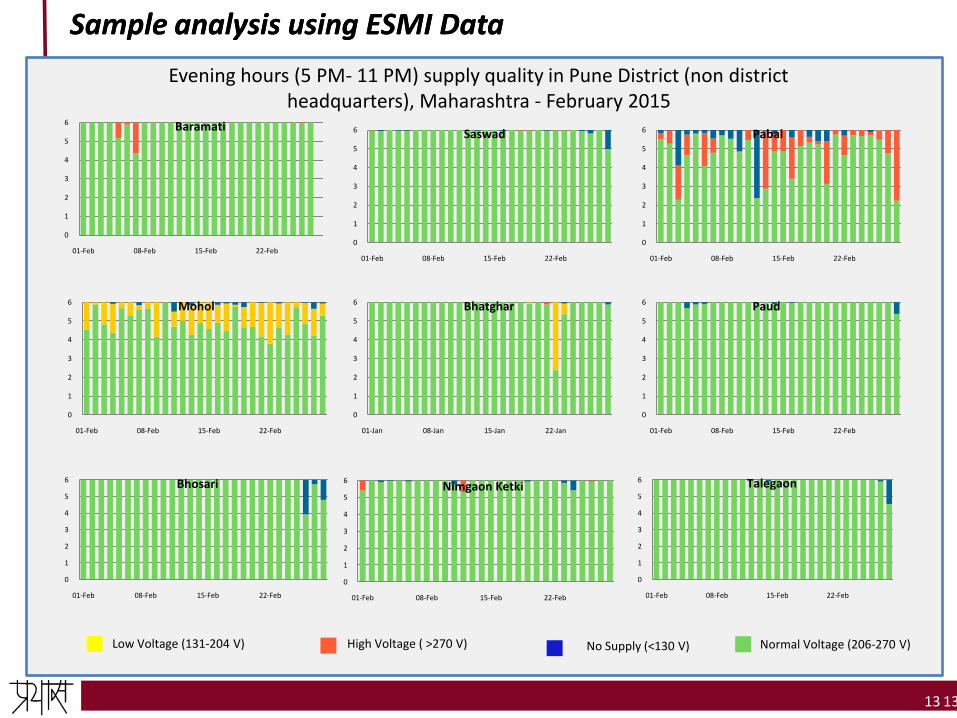
Evening hours (5 PM- 11 PM) supply quality in Pune District (non district headquarters), Maharashtra - February 2015
Normal Voltage (206-270 V)High Voltage ( >270 V) No Supply (<130 V)Low Voltage (131-204 V)
0
1
2
3
4
5
6
01-Feb 08-Feb 15-Feb 22-Feb
Baramati
0
1
2
3
4
5
6
01-Feb 08-Feb 15-Feb 22-Feb
Pabal
0
1
2
3
4
5
6
01-Feb 08-Feb 15-Feb 22-Feb
Saswad
0
1
2
3
4
5
6
01-Feb 08-Feb 15-Feb 22-Feb
Mohol
0
1
2
3
4
5
6
01-Jan 08-Jan 15-Jan 22-Jan
Bhatghar
0
1
2
3
4
5
6
01-Feb 08-Feb 15-Feb 22-Feb
Bhosari
0
1
2
3
4
5
6
01-Feb 08-Feb 15-Feb 22-Feb
Nimgaon Ketki
0
1
2
3
4
5
6
01-Feb 08-Feb 15-Feb 22-Feb
Paud
0
1
2
3
4
5
6
01-Feb 08-Feb 15-Feb 22-Feb
Talegaon
What next..
• In coming few months we plan to expand ESMI to 700 – 800 new
locations spanning across eight states.
• We will continue to share this data from all locations with
utilities, regulators and consumers.
• Data from ESMI also creates opportunities for further research in
drawing linkages between electricity supply and people’s health and
livelihood and many other aspects relating to power supply.
14
Key takeaways
• Technology and costs are no more a barrier for automated monitoring
systems
– Monitoring 10,000 feeders would cost just about 30-40 Crore
– Utilities should be mandated to ensure full transparency and accountability of service quality
– Regulators should use such systems to monitor compliance with service quality standards and load shedding
• Reliable service quality data can help :
– Ensure accountability of investments in distribution infrastructure
– Estimation of demand supply gap
– Planning and accountability for short term power purchase
– Tariff-Service quality linkages
15

Thank you
16
For more information visit :
watchyourpower.org
or
prayaspune.org/peg
Or write to us at :

About ESM device
• The energy consumed by the device is less than a unit per month
• Accuracy + /- 2-3 %
• Devices are rigorously tested before they are deployed
• Precautions ensured during deployment
– Ensure device is not connected to UPS /stabilizers plug point
– Device is connected to spare plug point to not hinder daily activities
– Device is also connected to direct supply line where possible
• Recorded erratic supply , long outages are confirmed from consumer
feedback
• Data received from ESMI can be verified with data provided by Utilities
at feeder level
• Each device costs about Rs. 10,000 - 15,000 (depending on specific
model and cost of mobile data package)
17
Business Unit
Roll out plan for introduction of Competition in Retail sale of electricityFinal Presentation
Strictly Private and Confidential
10 June 2015
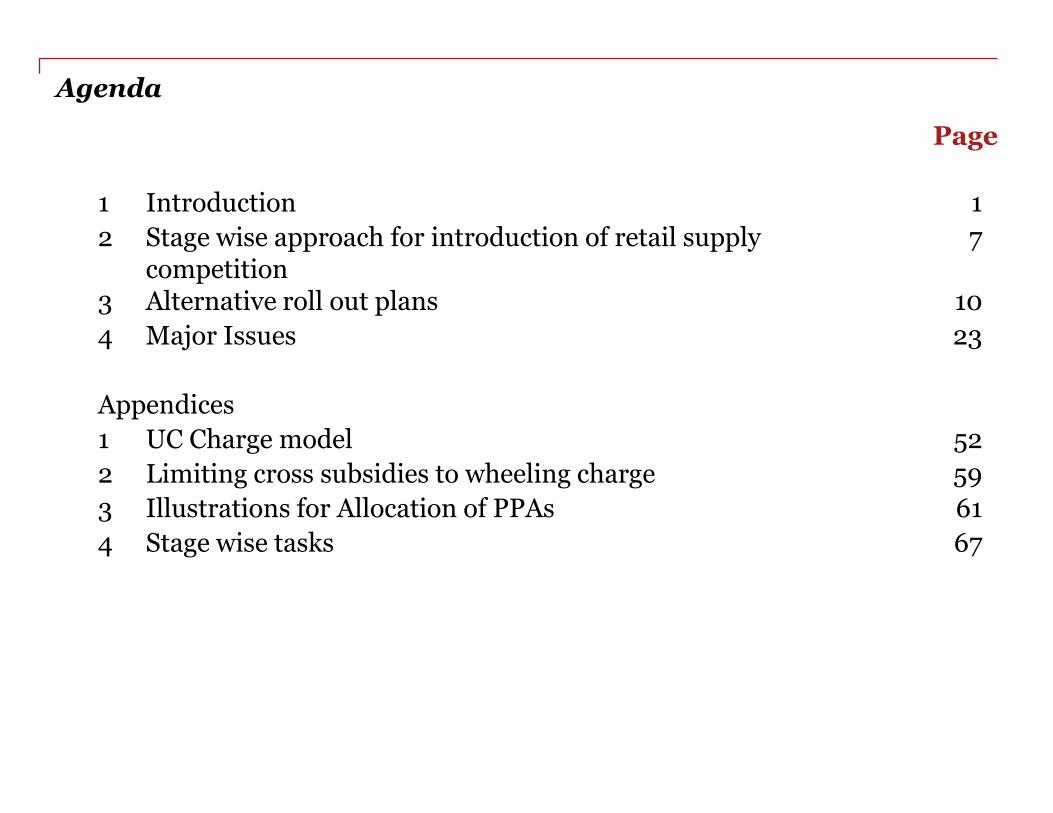
Agenda
Page
1 Introduction 1
2 Stage wise approach for introduction of retail supply competition
7
3 Alternative roll out plans 10
4 Major Issues 23
Appendices
1 UC Charge model 52
2 Limiting cross subsidies to wheeling charge 59
3 Illustrations for Allocation of PPAs 61
4 Stage wise tasks 67

PwC
10 June 2015
Introduction
1
Roll out plan for introduction of Competition in Retail sale of electricity • Final Presentation
PwC
10 June 2015
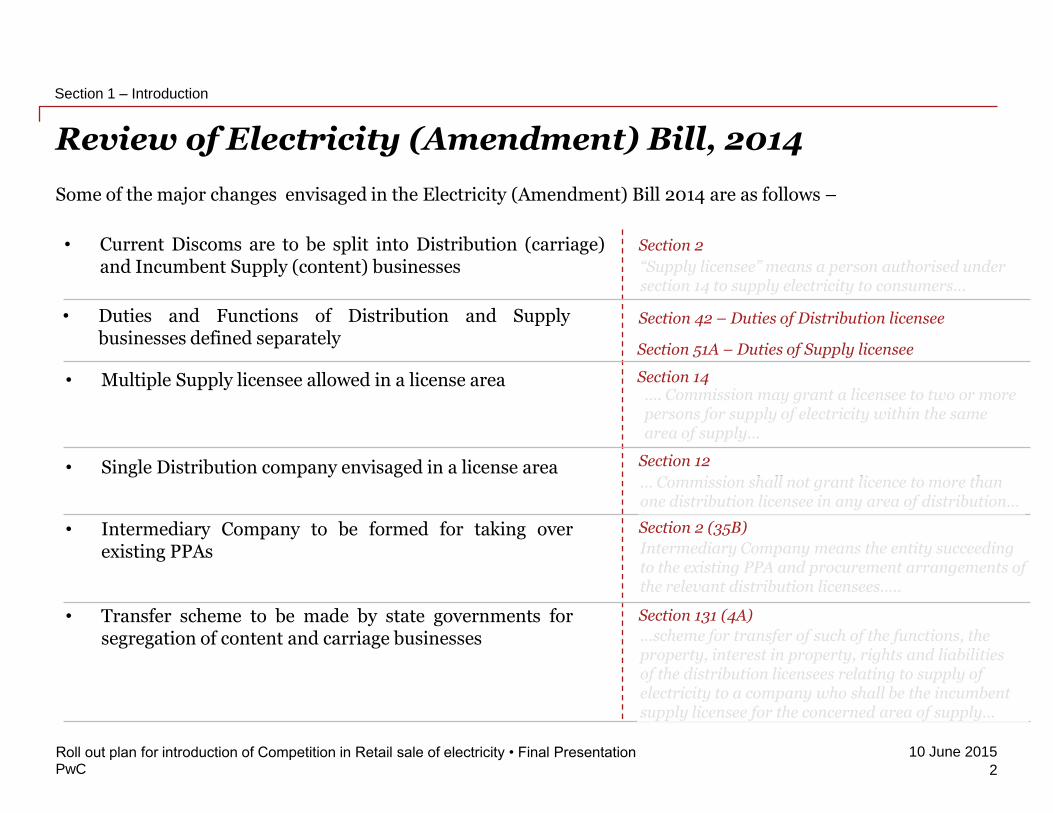
Section 2 (35B)
Intermediary Company means the entity succeeding to the existing PPA and procurement arrangements of the relevant distribution licensees…..
Review of Electricity (Amendment) Bill, 2014
Some of the major changes envisaged in the Electricity (Amendment) Bill 2014 are as follows –
2
Roll out plan for introduction of Competition in Retail sale of electricity • Final Presentation
Section 1 – Introduction
• Current Discoms are to be split into Distribution (carriage)and Incumbent Supply (content) businesses
• Duties and Functions of Distribution and Supplybusinesses defined separately
• Multiple Supply licensee allowed in a license area
• Single Distribution company envisaged in a license area
• Intermediary Company to be formed for taking overexisting PPAs
• Transfer scheme to be made by state governments forsegregation of content and carriage businesses
Section 2
Section 12
… Commission shall not grant licence to more than one distribution licensee in any area of distribution…
…. Commission may grant a licensee to two or more persons for supply of electricity within the same area of supply…
Section 14
Section 42 – Duties of Distribution licensee
Section 51A – Duties of Supply licensee
Section 131 (4A)
…scheme for transfer of such of the functions, the property, interest in property, rights and liabilities of the distribution licensees relating to supply of electricity to a company who shall be the incumbent supply licensee for the concerned area of supply…
“Supply licensee” means a person authorised under section 14 to supply electricity to consumers…

PwC
10 June 2015
FOR report on introduction of competition in retail supply
3
Section 1 – Introduction
Roll out plan for introduction of Competition in Retail sale of electricity • Final Presentation
The major points highlighted in this report were:
1. Development of a Wholesale Market – so as to reduce dominantposition of generators and improve power procurement efficiencies
2. Cost Reflective Tariffs – so as to reduce cross subsidies
3. Treatment of existing distribution and financial losses –allocation between distribution and retail supply businesses
4. Suitable supply infrastructure – need for advanced metering incompetitive segment of the market
5. Segregation of ownership of the distribution (wire) and retailsupply functions – so as to bring neutrality in distribution network
6. Phased approach with clear milestones – a timeline wassuggested for various phases of implementation
7. Provision for Provider of last resort – Duty to Connect and Dutyto Supply a consumer
8. Standards of Performance – division of SOPs between Distributionand Supply functions
PwC
10 June 2015
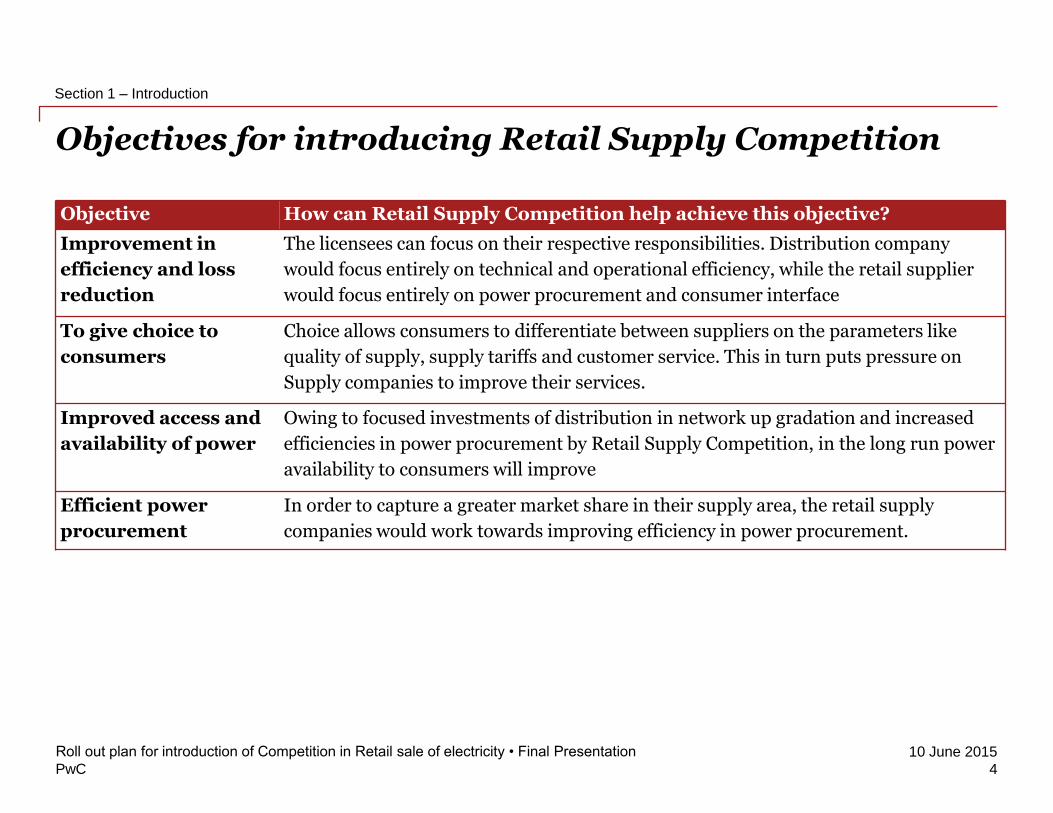
Objectives for introducing Retail Supply Competition
4
Roll out plan for introduction of Competition in Retail sale of electricity • Final Presentation
Section 1 – Introduction
Objective How can Retail Supply Competition help achieve this objective?
Improvement in
efficiency and loss
reduction
The licensees can focus on their respective responsibilities. Distribution company
would focus entirely on technical and operational efficiency, while the retail supplier
would focus entirely on power procurement and consumer interface
To give choice to
consumers
Choice allows consumers to differentiate between suppliers on the parameters like
quality of supply, supply tariffs and customer service. This in turn puts pressure on
Supply companies to improve their services.
Improved access and
availability of power
Owing to focused investments of distribution in network up gradation and increased
efficiencies in power procurement by Retail Supply Competition, in the long run power
availability to consumers will improve
Efficient power
procurement
In order to capture a greater market share in their supply area, the retail supply
companies would work towards improving efficiency in power procurement.
PwC
10 June 2015
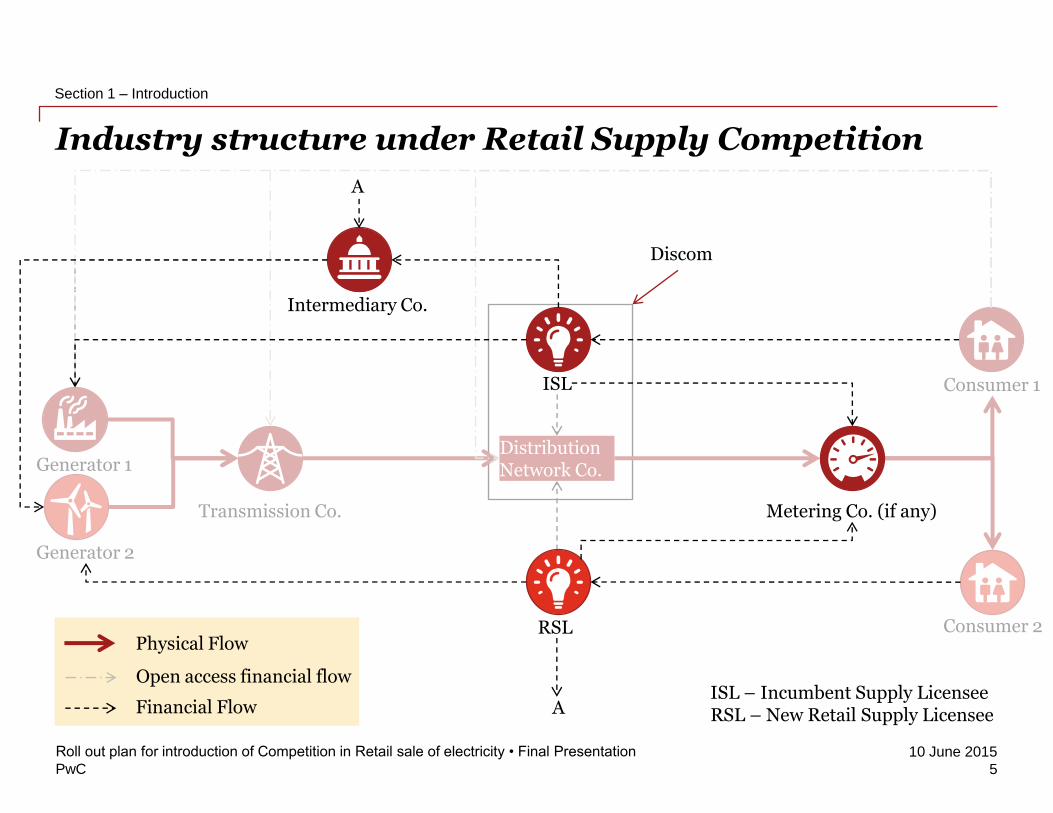
Industry structure under Retail Supply Competition
5
Roll out plan for introduction of Competition in Retail sale of electricity • Final Presentation
Section 1 – Introduction
Distribution Network Co.Generator 1
Generator 2
Transmission Co.
Consumer 1
Consumer 2
ISL
RSL
Metering Co. (if any)
A
Intermediary Co.
A
Physical Flow
Open access financial flow
Financial Flow
Discom
ISL – Incumbent Supply LicenseeRSL – New Retail Supply Licensee

PwC
10 June 2015
Approach adopted for the study
6
Roll out plan for introduction of Competition in Retail sale of electricity • Final Presentation
Section 1 – Introduction
• Review of The Electricity (Amendment) Bill, 2014
• Identification of issues
• Consultation with stakeholders
• Preparation of detailed stage wise plan
• Preparation of alternative roll out plans
• Presentation of findings of the report to FOR
• Based on the comments of draft report, finalization of report
Inception report/Discussion note Draft Report Final Report
Recommendations
2Final Report
3Analysis
1
PwC
10 June 2015
Stage wise approach for introduction of retail supply competition
7
Roll out plan for introduction of Competition in Retail sale of electricity • Final Presentation
PwC
10 June 2015
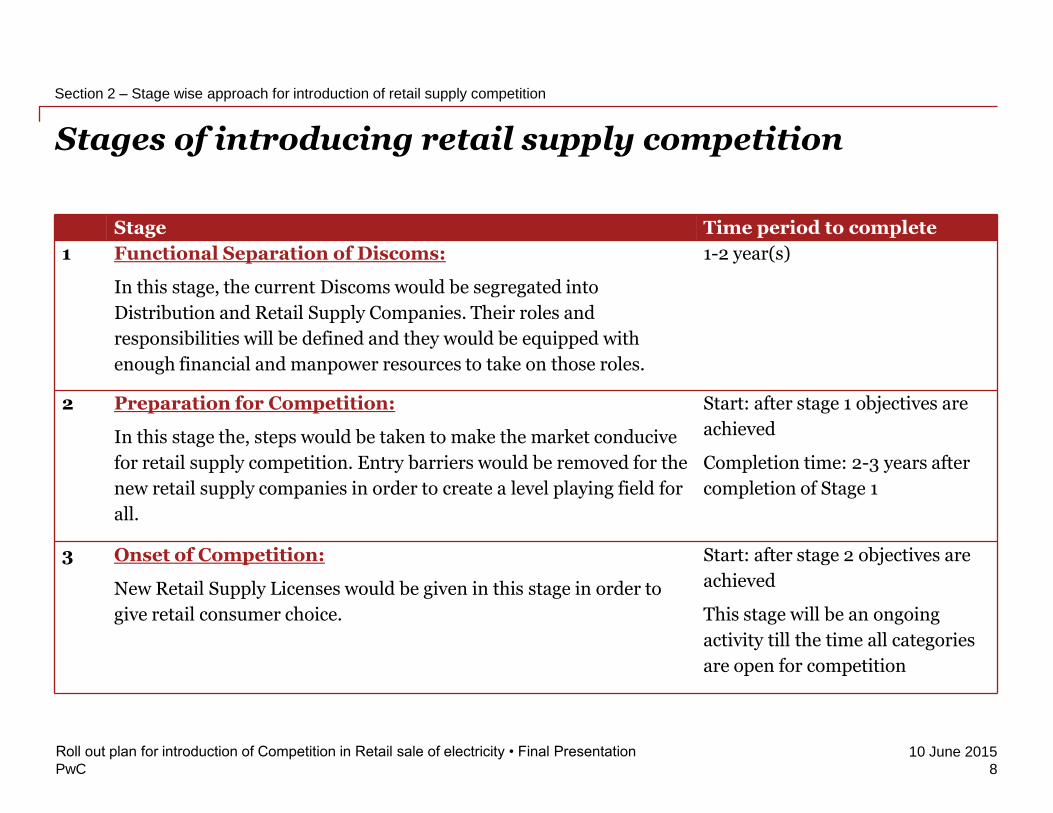
Stages of introducing retail supply competition
8
Roll out plan for introduction of Competition in Retail sale of electricity • Final Presentation
Section 2 – Stage wise approach for introduction of retail supply competition
Stage Time period to complete
1 Functional Separation of Discoms:
In this stage, the current Discoms would be segregated into
Distribution and Retail Supply Companies. Their roles and
responsibilities will be defined and they would be equipped with
enough financial and manpower resources to take on those roles.
1-2 year(s)
2 Preparation for Competition:
In this stage the, steps would be taken to make the market conducive
for retail supply competition. Entry barriers would be removed for the
new retail supply companies in order to create a level playing field for
all.
Start: after stage 1 objectives are
achieved
Completion time: 2-3 years after
completion of Stage 1
3 Onset of Competition:
New Retail Supply Licenses would be given in this stage in order to
give retail consumer choice.
Start: after stage 2 objectives are
achieved
This stage will be an ongoing
activity till the time all categories
are open for competition
PwC
10 June 2015
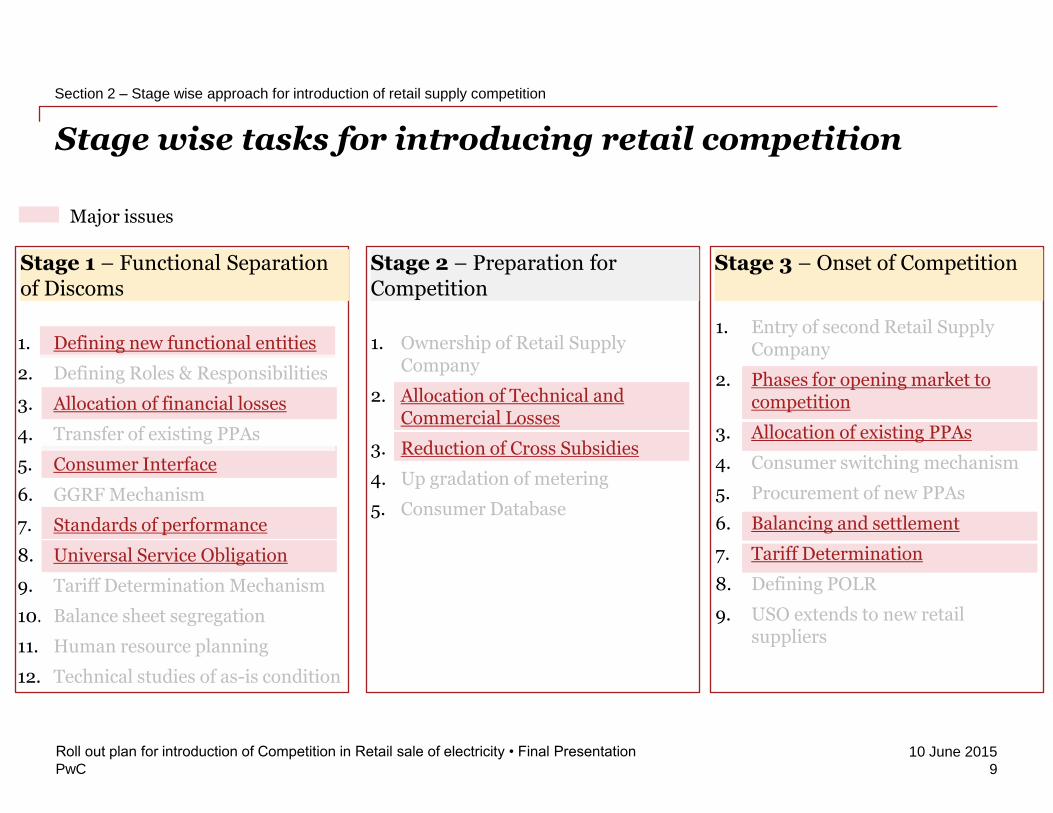
Stage wise tasks for introducing retail competition
9
Roll out plan for introduction of Competition in Retail sale of electricity • Final Presentation
Section 2 – Stage wise approach for introduction of retail supply competition
1. Defining new functional entities
2. Defining Roles & Responsibilities
3. Allocation of financial losses
4. Transfer of existing PPAs
5. Consumer Interface
6. GGRF Mechanism
7. Standards of performance
8. Universal Service Obligation
9. Tariff Determination Mechanism
10. Balance sheet segregation
11. Human resource planning
12. Technical studies of as-is condition
Stage 1 – Functional Separation of Discoms
Stage 2 – Preparation for Competition
1. Ownership of Retail Supply Company
2. Allocation of Technical and Commercial Losses
3. Reduction of Cross Subsidies
4. Up gradation of metering
5. Consumer Database
Stage 3 – Onset of Competition
1. Entry of second Retail Supply Company
2. Phases for opening market to competition
3. Allocation of existing PPAs
4. Consumer switching mechanism
5. Procurement of new PPAs
6. Balancing and settlement
7. Tariff Determination
8. Defining POLR
9. USO extends to new retail suppliers
Major issues

PwC
10 June 2015
Alternative roll out plans
10
Roll out plan for introduction of Competition in Retail sale of electricity • Final Presentation
PwC
10 June 2015
11
Roll out plan for introduction of Competition in Retail sale of electricity • Final Presentation
Section 3 – Alternative roll out plans
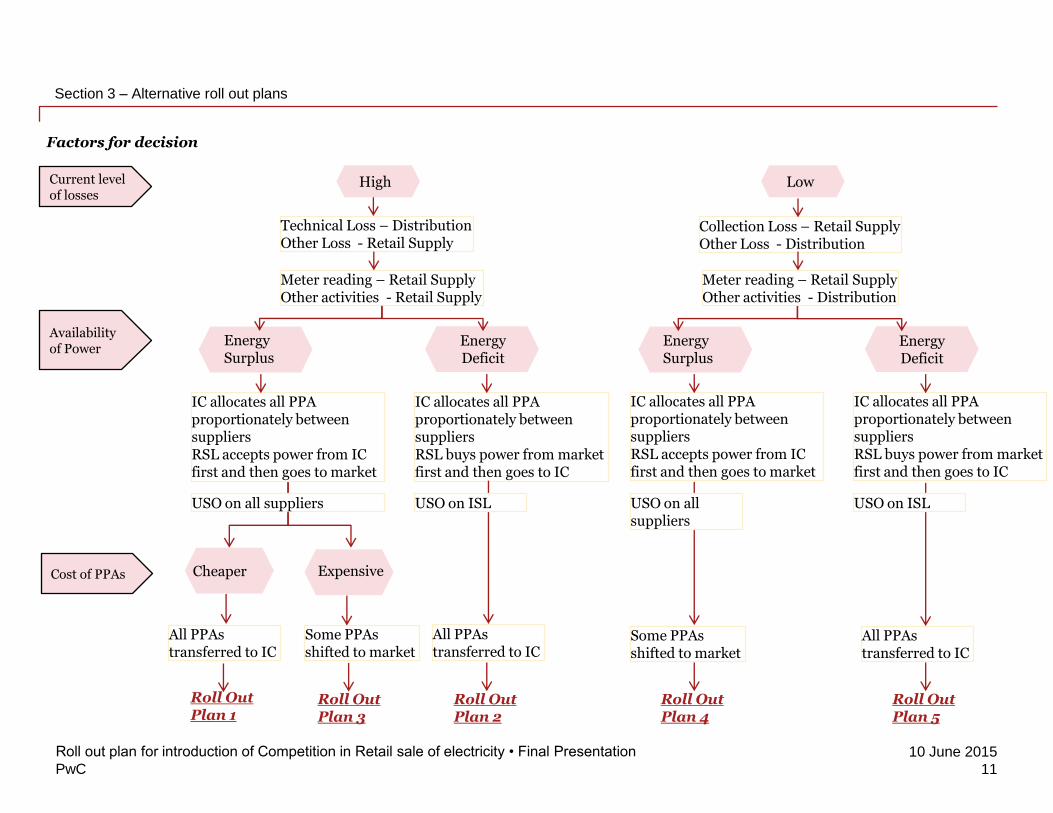
Current level of losses
High Low
Technical Loss – DistributionOther Loss - Retail Supply
Collection Loss – Retail SupplyOther Loss - Distribution
Meter reading – Retail SupplyOther activities - Retail Supply
Meter reading – Retail SupplyOther activities - Distribution
Availability of Power
Energy Surplus
IC allocates all PPA proportionately between suppliersRSL accepts power from IC first and then goes to market
IC allocates all PPA proportionately between suppliersRSL buys power from market first and then goes to IC
Cheaper Expensive
Some PPAs shifted to market
All PPAs transferred to IC
Roll Out Plan 1
Roll Out Plan 3
Roll Out Plan 2
Roll Out Plan 4
Roll Out Plan 5
Factors for decision
Cost of PPAs
Energy Deficit
All PPAs transferred to IC
Energy Surplus
Energy Deficit
IC allocates all PPA proportionately between suppliersRSL accepts power from IC first and then goes to market
IC allocates all PPA proportionately between suppliersRSL buys power from market first and then goes to IC
Some PPAs shifted to market
All PPAs transferred to IC
USO on all suppliers USO on ISL USO on all suppliers
USO on ISL
PwC
10 June 2015
12
Roll out plan for introduction of Competition in Retail sale of electricity • Final Presentation
Section 3 – Alternative roll out plans
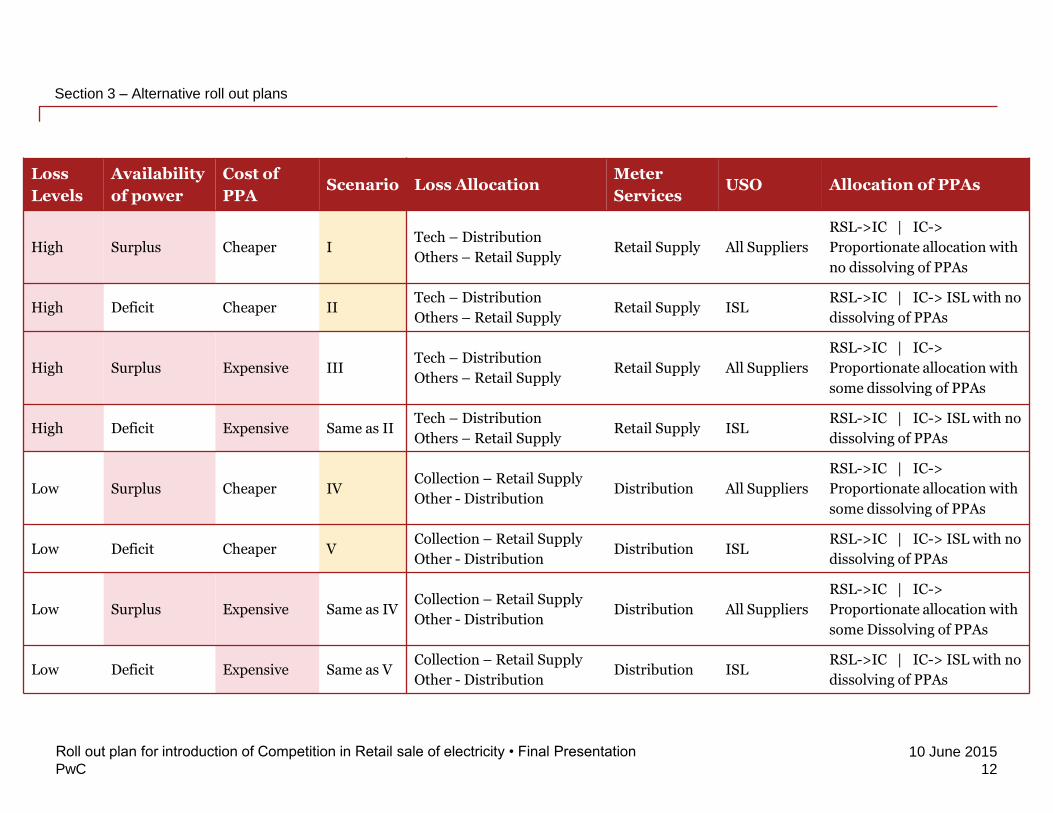
Loss
Levels
Availability
of power
Cost of
PPAScenario Loss Allocation
Meter
ServicesUSO Allocation of PPAs
High Surplus Cheaper ITech – Distribution
Others – Retail SupplyRetail Supply All Suppliers
RSL->IC | IC->
Proportionate allocation with
no dissolving of PPAs
High Deficit Cheaper IITech – Distribution
Others – Retail SupplyRetail Supply ISL
RSL->IC | IC-> ISL with no
dissolving of PPAs
High Surplus Expensive IIITech – Distribution
Others – Retail SupplyRetail Supply All Suppliers
RSL->IC | IC->
Proportionate allocation with
some dissolving of PPAs
High Deficit Expensive Same as IITech – Distribution
Others – Retail SupplyRetail Supply ISL
RSL->IC | IC-> ISL with no
dissolving of PPAs
Low Surplus Cheaper IVCollection – Retail Supply
Other - DistributionDistribution All Suppliers
RSL->IC | IC->
Proportionate allocation with
some dissolving of PPAs
Low Deficit Cheaper VCollection – Retail Supply
Other - DistributionDistribution ISL
RSL->IC | IC-> ISL with no
dissolving of PPAs
Low Surplus Expensive Same as IVCollection – Retail Supply
Other - DistributionDistribution All Suppliers
RSL->IC | IC->
Proportionate allocation with
some Dissolving of PPAs
Low Deficit Expensive Same as VCollection – Retail Supply
Other - DistributionDistribution ISL
RSL->IC | IC-> ISL with no
dissolving of PPAs

PwC
10 June 2015
Roll out plan for scenario I (1/2)
13
Roll out plan for introduction of Competition in Retail sale of electricity • Final Presentation
Section 3 – Alternative roll out plans
(applicable in states with high levels of losses, surplus power and cheaper PPAs than market | Gujarat (PGVCL), Sikkim | Driving force for efficiency – Loss Reduction)
Distribution Business
Incumbent Supply Business (ISL)
New Retail Supply Business (RSL)
SLDC Intermediary Company (IC)
Universal Charge (UC) FundA UC fund will cover any revenue gap created due to tariff realignments as per cross subsidies reduction trajectory
Direct Government SubsidyThe State Government funds the gap between tariffs and cost of supply
or
Loss Allocation
Cross Subsidy
Technical Losses
Commercial Losses(Hooking, Inaccurate metering, Meter tampering/bypassing, collection inefficiency)Losses to be measured voltage wise
Cherry Picking Will not be an issue as cross subsidy and losses are taken care of as above
Phasing of competition
Based on Reducing Connected Load• Initially 1 MW and above• Later 100 kW and above• Further all consumers
USOFor all consumers For consumers open to
competition (as per phasing)
Regulatory Assets & losses
• Amortised using a Universal Charge (UC), or• Support from State Government, or• Hybrid approach of the two above methods
Regulatory Assets&Un-recognised financial losses
PPA Allocation• All PPAs are transferred
to IC• IC proportionately
allocates power between all suppliers based on consumer mix/load
• All suppliers mandatorily take power from allocated by IC
• For any remaining requirement they go to either wholesale market or enter into new PPAs
Initial level of losses (technical and commercial)to be estimated & factored in regulated tariffwith trajectory for reduction in subsequentyears. Loss reduction will be driver forefficiency in this plan.
Back
PwC
10 June 2015
Roll out plan for scenario I (2/2)
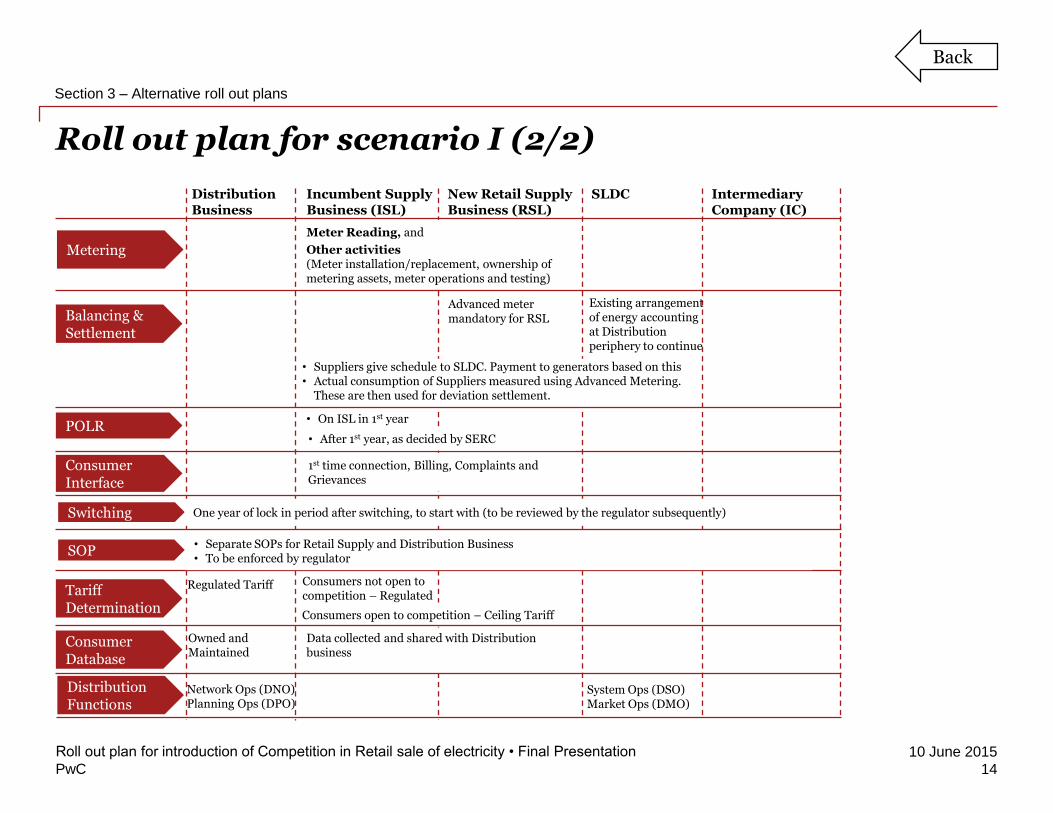
14
Roll out plan for introduction of Competition in Retail sale of electricity • Final Presentation
Section 3 – Alternative roll out plans
Metering
Meter Reading, and
Other activities(Meter installation/replacement, ownership of metering assets, meter operations and testing)
Balancing & Settlement
• Suppliers give schedule to SLDC. Payment to generators based on this• Actual consumption of Suppliers measured using Advanced Metering.
These are then used for deviation settlement.
Advanced meter mandatory for RSL
Existing arrangement of energy accounting at Distribution periphery to continue
POLR• On ISL in 1st year
Consumer Interface
1st time connection, Billing, Complaints and Grievances
Switching
SOP
Tariff Determination
Regulated Tariff
Consumers open to competition – Ceiling Tariff
One year of lock in period after switching, to start with (to be reviewed by the regulator subsequently)
• Separate SOPs for Retail Supply and Distribution Business• To be enforced by regulator
• After 1st year, as decided by SERC
Consumers not open to competition – Regulated
Consumer Database
Owned and Maintained
Data collected and shared with Distribution business
Distribution Functions
Network Ops (DNO)Planning Ops (DPO)
System Ops (DSO)Market Ops (DMO)
Distribution Business
Incumbent Supply Business (ISL)
New Retail Supply Business (RSL)
SLDC Intermediary Company (IC)
Back
PwC
10 June 2015
Roll out plan for scenario II (1/2)
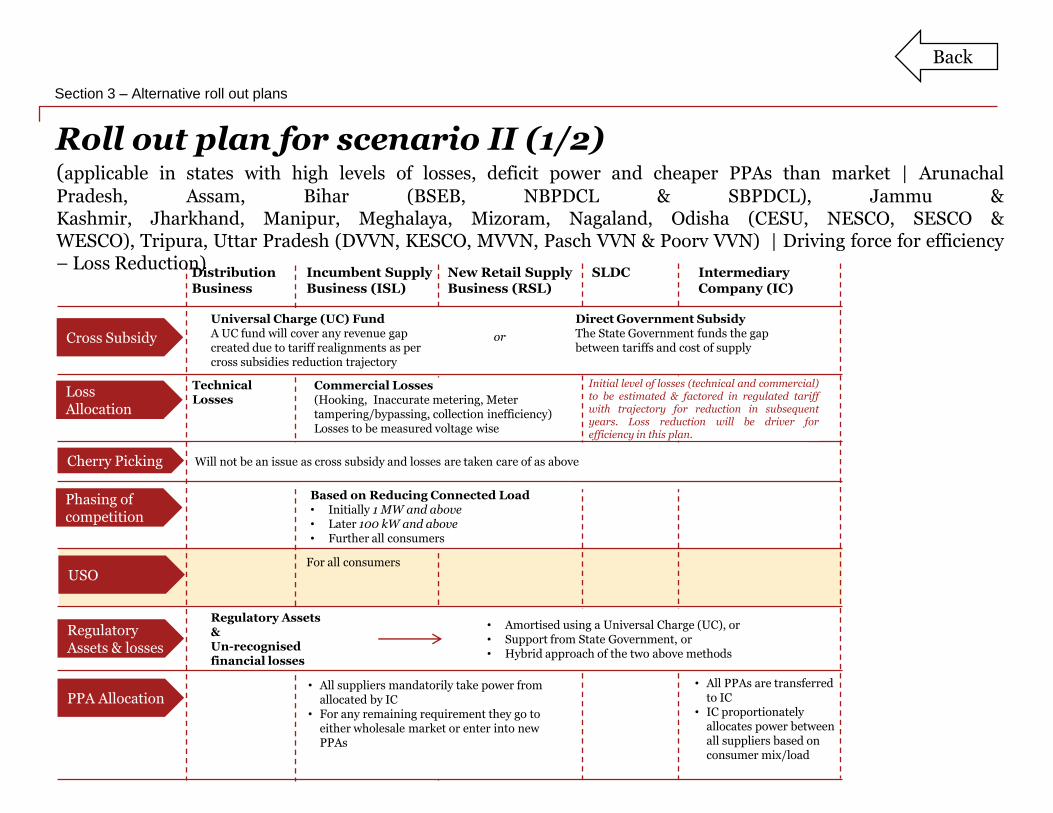
15
Roll out plan for introduction of Competition in Retail sale of electricity • Final Presentation
Section 3 – Alternative roll out plans
Distribution Business
Incumbent Supply Business (ISL)
New Retail Supply Business (RSL)
SLDC Intermediary Company (IC)
Universal Charge (UC) FundA UC fund will cover any revenue gap created due to tariff realignments as per cross subsidies reduction trajectory
Direct Government SubsidyThe State Government funds the gap between tariffs and cost of supply
or
Loss Allocation
Cross Subsidy
Technical Losses
Commercial Losses(Hooking, Inaccurate metering, Meter tampering/bypassing, collection inefficiency)Losses to be measured voltage wise
Cherry Picking Will not be an issue as cross subsidy and losses are taken care of as above
Phasing of competition
Based on Reducing Connected Load• Initially 1 MW and above• Later 100 kW and above• Further all consumers
USOFor all consumers
Regulatory Assets & losses
• Amortised using a Universal Charge (UC), or• Support from State Government, or• Hybrid approach of the two above methods
Regulatory Assets&Un-recognised financial losses
PPA Allocation• All PPAs are transferred
to IC• IC proportionately
allocates power between all suppliers based on consumer mix/load
• All suppliers mandatorily take power from allocated by IC
• For any remaining requirement they go to either wholesale market or enter into new PPAs
Initial level of losses (technical and commercial)to be estimated & factored in regulated tariffwith trajectory for reduction in subsequentyears. Loss reduction will be driver forefficiency in this plan.
(applicable in states with high levels of losses, deficit power and cheaper PPAs than market | Arunachal
Pradesh, Assam, Bihar (BSEB, NBPDCL & SBPDCL), Jammu &Kashmir, Jharkhand, Manipur, Meghalaya, Mizoram, Nagaland, Odisha (CESU, NESCO, SESCO &WESCO), Tripura, Uttar Pradesh (DVVN, KESCO, MVVN, Pasch VVN & Poorv VVN) | Driving force for efficiency– Loss Reduction)
Back
PwC
10 June 2015
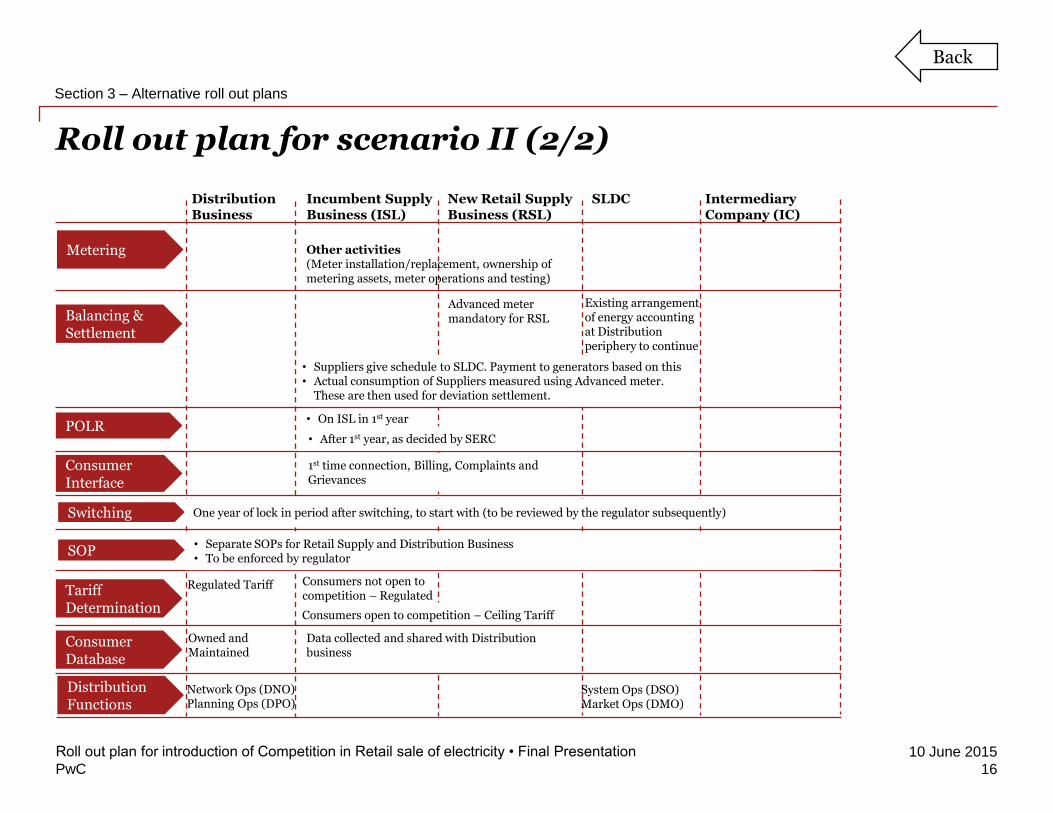
Roll out plan for scenario II (2/2)
16
Roll out plan for introduction of Competition in Retail sale of electricity • Final Presentation
Section 3 – Alternative roll out plans
Metering Other activities(Meter installation/replacement, ownership of metering assets, meter operations and testing)
Balancing & Settlement
• Suppliers give schedule to SLDC. Payment to generators based on this• Actual consumption of Suppliers measured using Advanced meter.
These are then used for deviation settlement.
Advanced meter mandatory for RSL
Existing arrangement of energy accounting at Distribution periphery to continue
POLR• On ISL in 1st year
Consumer Interface
1st time connection, Billing, Complaints and Grievances
Switching
SOP
Tariff Determination
Regulated Tariff
Consumers open to competition – Ceiling Tariff
One year of lock in period after switching, to start with (to be reviewed by the regulator subsequently)
• Separate SOPs for Retail Supply and Distribution Business• To be enforced by regulator
• After 1st year, as decided by SERC
Consumers not open to competition – Regulated
Consumer Database
Owned and Maintained
Data collected and shared with Distribution business
Distribution Functions
Network Ops (DNO)Planning Ops (DPO)
System Ops (DSO)Market Ops (DMO)
Distribution Business
Incumbent Supply Business (ISL)
New Retail Supply Business (RSL)
SLDC Intermediary Company (IC)
Back

PwC
10 June 2015
Roll out plan for scenario III (1/2)
17
Roll out plan for introduction of Competition in Retail sale of electricity • Final Presentation
Section 3 – Alternative roll out plans
Distribution Business
Incumbent Supply Business (ISL)
New Retail Supply Business (RSL)
SLDC Intermediary Company (IC)
Universal Charge (UC) FundA UC fund will cover any revenue gap created due to tariff realignments as per cross subsidies reduction trajectory
Direct Government SubsidyThe State Government funds the gap between tariffs and cost of supply
or
Loss Allocation
Cross Subsidy
Technical Losses
Commercial Losses(Hooking, Inaccurate metering, Meter tampering/bypassing, collection inefficiency)Losses to be measured voltage wise
Cherry Picking Will not be an issue as cross subsidy and losses are taken care of as above
Phasing of competition
Based on Reducing Connected Load• Initially 1 MW and above• Later 100 kW and above• Further all consumers
USOFor all consumers For consumers open to
competition (as per phasing)
Regulatory Assets & losses
• Amortised using a Universal Charge (UC), or• Support from State Government, or• Hybrid approach of the two above methods
Regulatory Assets&Un-recognised financial losses
PPA Allocation• Some older PPAs are
dissolved, rest transferred to IC
• IC proportionately allocates power between all suppliers based on consumer mix/load
• All suppliers mandatorily take power from allocated by IC
• For any remaining requirement they go to either wholesale market or enter into new PPAs
Initial level of losses (technical and commercial)to be estimated & factored in regulated tariffwith trajectory for reduction in subsequentyears. Loss reduction will be driver forefficiency in this plan.
(applicable in states with high levels of losses, surplus power and expensive PPAs than market | Haryana(UHBVNL), Madhya Pradesh (Madhya, Paschim & Purv Kshetra VVCL), West Bengal| Driving force for efficiency– Loss Reduction)
Back
PwC
10 June 2015
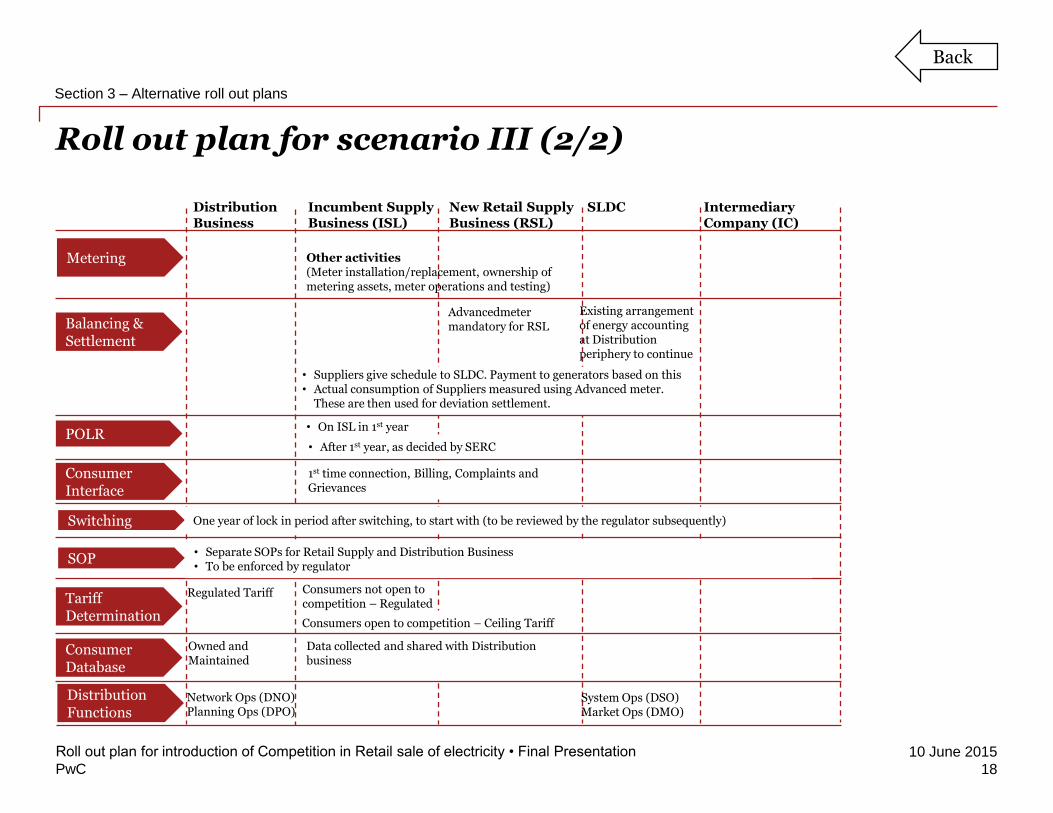
Roll out plan for scenario III (2/2)
18
Roll out plan for introduction of Competition in Retail sale of electricity • Final Presentation
Section 3 – Alternative roll out plans
Metering Other activities(Meter installation/replacement, ownership of metering assets, meter operations and testing)
Balancing & Settlement
• Suppliers give schedule to SLDC. Payment to generators based on this• Actual consumption of Suppliers measured using Advanced meter.
These are then used for deviation settlement.
Advancedmetermandatory for RSL
Existing arrangement of energy accounting at Distribution periphery to continue
POLR• On ISL in 1st year
Consumer Interface
1st time connection, Billing, Complaints and Grievances
Switching
SOP
Tariff Determination
Regulated Tariff
Consumers open to competition – Ceiling Tariff
One year of lock in period after switching, to start with (to be reviewed by the regulator subsequently)
• Separate SOPs for Retail Supply and Distribution Business• To be enforced by regulator
• After 1st year, as decided by SERC
Consumers not open to competition – Regulated
Consumer Database
Owned and Maintained
Data collected and shared with Distribution business
Distribution Functions
Network Ops (DNO)Planning Ops (DPO)
System Ops (DSO)Market Ops (DMO)
Distribution Business
Incumbent Supply Business (ISL)
New Retail Supply Business (RSL)
SLDC Intermediary Company (IC)
Back
PwC
10 June 2015
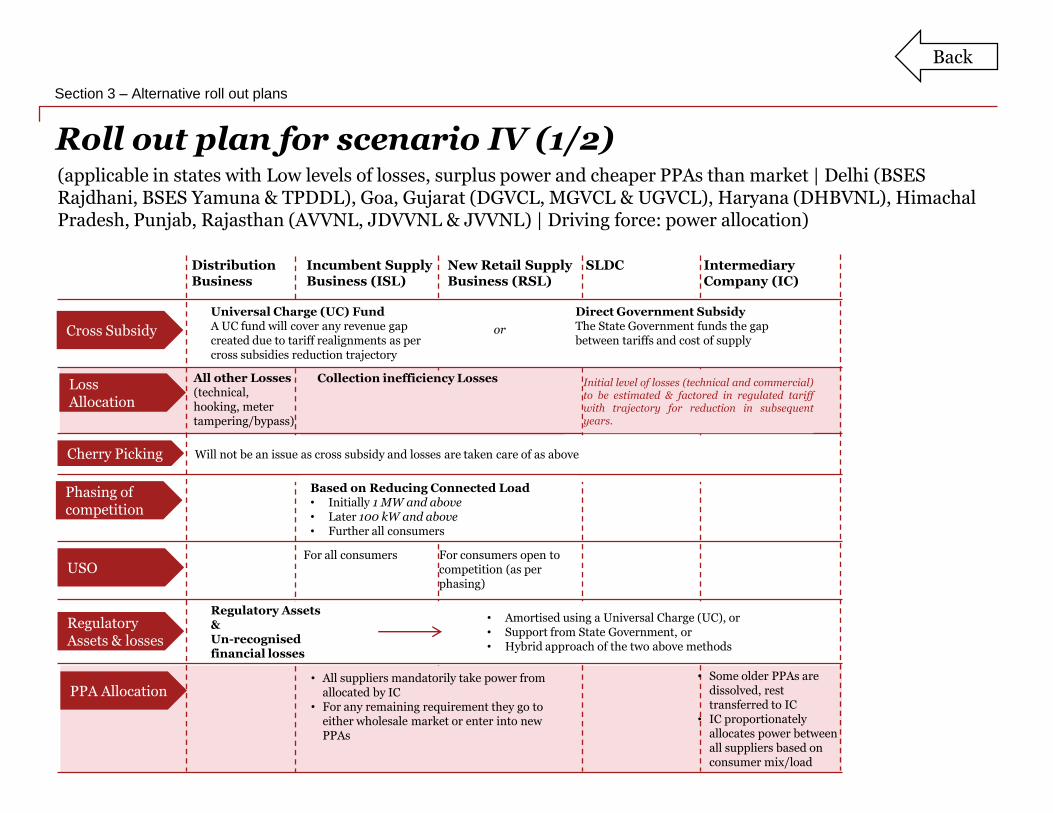
Roll out plan for scenario IV (1/2)
19
Roll out plan for introduction of Competition in Retail sale of electricity • Final Presentation
Section 3 – Alternative roll out plans
Distribution Business
Incumbent Supply Business (ISL)
New Retail Supply Business (RSL)
SLDC Intermediary Company (IC)
Universal Charge (UC) FundA UC fund will cover any revenue gap created due to tariff realignments as per cross subsidies reduction trajectory
Direct Government SubsidyThe State Government funds the gap between tariffs and cost of supply
or
Loss Allocation
Cross Subsidy
All other Losses (technical, hooking, meter tampering/bypass)
Collection inefficiency Losses
Cherry Picking Will not be an issue as cross subsidy and losses are taken care of as above
Phasing of competition
Based on Reducing Connected Load• Initially 1 MW and above• Later 100 kW and above• Further all consumers
USOFor all consumers For consumers open to
competition (as per phasing)
Regulatory Assets & losses
• Amortised using a Universal Charge (UC), or• Support from State Government, or• Hybrid approach of the two above methods
Regulatory Assets&Un-recognised financial losses
PPA Allocation• Some older PPAs are
dissolved, rest transferred to IC
• IC proportionately allocates power between all suppliers based on consumer mix/load
• All suppliers mandatorily take power from allocated by IC
• For any remaining requirement they go to either wholesale market or enter into new PPAs
Initial level of losses (technical and commercial)to be estimated & factored in regulated tariffwith trajectory for reduction in subsequentyears.
(applicable in states with Low levels of losses, surplus power and cheaper PPAs than market | Delhi (BSES Rajdhani, BSES Yamuna & TPDDL), Goa, Gujarat (DGVCL, MGVCL & UGVCL), Haryana (DHBVNL), Himachal Pradesh, Punjab, Rajasthan (AVVNL, JDVVNL & JVVNL) | Driving force: power allocation)
Back
PwC
10 June 2015
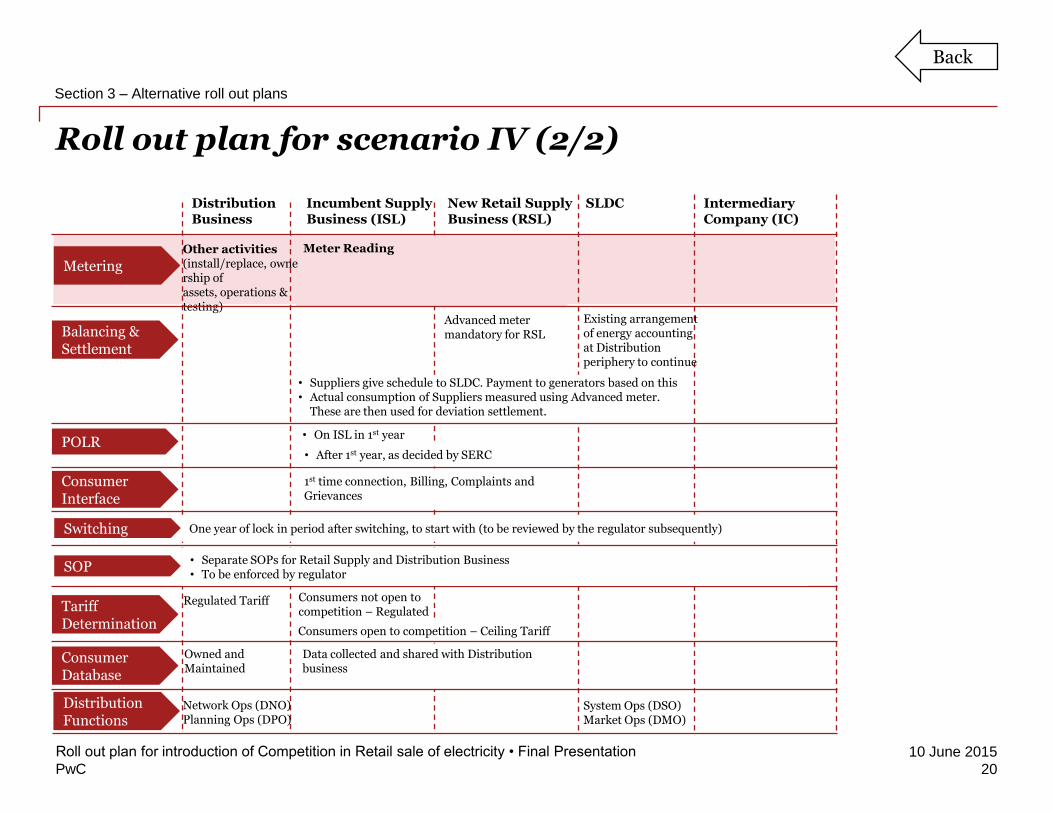
Roll out plan for scenario IV (2/2)
20
Roll out plan for introduction of Competition in Retail sale of electricity • Final Presentation
Section 3 – Alternative roll out plans
Metering
Meter ReadingOther activities(install/replace, ownership of assets, operations & testing)
Balancing & Settlement
• Suppliers give schedule to SLDC. Payment to generators based on this• Actual consumption of Suppliers measured using Advanced meter.
These are then used for deviation settlement.
Advanced meter mandatory for RSL
Existing arrangement of energy accounting at Distribution periphery to continue
POLR• On ISL in 1st year
Consumer Interface
1st time connection, Billing, Complaints and Grievances
Switching
SOP
Tariff Determination
Regulated Tariff
Consumers open to competition – Ceiling Tariff
One year of lock in period after switching, to start with (to be reviewed by the regulator subsequently)
• Separate SOPs for Retail Supply and Distribution Business• To be enforced by regulator
• After 1st year, as decided by SERC
Consumers not open to competition – Regulated
Consumer Database
Owned and Maintained
Data collected and shared with Distribution business
Distribution Functions
Network Ops (DNO)Planning Ops (DPO)
System Ops (DSO)Market Ops (DMO)
Distribution Business
Incumbent Supply Business (ISL)
New Retail Supply Business (RSL)
SLDC Intermediary Company (IC)
Back
PwC
10 June 2015
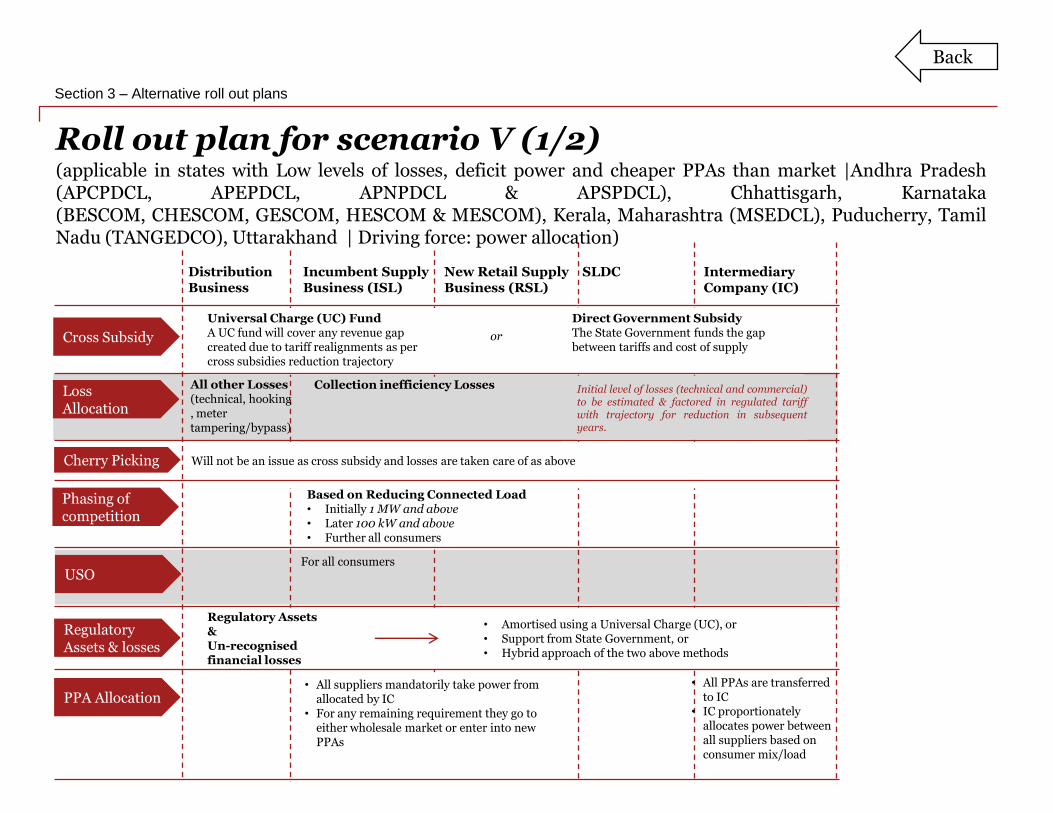
Roll out plan for scenario V (1/2)
21
Roll out plan for introduction of Competition in Retail sale of electricity • Final Presentation
Section 3 – Alternative roll out plans
Distribution Business
Incumbent Supply Business (ISL)
New Retail Supply Business (RSL)
SLDC Intermediary Company (IC)
Universal Charge (UC) FundA UC fund will cover any revenue gap created due to tariff realignments as per cross subsidies reduction trajectory
Direct Government SubsidyThe State Government funds the gap between tariffs and cost of supply
or
Loss Allocation
Cross Subsidy
Cherry Picking Will not be an issue as cross subsidy and losses are taken care of as above
Phasing of competition
Based on Reducing Connected Load• Initially 1 MW and above• Later 100 kW and above• Further all consumers
USOFor all consumers
Regulatory Assets & losses
• Amortised using a Universal Charge (UC), or• Support from State Government, or• Hybrid approach of the two above methods
Regulatory Assets&Un-recognised financial losses
PPA Allocation• All PPAs are transferred
to IC• IC proportionately
allocates power between all suppliers based on consumer mix/load
• All suppliers mandatorily take power from allocated by IC
• For any remaining requirement they go to either wholesale market or enter into new PPAs
Initial level of losses (technical and commercial)to be estimated & factored in regulated tariffwith trajectory for reduction in subsequentyears.
All other Losses (technical, hooking, meter tampering/bypass)
Collection inefficiency Losses
(applicable in states with Low levels of losses, deficit power and cheaper PPAs than market |Andhra Pradesh(APCPDCL, APEPDCL, APNPDCL & APSPDCL), Chhattisgarh, Karnataka(BESCOM, CHESCOM, GESCOM, HESCOM & MESCOM), Kerala, Maharashtra (MSEDCL), Puducherry, TamilNadu (TANGEDCO), Uttarakhand | Driving force: power allocation)
Back
PwC
10 June 2015
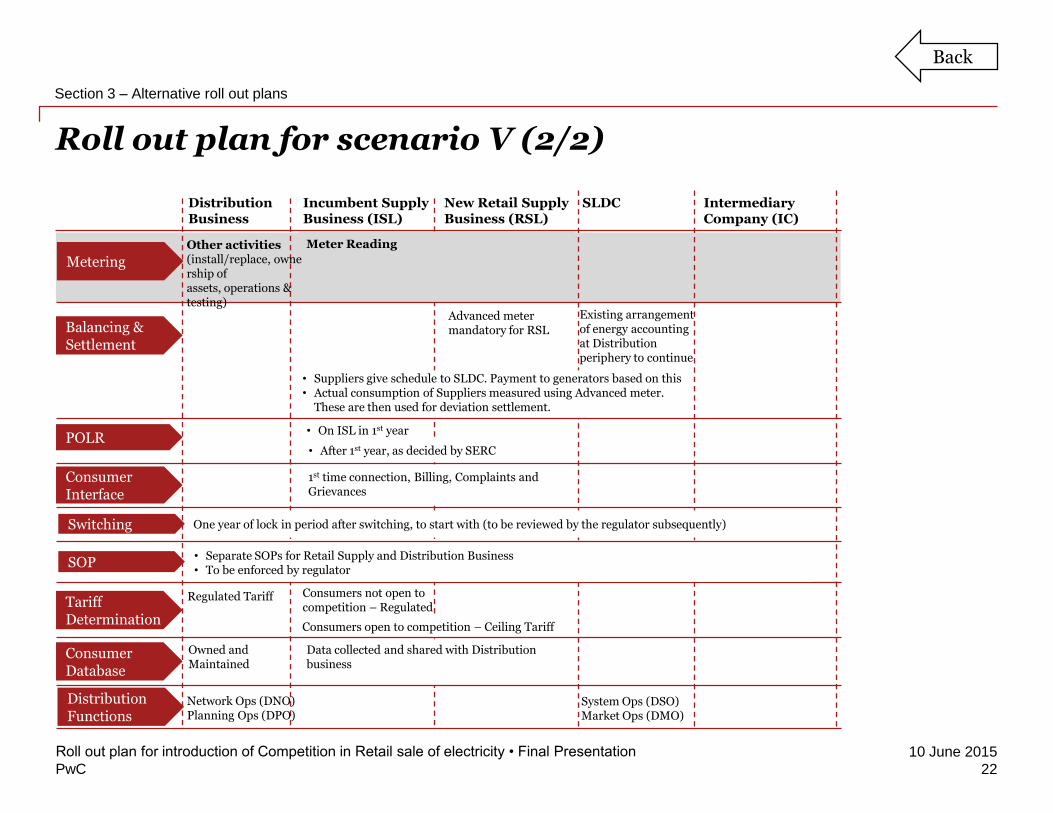
Roll out plan for scenario V (2/2)
22
Roll out plan for introduction of Competition in Retail sale of electricity • Final Presentation
Section 3 – Alternative roll out plans
Metering
Meter Reading
Balancing & Settlement
• Suppliers give schedule to SLDC. Payment to generators based on this• Actual consumption of Suppliers measured using Advanced meter.
These are then used for deviation settlement.
Advanced meter mandatory for RSL
Existing arrangement of energy accounting at Distribution periphery to continue
POLR• On ISL in 1st year
Consumer Interface
1st time connection, Billing, Complaints and Grievances
Switching
SOP
Tariff Determination
Regulated Tariff
Consumers open to competition – Ceiling Tariff
One year of lock in period after switching, to start with (to be reviewed by the regulator subsequently)
• Separate SOPs for Retail Supply and Distribution Business• To be enforced by regulator
• After 1st year, as decided by SERC
Consumers not open to competition – Regulated
Consumer Database
Owned and Maintained
Data collected and shared with Distribution business
Distribution Functions
Network Ops (DNO)Planning Ops (DPO)
System Ops (DSO)Market Ops (DMO)
Other activities(install/replace, ownership of assets, operations & testing)
Distribution Business
Incumbent Supply Business (ISL)
New Retail Supply Business (RSL)
SLDC Intermediary Company (IC)
Back
Thank you
This publication has been prepared for general guidance on matters of interest only, and does not constitute professional advice. You should not act upon the
information contained in this publication without obtaining specific professional advice. No representation or warranty (express or implied) is given as to the
accuracy or completeness of the information contained in this publication, and, to the extent permitted by law, PricewaterhouseCoopers Pvt. Ltd., its
members, employees and agents do not accept or assume any liability, responsibility or duty of care for any consequences of you or anyone else acting, or
refraining to act, in reliance on the information contained in this publication or for any decision based on it.
©2015 PricewaterhouseCoopers Pvt. Ltd. All rights reserved. In this document, “PwC” refers to PricewaterhouseCoopers Pvt. Ltd. which is a member firm of
PricewaterhouseCoopers International Limited, each member firm of which is a separate legal entity.
PwC
10 June 2015
Major Issues
23
Roll out plan for introduction of Competition in Retail sale of electricity • Final Presentation
PwC
10 June 2015
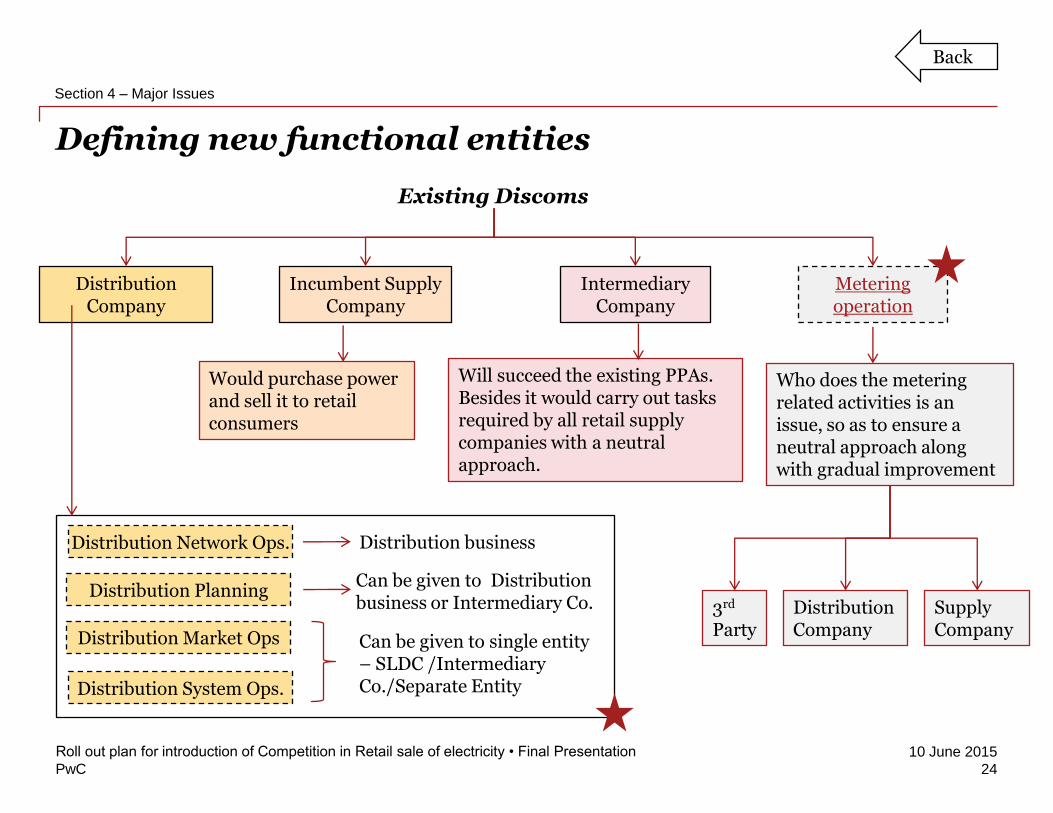
Defining new functional entities
24
Roll out plan for introduction of Competition in Retail sale of electricity • Final Presentation
Section 4 – Major Issues
Incumbent Supply Company
Intermediary Company
Metering operation
Would purchase power and sell it to retail consumers
Will succeed the existing PPAs. Besides it would carry out tasks required by all retail supply companies with a neutral approach.
Who does the metering related activities is an issue, so as to ensure a neutral approach along with gradual improvement
3rd
PartyDistribution Company
Supply Company
Distribution System Ops.
Distribution Market Ops
Distribution Planning
Distribution Network Ops. Distribution business
Can be given to single entity – SLDC /Intermediary Co./Separate Entity
Existing Discoms
Distribution Company
Back
Can be given to Distribution business or Intermediary Co.

PwC
10 June 2015
Reduction of Cross Subsidies (1/2)
25
Roll out plan for introduction of Competition in Retail sale of electricity • Final Presentation
Section 4 – Major Issues
CoS Tariff CoS Tariff
Agricultural Consumers(subsidised)
IndustrialConsumers(subsidising)
Wheeling tariff
Approaches to negate effect of cross subsidies -
1. Y-o-Y tariff hikes –Tariff hikeTariff matched with CoS
2. UC Charge –Uniform non by-passable charge on all consumersFund created from this charge used to revenue-cost gap
3. Limit subsidies to wheeling charge –
Makes a level playing field for all retail suppliers
4. Direct subsidy –State Government directly funds the gap between CoSand Tariff
Back
PwC
10 June 2015
Reduction of Cross Subsidies (2/2)
26
Roll out plan for introduction of Competition in Retail sale of electricity • Final Presentation
Section 4 – Major Issues
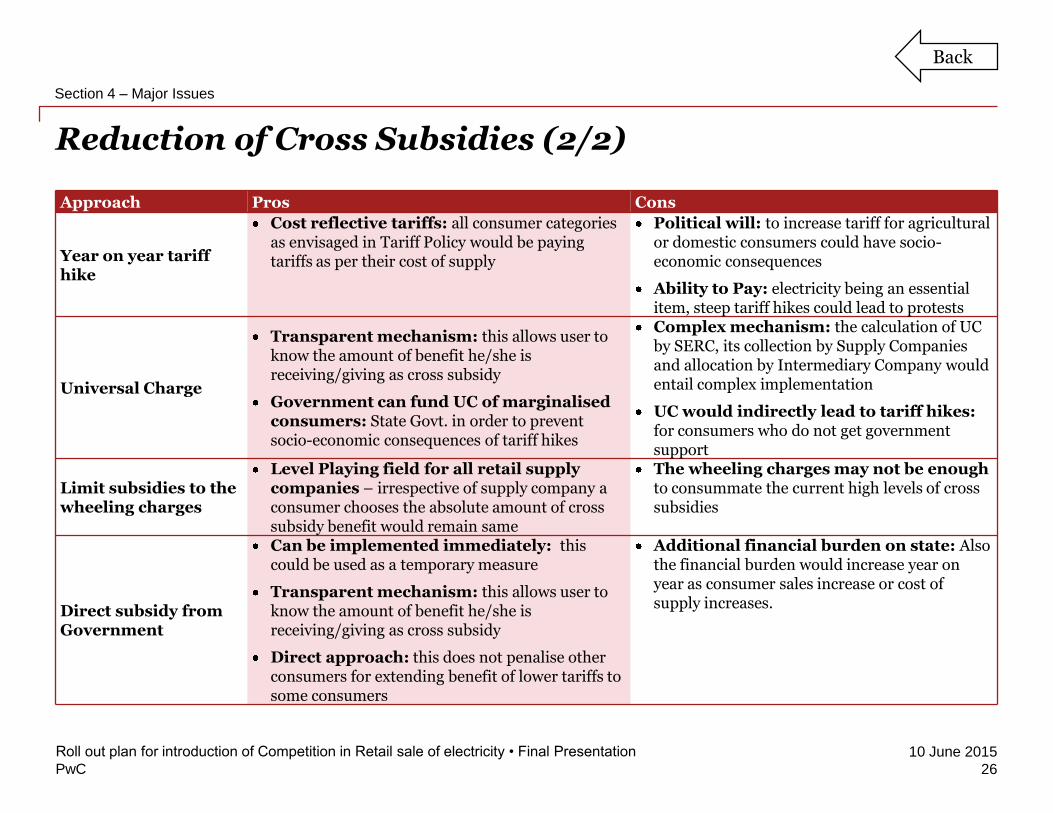
Approach Pros Cons
Year on year tariff hike
Cost reflective tariffs: all consumer categories as envisaged in Tariff Policy would be paying tariffs as per their cost of supply
Political will: to increase tariff for agricultural or domestic consumers could have socio-economic consequences
Ability to Pay: electricity being an essential item, steep tariff hikes could lead to protests
Universal Charge
Transparent mechanism: this allows user to know the amount of benefit he/she is receiving/giving as cross subsidy
Government can fund UC of marginalised consumers: State Govt. in order to prevent socio-economic consequences of tariff hikes
Complex mechanism: the calculation of UC by SERC, its collection by Supply Companies and allocation by Intermediary Company would entail complex implementation
UC would indirectly lead to tariff hikes:for consumers who do not get government support
Limit subsidies to the wheeling charges
Level Playing field for all retail supply companies – irrespective of supply company a consumer chooses the absolute amount of cross subsidy benefit would remain same
The wheeling charges may not be enoughto consummate the current high levels of cross subsidies
Direct subsidy from Government
Can be implemented immediately: this could be used as a temporary measure
Transparent mechanism: this allows user to know the amount of benefit he/she is receiving/giving as cross subsidy
Direct approach: this does not penalise other consumers for extending benefit of lower tariffs to some consumers
Additional financial burden on state: Also the financial burden would increase year on year as consumer sales increase or cost of supply increases.
Back
PwC
10 June 2015
Allocation of technical and commercial losses
27
Roll out plan for introduction of Competition in Retail sale of electricity • Final Presentation
Section 4 – Major Issues
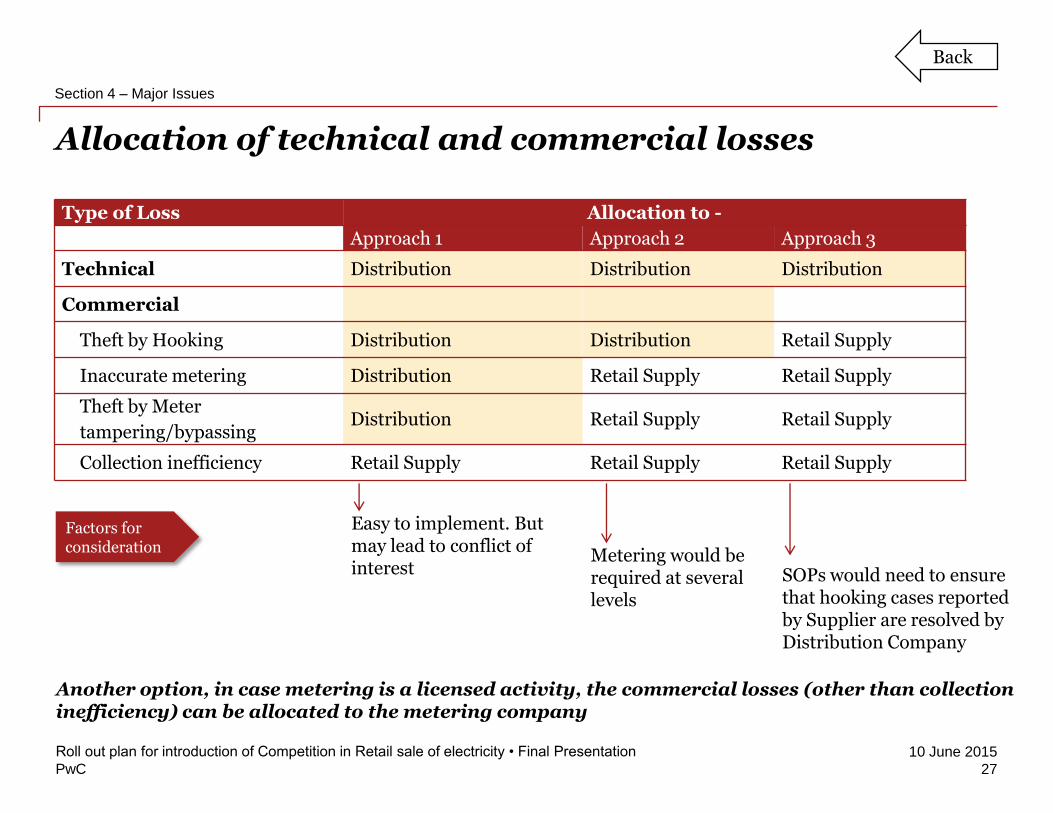
Type of Loss Allocation to -
Approach 1 Approach 2 Approach 3
Technical Distribution Distribution Distribution
Commercial
Theft by Hooking Distribution Distribution Retail Supply
Inaccurate metering Distribution Retail Supply Retail Supply
Theft by Meter
tampering/bypassingDistribution Retail Supply Retail Supply
Collection inefficiency Retail Supply Retail Supply Retail Supply
Metering would be required at several levels
SOPs would need to ensure that hooking cases reported by Supplier are resolved by Distribution Company
Easy to implement. But may lead to conflict of interest
Factors for consideration
Another option, in case metering is a licensed activity, the commercial losses (other than collection inefficiency) can be allocated to the metering company
Back
PwC
10 June 2015
Universal Service Obligation (1/3)
28
Roll out plan for introduction of Competition in Retail sale of electricity • Final Presentation
Section 4 – Major Issues
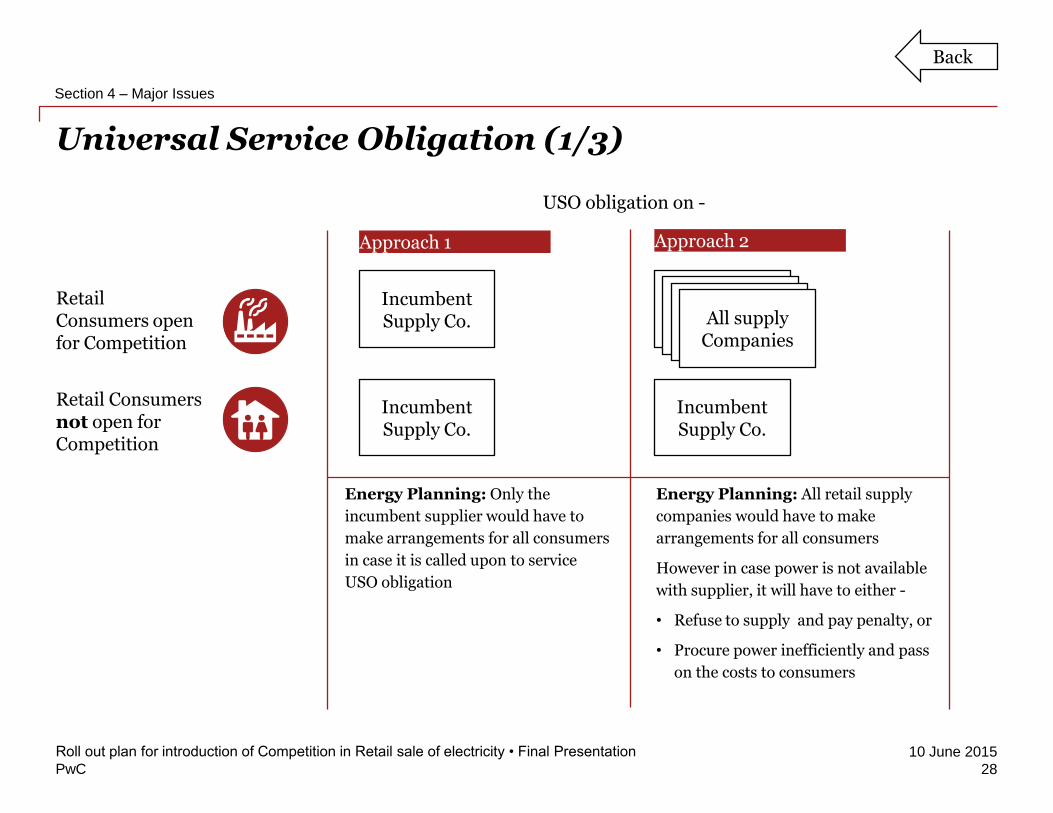
Retail Consumers open for Competition
Retail Consumers not open for Competition
Approach 1 Approach 2
Incumbent Supply Co.
Incumbent Supply Co.Incumbent Supply Co.Incumbent Supply Co.
All supply Companies
Incumbent Supply Co.
Incumbent Supply Co.
USO obligation on -
Energy Planning: Only the
incumbent supplier would have to
make arrangements for all consumers
in case it is called upon to service
USO obligation
Energy Planning: All retail supply
companies would have to make
arrangements for all consumers
However in case power is not available
with supplier, it will have to either -
• Refuse to supply and pay penalty, or
• Procure power inefficiently and pass
on the costs to consumers
Back
PwC
10 June 2015
Universal Service Obligation (2/3)
29
Roll out plan for introduction of Competition in Retail sale of electricity • Final Presentation
Section 4 – Major Issues
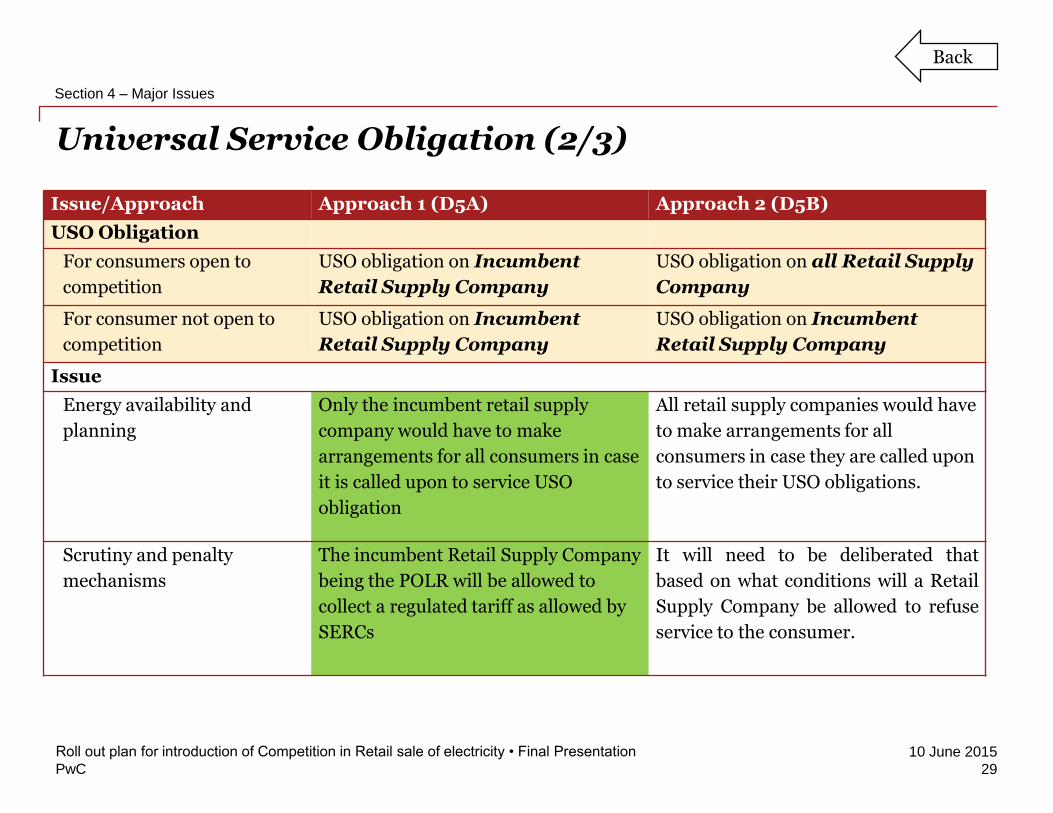
Issue/Approach Approach 1 (D5A) Approach 2 (D5B)
USO Obligation
For consumers open to
competition
USO obligation on Incumbent
Retail Supply Company
USO obligation on all Retail Supply
Company
For consumer not open to
competition
USO obligation on Incumbent
Retail Supply Company
USO obligation on Incumbent
Retail Supply Company
Issue
Energy availability and
planning
Only the incumbent retail supply
company would have to make
arrangements for all consumers in case
it is called upon to service USO
obligation
All retail supply companies would have
to make arrangements for all
consumers in case they are called upon
to service their USO obligations.
Scrutiny and penalty
mechanisms
The incumbent Retail Supply Company
being the POLR will be allowed to
collect a regulated tariff as allowed by
SERCs
It will need to be deliberated that
based on what conditions will a Retail
Supply Company be allowed to refuse
service to the consumer.
Back

PwC
10 June 2015
Universal Service Obligation (3/3)
30
Roll out plan for introduction of Competition in Retail sale of electricity • Final Presentation
Section 4 – Major Issues
Discom 1
Discom 2
Supply Co. 1
Distribution Co. 1
Supply Co. 2
Distribution Co. 2
Supply Co. 1
Single Distribution
Co. Supply Co. 2
Electricity (Amendment) Bill, 2014 is passed
Functional separation of Discoms achieved
As decided by Appropriate Commission, Single Distribution Co. is achieved
Deliberation required for deciding who gets DUTY TO CONNECT during this period
In areas like Mumbai wherein multiple Distribution Companies exist, it needs to be deliberated whether
• Which one of them would divest their network assets so as to ensure there is a single Distribution network provider in any area of supply
• Who would get the ‘Duty to Connect’ under USO obligation
Back
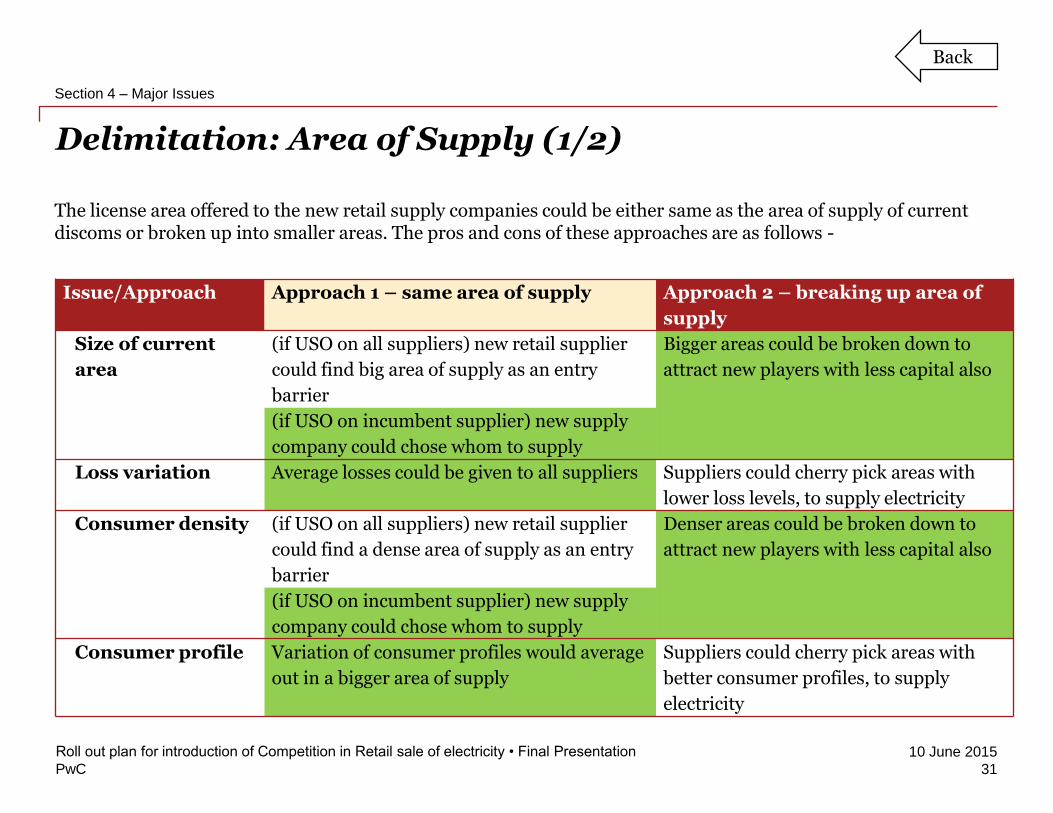
PwC
10 June 2015
Delimitation: Area of Supply (1/2)
31
Roll out plan for introduction of Competition in Retail sale of electricity • Final Presentation
Section 4 – Major Issues
Issue/Approach Approach 1 – same area of supply Approach 2 – breaking up area of
supply
Size of current
area
(if USO on all suppliers) new retail supplier
could find big area of supply as an entry
barrier
Bigger areas could be broken down to
attract new players with less capital also
(if USO on incumbent supplier) new supply
company could chose whom to supply
Loss variation Average losses could be given to all suppliers Suppliers could cherry pick areas with
lower loss levels, to supply electricity
Consumer density (if USO on all suppliers) new retail supplier
could find a dense area of supply as an entry
barrier
Denser areas could be broken down to
attract new players with less capital also
(if USO on incumbent supplier) new supply
company could chose whom to supply
Consumer profile Variation of consumer profiles would average
out in a bigger area of supply
Suppliers could cherry pick areas with
better consumer profiles, to supply
electricity
The license area offered to the new retail supply companies could be either same as the area of supply of current discoms or broken up into smaller areas. The pros and cons of these approaches are as follows -
Back

PwC
10 June 2015
Delimitation: Phasing (2/2)
32
Roll out plan for introduction of Competition in Retail sale of electricity • Final Presentation
Section 4 – Major Issues
Approach Pros Cons
Increasing connected load
Greater efficiency: since consumer with smaller load may have max contribution to losses
• Difficulty in implementation
• Nonstarter for reforms: new supply companies could find this proposition not attractive enough
• Switching costs
Decreasing connected load
• Early adaptors: Consumers with large loads are more likely to take advantage of retail supply competition
• Starter for Reforms: Lower losses among large consumers would be incentive for suppliers
Cherry Picking: In case situations of cross subsidies and loss levels are not improved, good consumers of existing supply companies could migrate
Increasing annual consumption
Greater efficiency: consumer with lower sales may have max contribution to losses
• Changing consumption patterns: inc/dec of energy consumption could pose difficulties
• Difficulty in implementation
• Nonstarter for reforms: new supply companies could find this proposition not attractive enough
• Switching costs
Decreasing annual consumption
Early adaptors: Consumers with large loads are more likely to take advantage of retail supply competition
Changing consumption patterns: inc/dec of energy consumption could pose difficulties
Area of sales Areas with lower losses could be opened to competition first to attract new supply co. or vice versa
Pilot scheme could be introduced in some areas
Determination of area wise losses and allocation between retail supply companies would be an issue
Consumercategories
Categories with lower losses could be opened to competition first to attract new suppliers or vice versa
Determination and allocation of consumer category wise losses would be an issue
Back
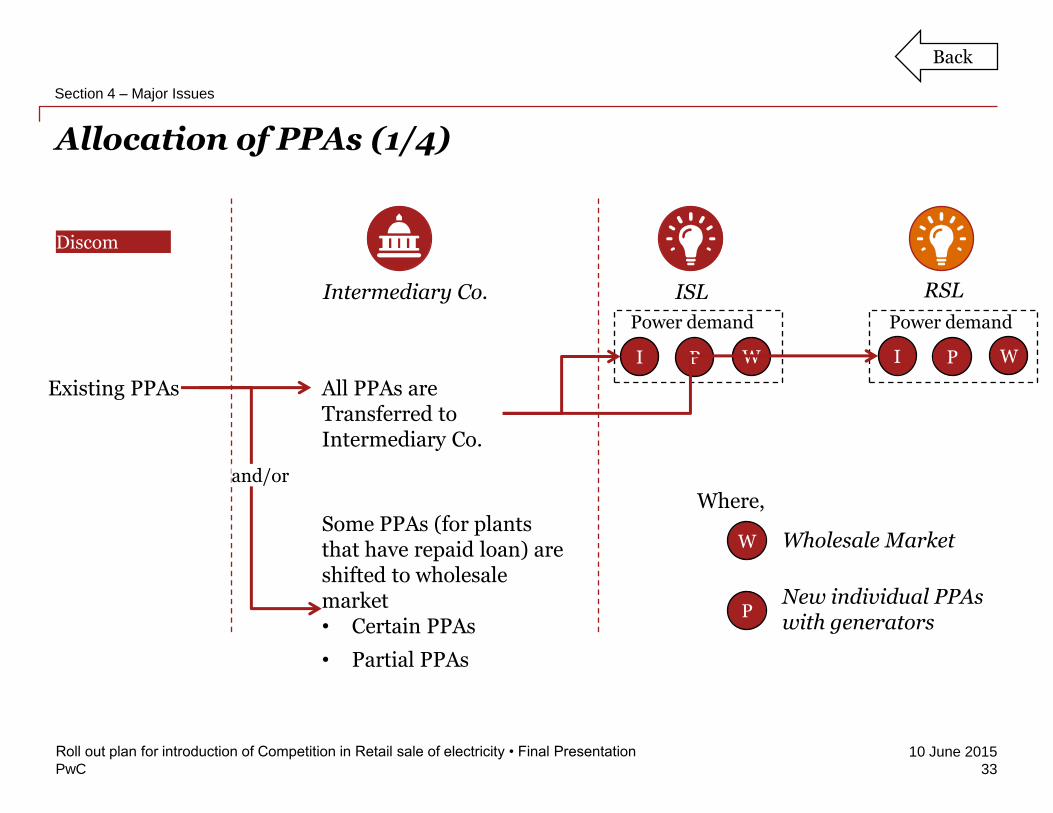
PwC
10 June 2015
Allocation of PPAs (1/4)
33
Roll out plan for introduction of Competition in Retail sale of electricity • Final Presentation
Section 4 – Major Issues
Discom
ISL RSLIntermediary Co.
Existing PPAs All PPAs are Transferred to Intermediary Co.
Some PPAs (for plants that have repaid loan) are shifted to wholesale market• Certain PPAs
• Partial PPAs
and/or
W
P
Wholesale Market
Power demand Power demand
I P W I P W
New individual PPAs with generators
Where,
Back

PwC
10 June 2015
Allocation of PPAs (2/4)
34
Roll out plan for introduction of Competition in Retail sale of electricity • Final Presentation
Section 4 – Major Issues
Approach Pros Cons
Transfer all PPAs to
Intermediary Company
Existing contacts between generators and
discoms to continue with both parties
getting long term financial certainty
Hampers development of wholesale
market due to lesser unavailability of
un-tied power
Expensive PPAs due to increased cost
pass through could leave retail supply
companies un-competitive
Transfer certain PPAs to
Intermediary Company
Helps in development of wholesale market
Select expensive PPAs or PPAs where loan
has been repaid could be dissolved
A mechanism would have to be
developed to select PPAs to be
dissolved. The mechanism needs to be
objective, transparent and acceptable
to all stakeholders including lenders.
Transfer partial PPAs to
Intermediary Company
Easy to implement. Leaves no subjectivity
in the hands of Intermediary Company to
select PPAs to be dissolved
This approach could not go well with
financial institutions which use PPAs
as securities against loan to generators
Separate percentages (for part of PPA
to be dissolved) could need to be
devised for different types of
generation plants with different age
Back
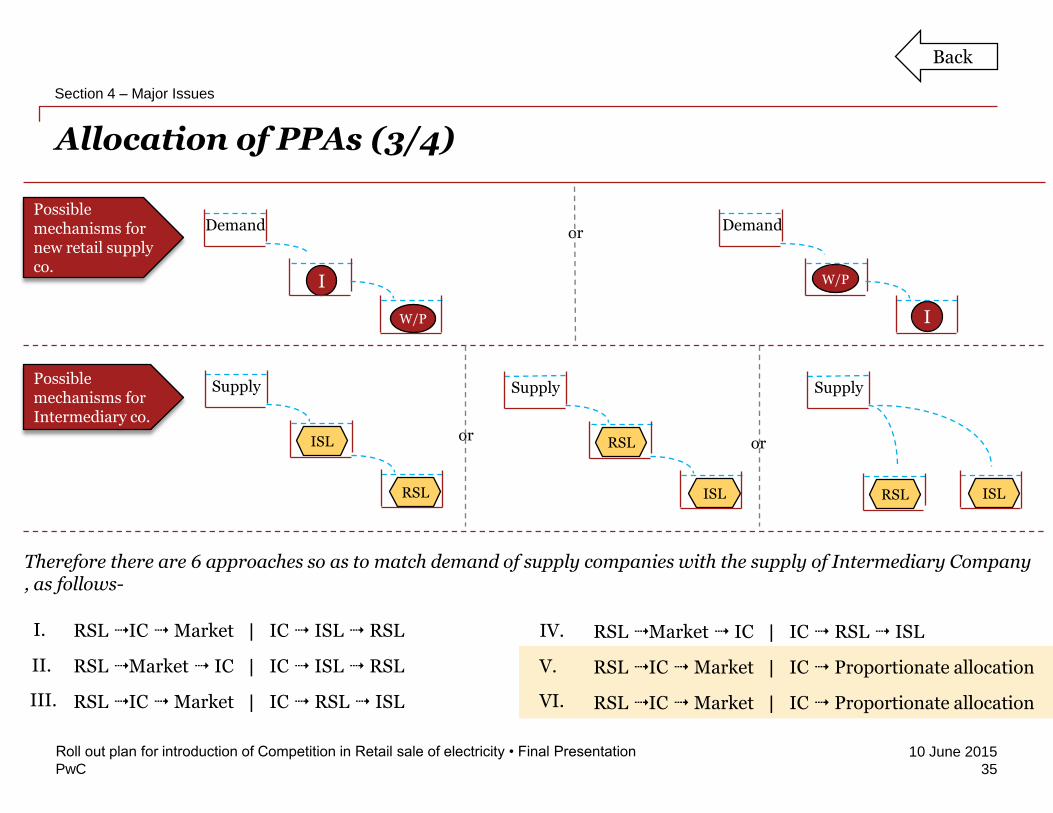
PwC
10 June 2015
Allocation of PPAs (3/4)
35
Roll out plan for introduction of Competition in Retail sale of electricity • Final Presentation
Section 4 – Major Issues
Possible mechanisms for new retail supply co.
Demand
I
W/P
or
Possible mechanisms for Intermediary co.
ISL
RSL
oror
Supply
RSL
ISL
Supply Supply
RSL ISL
Demand
I
W/P
Therefore there are 6 approaches so as to match demand of supply companies with the supply of Intermediary Company , as follows-
RSL 4 IC 4 Market | IC 4 ISL 4 RSL
RSL 4 Market 4 IC | IC 4 ISL 4 RSL
RSL 4 IC 4 Market | IC 4 RSL 4 ISL
RSL 4 Market 4 IC | IC 4 RSL 4 ISL
RSL 4 IC 4 Market | IC 4 Proportionate allocation
RSL 4 IC 4 Market | IC 4 Proportionate allocation
I.
II.
III.
IV.
V.
VI.
Back
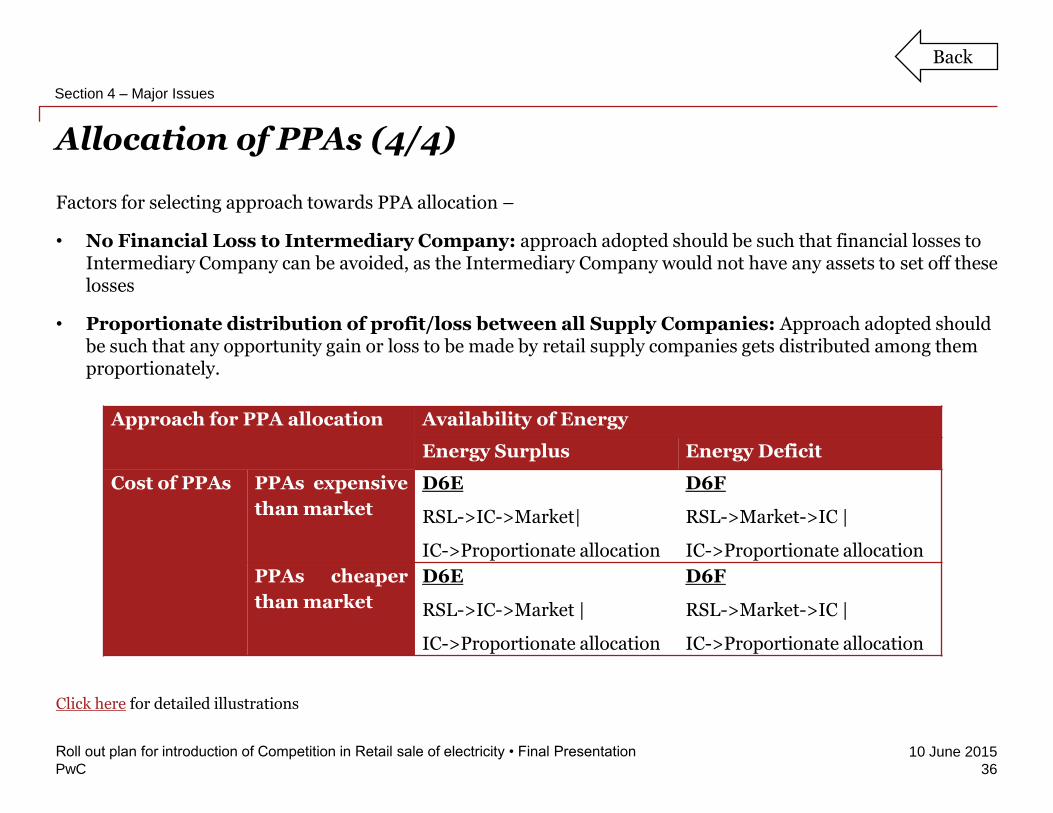
PwC
10 June 2015
Allocation of PPAs (4/4)
36
Roll out plan for introduction of Competition in Retail sale of electricity • Final Presentation
Section 4 – Major Issues
Factors for selecting approach towards PPA allocation –
• No Financial Loss to Intermediary Company: approach adopted should be such that financial losses to Intermediary Company can be avoided, as the Intermediary Company would not have any assets to set off these losses
• Proportionate distribution of profit/loss between all Supply Companies: Approach adopted should be such that any opportunity gain or loss to be made by retail supply companies gets distributed among them proportionately.
Approach for PPA allocation Availability of Energy
Energy Surplus Energy Deficit
Cost of PPAs PPAs expensive
than market
D6E
RSL->IC->Market|
IC->Proportionate allocation
D6F
RSL->Market->IC |
IC->Proportionate allocation
PPAs cheaper
than market
D6E
RSL->IC->Market |
IC->Proportionate allocation
D6F
RSL->Market->IC |
IC->Proportionate allocation
Back
Click here for detailed illustrations
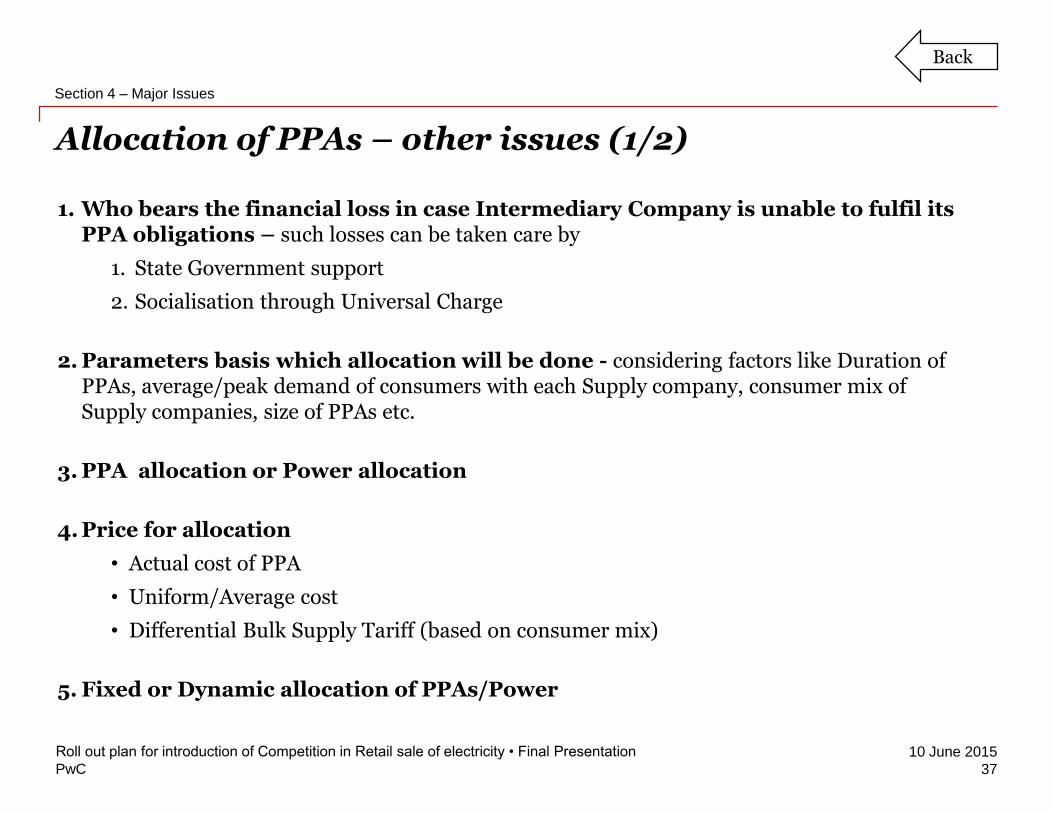
PwC
10 June 2015
Allocation of PPAs – other issues (1/2)
37
Roll out plan for introduction of Competition in Retail sale of electricity • Final Presentation
Section 4 – Major Issues
1. Who bears the financial loss in case Intermediary Company is unable to fulfil its PPA obligations – such losses can be taken care by
1. State Government support
2. Socialisation through Universal Charge
2. Parameters basis which allocation will be done - considering factors like Duration of PPAs, average/peak demand of consumers with each Supply company, consumer mix of Supply companies, size of PPAs etc.
3. PPA allocation or Power allocation
4. Price for allocation
• Actual cost of PPA
• Uniform/Average cost
• Differential Bulk Supply Tariff (based on consumer mix)
5. Fixed or Dynamic allocation of PPAs/Power
Back

PwC
10 June 2015
Allocation of PPAs – other issues (2/2)
38
Roll out plan for introduction of Competition in Retail sale of electricity • Final Presentation
Section 4 – Major Issues
Approach Pros Cons
Regarding price of allocating PPAs
Actual cost of PPA Ease of settlement between generator and retail supply company
Certain Retail Supply Companies could get stuck with costlier PPAs or PPAs which expire soon
Inter-regional or inter-category cross subsidies could get created
Uniform/Average cost
Level playing field could be created for all retail supply companies
Settlement with generators due to several escalableand non escalable components could become an issue
Differential Bulk Supply Tariff
Could be used as a tool for cross subsidy management
Inter-regional or inter-category cross subsidies could get created
Regarding allocation mechanism
Fixed allocation of PPAs/Power
No need to define consumer switching frequency. Supply companies will have to trade power among themselves to account for any change in consumer base
Mechanism would have to be developed for trading among retail supply companies
Accounting for different duration of PPAs would become more complex due to inability to refresh allocation based on consumer base of supply company
Dynamic allocation of PPAs/Power
Will allow Intermediary Company to adopt for any changes in power scenario in future
The frequency at which consumers would be allowed to switch supply company would have to be linked with frequency of refreshing dynamic allocation of PPAs
Back
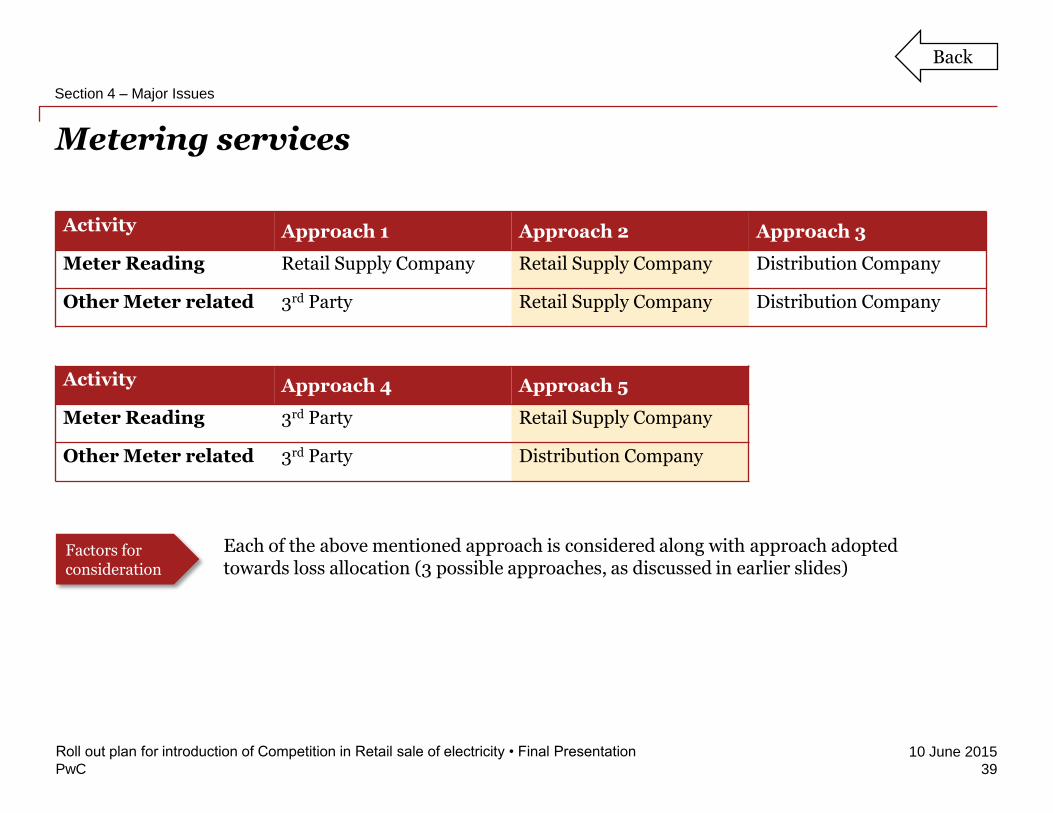
PwC
10 June 2015
Metering services
39
Roll out plan for introduction of Competition in Retail sale of electricity • Final Presentation
Section 4 – Major Issues
Activity Approach 1 Approach 2 Approach 3
Meter Reading Retail Supply Company Retail Supply Company Distribution Company
Other Meter related 3rd Party Retail Supply Company Distribution Company
Activity Approach 4 Approach 5
Meter Reading 3rd Party Retail Supply Company
Other Meter related 3rd Party Distribution Company
Each of the above mentioned approach is considered along with approach adopted towards loss allocation (3 possible approaches, as discussed in earlier slides)
Factors for consideration
Back
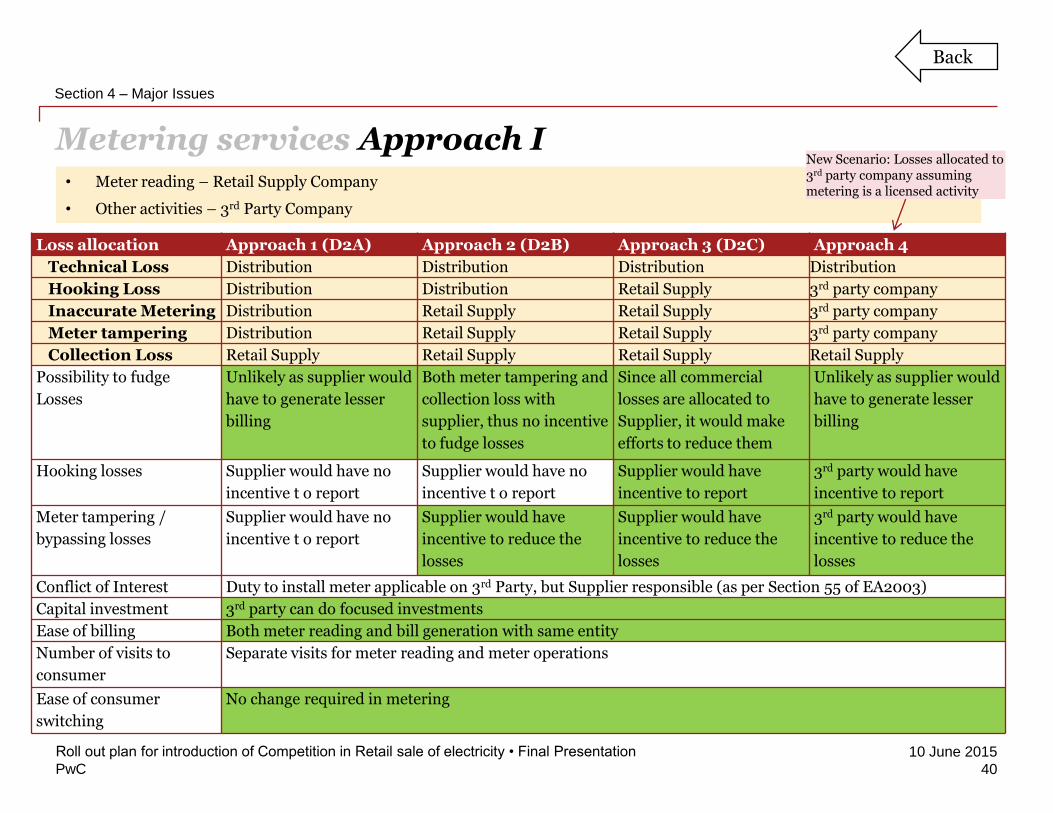
PwC
10 June 2015
Metering services Approach I
40
Roll out plan for introduction of Competition in Retail sale of electricity • Final Presentation
Section 4 – Major Issues
• Meter reading – Retail Supply Company
• Other activities – 3rd Party Company
Loss allocation Approach 1 (D2A) Approach 2 (D2B) Approach 3 (D2C) Approach 4
Technical Loss Distribution Distribution Distribution Distribution
Hooking Loss Distribution Distribution Retail Supply 3rd party company
Inaccurate Metering Distribution Retail Supply Retail Supply 3rd party company
Meter tampering Distribution Retail Supply Retail Supply 3rd party company
Collection Loss Retail Supply Retail Supply Retail Supply Retail Supply
Possibility to fudge
Losses
Unlikely as supplier would
have to generate lesser
billing
Both meter tampering and
collection loss with
supplier, thus no incentive
to fudge losses
Since all commercial
losses are allocated to
Supplier, it would make
efforts to reduce them
Unlikely as supplier would
have to generate lesser
billing
Hooking losses Supplier would have no
incentive t o report
Supplier would have no
incentive t o report
Supplier would have
incentive to report
3rd party would have
incentive to report
Meter tampering /
bypassing losses
Supplier would have no
incentive t o report
Supplier would have
incentive to reduce the
losses
Supplier would have
incentive to reduce the
losses
3rd party would have
incentive to reduce the
losses
Conflict of Interest Duty to install meter applicable on 3rd Party, but Supplier responsible (as per Section 55 of EA2003)
Capital investment 3rd party can do focused investments
Ease of billing Both meter reading and bill generation with same entity
Number of visits to
consumer
Separate visits for meter reading and meter operations
Ease of consumer
switching
No change required in metering
New Scenario: Losses allocated to 3rd party company assuming metering is a licensed activity
Back
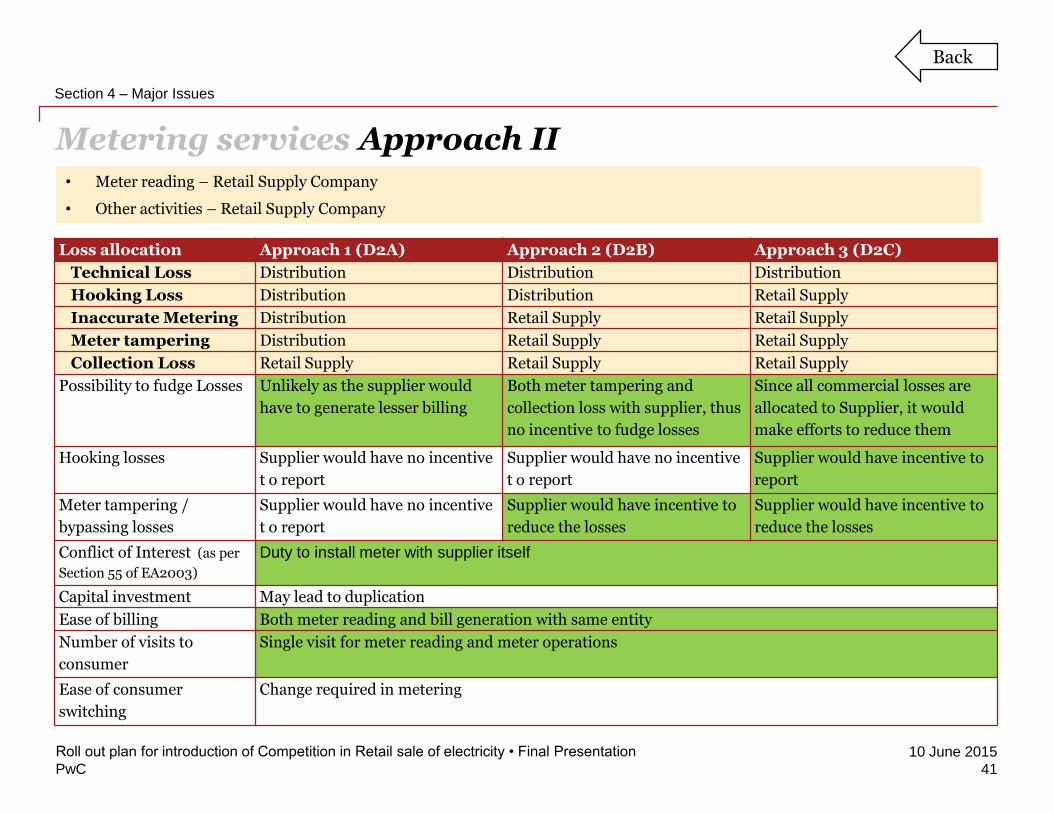
PwC
10 June 2015
Metering services Approach II
41
Roll out plan for introduction of Competition in Retail sale of electricity • Final Presentation
Section 4 – Major Issues
• Meter reading – Retail Supply Company
• Other activities – Retail Supply Company
Loss allocation Approach 1 (D2A) Approach 2 (D2B) Approach 3 (D2C)
Technical Loss Distribution Distribution Distribution
Hooking Loss Distribution Distribution Retail Supply
Inaccurate Metering Distribution Retail Supply Retail Supply
Meter tampering Distribution Retail Supply Retail Supply
Collection Loss Retail Supply Retail Supply Retail Supply
Possibility to fudge Losses Unlikely as the supplier would
have to generate lesser billing
Both meter tampering and
collection loss with supplier, thus
no incentive to fudge losses
Since all commercial losses are
allocated to Supplier, it would
make efforts to reduce them
Hooking losses Supplier would have no incentive
t o report
Supplier would have no incentive
t o report
Supplier would have incentive to
report
Meter tampering /
bypassing losses
Supplier would have no incentive
t o report
Supplier would have incentive to
reduce the losses
Supplier would have incentive to
reduce the losses
Conflict of Interest (as per
Section 55 of EA2003)
Duty to install meter with supplier itself
Capital investment May lead to duplication
Ease of billing Both meter reading and bill generation with same entity
Number of visits to
consumer
Single visit for meter reading and meter operations
Ease of consumer
switching
Change required in metering
Back
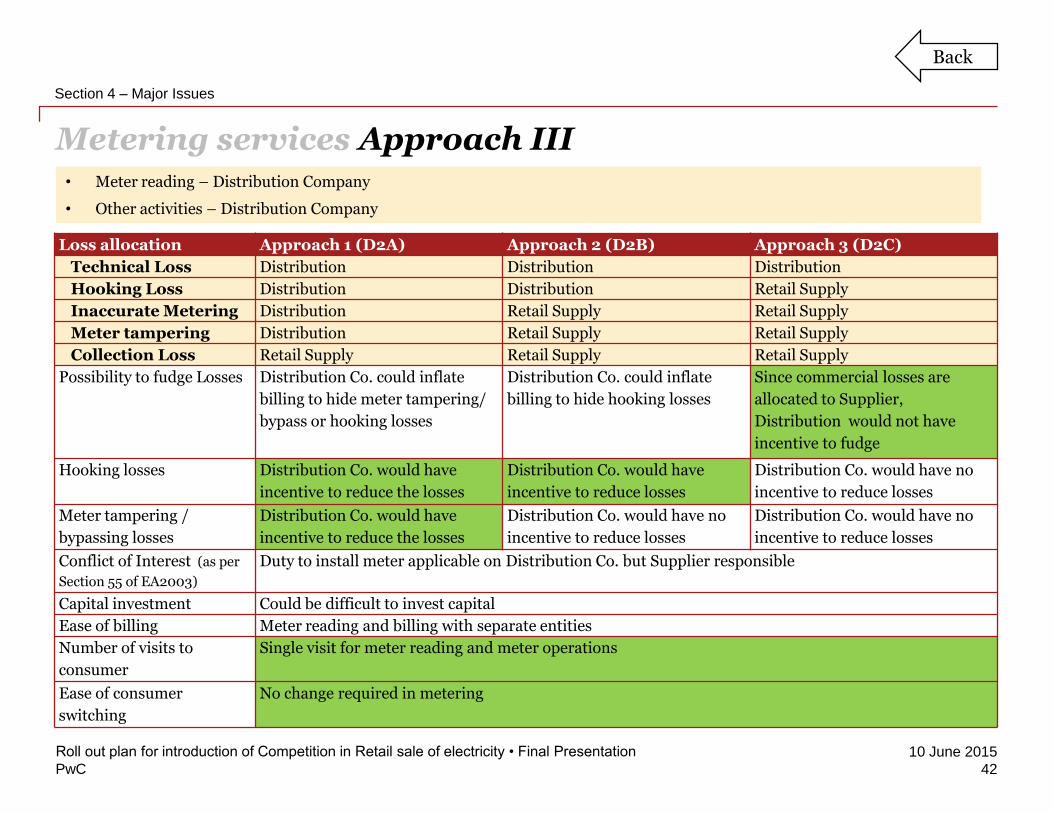
PwC
10 June 2015
Metering services Approach III
42
Roll out plan for introduction of Competition in Retail sale of electricity • Final Presentation
Section 4 – Major Issues
• Meter reading – Distribution Company
• Other activities – Distribution Company
Loss allocation Approach 1 (D2A) Approach 2 (D2B) Approach 3 (D2C)
Technical Loss Distribution Distribution Distribution
Hooking Loss Distribution Distribution Retail Supply
Inaccurate Metering Distribution Retail Supply Retail Supply
Meter tampering Distribution Retail Supply Retail Supply
Collection Loss Retail Supply Retail Supply Retail Supply
Possibility to fudge Losses Distribution Co. could inflate
billing to hide meter tampering/
bypass or hooking losses
Distribution Co. could inflate
billing to hide hooking losses
Since commercial losses are
allocated to Supplier,
Distribution would not have
incentive to fudge
Hooking losses Distribution Co. would have
incentive to reduce the losses
Distribution Co. would have
incentive to reduce losses
Distribution Co. would have no
incentive to reduce losses
Meter tampering /
bypassing losses
Distribution Co. would have
incentive to reduce the losses
Distribution Co. would have no
incentive to reduce losses
Distribution Co. would have no
incentive to reduce losses
Conflict of Interest (as per
Section 55 of EA2003)
Duty to install meter applicable on Distribution Co. but Supplier responsible
Capital investment Could be difficult to invest capital
Ease of billing Meter reading and billing with separate entities
Number of visits to
consumer
Single visit for meter reading and meter operations
Ease of consumer
switching
No change required in metering
Back
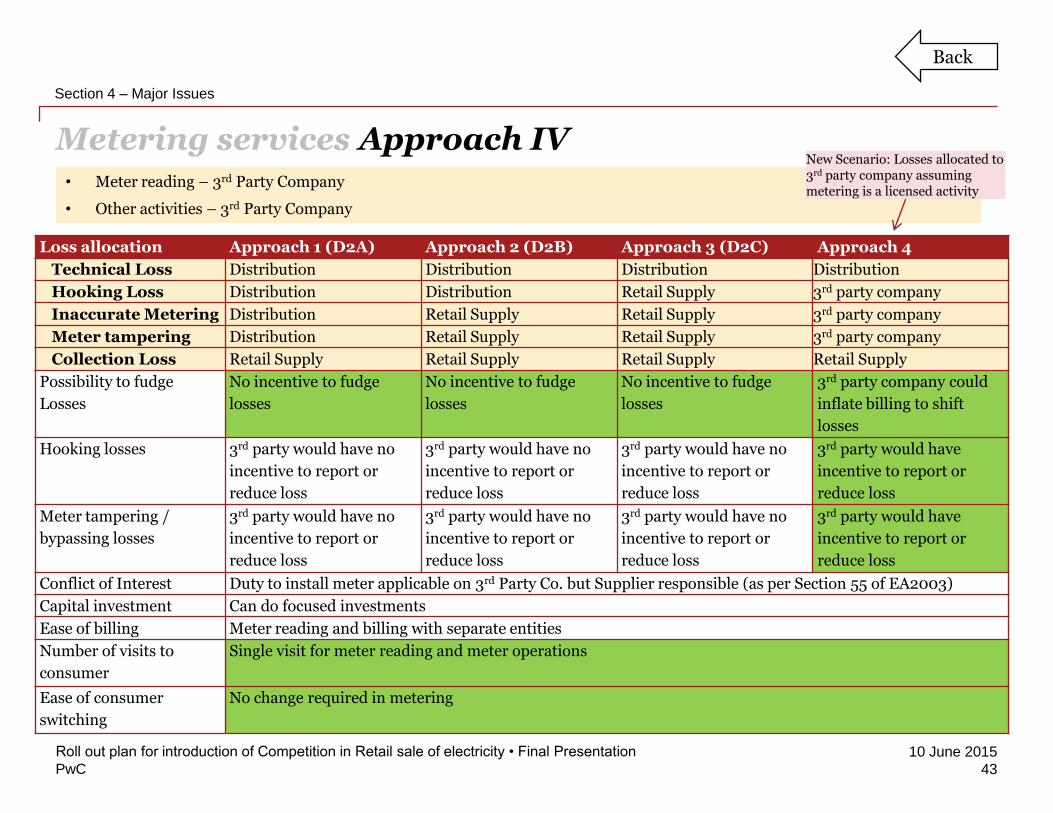
PwC
10 June 2015
Metering services Approach IV
43
Roll out plan for introduction of Competition in Retail sale of electricity • Final Presentation
Section 4 – Major Issues
• Meter reading – 3rd Party Company
• Other activities – 3rd Party Company
Loss allocation Approach 1 (D2A) Approach 2 (D2B) Approach 3 (D2C) Approach 4
Technical Loss Distribution Distribution Distribution Distribution
Hooking Loss Distribution Distribution Retail Supply 3rd party company
Inaccurate Metering Distribution Retail Supply Retail Supply 3rd party company
Meter tampering Distribution Retail Supply Retail Supply 3rd party company
Collection Loss Retail Supply Retail Supply Retail Supply Retail Supply
Possibility to fudge
Losses
No incentive to fudge
losses
No incentive to fudge
losses
No incentive to fudge
losses
3rd party company could
inflate billing to shift
losses
Hooking losses 3rd party would have no
incentive to report or
reduce loss
3rd party would have no
incentive to report or
reduce loss
3rd party would have no
incentive to report or
reduce loss
3rd party would have
incentive to report or
reduce loss
Meter tampering /
bypassing losses
3rd party would have no
incentive to report or
reduce loss
3rd party would have no
incentive to report or
reduce loss
3rd party would have no
incentive to report or
reduce loss
3rd party would have
incentive to report or
reduce loss
Conflict of Interest Duty to install meter applicable on 3rd Party Co. but Supplier responsible (as per Section 55 of EA2003)
Capital investment Can do focused investments
Ease of billing Meter reading and billing with separate entities
Number of visits to
consumer
Single visit for meter reading and meter operations
Ease of consumer
switching
No change required in metering
New Scenario: Losses allocated to 3rd party company assuming metering is a licensed activity
Back

PwC
10 June 2015
Metering services Approach V
44
Roll out plan for introduction of Competition in Retail sale of electricity • Final Presentation
Section 4 – Major Issues
• Meter reading – Retail Supply Company
• Other activities – Distribution Company
Loss allocation Approach 1 (D2A) Approach 2 (D2B) Approach 3 (D2C)
Technical Loss Distribution Distribution Distribution
Hooking Loss Distribution Distribution Retail Supply
Inaccurate Metering Distribution Retail Supply Retail Supply
Meter tampering Distribution Retail Supply Retail Supply
Collection Loss Retail Supply Retail Supply Retail Supply
Possibility to fudge Losses Unlikely as the supplier would
have to generate lesser billing
Both meter tampering and
collection loss with supplier, thus
no incentive to fudge losses
Since all commercial losses are
allocated to Supplier, it would
make efforts to reduce them
Hooking losses Appropriate entity will take care
on consumer visit
Appropriate entity will take care
on consumer visit
Appropriate entity will take care
on consumer visit
Meter tampering /
bypassing losses
Appropriate entity will take care
on consumer visit
Appropriate entity will take care
on consumer visit
Appropriate entity will take care
on consumer visit
Conflict of Interest (as per
Section 55 of EA2003)
Duty to install meter applicable on Distribution Co. but Supplier responsible
Capital investment Could be difficult to invest capital
Ease of billing Meter reading and billing with supplier
Number of visits to
consumer
Separate visit for meter reading and meter operations
Ease of consumer
switching
No change required in metering
Back
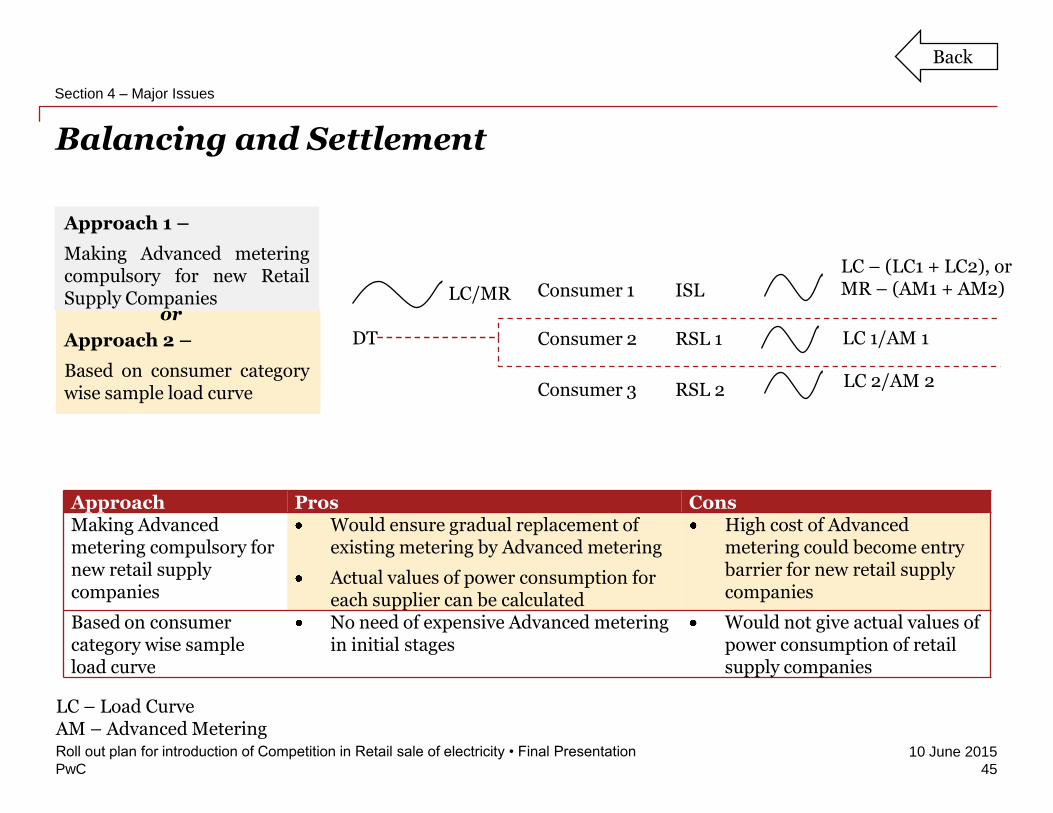
PwC
10 June 2015
Balancing and Settlement
45
Roll out plan for introduction of Competition in Retail sale of electricity • Final Presentation
Section 4 – Major Issues
Approach 1 –
Making Advanced meteringcompulsory for new RetailSupply Companies
Approach Pros ConsMaking Advancedmetering compulsory for new retail supply companies
Would ensure gradual replacement of existing metering by Advanced metering
Actual values of power consumption for each supplier can be calculated
High cost of Advanced metering could become entry barrier for new retail supply companies
Based on consumer category wise sample load curve
No need of expensive Advanced meteringin initial stages
Would not give actual values of power consumption of retail supply companies
DT
Consumer 1
Consumer 2
Consumer 3
ISL
RSL 1
RSL 2
LC 1/AM 1
LC 2/AM 2
LC/MR
LC – (LC1 + LC2), orMR – (AM1 + AM2)
Approach 2 –
Based on consumer categorywise sample load curve
or
LC – Load CurveAM – Advanced Metering
Back
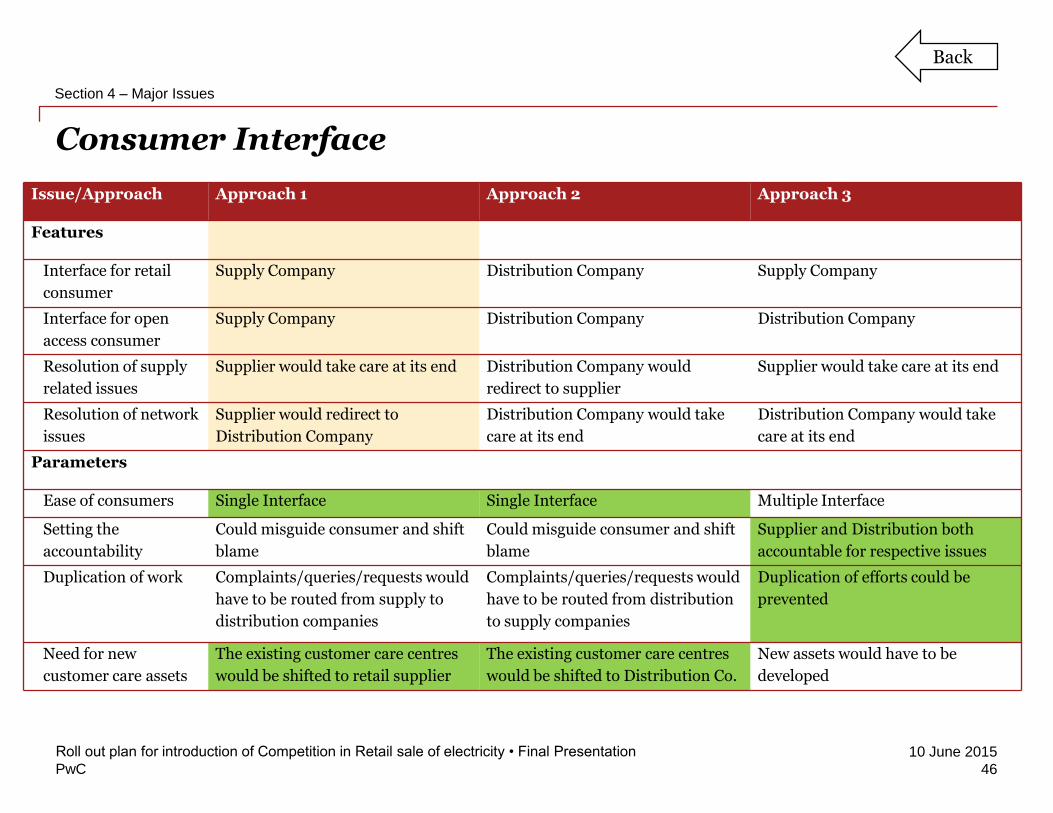
PwC
10 June 2015
Consumer Interface
46
Roll out plan for introduction of Competition in Retail sale of electricity • Final Presentation
Section 4 – Major Issues
Issue/Approach Approach 1 Approach 2 Approach 3
Features
Interface for retail
consumer
Supply Company Distribution Company Supply Company
Interface for open
access consumer
Supply Company Distribution Company Distribution Company
Resolution of supply
related issues
Supplier would take care at its end Distribution Company would
redirect to supplier
Supplier would take care at its end
Resolution of network
issues
Supplier would redirect to
Distribution Company
Distribution Company would take
care at its end
Distribution Company would take
care at its end
Parameters
Ease of consumers Single Interface Single Interface Multiple Interface
Setting the
accountability
Could misguide consumer and shift
blame
Could misguide consumer and shift
blame
Supplier and Distribution both
accountable for respective issues
Duplication of work Complaints/queries/requests would
have to be routed from supply to
distribution companies
Complaints/queries/requests would
have to be routed from distribution
to supply companies
Duplication of efforts could be
prevented
Need for new
customer care assets
The existing customer care centres
would be shifted to retail supplier
The existing customer care centres
would be shifted to Distribution Co.
New assets would have to be
developed
Back
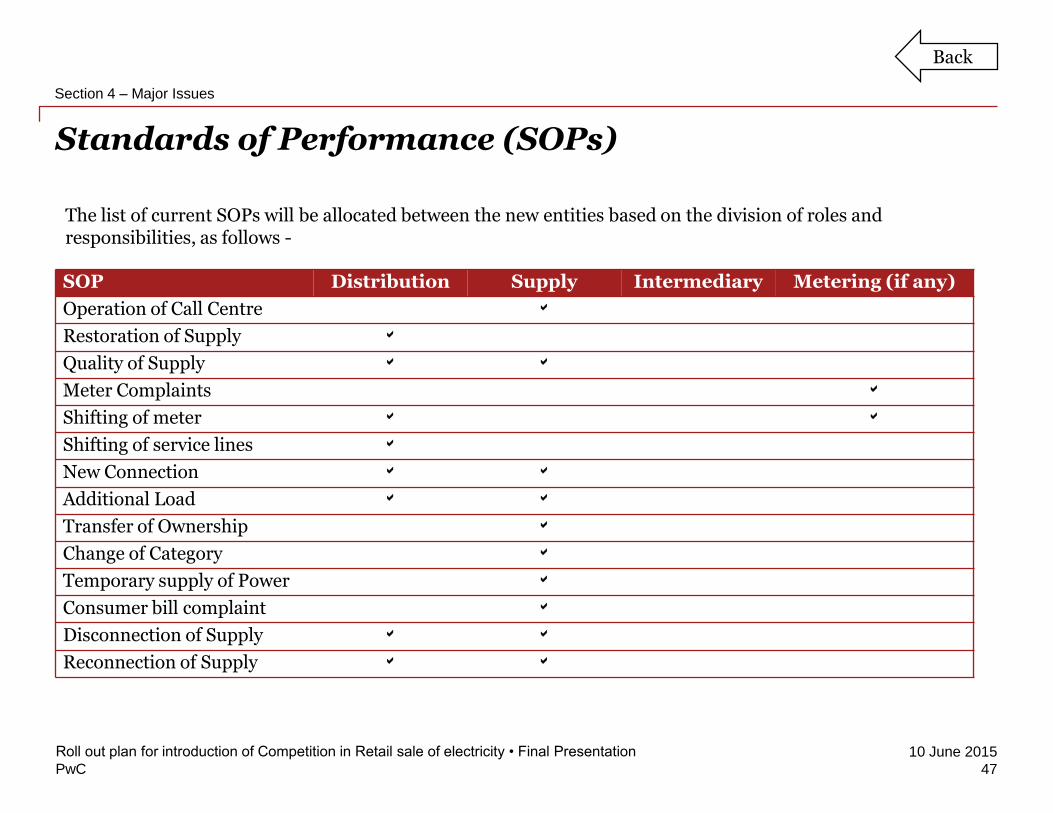
PwC
10 June 2015
Standards of Performance (SOPs)
47
Roll out plan for introduction of Competition in Retail sale of electricity • Final Presentation
Section 4 – Major Issues
SOP Distribution Supply Intermediary Metering (if any)
Operation of Call Centre a
Restoration of Supply a
Quality of Supply a a
Meter Complaints a
Shifting of meter a a
Shifting of service lines a
New Connection a a
Additional Load a a
Transfer of Ownership a
Change of Category a
Temporary supply of Power a
Consumer bill complaint a
Disconnection of Supply a a
Reconnection of Supply a a
The list of current SOPs will be allocated between the new entities based on the division of roles and responsibilities, as follows -
Back

PwC
10 June 2015
Tariff Determination
48
Roll out plan for introduction of Competition in Retail sale of electricity • Final Presentation
Section 4 – Major Issues
Tariff for Distribution Co. Tariff for Retail Supply Co. Intermediary Co.
The SERCs would determine a
regulated tariff allowing for –
Network Capex
Opex
Losses
For consumers not open to
competition -
The SERCs would determine a
regulated tariff, allowing for–
Capital assets
Power Purchase cost
Opex
Losses
The SERCs would determine
following allowed costs -
Costs towards PPAs
Opex
For consumers open to
competition –
For new Supply Companies, a
ceiling tariff would be set
SERCs will determine unbundled tariffs individually for Distribution Company, Retail Supply Company and Intermediary Company, as follows -
Back
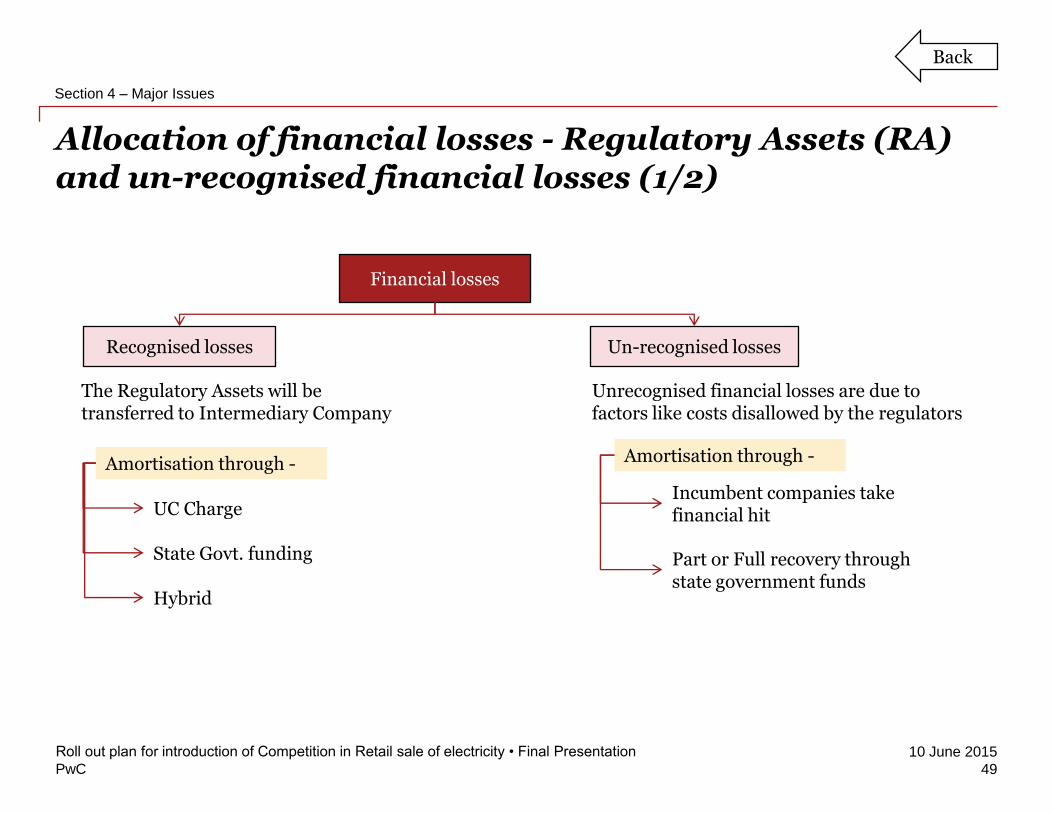
PwC
10 June 2015
Allocation of financial losses - Regulatory Assets (RA) and un-recognised financial losses (1/2)
49
Roll out plan for introduction of Competition in Retail sale of electricity • Final Presentation
Section 4 – Major Issues
Financial losses
Recognised losses Un-recognised losses
The Regulatory Assets will be transferred to Intermediary Company
UC Charge
State Govt. funding
Hybrid
Amortisation through -
Incumbent companies take financial hit
Part or Full recovery through state government funds
Amortisation through -
Unrecognised financial losses are due to factors like costs disallowed by the regulators
Back

PwC
10 June 2015
Allocation of financial losses - Regulatory Assets (RA) and un-recognised financial losses (2/2)
50
Roll out plan for introduction of Competition in Retail sale of electricity • Final Presentation
Section 4 – Major Issues
Approach Pros Cons
Regarding recognised financial losses (Regulatory Assets)
Universal Charge (UC)
Transparent mechanism: UC would be shown as a separate item in the consumer bill
Additional financial burden on consumers:Since UC is non by-passable it adds financial burden on even small and marginalised consumers
State Govtsupport
One time settlement: existing RAs can be amortised as a one-time benefit by Government funds
Additional burden on tax payers
Fiscal deficit of State Governments may not allow this financial burden
In case of private utilities the Stage Government would not be able to extend support
Hybrid Government Support to select consumers: The UC obligations of only marginalised consumers like agricultural category could be funded by State., the rest paying UC themselves
Additional burden on tax payers
Fiscal deficit of State Governments may not allow this financial burden
In case of private utilities the Stage Government would not be able to extend support
Regarding unrecognised financial losses
Incumbents take a hit
Right signal improve efficiencies in future:sends a signal to industry that efficiency improvement is only way out
Allocation between companies: allocation between Distribution and Supply company will be an issue
Full or part recovery allowed
Sector viability: would help utilities to raise funds in future and ensure sector viability
Deterrent for efficiency improvement:companies who managed to reduce losses efficiently would be penalised indirectly
Back

Thank you
This publication has been prepared for general guidance on matters of interest only, and does not constitute professional advice. You should not act upon the
information contained in this publication without obtaining specific professional advice. No representation or warranty (express or implied) is given as to the
accuracy or completeness of the information contained in this publication, and, to the extent permitted by law, PricewaterhouseCoopers Pvt. Ltd., its
members, employees and agents do not accept or assume any liability, responsibility or duty of care for any consequences of you or anyone else acting, or
refraining to act, in reliance on the information contained in this publication or for any decision based on it.
©2015 PricewaterhouseCoopers Pvt. Ltd. All rights reserved. In this document, “PwC” refers to PricewaterhouseCoopers Pvt. Ltd. which is a member firm of
PricewaterhouseCoopers International Limited, each member firm of which is a separate legal entity.

MODEL SMART GRID REGULATIONS
State Electricity Regulatory Commission (Smart Grid) Regulations, 20XX
Table of Contents
Chapter – 1 : General
1. Short Title, Extent and Commencement
2. Definitions
Chapter – II : Smart Grid Objectives and Guidelines
3. Smart Grid Objectives
4. Guidelines on Smart Grid Process
Chapter – III : Smart Grid Cell
5. Constitution of Smart Grid Cell, Its Roles & Responsibilities
Chapter – IV : Smart Grid Process
6. Baseline research and development of data
7. Formulation of Smart Grid Plan, Programme, Project
8. Approval of Smart Grid Plan, Programme, Project Document
9. Execution of Smart Grid Plan, Programme, Project
10. Mechanism for Cost Recovery
Chapter V: Smart Grid Project Evaluation
11. Monitoring, Evaluation, Measurement and Verification of
execution and performance of the Smart Grid Plan, Programme,
Project
12. Smart Grid Plan, Programme, Project Completion Report
13. Miscellaneous

CHAPTER – 1: GENERAL
1. Short Title, Extent and Commencement
(1) These Regulations may be called the (Name of State) Electricity Regulatory
Commission (Smart Grid) Regulations, 20XX.
(2) These Regulations shall be applicable to all Generating Companies, Transmission
Licensees, Distribution Licensees and consumers in the State and connected to the
state grid.
(3) These Regulations shall come into force on the date of their publication in the Official
Gazette.
2. Definitions
(1) Unless the context otherwise requires, for the purpose of these Regulations:-
(a) ‘Act’ means the Electricity Act, 2003 and amendments thereof;
(b) ‘Advanced Metering Infrastructure (AMI)’ including smart meters means the
infrastructure required to enable the Distribution Licensee to accurately
collect, monitor and analyse real-time consumption data from consumers,
communicate price signals to consumers and where permitted control load;
(c) ‘Aggregator’ is an entity registered with the Distribution Licensee to provide
aggregation of one or more of the services like demand response services
under the demand response mechanism, Distributed Generation, Energy
Storage etc. within a control area;
(d) Commission’ means Appropriate State Electricity Regulatory
Commission or Joint Electricity Regulatory Commission as the case may be;
(e) ‘Cyber Security’ means protecting information, equipment,
devices, computer, computer resource, network, programmes, data,
communication device and information stored therein from unauthorised or
unintended access, use, disclosure, disruption, modification or destruction;
(f) 'Electric Energy Storage' means a set of technologies capable of
storing previously generated energy and releasing energy at a later time to feed
electricity into grid. Electric storage technologies may store energy as
potential, kinetic, chemical, or thermal energy, and include various types of
batteries, flywheels, electrochemical, capacitors, compressed air storage,
thermal storage devices and pumped hydroelectric power and able to generate
electricity;
(g) ‘Interoperability’ means the measure of ease of integration
between two systems or software components to achieve a functional goal;
(h) ‘Key Performance Indicator (KPI)’ is a type of performance
measurement to evaluate its success, or to evaluate the outcome of a particular
activity in which it is engaged;
(i) 'Smart Grid' means an electricity networks that can integrate the
actions of all users connected to it using advanced metering, communication
and information technology to deliver electricity efficiently, sustainably,
reliably and securely;
(j) ‘Wide Area Measurement Systems (WAMS)’ is advanced
measurement technology, information tools, and operational infrastructure that

facilitate the understanding and management of the increasingly complex
behaviour exhibited by large power systems;
(2) The words and expressions used and not defined in these Regulations but defined in
the Act, Rules and Regulations framed thereunder shall have the meaning assigned to
them in the Act, Rules and Regulations.
Chapter II: Smart Grid Objectives and guidelines
3. Smart Grid Objectives
(1) The objectives of these regulations are to enable integration of various smart grid
technologies and measures to bring about economy, efficiency improvement in
generation, transmission and distribution licensee operations, manage the transmission
and distribution networks effectively, enhance network security, integrate renewable
and clean energy into the grid and micro grids.
(2) The objectives also include enhancing network visibility and access, promoting
optimal asset utilization, improving consumer service levels thereby allowing for
participation in operations of transmission licensees, distribution licensees through
greater technology adoption across the value chain in the electricity sector and
particularly in the transmission and distribution segments.
4. Guidelines on Smart Grid process
(1) The Commission may from time to time issue guidelines for the generating company,
transmission licensee, distribution licensee in execution of the activities including but not
limited to,
a. Formulation of Smart Grid programmes
b. Implementation of Smart Grid programmes
c. Cost Effectiveness Assessment of Smart Grid programmes
d. Monitoring and Reporting of Smart Grid Plans and programmes
e. Essential requisites for Smart Grid programmes
f. Customer engagement and participation
g. Customer data protection
h. Training and capacity building
i. Methodology for setting Smart Grid plans and funding levels
j. Database development framework and information system requirements
(2) Issuance of such guidelines shall not be a pre-requisite for preparation and submission of
the Smart Grid plan by the generating company, transmission licensee, distribution
licensee
Chapter III: Smart Grid Cell
5. Constitution of Smart Grid Cell, its roles & responsibilities
(1) Every transmission licensee, distribution licensee shall, constitute Smart Grid Cell within
three months of notification of these regulations
(2) The Smart Grid Cell so constituted shall have the authority and necessary
resources so as to execute the functions assigned to it under these Regulations
(3) The Smart Grid Cell shall be responsible for:

a. Baseline study and development of data
b. Formulation of Smart Grid Plans, Programmes, Projects,
c. Design and development of Smart Grid projects including cost benefit analysis,
plans for implementation, monitoring & reporting and for measurement &
verification
d. Seeking necessary approvals to Smart Grid Plans, Programmes, Projects
e. Implementation of Smart Grid programmes
f. Any other additional function that may be assigned by the Commission from time
to time
(4) The transmission licensee, distribution licensee may combine activities related to energy
efficiency, demand side management and Smart Grid implementation within the same
cell.
Chapter IV: Smart Grid Process
6. Baseline study and development of data
(1) Transmission licensee, distribution licensee shall undertake baseline study to identify
the targets and final outcomes for Smart Grid project programmes. The transmission
licensee, distribution licensee shall also build the necessary database.
(2) Transmission licensee, distribution licensee shall undertake study to estimate potential
for employment of specific efficiency technologies and applications, establish key
performance indicators, and determine existing baseline technical conditions.
(3) On the basis of the results of baseline study, the transmission licensee, distribution
licensee shall develop smart grid programme for its area of supply.
7. Formulation of Smart Grid Plan, Programmes, Projects
(1) The transmission licensee, distribution licensee shall submit an integrated Multi-Year
Smart Grid Plan for their respective Licence areas along-with Multi-Year Tariff
Petition or ARR Petition, for the approval of Commission.
(2) All Smart Grid projects requiring investments of more than Rupees 10 Crores (or such
sum as specified by the Commission) shall be submitted to the Commission for prior
approval of investments:
Provided that investments of less than Rupees 10 Crores (or such sum as
specified by the Commission) shall not require prior approval of the
Commission if it is part of Multi-Year Smart Grid Plan of the utility
approved by the Commission:
(3) The proposal for Smart Grid Projects shall include
(i) Detailed Project Report
(ii) Customer engagement and participation plan as applicable
(iii) Training and capacity building plan and
(iv) any other information that may be stipulated by the Commission from time to
time:
Provided that the detailed project report would include inter alia description of the
project, objective and rationale for the project, technical feasibility study, projected
financial implications, target stakeholders, detailed cost benefit analysis detailing all
costs qualitative and quantitative in nature, assessment of the project, in line with the

cost effectiveness guidelines issued by the Commission, proposed mechanism for
recovery of costs, delivery strategy, implementation mechanism, implementation
schedule, performance incentives if any, monitoring and evaluation plan, plan for
increasing awareness among the stakeholders.
(4) A list of indicative components of Smart Grid Projects is appended as Schedule-X.
8. Approval of Smart Grid Plan, Programme, Project Document
(1) The Commission shall approve a Smart Grid Programme, Project if it is in line with the
Objectives set out in Section 3 of the Regulations.
(2) The Commission may take assistance and advice of such experts as it deems necessary
for examining the proposal submitted by the transmission licensee, distribution
licensee.
(3) The Commission while according approval to the proposals, may identify costs, if any,
relating to the programme, project, and decide the methodology, procedure, process for
recovery of such costs.
(4) The Commission may provide the incentive / dis-incentive mechanism for the
transmission licensee, distribution licensee linked to the execution, implementation and
performance during the life of the project. The Commission may also specify financial
incentives/dis-incentives to participating consumers to encourage active and effective
participation in the Smart Grid programs.
(5) The Commission may modify the proposal as deemed fit in order to ensure its
consistency with overall objectives.
9. Execution of Smart Grid programmes, projects
(1) The transmission licensee, distribution licensee shall undertake execution of the project,
programme in line with the approval given by the Commission and other directions
issued by the Commission from time to time.
(2) The transmission licensee, distribution licensee shall normally adopt the system
standards as per Regulations notified by the CEA. In such case where no standards or
regulations are notified by the CEA the appropriate standards, regulations notified by
the appropriate Commission shall be applicable. In respect of network,
communication, products, interoperability and cyber security, the standards as provided
by BIS or such appropriate authority shall be adopted. Where these standards are not
yet in place, relevant IEC/IEEE/ANSI Standards shall be followed in that order.
(3) The Regulations relating to standards of performance as notified by the Commission
shall apply. Assessment of performance of the Smart Grid projects shall be carried out
for incentivizing/penalizing performance of transmission licensee, distribution licensee.
The Commission may specify and require implementation of additional standards of
performance to maximize the benefits and ensure compliance of the Smart Grid
performance standards proposed..
(4) Transmission licensee, distribution licensee and other agencies responsible for
implementation of the Smart Grid programmes, projects shall ensure that protection of
consumer data and consumer privacy is accorded the highest levels of priority.
10. Mechanism for Cost Recovery
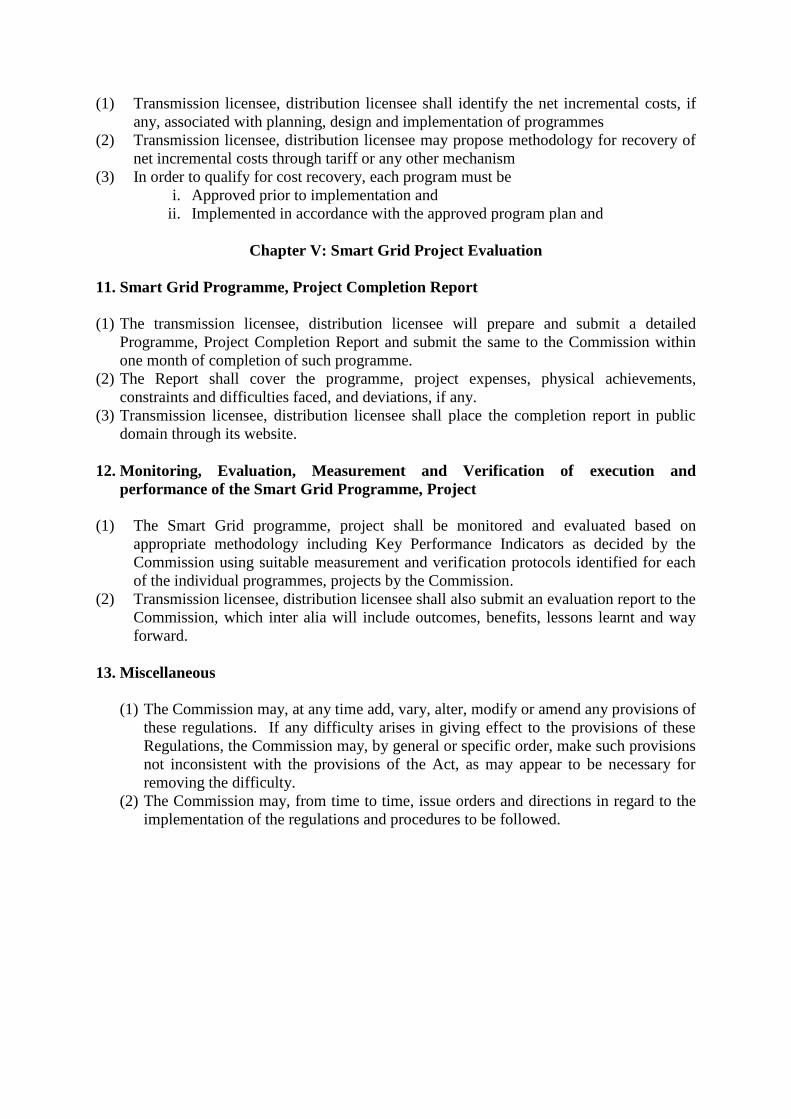
(1) Transmission licensee, distribution licensee shall identify the net incremental costs, if
any, associated with planning, design and implementation of programmes
(2) Transmission licensee, distribution licensee may propose methodology for recovery of
net incremental costs through tariff or any other mechanism
(3) In order to qualify for cost recovery, each program must be
i. Approved prior to implementation and
ii. Implemented in accordance with the approved program plan and
Chapter V: Smart Grid Project Evaluation
11. Smart Grid Programme, Project Completion Report
(1) The transmission licensee, distribution licensee will prepare and submit a detailed
Programme, Project Completion Report and submit the same to the Commission within
one month of completion of such programme.
(2) The Report shall cover the programme, project expenses, physical achievements,
constraints and difficulties faced, and deviations, if any.
(3) Transmission licensee, distribution licensee shall place the completion report in public
domain through its website.
12. Monitoring, Evaluation, Measurement and Verification of execution and
performance of the Smart Grid Programme, Project
(1) The Smart Grid programme, project shall be monitored and evaluated based on
appropriate methodology including Key Performance Indicators as decided by the
Commission using suitable measurement and verification protocols identified for each
of the individual programmes, projects by the Commission.
(2) Transmission licensee, distribution licensee shall also submit an evaluation report to the
Commission, which inter alia will include outcomes, benefits, lessons learnt and way
forward.
13. Miscellaneous
(1) The Commission may, at any time add, vary, alter, modify or amend any provisions of
these regulations. If any difficulty arises in giving effect to the provisions of these
Regulations, the Commission may, by general or specific order, make such provisions
not inconsistent with the provisions of the Act, as may appear to be necessary for
removing the difficulty.
(2) The Commission may, from time to time, issue orders and directions in regard to the
implementation of the regulations and procedures to be followed.
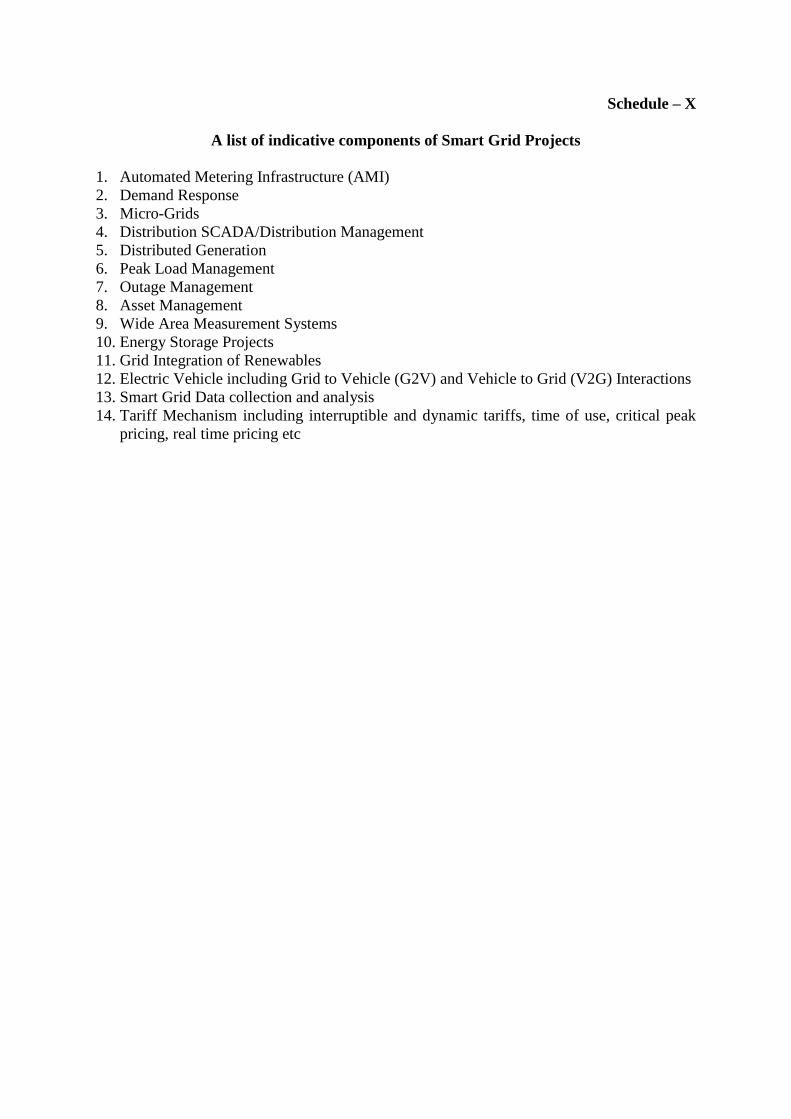
Schedule – X
A list of indicative components of Smart Grid Projects
1. Automated Metering Infrastructure (AMI)
2. Demand Response
3. Micro-Grids
4. Distribution SCADA/Distribution Management
5. Distributed Generation
6. Peak Load Management
7. Outage Management
8. Asset Management
9. Wide Area Measurement Systems
10. Energy Storage Projects
11. Grid Integration of Renewables
12. Electric Vehicle including Grid to Vehicle (G2V) and Vehicle to Grid (V2G) Interactions
13. Smart Grid Data collection and analysis
14. Tariff Mechanism including interruptible and dynamic tariffs, time of use, critical peak
pricing, real time pricing etc
Model Smart Grid Regulations

Objectives
• To enable integration of various smart grid technologies andmeasures to bring about economy, efficiency improvement ingeneration, transmission and distribution licenseeoperations, manage the transmission and distribution networkseffectively, enhance network security, integrate renewable andclean energy into the grid and micro grids.
• Enhancing network visibility and access, promoting optimal assetutilization, improving consumer service levels thereby allowing forparticipation in operations of transmission licensees, distributionlicensees through greater technology adoption across the valuechain in the electricity sector and particularly in the transmissionand distribution segments.
• Applicable to Generation companies, Transmission licensees anddistribution licensees
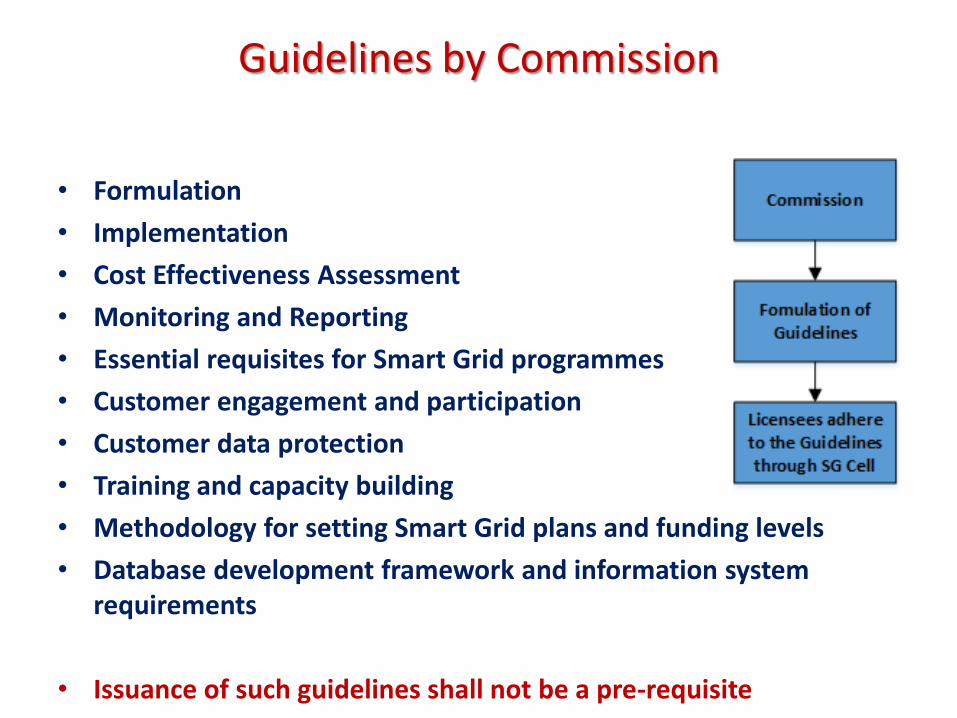
Guidelines by Commission
• Formulation
• Implementation
• Cost Effectiveness Assessment
• Monitoring and Reporting
• Essential requisites for Smart Grid programmes
• Customer engagement and participation
• Customer data protection
• Training and capacity building
• Methodology for setting Smart Grid plans and funding levels
• Database development framework and information system requirements
• Issuance of such guidelines shall not be a pre-requisite

Smart Grid Cell
• Baseline study and development of data• Formulation of Smart Grid Plans, Programmes, Projects,• Design and development of Smart Grid projects including cost benefit analysis, plans
for implementation, monitoring & reporting and for measurement & verification• Seeking necessary approvals to Smart Grid Plans, Programmes, Projects• Implementation of Smart Grid programmes• Any other additional function that may be assigned by the Commission from time to
time• The transmission licensee, distribution licensee may combine activities related to
energy efficiency, demand side management and Smart Grid implementation withinthe same cell
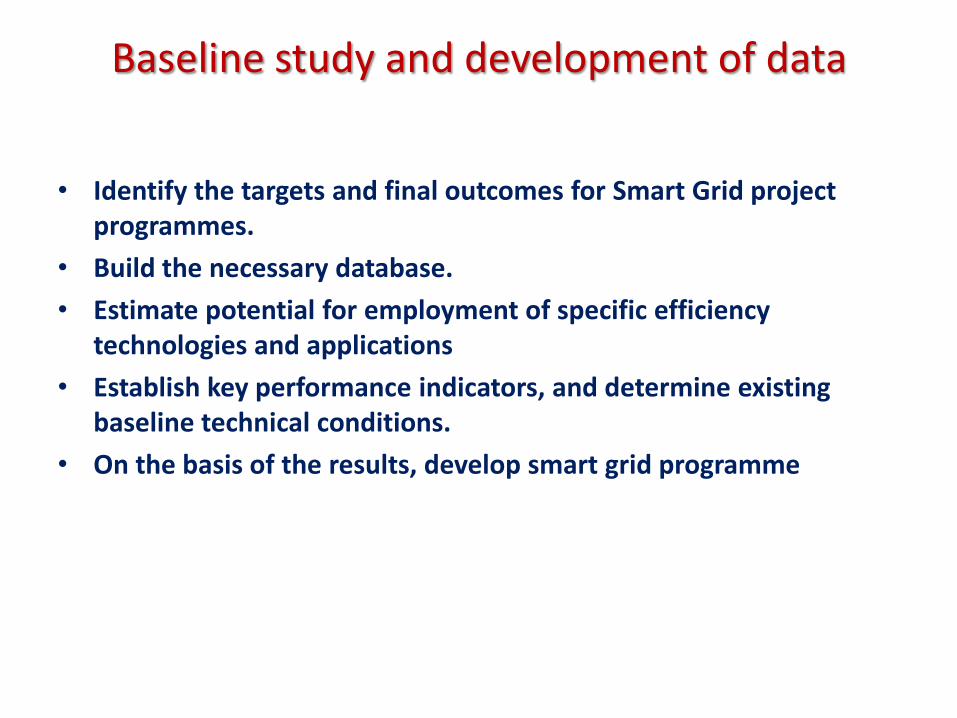
Baseline study and development of data
• Identify the targets and final outcomes for Smart Grid project programmes.
• Build the necessary database.
• Estimate potential for employment of specific efficiency technologies and applications
• Establish key performance indicators, and determine existing baseline technical conditions.
• On the basis of the results, develop smart grid programme

Formulation of Smart Grid Plan, Programmes, Projects
• Submission of integrated Multi-Year Smart Grid Plan along-with MYT Petition or ARR Petition
• Prior approval of Commission for projects requiring investments of more than Rs. 10 Cr. (Commissions to determine the threshold)
• The proposal to include Detailed Project Report, Customer engagement and participation plan, Training and capacity building plan.
Detailed Project Report
Descr.
Objective
Rationale
Technical Feasibility
Study
Financial Implications
Cost-Benefit Analysis (Qual. & Quant)
Target Stakeholder
sMechanism for recovery
of costs
Imple. Mechanism / Schedule
Monitoring & Evaluation
plan
Plan for incr. awareness

Approval of Smart Grid Plan, Programme, Project Document
• The Commission shall approve a Smart Grid Programme (in line with the Objectives)
• The Commission may take assistance and advice of such experts
• The Commission may identify costs, if any, and decide the methodology, procedure, process for recovery of such costs.
• The Commission may provide the incentive / dis-incentive mechanism linked to the execution, implementation and performance during the life of the project.
• The Commission may modify the proposal as deemed fit in order to ensure its consistency with overall objectives

Execution of Smart Grid Programmes, Projects
• Execution of the project, programme in line with the approvalgiven by the Commission.
• Adoption of system standards as per CEA Regulations notified bythe CEA. Else, regulations notified by the appropriate Commissionshall be applicable.
• In respect of network, communication, products, interoperabilityand cyber security, the standards of BIS or relevant IEC/IEEE/ANSIStandards shall be followed in that order.
• Standards of Performance Regulation of the Commission shallapply.
• The Commission may specify additional standards of performanceto maximize the benefits.
• The agencies responsible for implementation of the Smart Gridprogrammes, projects shall ensure that protection of consumerdata and consumer privacy is accorded the highest levels ofpriority.
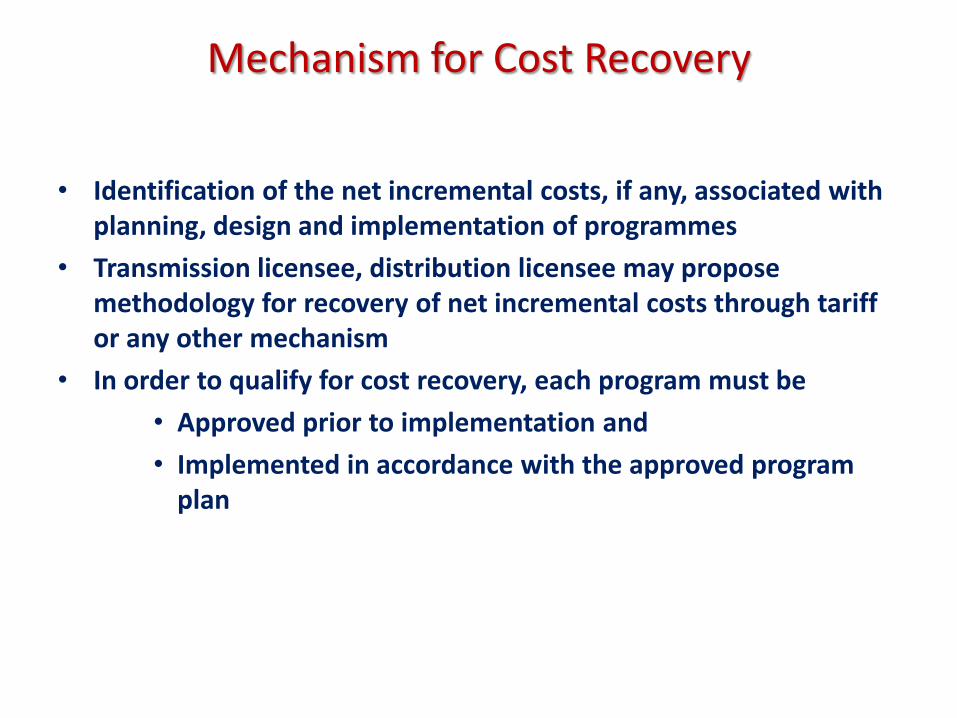
Mechanism for Cost Recovery
• Identification of the net incremental costs, if any, associated with planning, design and implementation of programmes
• Transmission licensee, distribution licensee may propose methodology for recovery of net incremental costs through tariff or any other mechanism
• In order to qualify for cost recovery, each program must be
• Approved prior to implementation and
• Implemented in accordance with the approved program plan
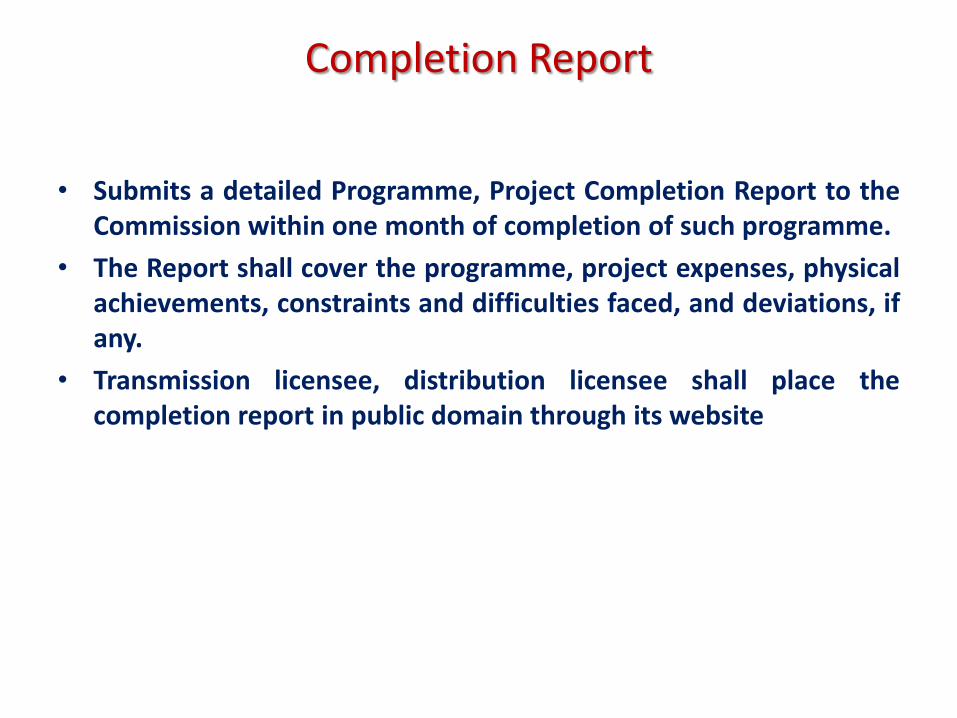
Completion Report
• Submits a detailed Programme, Project Completion Report to theCommission within one month of completion of such programme.
• The Report shall cover the programme, project expenses, physicalachievements, constraints and difficulties faced, and deviations, ifany.
• Transmission licensee, distribution licensee shall place thecompletion report in public domain through its website
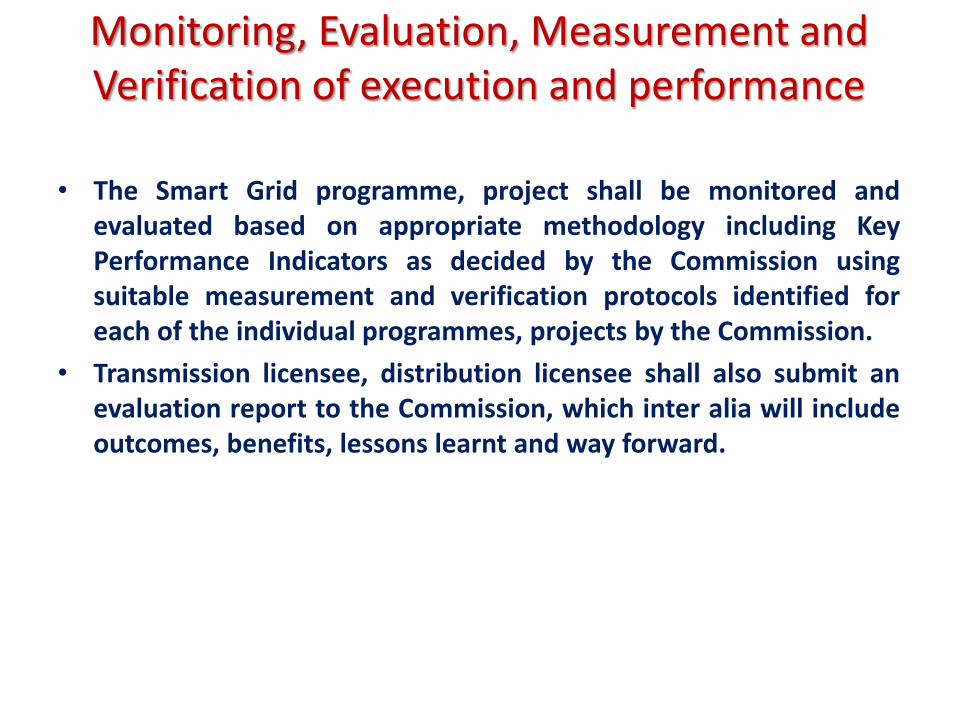
Monitoring, Evaluation, Measurement and Verification of execution and performance
• The Smart Grid programme, project shall be monitored andevaluated based on appropriate methodology including KeyPerformance Indicators as decided by the Commission usingsuitable measurement and verification protocols identified foreach of the individual programmes, projects by the Commission.
• Transmission licensee, distribution licensee shall also submit anevaluation report to the Commission, which inter alia will includeoutcomes, benefits, lessons learnt and way forward.

Thank you
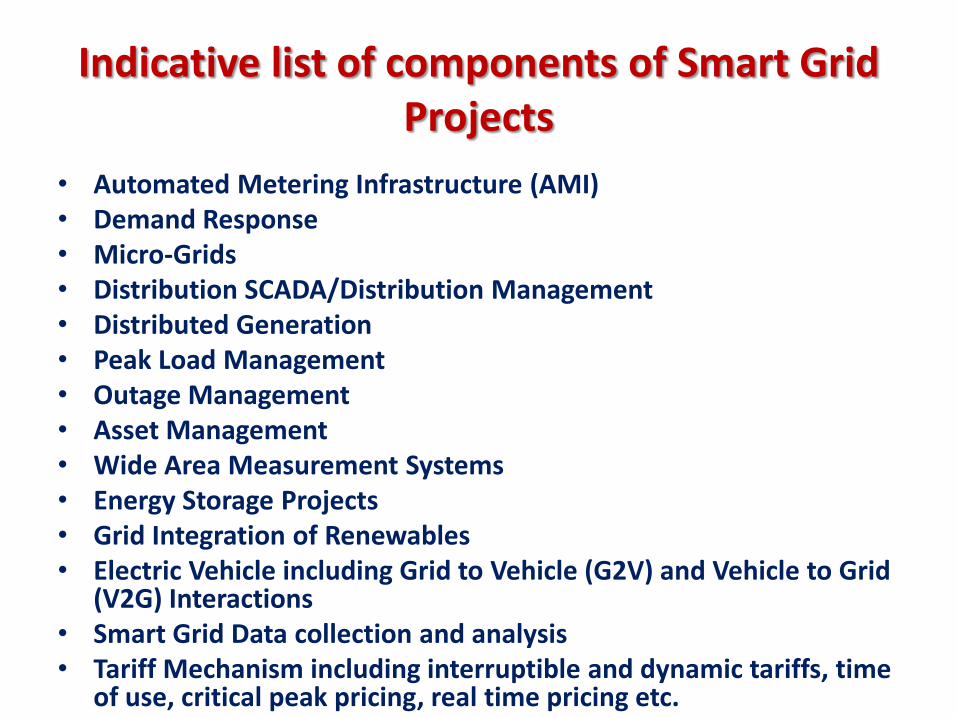
Indicative list of components of Smart Grid Projects
• Automated Metering Infrastructure (AMI) • Demand Response• Micro-Grids• Distribution SCADA/Distribution Management• Distributed Generation• Peak Load Management• Outage Management • Asset Management • Wide Area Measurement Systems• Energy Storage Projects• Grid Integration of Renewables• Electric Vehicle including Grid to Vehicle (G2V) and Vehicle to Grid
(V2G) Interactions• Smart Grid Data collection and analysis • Tariff Mechanism including interruptible and dynamic tariffs, time
of use, critical peak pricing, real time pricing etc.

Forum of Regulators
Study on Performance of Distribution Utilities
June 2015
Page 2
Confidentiality StatementThe information contained in this document includes descriptions of methodologies and concepts derived through substantial research and development efforts and contains trade secrets and other confidential or proprietary information of Ernst & Young, the disclosure of which would offer substantial benefit to competitors offering similar services. As a result, this proposal document may not be disclosed, used or duplicated - in whole or in part - for any purpose other than for the evaluation by the receiver for the process of awarding a contract.
Page 3
Agenda
Agenda Scope and Approach
Key observation
Categorization Methodology
Recommendation

Page 4
Scope of assignment
Identifying KPIPerformance Analysis
• Identifying Basic Parameters
Impact of PolicyPerformance Assessment
• Impact of Regulatory Decision
Bench Marking and Gaps IdentificationClustering
• Recommendation
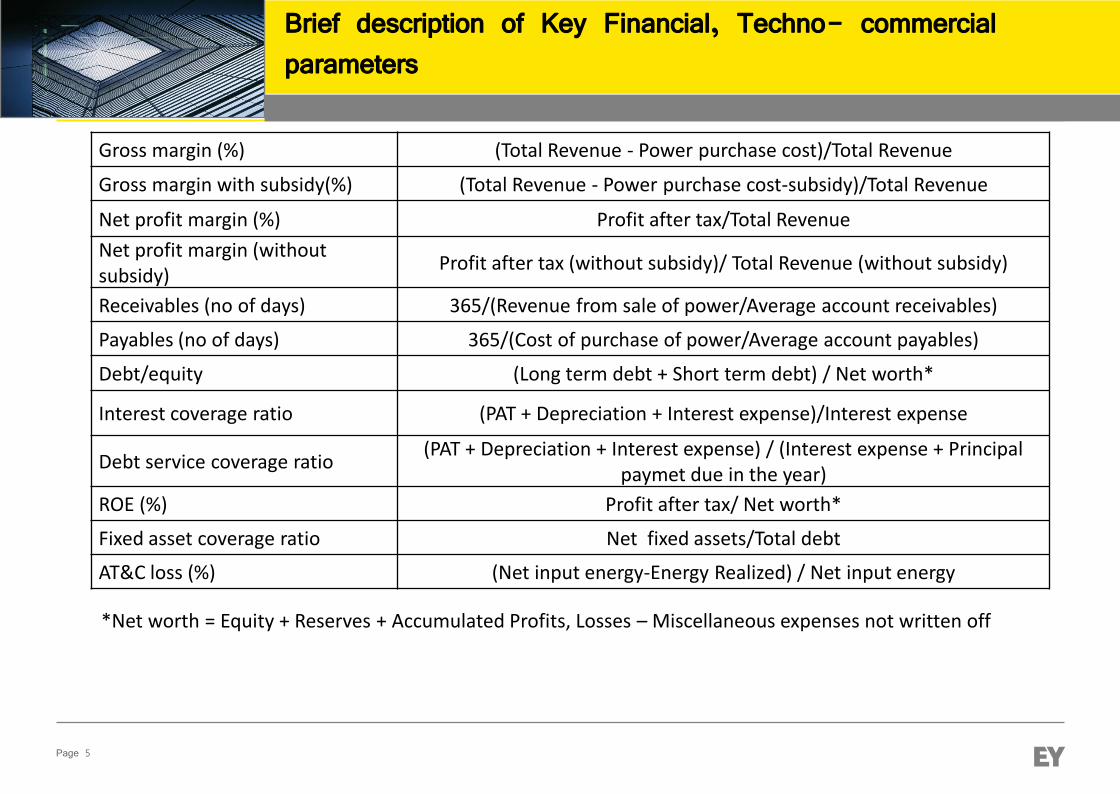
Page 5
Brief description of Key Financial, Techno- commercial parameters
Gross margin (%) (Total Revenue - Power purchase cost)/Total Revenue
Gross margin with subsidy(%) (Total Revenue - Power purchase cost-subsidy)/Total Revenue
Net profit margin (%) Profit after tax/Total Revenue
Net profit margin (without subsidy)
Profit after tax (without subsidy)/ Total Revenue (without subsidy)
Receivables (no of days) 365/(Revenue from sale of power/Average account receivables)
Payables (no of days) 365/(Cost of purchase of power/Average account payables)
Debt/equity (Long term debt + Short term debt) / Net worth*
Interest coverage ratio (PAT + Depreciation + Interest expense)/Interest expense
Debt service coverage ratio(PAT + Depreciation + Interest expense) / (Interest expense + Principal
paymet due in the year)
ROE (%) Profit after tax/ Net worth*
Fixed asset coverage ratio Net fixed assets/Total debt
AT&C loss (%) (Net input energy-Energy Realized) / Net input energy
*Net worth = Equity + Reserves + Accumulated Profits, Losses – Miscellaneous expenses not written off

Page 6
Key observations from FY2010 to FY2013 at National level
1. Profitability
The States that have shown substantial improvement in terms of increase in book profit or reduction in book losses in
FY2013 vis-à-vis FY2012 are Bihar, Jharkhand, Odisha, Assam, Haryana, Punjab, Rajasthan, Tamil Nadu, Chhattisgarh
and Maharashtra.
2. Subsidy
Subsidy booked as a percentage of revenue from sale of power increased to 12.81% in FY2013 as compared to 12.44%
in FY2012. (10.93% in FY2011).
The subsidy released by the State Government has been about 98% of the subsidy booked by the utilities in FY2013.
(85% in FY2012).
Parameter FY2010 FY2011 FY2012 FY2013Average Revenue (w/o subsidy) 2.68 3.03 3.30 3.76Average Cost of Supply 3.55 3.98 4.55 5.01
Gap w/o subsidy 0.87 0.95 1.25 1.25Gap on subsidy booked basis 0.40 0.65 0.88 0.81Gap on subsidy received basis 0.61 0.68 0.94 0.83
Parameter FY2010 FY2011 FY2012 FY2013Subsidy booked - 227.05 300.09 369.64Subsidy received - 203.34 257.71 361.10
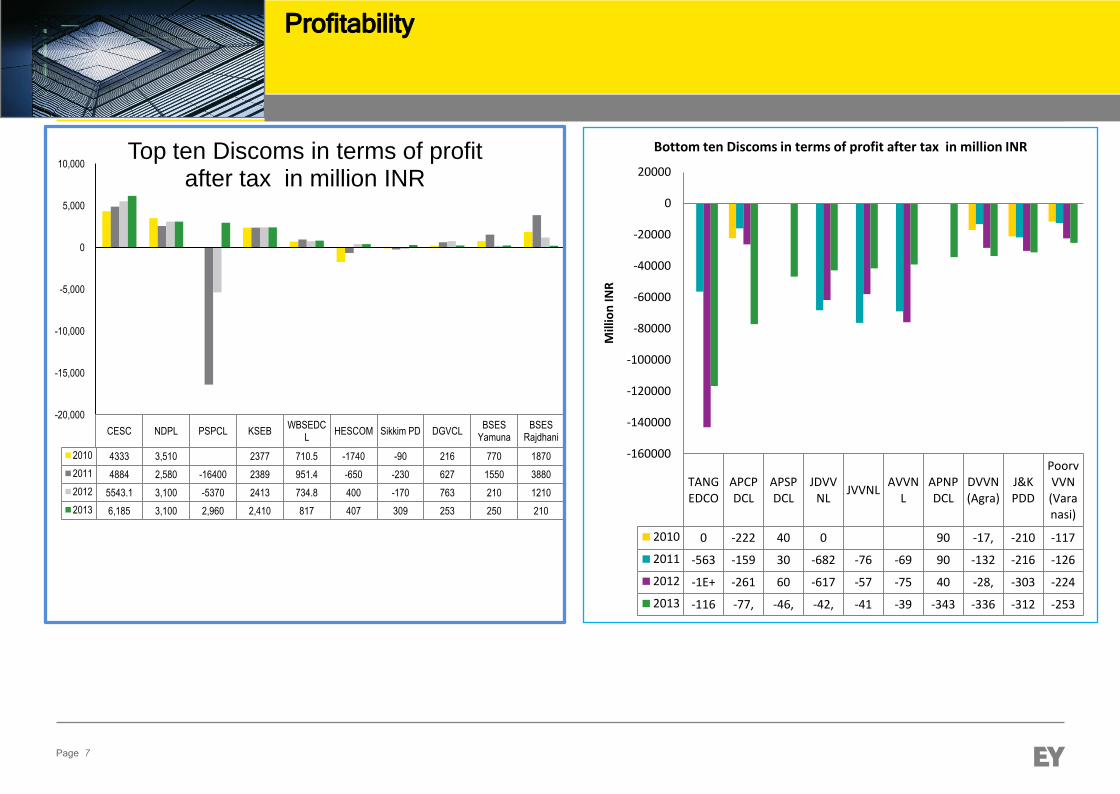
Page 7
Profitability
CESC NDPL PSPCL KSEBWBSEDC
LHESCOM Sikkim PD DGVCL
BSES Yamuna
BSES Rajdhani
2010 4333 3,510 2377 710.5 -1740 -90 216 770 1870
2011 4884 2,580 -16400 2389 951.4 -650 -230 627 1550 3880
2012 5543.1 3,100 -5370 2413 734.8 400 -170 763 210 1210
2013 6,185 3,100 2,960 2,410 817 407 309 253 250 210
-20,000
-15,000
-10,000
-5,000
0
5,000
10,000Top ten Discoms in terms of profit
after tax in million INR
TANGEDCO
APCPDCL
APSPDCL
JDVVNL
JVVNLAVVN
LAPNPDCL
DVVN (Agra)
J&K PDD
Poorv VVN (Varanasi)
2010 0 -222 40 0 90 -17, -210 -117
2011 -563 -159 30 -682 -76 -69 90 -132 -216 -126
2012 -1E+ -261 60 -617 -57 -75 40 -28, -303 -224
2013 -116 -77, -46, -42, -41 -39 -343 -336 -312 -253
-160000
-140000
-120000
-100000
-80000
-60000
-40000
-20000
0
20000
Mill
ion
INR
Bottom ten Discoms in terms of profit after tax in million INR

Page 8
3. AT&C losses
AT&C losses reduced to 25.4% in FY2013 from 26.3% in FY2012 and 26.0% in FY2011 and Collection efficiency increased to 94.3% in FY2013 from 93.2% in FY2012 ( 94.1% in FY2011)
The national average of AT&C losses are 25.38 % in 2013. Out of 62 DISCOMs studied, 27 DISCOMs have AT&C losses lower than national average while 35 DISCOMs have AT&C losses higher than national average.
Key observations from FY2010 to FY2013 at National level
Puducherry PD
HPSEB Ltd.
APEPDCL
DGVCL KSEB CESCAPSPD
CLAPNPD
CLNDPL Goa PD
2010 19.35% 9.69% 15.23% 16.63% 18.52% 15.68% 6.12%
2011 14.43% 10.12% 14.51% 13.08% 14.09% 14.20% 16.07% 13.75% 14.08%
2012 18.91% 18.04% 10.53% 13.14% 12.17% 12.19% 17.26% 15.67% 15.12%
2013 9.13% 9.53% 9.90% 10.40% 10.53% 12.30% 12.74% 13.09% 13.12% 14.14%
Per
cent
age
Top ten Discoms in terms of AT&C Losses
Arunachal PD
Manipur PD
Nagaland PD
J&K PDD BSEB Sikkim
PD
Poorv VVN
(Varanasi)
NBPDCL SESCO JSEB
2010 97.88% 47.55% 65.36% 70.04% 43.92% 27.86% 51.00% 10.43%
2011 93.22% 40.17% 49.73% 72.86% 47.44% 65.46% 53.31% 54.14% 46.79%
2012 77.28% 44.80% 22.85% 71.00% 59.24% 58.32% 52.37% 52.60% 42.77%
2013 92.96% 85.49% 75.30% 60.87% 59.40% 53.51% 52.37% 50.76% 49.36% 47.49%
Per
cent
age
Bottom ten Discoms in terms of AT&C Losses
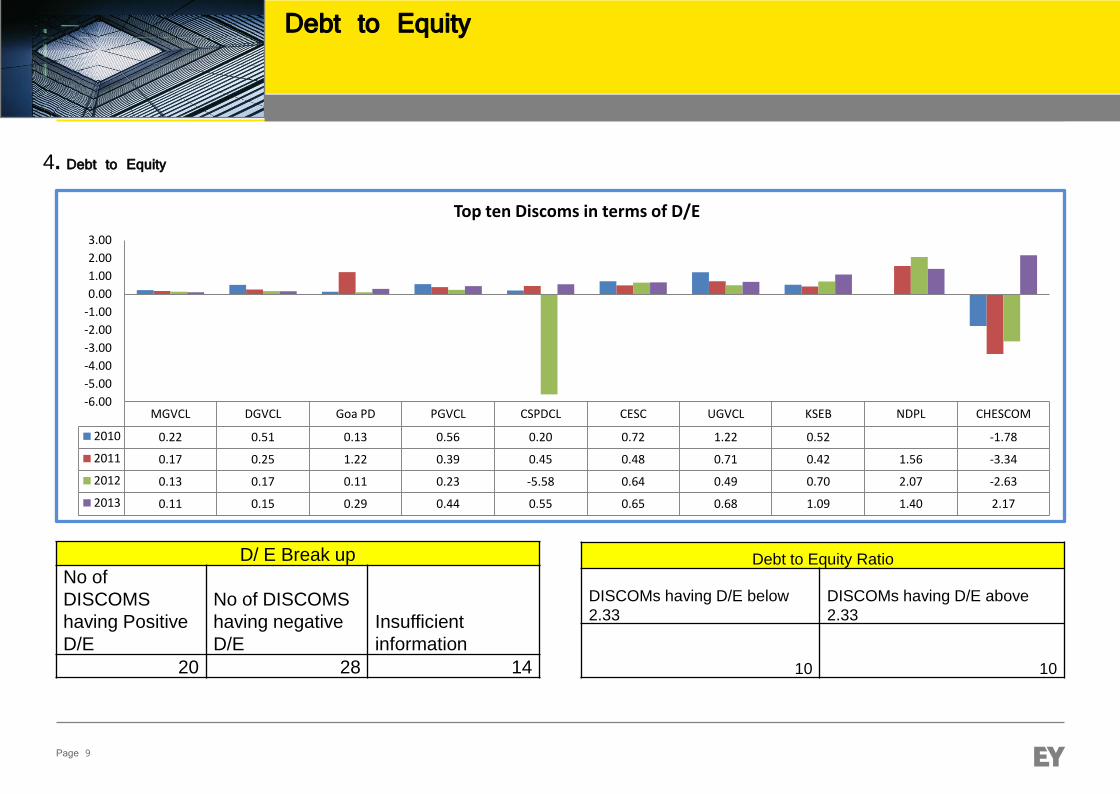
Page 9
Debt to Equity
MGVCL DGVCL Goa PD PGVCL CSPDCL CESC UGVCL KSEB NDPL CHESCOM
2010 0.22 0.51 0.13 0.56 0.20 0.72 1.22 0.52 -1.78
2011 0.17 0.25 1.22 0.39 0.45 0.48 0.71 0.42 1.56 -3.34
2012 0.13 0.17 0.11 0.23 -5.58 0.64 0.49 0.70 2.07 -2.63
2013 0.11 0.15 0.29 0.44 0.55 0.65 0.68 1.09 1.40 2.17
-6.00
-5.00
-4.00
-3.00
-2.00
-1.00
0.00
1.00
2.00
3.00
Top ten Discoms in terms of D/E
D/ E Break up
No of
DISCOMS
having Positive
D/E
No of DISCOMS
having negative
D/E
Insufficient
information
20 28 14
Debt to Equity Ratio
DISCOMs having D/E below
2.33
DISCOMs having D/E above
2.33
10 10
4. Debt to Equity
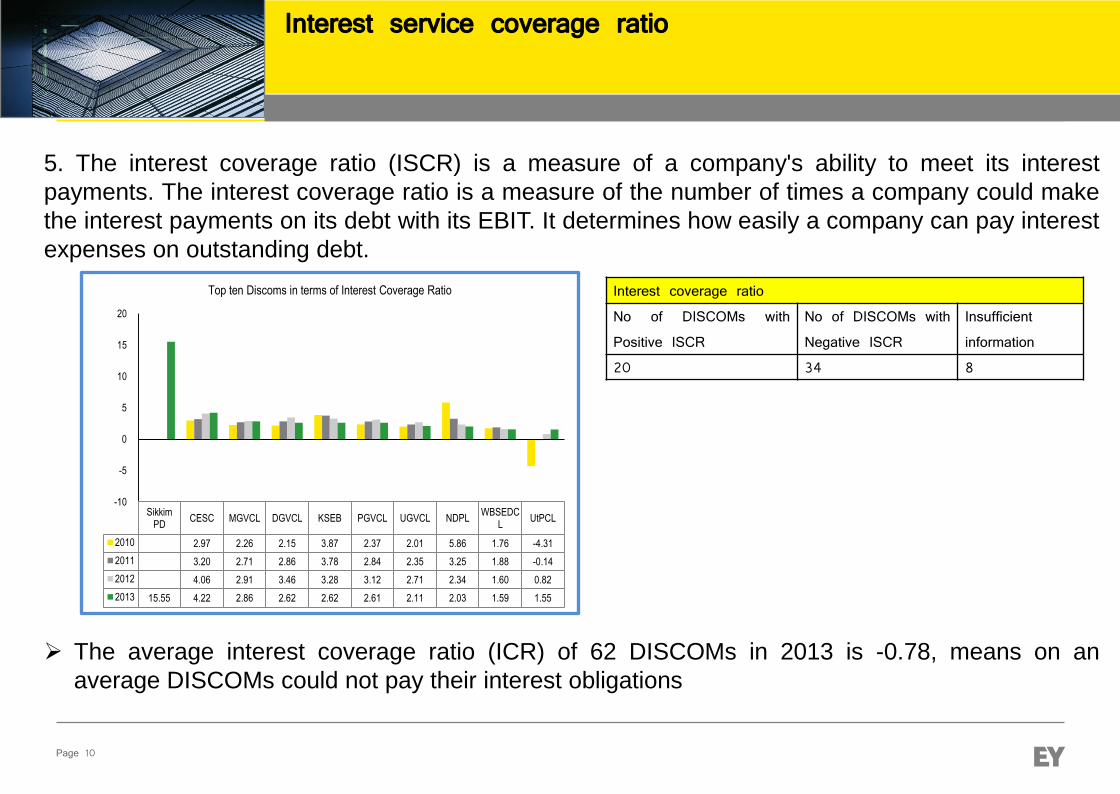
Page 10
Interest service coverage ratio
5. The interest coverage ratio (ISCR) is a measure of a company's ability to meet its interest
payments. The interest coverage ratio is a measure of the number of times a company could make
the interest payments on its debt with its EBIT. It determines how easily a company can pay interest
expenses on outstanding debt.
The average interest coverage ratio (ICR) of 62 DISCOMs in 2013 is -0.78, means on an
average DISCOMs could not pay their interest obligations
Interest coverage ratioNo of DISCOMs withPositive ISCR
No of DISCOMs withNegative ISCR
Insufficientinformation
20 34 8
Sikkim PD
CESC MGVCL DGVCL KSEB PGVCL UGVCL NDPLWBSEDC
LUtPCL
2010 2.97 2.26 2.15 3.87 2.37 2.01 5.86 1.76 -4.31
2011 3.20 2.71 2.86 3.78 2.84 2.35 3.25 1.88 -0.14
2012 4.06 2.91 3.46 3.28 3.12 2.71 2.34 1.60 0.82
2013 15.55 4.22 2.86 2.62 2.62 2.61 2.11 2.03 1.59 1.55
-10
-5
0
5
10
15
20
Top ten Discoms in terms of Interest Coverage Ratio
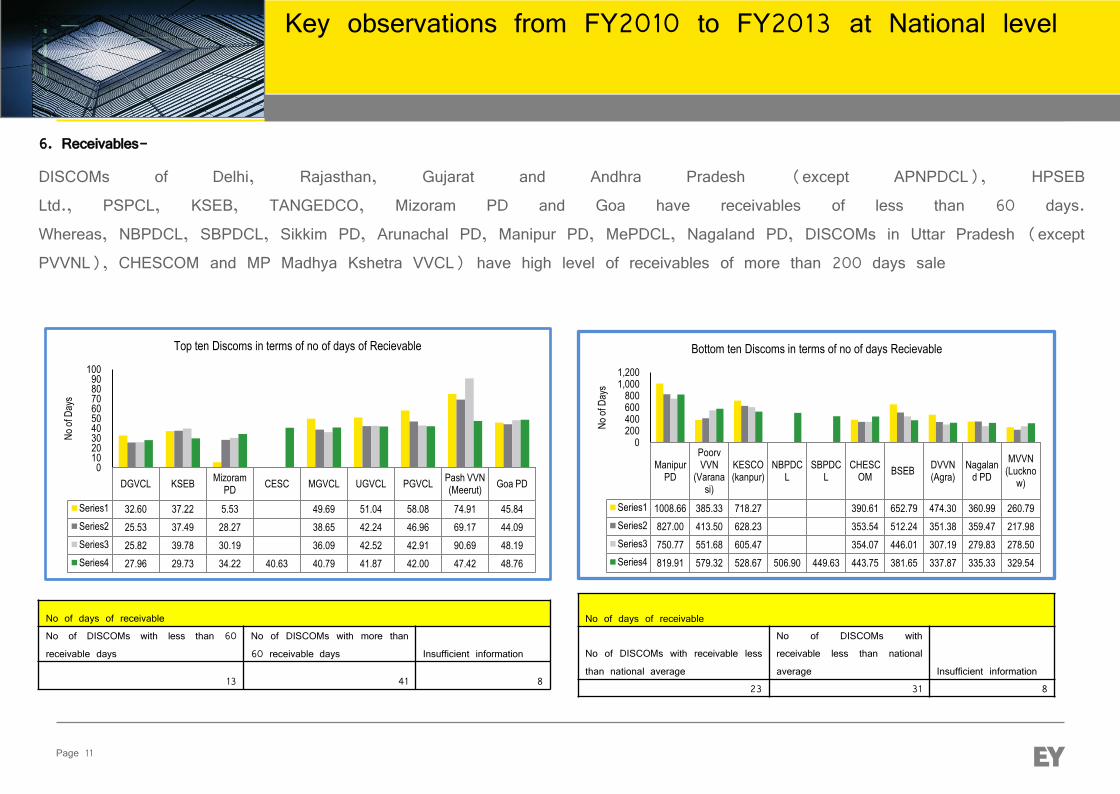
Page 11
6. Receivables-
DISCOMs of Delhi, Rajasthan, Gujarat and Andhra Pradesh (except APNPDCL), HPSEBLtd., PSPCL, KSEB, TANGEDCO, Mizoram PD and Goa have receivables of less than 60 days.Whereas, NBPDCL, SBPDCL, Sikkim PD, Arunachal PD, Manipur PD, MePDCL, Nagaland PD, DISCOMs in Uttar Pradesh (exceptPVVNL), CHESCOM and MP Madhya Kshetra VVCL) have high level of receivables of more than 200 days sale
Key observations from FY2010 to FY2013 at National level
DGVCL KSEBMizoram
PDCESC MGVCL UGVCL PGVCL
Pash VVN (Meerut)
Goa PD
Series1 32.60 37.22 5.53 49.69 51.04 58.08 74.91 45.84
Series2 25.53 37.49 28.27 38.65 42.24 46.96 69.17 44.09
Series3 25.82 39.78 30.19 36.09 42.52 42.91 90.69 48.19
Series4 27.96 29.73 34.22 40.63 40.79 41.87 42.00 47.42 48.76
0102030405060708090
100
No
of D
ays
Top ten Discoms in terms of no of days of Recievable
Manipur PD
Poorv VVN
(Varanasi)
KESCO (kanpur)
NBPDCL
SBPDCL
CHESCOM
BSEB DVVN (Agra)
Nagaland PD
MVVN (Luckno
w)
Series1 1008.66 385.33 718.27 390.61 652.79 474.30 360.99 260.79
Series2 827.00 413.50 628.23 353.54 512.24 351.38 359.47 217.98
Series3 750.77 551.68 605.47 354.07 446.01 307.19 279.83 278.50
Series4 819.91 579.32 528.67 506.90 449.63 443.75 381.65 337.87 335.33 329.54
0200400600800
1,0001,200
No
of D
ays
Bottom ten Discoms in terms of no of days Recievable
No of days of receivableNo of DISCOMs with less than 60receivable days
No of DISCOMs with more than60 receivable days Insufficient information
13 41 8
No of days of receivable
No of DISCOMs with receivable lessthan national average
No of DISCOMs withreceivable less than nationalaverage Insufficient information
23 31 8
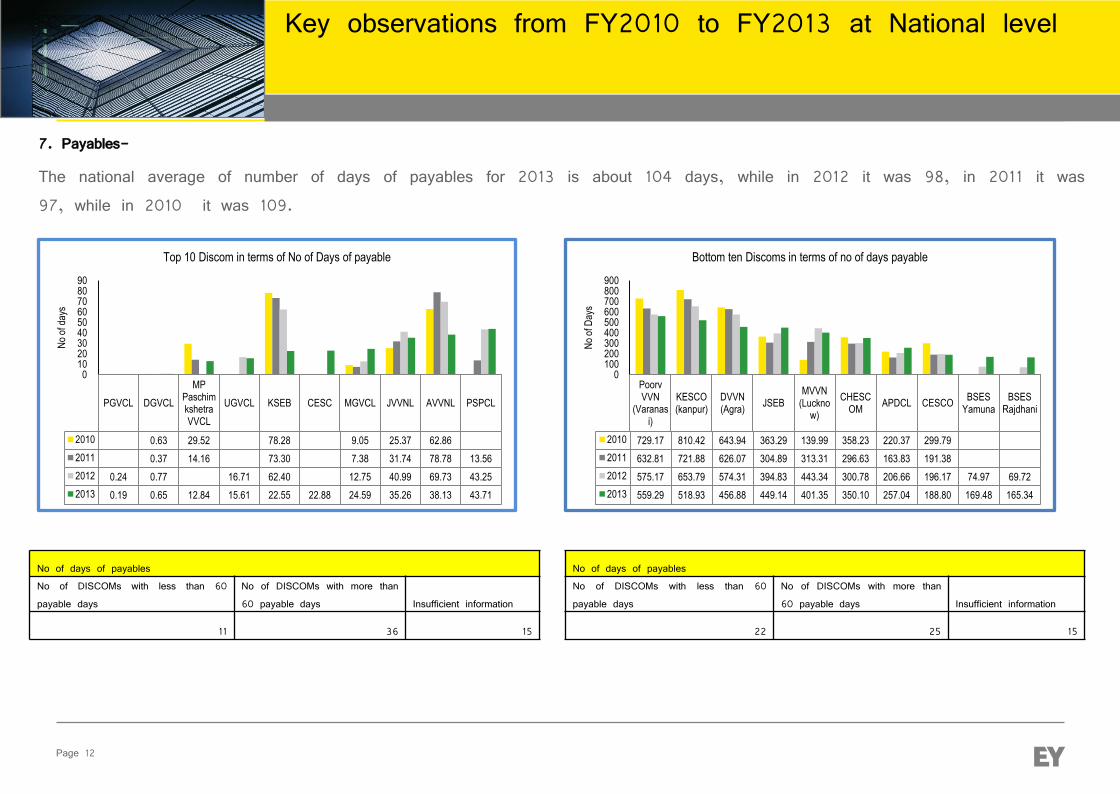
Page 12
7. Payables-
The national average of number of days of payables for 2013 is about 104 days, while in 2012 it was 98, in 2011 it was97, while in 2010 it was 109.
Key observations from FY2010 to FY2013 at National level
PGVCL DGVCL
MP Paschim kshetra VVCL
UGVCL KSEB CESC MGVCL JVVNL AVVNL PSPCL
2010 0.63 29.52 78.28 9.05 25.37 62.86
2011 0.37 14.16 73.30 7.38 31.74 78.78 13.56
2012 0.24 0.77 16.71 62.40 12.75 40.99 69.73 43.25
2013 0.19 0.65 12.84 15.61 22.55 22.88 24.59 35.26 38.13 43.71
0102030405060708090
No
of d
ays
Top 10 Discom in terms of No of Days of payable
Poorv VVN
(Varanasi)
KESCO (kanpur)
DVVN (Agra)
JSEBMVVN
(Lucknow)
CHESCOM
APDCL CESCOBSES
YamunaBSES
Rajdhani
2010 729.17 810.42 643.94 363.29 139.99 358.23 220.37 299.79
2011 632.81 721.88 626.07 304.89 313.31 296.63 163.83 191.38
2012 575.17 653.79 574.31 394.83 443.34 300.78 206.66 196.17 74.97 69.72
2013 559.29 518.93 456.88 449.14 401.35 350.10 257.04 188.80 169.48 165.34
0100200300400500600700800900
No
of D
ays
Bottom ten Discoms in terms of no of days payable
No of days of payablesNo of DISCOMs with less than 60payable days
No of DISCOMs with more than60 payable days Insufficient information
11 36 15
No of days of payablesNo of DISCOMs with less than 60payable days
No of DISCOMs with more than60 payable days Insufficient information
22 25 15

Page 13
8. Regulatory Asset and Subsidy
Key observations from FY2010 to FY2013 at National level
States with Highest Regulatory Asset Build-up State Regulatory Assets (Rs billion)
StateRs billion
Tamil Nadu 256.44
Rajasthan 160.33
Delhi 71.90
Kerala 60.18
Haryana 23.44
West Bengal 21.75
Punjab 13.52
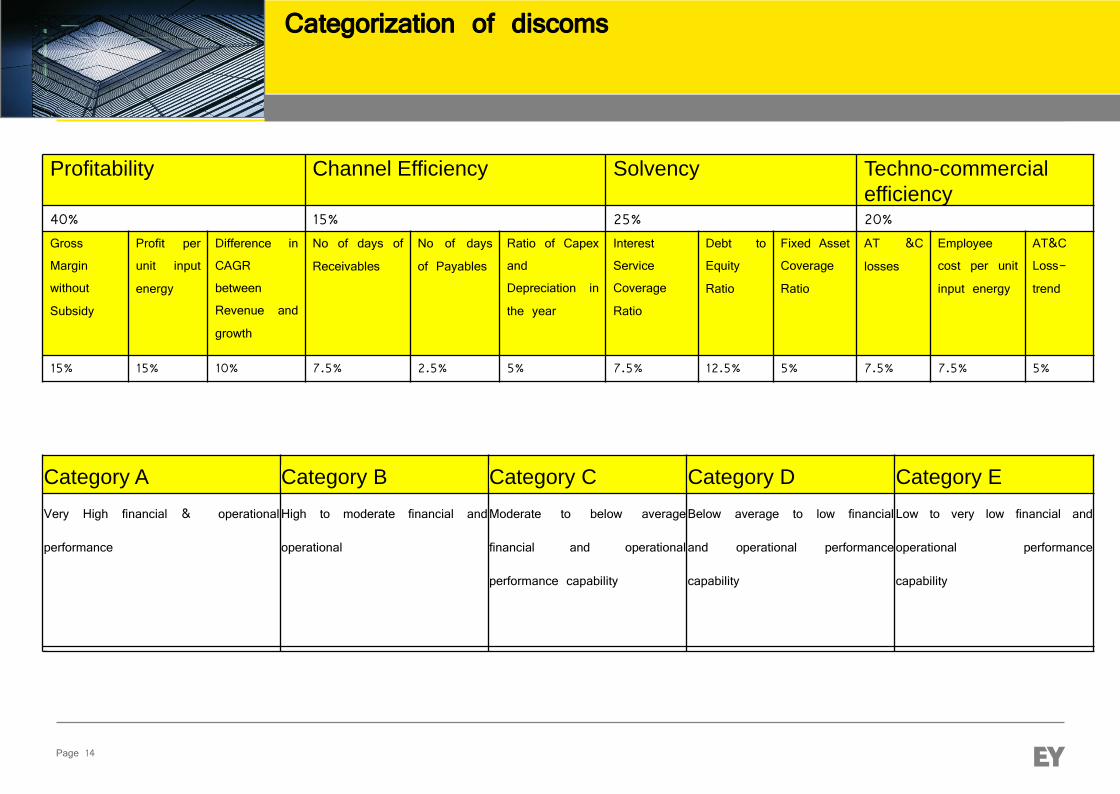
Page 14
Profitability Channel Efficiency Solvency Techno-commercial
efficiency40% 15% 25% 20%GrossMarginwithoutSubsidy
Profit perunit inputenergy
Difference inCAGRbetweenRevenue andgrowth
No of days ofReceivables
No of daysof Payables
Ratio of CapexandDepreciation inthe year
InterestServiceCoverageRatio
Debt toEquityRatio
Fixed AssetCoverageRatio
AT &Closses
Employeecost per unitinput energy
AT&CLoss-trend
15% 15% 10% 7.5% 2.5% 5% 7.5% 12.5% 5% 7.5% 7.5% 5%
Categorization of discoms
Category A Category B Category C Category D Category E
Very High financial & operational
performance
High to moderate financial and
operational
Moderate to below average
financial and operational
performance capability
Below average to low financial
and operational performance
capability
Low to very low financial and
operational performance
capability
UHBVNL
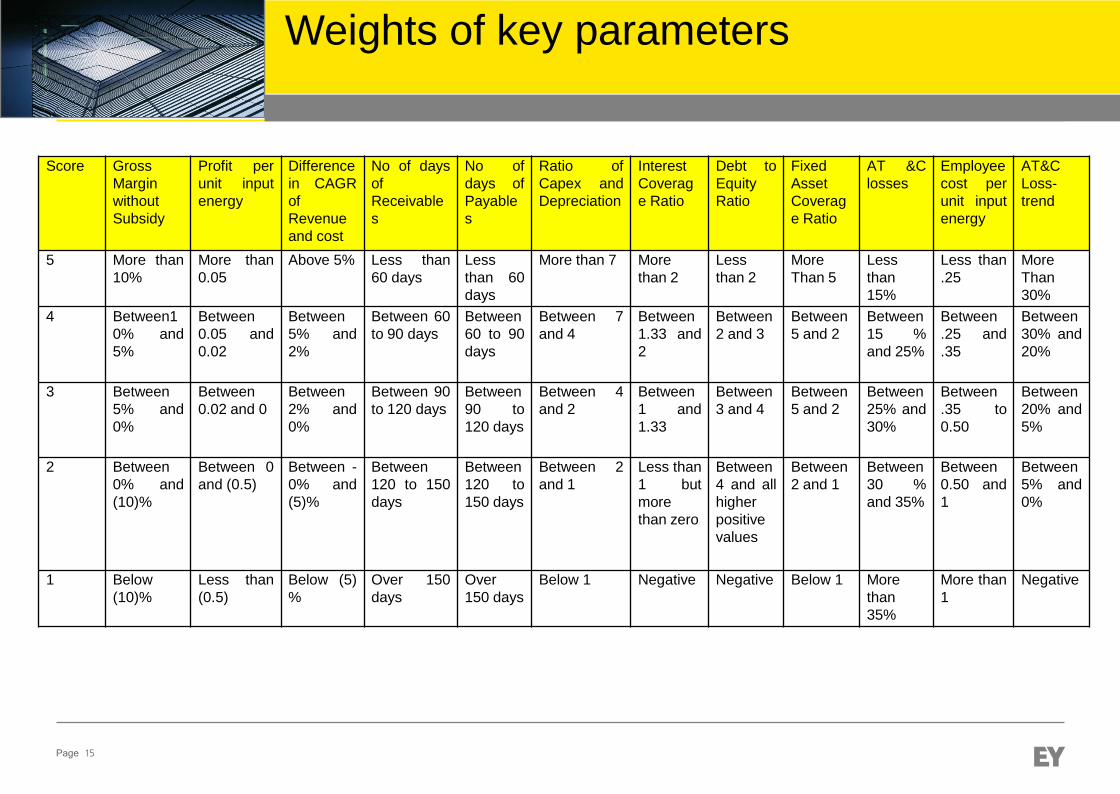
Page 15
Score Gross
Margin
without
Subsidy
Profit per
unit input
energy
Difference
in CAGR
of
Revenue
and cost
No of days
of
Receivable
s
No of
days of
Payable
s
Ratio of
Capex and
Depreciation
Interest
Coverag
e Ratio
Debt to
Equity
Ratio
Fixed
Asset
Coverag
e Ratio
AT &C
losses
Employee
cost per
unit input
energy
AT&C
Loss-
trend
5 More than
10%
More than
0.05
Above 5% Less than
60 days
Less
than 60
days
More than 7 More
than 2
Less
than 2
More
Than 5
Less
than
15%
Less than
.25
More
Than
30%
4 Between1
0% and
5%
Between
0.05 and
0.02
Between
5% and
2%
Between 60
to 90 days
Between
60 to 90
days
Between 7
and 4
Between
1.33 and
2
Between
2 and 3
Between
5 and 2
Between
15 %
and 25%
Between
.25 and
.35
Between
30% and
20%
3 Between
5% and
0%
Between
0.02 and 0
Between
2% and
0%
Between 90
to 120 days
Between
90 to
120 days
Between 4
and 2
Between
1 and
1.33
Between
3 and 4
Between
5 and 2
Between
25% and
30%
Between
.35 to
0.50
Between
20% and
5%
2 Between
0% and
(10)%
Between 0
and (0.5)
Between -
0% and
(5)%
Between
120 to 150
days
Between
120 to
150 days
Between 2
and 1
Less than
1 but
more
than zero
Between
4 and all
higher
positive
values
Between
2 and 1
Between
30 %
and 35%
Between
0.50 and
1
Between
5% and
0%
1 Below
(10)%
Less than
(0.5)
Below (5)
%
Over 150
days
Over
150 days
Below 1 Negative Negative Below 1 More
than
35%
More than
1
Negative
Weights of key parameters
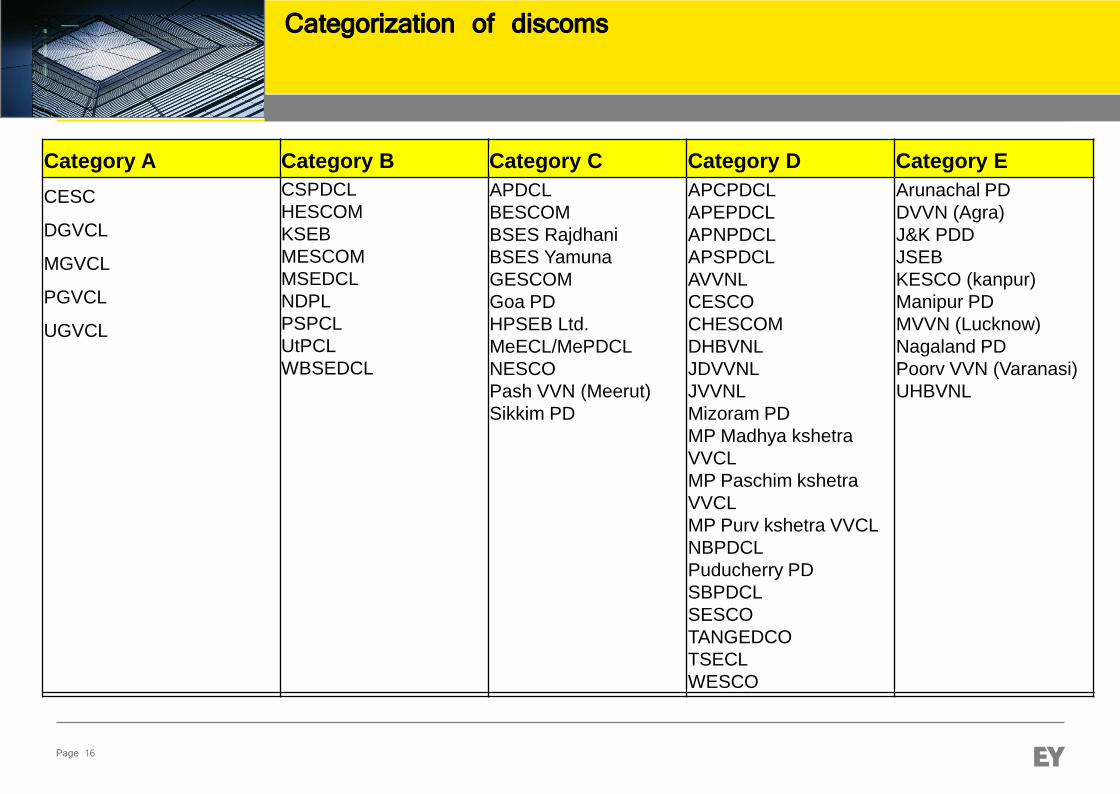
Page 16
Categorization of discoms
Category A Category B Category C Category D Category E
CESC
DGVCL
MGVCL
PGVCL
UGVCL
CSPDCL
HESCOM
KSEB
MESCOM
MSEDCL
NDPL
PSPCL
UtPCL
WBSEDCL
APDCL
BESCOM
BSES Rajdhani
BSES Yamuna
GESCOM
Goa PD
HPSEB Ltd.
MeECL/MePDCL
NESCO
Pash VVN (Meerut)
Sikkim PD
APCPDCL
APEPDCL
APNPDCL
APSPDCL
AVVNL
CESCO
CHESCOM
DHBVNL
JDVVNL
JVVNL
Mizoram PD
MP Madhya kshetra
VVCL
MP Paschim kshetra
VVCL
MP Purv kshetra VVCL
NBPDCL
Puducherry PD
SBPDCL
SESCO
TANGEDCO
TSECL
WESCO
Arunachal PD
DVVN (Agra)
J&K PDD
JSEB
KESCO (kanpur)
Manipur PD
MVVN (Lucknow)
Nagaland PD
Poorv VVN (Varanasi)
UHBVNL
UHBVNL
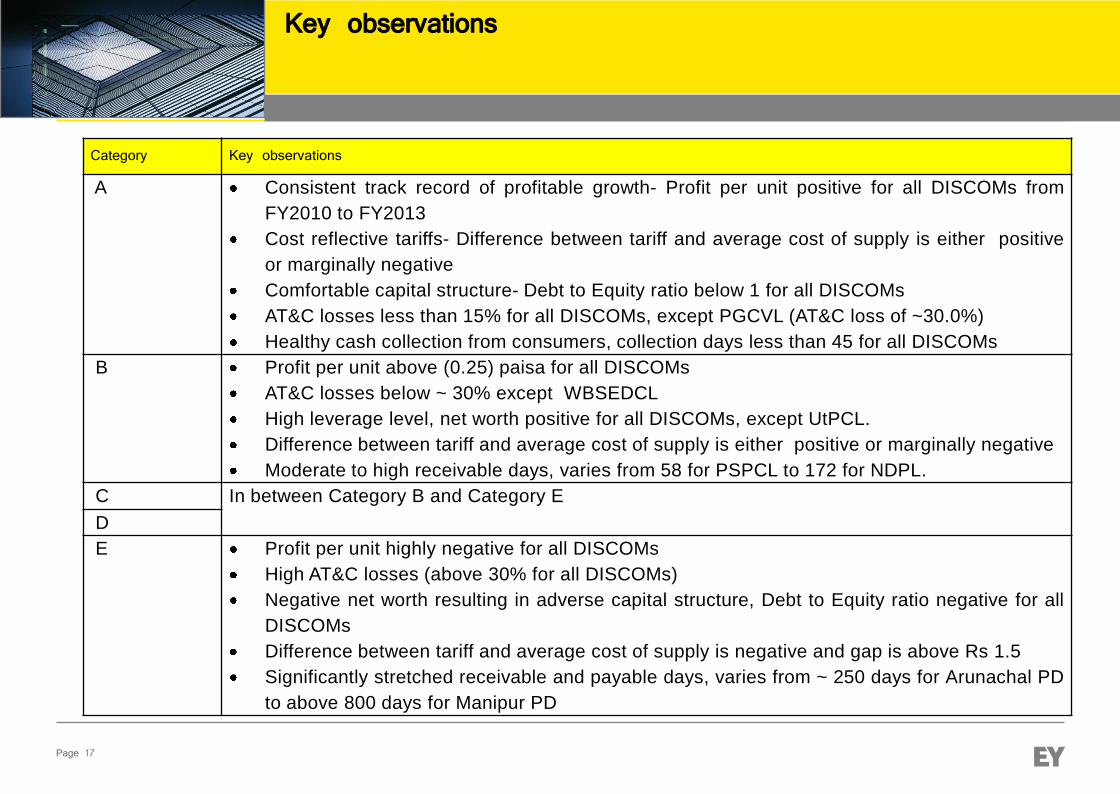
Page 17
Category Key observations
A Consistent track record of profitable growth- Profit per unit positive for all DISCOMs from
FY2010 to FY2013
Cost reflective tariffs- Difference between tariff and average cost of supply is either positive
or marginally negative
Comfortable capital structure- Debt to Equity ratio below 1 for all DISCOMs
AT&C losses less than 15% for all DISCOMs, except PGCVL (AT&C loss of ~30.0%)
Healthy cash collection from consumers, collection days less than 45 for all DISCOMs
B Profit per unit above (0.25) paisa for all DISCOMs
AT&C losses below ~ 30% except WBSEDCL
High leverage level, net worth positive for all DISCOMs, except UtPCL.
Difference between tariff and average cost of supply is either positive or marginally negative
Moderate to high receivable days, varies from 58 for PSPCL to 172 for NDPL.
C In between Category B and Category E
D
E Profit per unit highly negative for all DISCOMs
High AT&C losses (above 30% for all DISCOMs)
Negative net worth resulting in adverse capital structure, Debt to Equity ratio negative for all
DISCOMs
Difference between tariff and average cost of supply is negative and gap is above Rs 1.5
Significantly stretched receivable and payable days, varies from ~ 250 days for Arunachal PD
to above 800 days for Manipur PD
Key observations
Page 18
Slide title here
►Thank you
Amit BhatiaSr Associate
Joyant NayakDirector
+91 97177 [email protected]
Alok Kumar SinghAssociate
+91 8943428652

Page 19
Disclaimer
Ernst & Young LLP is one of the Indian client serving member firms of EYGM Limited. For more information about our organization, please visit www.ey.com/india
Ernst & Young LLP is a Limited Liability Partnership, registered under the Limited Liability Partnership Act, 2008 in India, having its registered office at 22 Camac Street, 3rd Floor, Block C, Kolkata – 700016
© 2015 Ernst & Young LLP. Published in India.
All Rights Reserved.
This publication contains information in summary form and is therefore intended for general guidance only. It is not intended to be a substitute for detailed research or the exercise of professional judgment. Neither EYGM Limited nor any other member of the global Ernst & Young organization can accept any responsibility for loss occasioned to any person acting or refraining from action as a result of any material in this publication. On any specific matter, reference should be made to the appropriate advisor
1 January
2014
Presentation title
Page 20
Contact us
Ahmedabad
2nd floor, Shivalik Ishaan
Near C.N. Vidhyalaya
Ambawadi
Ahmedabad - 380 015
Tel: + 91 79 6608 3800
Fax: + 91 79 6608 3900
Bengaluru
12th & 13th floor
“UB City”, Canberra Block
No.24 Vittal Mallya Road
Bengaluru - 560 001
Tel: + 91 80 4027 5000
+ 91 80 6727 5000
Fax: + 91 80 2210 6000 (12th floor)
Fax: + 91 80 2224 0695 (13th floor)
1st Floor, Prestige Emerald
No. 4, Madras Bank Road
Lavelle Road Junction
Bengaluru - 560 001
Tel: + 91 80 6727 5000
Fax: + 91 80 2222 4112
Chandigarh
1st Floor, SCO: 166-167
Sector 9-C, Madhya Marg
Chandigarh - 160 009
Tel: + 91 172 671 7800
Fax: + 91 172 671 7888
Chennai
Tidel Park, 6th & 7th Floor
A Block (Module 601,701-702)
No.4, Rajiv Gandhi Salai, Taramani Chennai -
600113
Tel: + 91 44 6654 8100
Fax: + 91 44 2254 0120
Hyderabad
Oval Office, 18, iLabs Centre
Hitech City, Madhapur
Hyderabad - 500081
Tel: + 91 40 6736 2000
Fax: + 91 40 6736 2200
Kochi
9th Floor, ABAD Nucleus
NH-49, Maradu PO
Kochi - 682304
Tel: + 91 484 304 4000
Fax: + 91 484 270 5393
Kolkata
22 Camac Street
3rd floor, Block „C‟
Kolkata - 700 016
Tel: + 91 33 6615 3400
Fax: + 91 33 2281 7750
Mumbai
14th Floor, The Ruby
29 Senapati Bapat Marg
Dadar (W), Mumbai - 400028
Tel: + 91 022 6192 0000
Fax: + 91 022 6192 1000
5th Floor, Block B-2
Nirlon Knowledge Park
Off. Western Express Highway
Goregaon (E)
Mumbai - 400 063
Tel: + 91 22 6192 0000
Fax: + 91 22 6192 3000
NCR
Golf View Corporate Tower B
Near DLF Golf Course
Sector 42
Gurgaon - 122002
Tel: + 91 124 464 4000
Fax: + 91 124 464 4050
6th floor, HT House
18-20 Kasturba Gandhi Marg
New Delhi - 110 001
Tel: + 91 11 4363 3000
Fax: + 91 11 4363 3200
4th & 5th Floor, Plot No 2B, Tower 2, Sector 126,
NOIDA 201 304
Gautam Budh Nagar, U.P. India
Tel: + 91 120 671 7000
Fax: + 91 120 671 7171
Pune
C-401, 4th floor
Panchshil Tech Park
Yerwada
(Near Don Bosco School)
Pune - 411 006
Tel: + 91 20 6603 6000
Fax: + 91 20 6601 5900
1 January
2014
Presentation title