minor water bodies in kottayam municipality area: a bio
TRANSCRIPT
Minor Water Bodies in Kottayam Municipality Area: A bio-ecological study
Susy AbrahamMadanakumar C. K
Discussion Paper No. 312001
Kerala Research Programme on Local Level DevelopmentCentre for Development Studies
Thiruvananthapuram

2
Minor Water Bodies in Kottayam Municipality Area:A bio-ecological study
Susy AbrahamMadanakumar C. K
EnglishDiscussion Paper
Rights reservedFirst published 2001Editorial Board: Prof. P. R. Gopinathan Nair, H. ShajiPrinted at:Kerala Research Programme on Local Level DevelopmentPublished by:Dr K. N. Nair, Programme Co-ordinator,Kerala Research Programme on Local Level Development,Centre for Development Studies,Prasanth Nagar, Ulloor,Thiruvananthapuram 695 011Tel: 0471-550 465, 550 491Fax: 0471-550 465E-mail: [email protected]: http://www.krpcds.org/Cover Design: Defacto Creations
ISBN No: 81-87621-33-8
Price: Rs 40US$ 5
KRPLLD 2001 0750 ENG

3
Contents
1. Introduction 5
2. Materials and methods 10
3. Findings and discussion 27
4. Summary and conclusions 39
References 42

5
Minor Water Bodies in Kottayam Municipality Area: A bio-ecologicalstudy
Susy Abraham, Madanakumar C. K*
1. Introduction
Environment is not just a sector of our society or a separate compartment of our existence butan integral part of every day life. Hence in an urban environment, for orderly growth, along-term plan, not only for industrial and agricultural development, but also for the entireinfrastructure or entire environment, utilisation of water resources, transport, power andtown planning for the cities, is of paramount importance.
While planning a city, the planners such as a Town Planning Board, invariably keep asidecertain areas for putting up parks. Parks are usually referred to as lungs of the city. They areareas where people who live in crowded flats and work in equally crowded offices, canbreathe in deep gulps of air and relax.
Similarly, minor water bodies are the kidneys of an area or a city. They are as important asthe parks, for a number of reasons such as the following:
Source of water
Water is an essential component of life and is required for most of the vital activities of livingbeings like drinking, bathing, washing, irrigation, and industrial operations. The water col-lected in major water bodies is used for some of these activities. Increase in population, ill-conceived industrialisation and urbanisation have made underground water increasingly scarceas well as difficult and expensive to obtain.
Ground-water recharge sources
Water-scarcity is a major problem in nearly all the cities of the world. Underground is themost inexpensive source of water. Rainwater, which accumulates in small water bodies,percolates through the soil and reaches the ground water system or the nearby wells.
ACKNOWLEDGEMENTS: The investigators are indebted to the Kerala Research Programme on LocalLevel Development (KRPLLD) programme for their financial assistance and moral support for carrying outthis project. We express our sincere thanks to the management of the C.M.S College Kottayam for permit-ting us to use the Department of Zoology as a base. We are grateful to the to the CWRDM, Kottayam, TownPlanning Board, Kottayam, and Kottayam Development Authorities for the help rendered in mapping workWe express our sincere thanks to Rincy Mathew andRogy George for their timely help during the initial phase of the project. The support rendered by co-projectinvestigators under the KRPLLD programme is also acknowledged. We express sincere thanks to GoldenGraphics for the computer work.
6
Water-quality improvement
In addition to rainwater, water from drains and sewage pipes, as well as wastewater fromindustrial houses and households also finds their way into water bodies. In minor waterbodies wastewater may cause high concentrations of BOD, COD, nitrates, organic chemi-cals, and bacteria. Municipal wastes and industrial effluents are known to bring bacteria,viruses, and inorganic and organic chemicals into the water bodies. The problem of pollutionfrom solid waste is the greatest in areas of high rainfall and shallow water table. The leakagefrom solid wastes increases the concentration of hardness, alkalinity and total dissolved solidsof underground water (Todd, et. al, 1976). The water that collects in the minor water-bodies remains in them for sometime till they overflow into nearby streams or percolate intothe ground-water system. While remaining in the water bodies the water is acted upon bysunlight, as well as detoxifying and decomposing micro-organisms. The plants that grow inthe water bodies take in the polluted water and evaporate pure-water into the air. The waterthat percolates into the groundwater system also gets filtered and purified to some extent.Thus a process of natural treatment of run-off water takes place with absolutely no economicinput.
Recently Sharma (1995) surveyed the ground-water quality of 22 problem areas of differentstates of India and found that most of the underground water samples were contaminated dueto leaching of chemicals or seepage of industrial solid wastes.
Preventing floods
Flooding has now become an annual feature of every city and town, which lies in a rainyregion. Kottayam town is no exception. As more and more open areas in the town are gettingfilled up and buildings constructed on them, rainwater has no alternative but to flood into thenearest low-lying areas, thus forcing large number of families occupying the houses in theselow areas to leave them. This problem could be reduced to a certain extent by letting thewater flow into minor water bodies. These bodies could be deepened, if needed.
Dispersion of erosive forces
Land degradation by soil erosion is another major problem. Erosion makes soil less able toretain water, depletes it of nutrients and reduces the depth available for the roots to take hold.If the run off water is allowed to flow into minor water bodies, run off distance could bereduced and the effect of erosion decreased.
Sources of indigenous biotic material
Minor water bodies are characterised by relatively quiet waters and abundant vegetation.Large numbers of micro- and macro-organisms dwell in these minor water bodies. Therichness of the fauna is dependent mainly on the presence of respiratory gases, the amount ofsunlight penetration and turbidity. Temperature fluctuation is also significant.A number of the flora and the fauna are endemic to the area concerned. For example, Caridina

7
natarajani is a fresh-water shrimp, so far reported only from the minor water bodies ofKerala.
Food chain support
The numerous flora and fauna inhabiting the minor water bodies form an important constitu-ent of food chains, bio-geo-chemical cycles, and other ecological interactions.
Control of mosquitoes
Mosquitoes act as vectors for a number of tropical infections and hence are a health hazard.Mosquitoes, especially of the culicine group, are predominant in urban areas, due to insani-tary conditions. Rapid urbanisation and industrialisation are responsible for increase in thepopulation of mosquitoes. Stagnant drains, septic tanks, ponds, wells, miscellaneous con-tainers, flowerpots, tree holes, etc. form their favourable breeding sites. Mosquito control isa major problem faced by municipalities. Controlling them would be easier, if there areknown, plotted-out water-bodies in a town or city. The use of larvivorous fishes and othereco-friendly methods could be employed, to control them, in these identified habitats.
Economic uses
Aquaculture is a possible means to use the minor water bodies for economical benefit. It is anefficient means of recycling agricultural and domestic wastewater and thus protecting theenvironment. Pond-fish culture comprising mono-sex culture, mono-species culture, com-posite fish culture, and predatory fish culture could be practised in minor water bodies.
Aesthetic benefits
Planned construction of minor water bodies could make them beautiful spots for rest andrelaxation.
Thus it is very clear that study of minor urban water bodies in an urban area is of greatimportance. No such study has been conducted, so far, in any of the major urban areas inKerala. The present endeavour is to fill this lacuna.
Objectives
General
(i) To identify and map the water bodies,(ii) To study their bio-ecological and biogeographical characteristics,(iii) To estimate their relevance and environmental impact,(iv) To assess the level of their pollution, degradation, and depletion caused by human
intervention,(v) To study the effect of their changes on ground water level, and(vi) To suggest methods of their conservation and of finding alternative water resources.

8
Collection and analysis of data
The study would be carried out in a series of steps outlined below.
Mapping of minor water bodies
Survey of the Kottayam Municipality area and identification and mapping of minor waterbodies.
Physico-chemical parameters
Estimation of rain fall and analysis, water depth, water input and output, atmospheric andwater temperature, water transparency, dissolved oxygen, pH, free carbon dioxide,phenolpthalene alkalinity, methyl orange alkalinity, total alkalinity, conductivity, chloride,inorganic phosphate, calcium, magnesium, and biological oxygen demand.
Limnology
(i) Assessment of biomass of both phyto-, and zoo-plankton and their seasonal and annualvariations.
(ii) Determination of primary productivity in the water spread area and its seasonal andannual variations.
Vegetation
Gathering of information on the aquatic plants present in the study area.
Fauna
(i) Collection of data on the aquatic macro-invertebrates, their biomass and seasonal vari-ations.
(ii) Survey of insects, fish, birds, mammals and any other organisms associated with thewater bodies.
Pollution
Survey of the level of pollutants: oil pollutants, organic pollutants, etc.
Groundwater
Measurement of changes in the water level in the wells surrounding the water bodies.
Study of methods to initiate action at the local level
Formulation of methods to initiate action. For this purpose, co-operation of students, thepublic, NGOs and media would be sought. Seminars would be held to disseminate ideas andreceive feedback.

9
It is expected that the analysis of the data collected would highlight the bio-ecological impor-tance of minor urban water bodies, their relation with ground water level and their pollutionand would create social and mass media interest in these water bodies. It would also bringabout the interaction and intervention between non-governmental and governmental organi-sations essential for preventing the misuse and decay of the minor water bodies.

10
2. Materials and Methods
Method
Based on the objectives of the study, the method for the collection of data was selected.
Survey with field study
At the outset, appropriate maps and information on the relevant features of the study areawere collected from the Municipality authorities, and CWRDM, Kottayam. A direct fieldsurvey was then conducted. All relevant information about each minor water body was col-lected through the survey. During the field survey photographs and slides to highlight thespecific features of each minor water body were prepared.
Analysis of physico-chemical parameters
For the specific study of the bio-ecological nature of the minor water bodies, three of thewater bodies were selected: the first from the lowland area with fairly clear water (Pond No.21), the second from midland area with slightly polluted water (Pond No. 35), and the thirdfrom the wet land area with highly polluted water (Pond No. 32). Water samples werecollected on a monthly basis from September 1997 to August 1998 except April and May1998, since the level of water was found extremely low during these months. The analysiswas conducted in the laboratory of the Department of Zoology of the CMS College, Kottayam.Analysis of physico-chemical parameters was conducted using standard analytical methods.
Description of the study area
Kottayam municipality area
The location of the study area is shown in Figures 2.1 and 2.2. Further details arefurnished below:
Location
Longitude : Between 90.34‘ and 90.36‘ N.
Latitude : Between 760.34‘ and 760‘.36‘ E.
Area : 15.55sq. km.
Boundaries
East : Vijayapuram panchayat
West : Thiruvarp panchayat
North : Aymanam, Kumaranallooor panchayat
South : Nattakom panchayat

11
India Kerala
Figure 2.1 Location of the study area
Kottayam District

12
Figure 2.2 Location of Kottayam municipality area
Figure 2.3 Location of minor water bodies in the study area(Kottayam Municipality Area) 48 –Water bodies N
S Pond Selected for Chemical Analysis
1.Pond No. 212.Pond No. 273.Pond No. 35

13
The Kottayam municipality area, which covers three villages (Kottayam, Muttambalam, andVeloor) is divided into the following 32 wards.
Ward No. Name Area (sq. km) 1 Eranjal 0.2475
2 Manganam 0.675
3 Devalokam 0.75
4 Kanjikuzhy 0.355
5 Muttambalam 0.7875
6 Holy family 0.435
7 Convent 0.3125
8 Railway station 0.3625
9 Hospital 0.235
10 Civil station 0.80
11 M.D. Seminary 0.293
12 Cathedral 0.26
13 Kodimatha 0.5875
14 Vayaskara 0.4225
15 Union Club 0.29
16 Nagambadom 0.3654
17 Tirunakara 0.3425
18 Kurisupalli 0.2255
19 Pazhaya seminary 0.82
20 Thaliyilkotta 0.3052
21 Thirumala 0.37
22 Valiakunnupuram 0.4524
23 Puthenangadi 0.3725
24 Boat Jetty 0.3656
25 Sastankovil 0.4875
26 Ambalakadav 0.4875
27 Thazhathagadi 0.46
28 Karapuzha 0.96
29 Pulinakkal 0.72
30 Veloor 0.71
31 Parappadom 0.44
32 Kanjiram 0.9025
Total 15.55 sq.km

14
Based on the topography, the Kottayam Municipality area falls under three regions:
(i) Lowland comprising Thazhathangadi, Veloor, Thiruvathuckal, Karapuzha,Eranjal,Nagampadom, Chandakadav, Chungam, Old seminary, Mullenkuzhy, andKanjikuzhy areas;
(ii) Midland consisting of CMS College, Annan kunnu, and Civil Station areas; and(iii) Highland covering Devalokam, Muttambalam, and Basalius College areas.
Observation
The details of the 48 water bodies covered under the field survey are furnished in the follow-ing description and Tables 1 to 4.
Details of the minor water bodies based on direct survey
(Age: approximates; Biota: only prominent ones mentioned)
Pond No. 1
Location : Thiruvathuckal, (Ward No. 29; Pulinakal), LowlandOwnership : PrivateDimensions : Area: 300m2, Volume = 1500m3
Age : 27 yearsDescription : Rectangular shape; Outlet is present; Natural pond, muddy water,
Annually flooded; Used for fish culture.Flora : Algal bloomsFauna : Frogs, Fishes
Pond No. 2
Location : Thiruvathuckal, (Ward No. 29, Pulinakal, 750m from CWRDM).Lowland
Ownership : Ittycherian, Krupa - PulinakalDimensions : Area : 50m2, Volume : 250m3
Age : 20 years oldDescription : Rectangular shape; No inlet or outlet; During monsoons, area is
flooded. Muddy soil; Used for fish culture.Flora : Algal blooms, GrassesFauna : Aquatic insects, Frogs, Fishes
Pond No. 3
Location : Karapuzha, (Ward No. 28), LowlandLocal name : ParakkulamOwnership : C.V. Jacob, NanthyaltuAge : 20 years

15
Dimensions : Area : 120m2, Volume : 240m3
Description : Oval shape; Pond formed due to quarry work; No inlet or outlet;Used for fish culture; clear water
Flora : Algal blooms;Fauna : Frogs, Fishes
Pond No. 4
Location : Karapuzha, (Ward No. 28), LowlandOwnership : PublicAge : 25 yearsDimensions : Area : 20m2, Volume : 80m3
Description : Rectangular shape; Inlet and outlet present; Outflow takes place,near to the Karapuzha bridge, into the Karapuzha Thodu.
Flora : Salvinea, Eichornia,Fauna : Fishes, Snakes, Frogs.
Pond No. 5
Location : Erakadav; Near to KSRTC Bus stand, Low level area, Lowland(Ward No:13)
Ownership : Private.Dimensions : Area : 35m2, Volume = 140m3
Age : 16 yearsDescription : Rectangular shape; Erakadav is a highly polluted, two acres of
flood wetland; Waste from a timber factory pollutes the pond;Inlet and outlet present. The whole area is polluted with sewagewater from the city, factory etc; Outlet is to Kodoor River.
Flora : Grasses, Pandanus, Colocassia, etc.Fauna : Mosquito larvae, Snakes, Frogs, etc.
Pond No. 6
Location : 500m from KSRTC Bus stand (Ward No. 13)Ownership : PublicDimensions : Area : 9m2, Volume : 45m3
Age : 30 yearsDescription : Square shaped; Natural; No inlet or outlet; Sewage disposal takes
place. Perennial; Not used for health-related purposes; It issituated near to an old tile factory.
Flora : Grasses, Algae, etc.Fauna : Worms, Insect larvae.
Pond No. 7
Location : Approximately 300m from Pond No: 6 (Ward No.13)

16
Ownership : PublicDimensions : Area: 12m2, Volume = 60m3
Age : 30 yearsDescription : Rectangular shape; Natural; No inlet or outlet; Sewage, Vegetable
disposal area; Not used for health-related purposes. This is alsonear to the tile factory.
Flora : Algal blooms, GrassesFauna : Frogs, Snakes
Pond No. 8, 9
Location : Approximately 350m from Collectorate area, (Ward No. 10)Ownership : Private.Dimensions : Area: 6m2, Volume : 30m3
Age : 15 yearsDescription : Rectangular shape; No inlet or outlet; Isolated; Situated in a
rubber estate; Perennial; Clear water.Flora : Algal bloomsFauna : Aquatic insects, Frogs
Pond No. 10
Location : Approximately 150m from pond 9 (Civil Station) (Ward No. 10)Ownership : PublicDimensions : Area: 70m2, Volume : 420m3
Age : 20 yearsDescription : Rectangular in shape; 3 inlets are present; These inlets let in
polluted water from the city; The pond acts as a dumping stationfor vegetables, sewage, etc.
Flora : GrassesFauna : Aquatic insects, Worms
Pond No. 11
Location : Near Railwayline, Muttambalam (Ward No. 5)Ownership : John Chacko, MattathilDimensions : Area: 18m2, Volume : 126m3
Age : That of railway lineDescription : Rectangular shape; Pond formed due to quarry work for railway
line: Local name – Parakkulam; No inlet; Not used for health-related purposes.
Flora : Algal blooms, Pandanus, grassFauna : Fishes, Turtles, Frogs
Pond No. 12Location : 200m from Pond No. 11 (Ward No. 5)
17
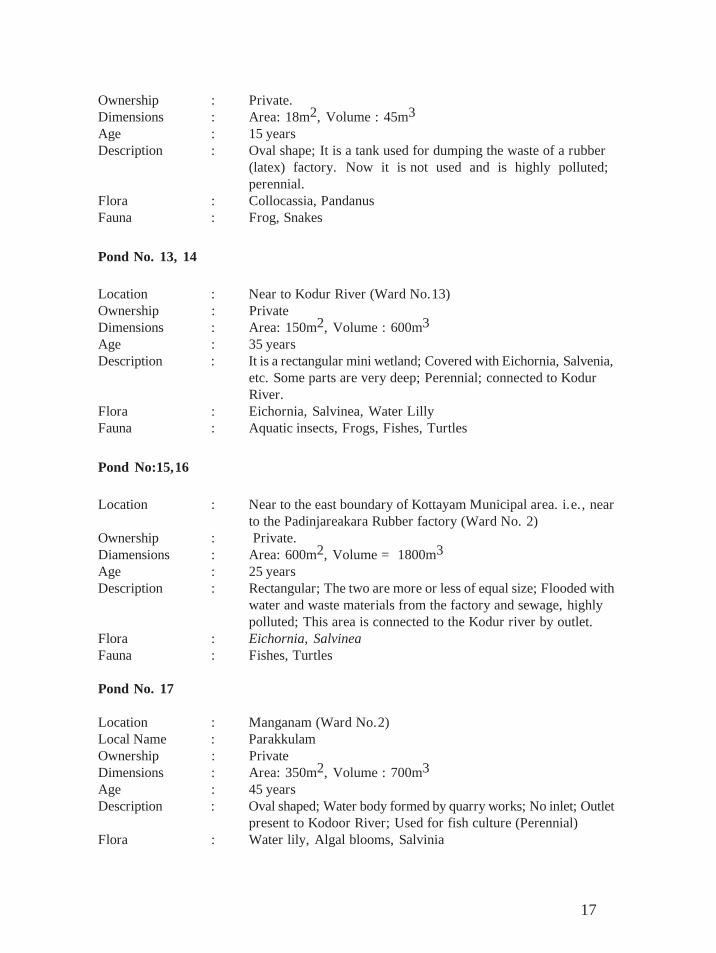
Ownership : Private.Dimensions : Area: 18m2, Volume : 45m3
Age : 15 yearsDescription : Oval shape; It is a tank used for dumping the waste of a rubber
(latex) factory. Now it is not used and is highly polluted;perennial.
Flora : Collocassia, PandanusFauna : Frog, Snakes
Pond No. 13, 14
Location : Near to Kodur River (Ward No.13)Ownership : PrivateDimensions : Area: 150m2, Volume : 600m3
Age : 35 yearsDescription : It is a rectangular mini wetland; Covered with Eichornia, Salvenia,
etc. Some parts are very deep; Perennial; connected to KodurRiver.
Flora : Eichornia, Salvinea, Water LillyFauna : Aquatic insects, Frogs, Fishes, Turtles
Pond No:15,16
Location : Near to the east boundary of Kottayam Municipal area. i.e., nearto the Padinjareakara Rubber factory (Ward No. 2)
Ownership : Private.Diamensions : Area: 600m2, Volume = 1800m3
Age : 25 yearsDescription : Rectangular; The two are more or less of equal size; Flooded with
water and waste materials from the factory and sewage, highlypolluted; This area is connected to the Kodur river by outlet.
Flora : Eichornia, SalvineaFauna : Fishes, Turtles
Pond No. 17
Location : Manganam (Ward No.2)Local Name : ParakkulamOwnership : PrivateDimensions : Area: 350m2, Volume : 700m3
Age : 45 yearsDescription : Oval shaped; Water body formed by quarry works; No inlet; Outlet
present to Kodoor River; Used for fish culture (Perennial)Flora : Water lily, Algal blooms, Salvinia

18
Fauna : Frog, Fishes
Pond No. 18
Location : Manganam (Near to the road) (Ward No.2)Ownership : PublicDimensions : Area: 84m2, Volume = 336m3
Age : 25 yearsDescription : Small wetland; Perennial; Used for sewage disposal; Highly
polluted; Inlet and outlet present.Flora : Grasses, Water lily, SalviniaFauna : Aquatic Insects, Frog, Snakes, Small Fishes
Pond No. 19
Location : Manganam (Ward No.2)Ownership : PublicDimensions : Area: 200m2, Volume : 600m3
Age : 25 yearsDescription : Small wetland; Perennial; Not used; Sewage flows in; Inlet and
outlet are present. The inlets are from the road side.Flora : Grasses, Algal bloomsFauna : Aquatic Insects
Pond No. 20
Location : Kanjikuzhy (Ward No.4)Ownership : PrivateDimensions : Area: 40m2, Volume : 240m3
Age : 30 yearsDescription : Rectangular shape; No inlet or outlet; Perennial water body;
Polluted water; Now used for sewage dumping.Flora : Colocassia, Pandanu, GrassFauna : Frog, Fishes, Snakes, Water Birds
Pond No. 21, 22, 23
Location : Kanjikuzhy (Ward No.4)Ownership : M. V. Joseph, ValachirayilDimensions : Area: 1.5m2, Volume : 4.5m3
Age : 35 yearsDescription : More or less oval in shape; Ponds 22 and 23 are 15m metres
awayfrom pond 21. These three ponds have no inlets, but outletsare present; The water in the ponds is used for household pur-poses.
Flora : Water Lilly

19
Fauna : Small Fishes
Pond No. 21 (Selected for sample analysis)
Used for home purposes; Filter mechanism present; Clear water; Flowing water all yearround; People conserve this pond. (Water lily and little algal blooms are seen). SinceKanjikuzhy is lowland, the pond has plenty of water at all seasons.
Fauna : Small Fishes
Pond No. 24
Location : Mullankuzhy : Next to Gandhi Nagar Colony (Ward No. 21)Ownership : PublicDimensions : Area: 120m2, Volume : 600m3
Description : More or less rectangular in shape; No inlet and outlet; Sewagedisposal from Gandhi Nagar Colony flows into the pond; Theinlets are from the road side.
Flora : Colocassia, Grasses
Pond No. 25
Location : Thirunakkara Temple (Ward No.17)Ownership : Devaswam BoardDiamensions : Area: 200m2, Volume : 600m3
Description : Used for bathing; no inlet or outlet.Flora : Hydrilla, Algal bloomsFauna : Frog, Fishes, Snakes
Pond No. 26
Location : Thirunakkara (Vayaskara Region) near Rest house (Ward No.14)Ownership : Vayaskara VaidyasalaDimensions : Area: 16m2, Volume : 80m3
Description : Square shaped pond; Clear water; This is a special pond withayurvedic herbs (Brahmi - Ramacham); Pleasant smell; Many yearsago, the water from the pond was used for preparation of ayurvedicmedicines; No inlet or outlet; Now in disuse.
Flora : Algal bloomsFauna : Aquatic Insects
Pond No. 27, 28, 29, 30, 31, 32, 33, 34 (Pond No. 27 taken for sample analysis)
Location : Nagampadam (Ward No. 16)Ownership : PublicDimensions : Area: 24m2, Volume : 96m3

20
Description : These minor water bodies are situated near to Nagampadam Busstand, M.C.road, and Baker Jn; Most of them are perennial; Nowthese ponds are used as sewage dumping stations; The minor bod-ies are inter-connected; Highly polluted area; Polluted material,water, etc., from automobiles, shops, and city canals flow in;The inter connections have been broken by human activity in someareas.
Flora : Algal bloomsFauna : Aquatic Insects, Frogs
Pond No. 35 (Taken for sample analysis)
Location : Near to CMS College (Ward No.19)Ownership : PrivateDimensions : Area: 100m2 x 100m2 = 10000 m3
Age : 40 yearsDescription : Very old, wetland area; Covers about 1.5 acre; Perennial; Inlet
and outlet present; This wetland is connected with Meenachil River.In the monsoon season, this area gets highly flooded; This wetlandacts as breeding ground for fishes, frogs, etc.
Flora : Eichornia, Salvinia, Water lilly, UtriculariaFauna : Fishes, frogs, snakes, herons, kingfishers, rats
Pond No:36,37
Location : Near to Chungam (Nagampadam ward) (Ward No. 16)Ownership : PublicDimensions : Area: 70m2, Volume : 420m3
Age : 20 yearsDescription : Rectangular, moderate-sized wetland; Situated near the Chungam-
Kottayam Road; Formed due to human intervention; Acts as sewage dumping place for various houses; Water from road canalsalso flows into it; No outlet. Highly polluted area; During themonsoon season this area is flooded; This pond then overflows.
Flora : Grasses, Algal bloomsFauna : Frogs, insect larvae, worms, etc.
Pond No. 38, 39, 40, 41
Location : Old Seminary (Ward No. 19)Diamensions : Area: 150m2, Volume : 600m3
Age : 10 yearsDescription : These water bodies are channels, situated in the Rubber Estate of
the Pazhaya Seminary Monastery;These channels are more or lessof the same length; Promote growth of rubber trees; No inlet oroutlet; So there is no water circulation; The dry leaves of rubber

21
falling into these channels undergo decomposition; Mosquitopopulation is high; Water quality is the same as that of the MeenachilRiver.
Pond No. 42
Location : Thazhathangadi (Ward No.27)Dimensions : Area: 48m2 Volume : 600m3
Age : 30 yearsDescription : Rectangular water body; Situated near Juma Masjid,
Thazhathangady; Perennial; Near road side; No inlet or outlet; Inmonsoon season these areas are flooded; Covered with Salvena;Lots of fishes live in them; Not used for health-related purposes.It is used for sewage disposal; Not protected.
Flora : Salvinia, EichorniaFauna : Fishes, frogs, Insect larvae
Pond No. 43
Location : Thazhathangadi (Near Government Muslim LP School) (Ward27)Dimensions : Area: 15m2, Volume : 60m3
Age : 20 yearsDescription : Rectangular; Inlet and outlet exist; Used for bathing; Outlet is
narrow; Opens into a canal that flows into Meenachil River.Flora : Algal bloom, Eichornia, Salvinia, Oistia, HydrillaFauna : Fishes, Snails, Frogs, Snakes, Turtles
Pond No. 44
Location : Thiruvathukal (Ward No.29)Ownership : PrivateAge : 25 yearsDescription : Rectangular; Well-protected; Used for bathing; clear water, no
inlet; outlet present.Flora : Lotus, Waterlily, Pistia, Submerged plantsFauna : Fishes, Frogs, Snakes, Turtles
Pond No. 45
Location : Veloor (Ward No.30)Ownership : PublicDimensions : Area: 12m2, Volume : 48m3
Age : 18 yearsDescription : Small rectangular water body; Formed by human intervention;
Perennial; Inlet from road canals; No outlet. In monsoon season,gets flooded.

22
Flora : Lotus, Waterlily, Pistia, Submerged PlantsFauna : Fishes, Frogs, Snakes, Turtles
Pond No. 46
Location : Veloor; Approx 1 km than Pond No:45 (Ward No. 30)Ownership : PrivateDimensions : Area: 84m2, Volume : 42m3
Age : 25 yearsDescription : Size moderate; Situated near road side; Inlet and outlet present;
(Connected with water canals); Used for bathing animals (cow,buffalo, etc).
Flora : Waterlily, Pistia, Submerged PlantsFauna : Fishes, Frogs, Turtles
Pond No:47
Location : Near to Illickal Bridge (500m) Veloor (Ward No:30)Ownership : PrivateDimensions : Area : 144m2, Volume : 100m3
Age : 30 yearsDescription : Moderate-sized; Approximately square-shaped; Well-protected;
Clear water; Used for bathing purpose; Inlet absent; Outlet present.Flora : Lotus, Waterlily, Pistia, and Submerged PlantsFauna : Fishes, Frogs, Turtles, Aquatic Insects
Pond No. 48
Location : Veloor (Ward No:30)Ownership : PublicDimensions : Area: 12m2
Age : 20 yearsDescription : Situated near the road side (Illickal-Kanjiram Road); Inlet and
outlet present; Not in use; Sewage disposal also seen.Flora : Colocassia, algalblooms, pandana, grassesFauna : Snakes, frogs

23
Table 2.1 Details of water bodies
Pond No: Inlet Outlet Ownership Age (Years) 1 Absent Present Private 27
2 Absent Absent Private 20
3 Absent Absent Private 20
4 Present Present Public 25
5 Present Present Private 16
6 Absent Absent Public 30
7 Absent Absent Public 30
8 -9 Absent Absent Private 15
10 Present Absent Public 20
11 Absent Absent Private 30
12 Present Absent Private 18
13 - 14 Absent Present Private 35
15 -16 Present Present Private 25
17 Absent Present Private 45
18 Present Present Public 25
19 Present Present Public 25
20 Absent Absent Private 30
21 - 23 Absent Present Private 35
24 Absent Absent Public Not known
25 Absent Absent Private 26
26 Absent Absent Private Not known
27 - 34 Present Absent Public Not known
35 Present Present Private 40
36 - 37 Present Absent Public 20
38-41 Absent Absent Private 10
42 Absent Absent Public 30
43 Present Present Public 20
44 Absent Present Public 25
45 Present Absent Public 18
46 Present Present Private 25
47 Absent Present Private 30
48 Present Present Public 20

24
CHEMICAL PHYSICAL
BIO
LO
G-
ICA
L
KA
NJI
KK
UZ
HY
Mon
th
Para
met
ers
SEP
OC
TN
OV
DE
CJA
NF
EB
MA
RA
PRM
AY
JUN
JUL
AU
G
T0 C
28.9
2928
.728
.228
.529
.329
.8-
-26
.927
27.1
pH6.
56.
16.
36.
266.
56.
716.
76-
-6.
586.
056.
63N
TU
1.8
1.9
1.7
1.8
1.6
2.61
2.82
--
1.72
1.75
1.78
O2
Mg/
L7.
57.
26.
817.
217.
67.
27.
13-
-8.
18.
017.
92C
O2
Mg/
L9.
259.
79.
9110
.86
10.2
110
.76
10.5
2-
-8.
188.
659.
12P M
g/L
8.02
7.25
6.85
8.54
7.37
6.52
8.67
--
7.98
8.06
8.13
HA
RD
Mg/
L50
.12
47.5
146
.11
48.2
144
.245
43-
-47
.245
42.8
CA
LM
g/L
16.3
514
.48
16.7
117
.21
16.1
315
.84
16.4
6-
-14
.74
13.7
812
.82
Mg+
+M
g/L
33.7
733
.03
29.9
831
28.0
729
.826
.54
--
32.4
632
.02
29.5
8C
HL
DM
g/L
7.54
5.94
6.36
5.81
6.42
5.60
5.81
--
6.52
6.40
6.28
SLA
TY
Mg/
L8.
188.
148.
727.
147.
778.
127.
98-
-7.
387.
557.
72A
LK
NT
Y
Mg/
L5.
926.
146.
315.
86.
26.
55
--
5.16
5.46
5.76
BO
DM
g/L
66.1
167
.87
64.6
59.6
168
.12
58.0
862
.34
--
68.2
467
.18
66.1
Tabl
e 2.
2 D
ata
show
ing
the
vari
ous
leve
ls o
f bio
-phy
sico
che
mic
al p
aram
eter
s of
pon
d no
. 21
(199
7 Se
pt. –
199
8 A
ug.)

25
CHEMICAL PHYSICAL
BIO
LO
G-
ICA
L
N
AG
AM
PA
DA
MM
onth
Para
met
ers
SEP
OC
TN
OV
DE
CJA
NF
EB
MA
RA
PRM
AY
JUN
JUL
AU
GT
0 C27
.828
.128
.629
.730
.631
.233
.00
--
26.3
26.6
27.2
pH6.
56.
716.
516.
726.
416.
556.
82-
-6.
26.
356.
5N
TU
50.1
53.7
52.8
155
.754
.657
.12
56.6
--
52.8
52.0
351
.26
O2
Mg/
L1.
2103
950.
300.
320.
260.
210.
27-
-3.
183.
393.
6C
O2
Mg/
L11
.23
13.2
12.8
213
.14
13.6
814
.114
.7-
-10
.810
.710
.6P M
g/L
372
364
348
322
367
356
351
--
358
360
363
HA
RD
Mg/
L14
716
116
815
216
415
816
7-
-14
314
414
5C
AL
Mg/
L68
73.3
76.2
68.6
70.1
266
.772
.3-
-62
63.6
565
.3M
g++
Mg/
L79
87.7
91.8
93.4
93.8
891
.13
94.7
--
6.82
7.01
7.21
CH
LD
Mg/
L7.
789.
789
9.37
9.81
10.2
18.
689.
21-
-14
.39
14.7
515
.12
SLA
TY
Mg/
L16
.83
17.6
917
.12
16.6
117
.32
18.2
117
.62
--
14.3
914
.75
15.1
2A
LK
NT
YM
g/L
1.27
1.25
1.27
1.21
1.28
1.2
1.3
--
1.21
1.56
1.91
BO
DM
g/L
41.6
740
.142
.11
41.8
240
.61
42.7
40.1
3-
-40
.82
41.0
841
.34
Tabl
e 2.
3 D
ata
show
ing
the
vari
ous
leve
ls o
f bio
-phy
sico
che
mic
al p
aram
eter
s of
pon
d no
. 27
(199
7 Se
pt. –
199
8 A
ug.)

26
CHEMICAL PHYSICAL
BIO
LO
G-
ICA
L
CH
UN
GA
MM
onth
Para
met
ers
SEP
OC
TN
OV
DE
CJA
NF
EB
MA
RA
PRM
AY
JUN
JUL
AU
GT
0 C29
.528
28.2
2828
.829
.130
.5-
-27
.627
.928
.2pH
6.8
6.5
6.2
6.61
6.83
6.73
6.95
--
6.8
6.75
6.71
NT
U2.
132.
92.
632.
582.
773.
683.
75-
-3.
683.
413.
14O
2
Mg/
L5.
875.
135.
244.
784.
14.
825.
61-
-6.
176.
035.
89C
O2
Mg/
L9.
8210
.12
10.6
10.4
711
.211
.47
10.8
1-
-9.
679.
829.
97P M
g/L
19.7
215
.60
16.8
215
.11
14.8
713
.48
15.8
7-
-17
.12
16.4
015
.68
HA
RD
Mg/
L47
5155
4852
6154
--
4244
46C
AL
Mg/
L12
.25
16.6
617
.11
16.6
816
.81
17.6
817
.23
--
11.6
211
.77
11.9
2M
g++
Mg/
L34
.75
34.4
37.3
931
.32
35.1
943
.84
36.7
7-
-30
.38
32.2
334
.08
CH
LD
Mg/
L5.
725.
536.
126.
866.
716.
415.
48-
-4.
244.
464.
68SL
AT
YM
g/L
9.18
210
.01
10.8
99.
5410
.28
10.7
610
.92
--
7.16
8.03
8.90
AL
KN
TY
Mg/
L1.
291.
381.
421.
21.
321.
51.
2-
-1.
261.
251.
25B
OD
Mg/
L63
.12
66.1
163
.85
60.1
862
.13
58.0
255
.32
--
49.1
251
.49
53.8
6
Tab
le.2
.4
Dat
a sh
owin
g th
e va
riou
s le
vels
of
bio-
phys
ico
chem
ical
par
amet
ers
of p
ond
no.3
5 (1
997
Sept
. -
!998
Aug
.)
27
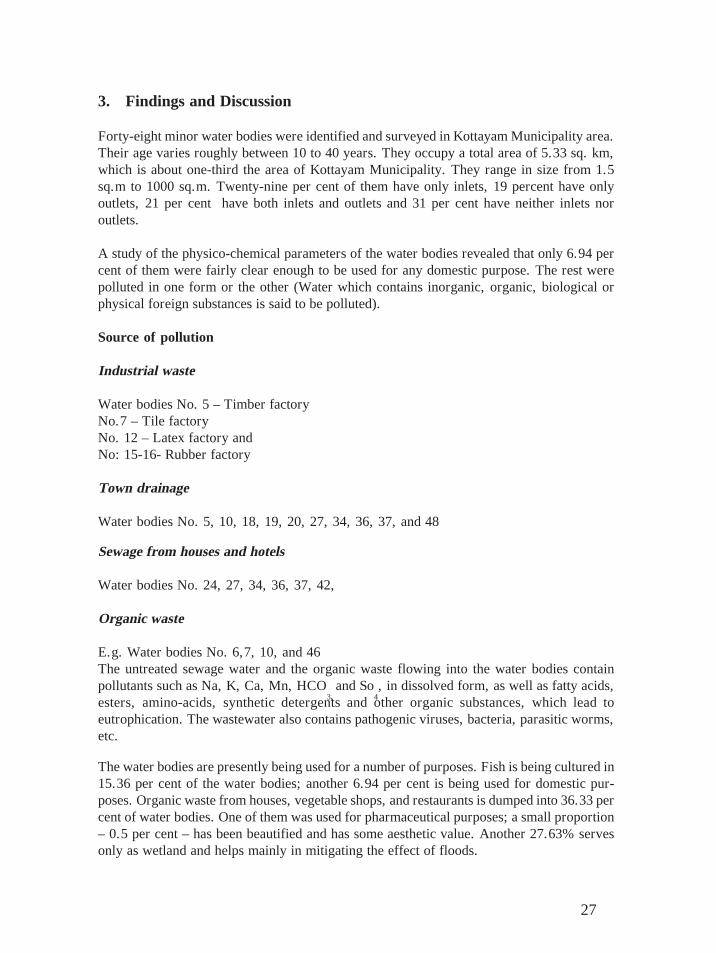
3. Findings and Discussion
Forty-eight minor water bodies were identified and surveyed in Kottayam Municipality area.Their age varies roughly between 10 to 40 years. They occupy a total area of 5.33 sq. km,which is about one-third the area of Kottayam Municipality. They range in size from 1.5sq.m to 1000 sq.m. Twenty-nine per cent of them have only inlets, 19 percent have onlyoutlets, 21 per cent have both inlets and outlets and 31 per cent have neither inlets noroutlets.
A study of the physico-chemical parameters of the water bodies revealed that only 6.94 percent of them were fairly clear enough to be used for any domestic purpose. The rest werepolluted in one form or the other (Water which contains inorganic, organic, biological orphysical foreign substances is said to be polluted).
Source of pollution
Industrial waste
Water bodies No. 5 – Timber factoryNo.7 – Tile factoryNo. 12 – Latex factory andNo: 15-16- Rubber factory
Town drainage
Water bodies No. 5, 10, 18, 19, 20, 27, 34, 36, 37, and 48
Sewage from houses and hotels
Water bodies No. 24, 27, 34, 36, 37, 42,
Organic waste
E.g. Water bodies No. 6,7, 10, and 46The untreated sewage water and the organic waste flowing into the water bodies containpollutants such as Na, K, Ca, Mn, HCO
3, and So
4, in dissolved form, as well as fatty acids,
esters, amino-acids, synthetic detergents and other organic substances, which lead toeutrophication. The wastewater also contains pathogenic viruses, bacteria, parasitic worms,etc.
The water bodies are presently being used for a number of purposes. Fish is being cultured in15.36 per cent of the water bodies; another 6.94 per cent is being used for domestic pur-poses. Organic waste from houses, vegetable shops, and restaurants is dumped into 36.33 percent of water bodies. One of them was used for pharmaceutical purposes; a small proportion– 0.5 per cent – has been beautified and has some aesthetic value. Another 27.63% servesonly as wetland and helps mainly in mitigating the effect of floods.

28
Table 3.1 Uses of minor water bodies
Bio-physico-chemical parameters
Three of the 48 water bodies surveyed were chosen for detailed analysis of the water. Theyare Pond No. 21 (Kanjikkuzhy), Pond No. 35 (Chungam), and Pond No. 27 (Nagampadom).The first Pond (No.21, Kanjikkuzhy) is representative of a fairly clear water body. A naturalfilter mechanism is present and the water is used for domestic purposes.
The second (Pond No. 35 Chungam) is slightly polluted and is used for fish culture. PondNo. 27 (Nagampadom) is highly polluted and is used as a sewage-dumping centre; drainagecanals flow into it.
Physical parameters
Water temperature
The temperature in the three water bodies ranges between 26oC to 30oC. The temperature isslightly higher in Pond No. 32, where pollution is higher.
Temperature shows an inverse correlation with dissolved oxygen and direct correlation withpollution. Water has a higher oxygen holding capacity at lower temperatures (Jindal andVasist, 1985; Singh et.al, 1986; Jindal and Kumar, 1990). Water temperature depends onvolume. The lentic system under study has low volume of water and exhibits fluctuations intemperature. When temperature is high, solubility of water is low (Welsch, 1952). Tempera-ture also acts indirectly by causing changes in density and viscosity of water (Welsch, 1952).
Aquatic organisms possess a narrow range of temperature tolerance, since there is no greatdifference between maximum and minimum temperature in aquatic systems (Jaffries andMills, 1990). In the study areas, the minimum temperature was 26.3 oC and the maximum33 oC. Generally, the range of tolerance within which the organisms carry on their life activi-ties lies between 10-48 oC. All metabolic processes are influenced by fluctuations in tempera-ture. Increase in temperature increases the enzymatic activity, which results in an increasedrate of metabolism. In plants, the rates of photosynthesis, transpiration and respiration areaffected by temperature. Temperature fluctuations also affect growth. Temperature imposes
Uses No. of pond Area (m2) Percentage Degree Fish culture 4 820 15.36 55.310
Home Purpose 6 370.5 6.94 24.990
Sewage Disposal 18 1939 36.33 130.804
Aesthetic Purpose 2 3 0.06 0.202
Wetland 6 1475 27.63 99.500
Not used 12 729 13.66 49.170
Total 48 5336.5 100 360

29
a restriction in the distribution of species. The rate of oxygen consumption and carbon diox-ide output doubles with a temperature increase of 10 oC. In warmer waters aquatic organismshave a greater daily food requirement; conversely they have a smaller daily requirement incold water (Welsch, 1952).
Figure 3.1 Monthly water temperature during September 1997 - August 1998
pH
Measurement of pH is one of the most important and frequently used tests in water-chemis-try. The pH values in the three water bodies do not show much variation. They range be-tween 6.10 and 6.95. This is related to the very slight fluctuation in temperature. A decreasein pH would occur if temperature increases, since there would be a greater decrease of carbondioxide level due to the high rate of decomposition of organic matter, as have been con-firmed by the works of Jindal and Kumar (1989).
Figure 3.2 Monthly pH values in three water bodies: September 1997 - August 1998
0
5
10
15
20
25
30
35
Sep.
Oct.Nov
.Dec
.Ja
n.Feb
.Mar. Apri
lMay
June Ju
ly
Augus
t
Month
Tem
pera
ture Kanjikkuzhy
NagampadamChungam
5 .6
5 .8
6
6 .2
6 .4
6 .6
6 .8
7
7 .2
Sep.
Oct.Nov
.Dec
.Ja
n.Feb
.Mar. Apri
lMay
June Ju
ly
Augus
t
M o n th
PH
K a n jik k uzhyN a g a m p a d a mC hu ng a m
30
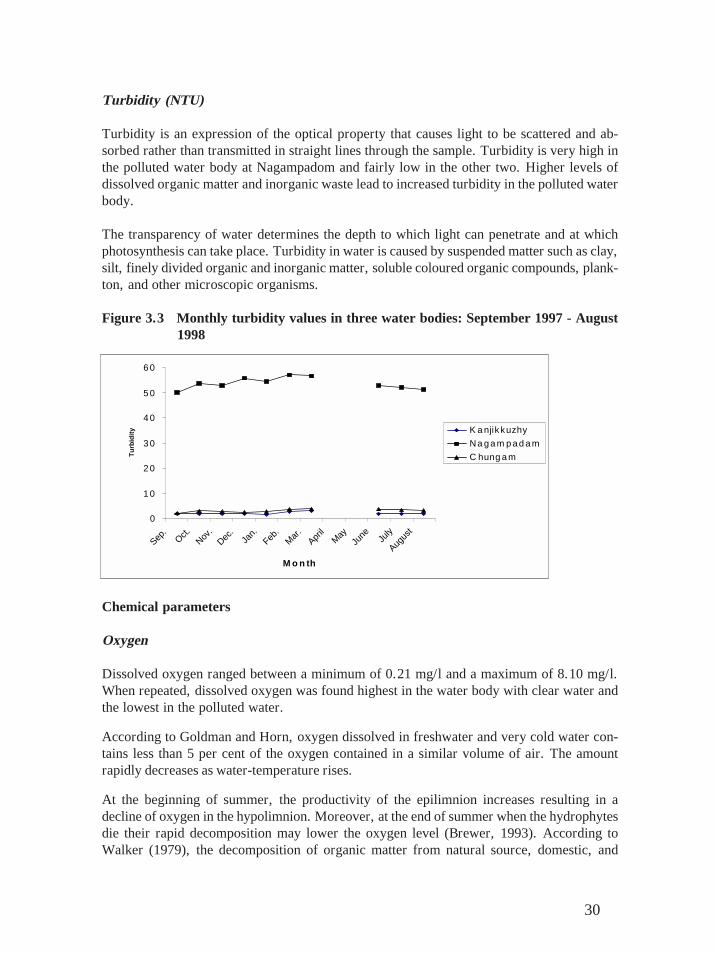
Turbidity (NTU)
Turbidity is an expression of the optical property that causes light to be scattered and ab-sorbed rather than transmitted in straight lines through the sample. Turbidity is very high inthe polluted water body at Nagampadom and fairly low in the other two. Higher levels ofdissolved organic matter and inorganic waste lead to increased turbidity in the polluted waterbody.
The transparency of water determines the depth to which light can penetrate and at whichphotosynthesis can take place. Turbidity in water is caused by suspended matter such as clay,silt, finely divided organic and inorganic matter, soluble coloured organic compounds, plank-ton, and other microscopic organisms.
Figure 3.3 Monthly turbidity values in three water bodies: September 1997 - August1998
Chemical parameters
Oxygen
Dissolved oxygen ranged between a minimum of 0.21 mg/l and a maximum of 8.10 mg/l.When repeated, dissolved oxygen was found highest in the water body with clear water andthe lowest in the polluted water.
According to Goldman and Horn, oxygen dissolved in freshwater and very cold water con-tains less than 5 per cent of the oxygen contained in a similar volume of air. The amountrapidly decreases as water-temperature rises.
At the beginning of summer, the productivity of the epilimnion increases resulting in adecline of oxygen in the hypolimnion. Moreover, at the end of summer when the hydrophytesdie their rapid decomposition may lower the oxygen level (Brewer, 1993). According toWalker (1979), the decomposition of organic matter from natural source, domestic, and
0
1 0
2 0
3 0
4 0
5 0
6 0
Sep.
Oct.Nov
.Dec
.Ja
n.Feb
.Mar. Apri
lMay
June Ju
ly
Augus
t
M o n th
Turb
idity K a njikkuzhy
Na g a m p a d a mC hung a m

31
industrial sewage may result in serious depletion of oxygen. When this continues for a longperiod, most aquatic organisms perish or are replaced by a few specialised organisms tolerantto low oxygen. According to Goldman, water contains little oxygen due to relatively lowpartial pressure of oxygen in the atmosphere and its low solubility.
Figure 3.4 Monthly oxygen levels in three water bodies: September 1997 - August1998
Carbon-dioxide
The carbon-dioxide value ranges between 8.18 mg/l and 14.7 mg/l. There is very littlefluctuation in Co
2 level in the three water bodies. It is the highest in the polluted water body.
Though only a minor component of air, carbon dioxide is fairly abundant in water because itssolubility is about 200 times that of oxygen (Talling, 1976). According to Jaffries, carbondioxide is more soluble in cooler waters.
Figure 3.5 Monthly carbon dioxide levels in three water bodies: September 1997 - August 1998
0
1
2
3
4
5
6
7
8
9
Sep.
Oct.Nov
.Dec
.Ja
n.Feb
.Mar. Apri
lMay
June Ju
ly
Augus
t
M o n th
Oxy
gen K a njik k uzhy
N a g a m p a d a mC hung a m
05
101520
Sep.
Oct. Nov.
Dec.
Jan.
Feb.
Mar. April
May June Ju
ly
Augus
t
Month
Car
bond
i oxi
de
KanjikkuzhyNagampadamChungam

32
While the Co2 tension within the natural waters and within the atmosphere constantly tends
towards equilibrium, circumstances prevailing in water like slow diffusion, rapid productionof carbon dioxide, insufficient agitation of water, etc., upset this balance. The carbon diox-ide content in water is depleted by photosynthesis and lime-depositing bacteria. The rates ofsome developmental and metabolic processes are increased at higher concentrations of carbondioxide and are decreased at lower values. Another influence of carbon dioxide as an envi-ronmental factor is in relation to orientation. The movement of certain aquatic animals isaffected by differences in concentrations of gas.
Inorganic Phosphorus
The level of inorganic phosphorus is very high in the highly polluted water-body (Nagampadam)and low in the other two (Chungam and Kanjikkuzhi).
Figure 3.6 Monthly inorganic phosphate levels in three water bodies: September1997 - August 1998
Hardness of water
Hardness is now defined as the sum of the Calcium and Magnesium concentration, bothexpressed as calcium carbonate in milligrams per litre. The values are low in the water bodiesat Chungam and Kanjikuzhi but fairly high in the water body at Nagampadam, which con-tains polluted water.
Calcium
Calcium is the fifth among elements in order of its abundance and presence in water. Inurban areas, the supply is mainly from sewage water and organic waste. It is high in thepolluted water at Nagampadam and low in the other two.
0
50
100
150
200
250
300
350
400
Sep.
Oct.Nov
.Dec
.Ja
n.Feb
.Mar. Apri
lMay
June Ju
ly
Augus
t
Month
Inor
gani
c Ph
opha
te
KanjikkuzhyNagampadamChungam

33
Figure 3.7 Monthly levels of hardness of water in three water bodies: September 1997 - August 1998
Figure 3.8 Monthly levels of calcium in three water bodies: September 1997 - August1998
Magnesium
Magnesium ranks eight among the elements in order of abundance and is a common constitu-ent of natural water. As expected, the value is high in the polluted water at Nagampadam andlow in the other two. Magnesium concentrations may vary from zero to several hundredmilligrams per litre depending on the source of the water.
Chloride
Chloride, in the form of chloride (Cl-) ion is one of the major inorganic anions in natural and
0
10
20
30
40
50
60
70
80
90
Sep.
Oct.Nov
.Dec
.Ja
n.Feb
.Mar. Apri
lMay
June Ju
ly
Augus
t
Month
Cal
cium Kanjikkuzhy
NagampadamC hungam
0
2 0
4 0
6 0
8 0
1 0 0
1 2 0
1 4 0
1 6 0
1 8 0
Sep.
Oct.Nov
.Dec
.Ja
n.Feb
.Mar. Apri
lMay
June Ju
ly
Augus
t
M o n th
Har
dnes
s of
Wat
er (T
otal
)
K a njikkuzhyN a g a m p a d a mC hung a m

34
wastewater. It ranges in the study area between 4.24 and 10.21 mg/l. Chloride concentrationis thus higher in wastewater than in raw water.
Figure 3.9 Monthly levels of magnesium in three water bodies: September 1997 -August 1998
Figure 3.10 Monthly levels of chloride in three water bodies: September 1997 - August1998
Salinity
The salinity in the water-bodies ranges between 7.14 mg/l and 18.21 mg/l. The fluctuationin salinity is low in all the three water bodies. The level is higher in the polluted water-bodythan in the other two. Salinity decreases with increase in concentration of dissolved gases(Welsch, 1952).
0
2
4
6
8
10
12
Sep.
Oct.Nov
.Dec
.Ja
n.Feb
.Mar. Apri
lMay
June Ju
ly
Augus
t
Month
Chl
orid
e KanjikkuzhyNagampadamC hungam
0
10
20
30
40
50
60
70
80
90
100
Sep.
Oct.Nov
.Dec
.Ja
n.Feb
.Mar. Apri
lMay
June Ju
ly
Augus
t
Month
Mag
nesi
um KanjikkuzhyNagampadamChungam

35
Figure 3.11 Monthly levels of salinity in three water bodies: September 1997 - August 1998
Total Alkalinity
Alkalinity of water is its acid-neutralising capacity. Alkalinity is significant in many uses andtreatments of natural waters and wastewater. Because alkalinity of surface-waters is prima-rily a function of carbonate, bicarbonate, and hydroxide content, it is taken as an indicator ofthe concentration of these constituents. In the study areas it varies between 1.2 and 6.5 mg/l. It is high at Kanjikuzhi and low in the other two.
Figure 3.12 Monthly levels of total alkalinity in three water bodies: September 1997 -August 1998
Biological Parameter
BOD
The most widely accepted measure of water pollution is the Biological Oxygen Demand
0
1
2
3
4
5
6
7
Sep.
Oct.Nov
.Dec
.Ja
n.Feb
.Mar. Apri
lMay
June Ju
ly
Augus
t
M o n th
Alk
alin
ity K a n jik k uzh yN a g a m p a d a mC hun g a m
02468
1 01 21 41 61 82 0
Sep.
Oct.Nov
.Dec
.Ja
n.Feb
.Mar. Apri
lMay
June Ju
ly
Augus
t
M o n th
Salin
ity K a n jik k u z h yN a g a m p a d a mC h u n g a m

36
(BOD) value. The BOD of the water bodies surveyed ranges between 40.13 and 68.24. It islow in the highly polluted water body (Nagampadam). It is higher in the other two. Betweenthem the difference is marginal.
BOD refers to the amount of O2 needed to breakdown or oxidise organic materials to Co
2,
water, and minerals by the micro-organisms in water. Owing to addition of sewage andwaste, dissolved oxygen (DO) levels are depleted in water, a fact that is reflected in terms ofincreasing BOD values of water. The number of microbes also increases tremendously, thusincreasing the consumption of oxygen.
Figure 3.13 Monthly BOD values in three water bodies: September 1997 - August 1998
Biota
Most minor water-bodies are ponds that have certain special characteristics (Jeffries andMills). Most of them are artificially made for different purposes, like effluent settling,quarry-work and digging for construction. Their large number but small size results in vari-ables colonisation and annual perturbations causing very variable communities. Many aretransitory, ephemeral habitats with an unusual, specific biota that does not occur elsewhere.The biota of a pond includes flora and fauna. The water-bodies studied in Kottayam munici-pality area contain in varying degrees most of the common biota occurring in ponds.
Flora
The plants usually found in these minor water-bodies may be classified on different bases.One basis is the position they occupy in the water-body. From this point of view they areclassified into the following categories:
Emergent Vegetation
This type includes rooted plants like Ipomoea, Jussiaea, Typha or cat-tails. Scirpus (bul-rushes) (arrowheads), Phragmites, Acorus, Vernonia, Nymphaea, Pistia, Colocasia, etc.
0
1 0
2 0
3 0
4 0
5 0
6 0
7 0
8 0
Sep.
Oct.Nov
.Dec
.Ja
n.Feb
.Mar. Apri
lMay
June Ju
ly
Augus
t
M o n th
BO
D
K a njik k uzhyN a g a m p a d a mC hung a m

37
Rooted aquatic vegetation recovers nutrients from the deep sediments and provides a ‘nutri-ent pump’. They form a link between the water and the land environment. They also providefood and shelter for aquatic and amphibious animals.
Floating vegetation
This includes Nymphaea, Pistia, Salvinia, Eichhornia,and Wolffia. Their broad leaves re-duce light penetration into the water but provide convenient places for animals to rest and layeggs.
Submergent Vegetation
This includes rooted or fixed plants, which remain completely submerged in water. Theirleaves are thin and finely divided, and are adapted for exchange of nutrients with water.Examples are Vallisneria, Hydrilla, Chara, Potamogeton, Utricularia and Ceratophyllum.
Phytoplankton
This includes several species of filamentous algae like Spirogyra and Oedogonium, Volvox,Oscillatoria, Anabaena, Eudorina, Closterium, Diatoms, and Navocula.
Fauna
These may also be classified on different bases. On the basis of the position they occupy inthe water-body, they can be classified into the following types.
Zooplankton
They float on the surface and usually have floating devices.Eg. Dinoflagellates, Brachionus,Bosmina, Copepods, Hetrozoans, Ostracods, Colonial Rotifers, and Water beetles.
Nekton
Organisms, which are actively moving and have definite locomotor organs, are included inthis category.Eg. Paramecium, Euglena, dipteran larvae, pupae, insects like Dytisscus,Ranatra, and Corixa.
Periphyton
These are organisms found among the rooted plants.Eg. Pulmonate pond-snails, nymphs ofDragon fly, May-fly, Caddis fly, rotifers, flatworms or planarians, freeliving roundworms,Hryozoans, Hydra, larvae of midgets and mosquitoes, crustaceans like Macrobrachium,Caridina species, and water-mites, and Annelids like leeches.
Benthos
Organisms, which live at the bottom, come under this type. They may crawl or remain

38
attached to the bottom. Eg. decomposing bacteria, planarians, bivalves, fishes like Anabas,Ophiocephalus, and Saccobranchus.
Edge-dwellers
These are usually amphibious forms. Eg. Birds like kingfisher, Herons, Egrets, ducks, waterhens, frogs, snakes like Natrix, mammals like Rats and Mongoose.

39
4. Summary and Conclusions
Kottayam town is described as the town of letters, lakes, and latex. The present study hasrevealed that about one-third of the municipality area is covered by minor water bodies.They range in size from 1.5 sq.m to 1000 sq.m. The water in these bodies collects fromdifferent sources like direct rainwater, flood over flow from the surrounding areas, sewagewater from neighbouring houses, and city drainage canals.
Out of the 48 ponds surveyed 23 have inlets. These water bodies receive water from themunicipality sewage canals, shops, markets, nearby houses, factories, etc. These water bod-ies are highly polluted. The rest of the water bodies have no inlets. Fifteen receive garbage,which is dumped directly into them. About 75 per cent of the water bodies get flooded duringthe monsoon. Hence these water bodies also get polluted by the pollutants carried in by thefloodwater. Timber, tiles, and latex factories also dump their wastes in these water bodies.The water bodies are used also as sinks for dumping wastes wherever possible. Public aware-ness about the importance of the water bodies and the effect of pollution on them is very low.These polluted water bodies act as ideal breeding grounds for mosquitoes and pathogenicmicro-organisms. The atmosphere around these water bodies also becomes polluted and emitsan obnoxious odour. These water bodies also disfigure the town’s landscape.
Six of the water bodies contain muddy water, which is not, however, highly polluted. Thir-teen of the water bodies contain fairly clean water.
Water is a natural resource used for a number of anthropogenic activities. The amount ofwater required by the inhabitants of Kottayam municipality increases day by day, due toincrease in population, industrialisation, urbanisation, etc. Kottayam municipality, like mostother towns in the world, is facing water scarcity. This problem can be reduced to a certainextent by making use of water in the minor water bodies. The water bodies containing muddywater could be used for bathing domesticated animals; and the ones containing clear watercould be used for washing, bathing, etc. With a little amount of care and maintenance morenumber of water bodies could be brought under use for human activities. Public and govern-ment involvement would be required for making them usable.
None of the water bodies are being used for the drinking purpose though all of them could bebrought under the economically important purpose. Only 15.36 per cent of the water bodiesare now being used for fish culture. Fish culture would also serve as an incentive for thepreservation and conservation of the water bodies. In addition to edible fishes, larvivorous,ornamental fishes may also be cultured in them. More water bodies could be brought underfish culture too. The larvivorous fishes would greatly help control of mosquitoes; ornamen-tal fishes could be sold as aquarium fishes. The fishes would also help conversion of theexcess organic waste accumulating in the water bodies and thus reduce eutrophication thatleads to over-growth of weeds like Salvinea and Eichornia. The frog population would alsoincrease, leading to further decrease of mosquitoes.
The water bodies occupy an area of 5.33 sq. km, which is about one-third the total area ofKottayam municipality. This means that a large quantity of water is being exposed to the

40
action of sunlight and micro-organisms, thus undergoing purification with no economicinput. However, the area of water bodies is undergoing rapid reduction.
Observation of the minor water bodies indicates the presence of a number of organisms. Acomplete in-depth study of the biota was not possible within the scope of the present project.However, it is obvious that the water bodies harbour a wide range of organisms. The iso-lated water bodies with fairly clear water would contain unknown species. Aquatic insects,plants, slugs, frogs, tadpoles fishes, larval forms, and micro-organisms like parameciumare being used by the zoology and the botany departments of the College in Kottayam forconducting practical and research activities. The water bodies themselves are used for eco-logical and environmental biology studies and analysis.
The survey has clearly revealed the fact that the water bodies help in mitigating floods.During the monsoon the excess water flows into these water bodies and from them intostreams and the river through various outlets. In areas in which water bodies have got siltedup, the surrounding areas experience higher levels of water during the rainy season. Thepublic and the municipality turn a blind eye to this problem; by the time they wake up, itmay be too late. Land is being reclaimed at a rapid rate. For example, a major part of thepond No: 35, behind CMS College has been filled up for building a sports complex, duringthe period of the present survey. In Kodimatha area, houses are now being constructed onlarge concrete pillars to avoid floodwater entering them.
Not much thought is being given to the fact that the water bodies help in the dispersion oferosive forces. A large quantity of top soil is annually washed away. Run off distances couldbe reduced by the water bodies and some of the soil reclaimed.
Water in Pond No: 26 owned by Vayaskara Vaidyasala (pharmacy) was used in earlierperiods for preparation of Ayurvedic medicines. Special efforts have to be made to regener-ate the pond and to make its water reusable for this traditional purpose.
Pond No: 21 has a special filter mechanism. The water is thus purified and used with nohuman effort. The public here takes interest in the maintenance of the pond. It should serveas an example for others to follow.
Ponds No: 11, 17, 36 – 41 and 48 are definitely the result of human endeavour. More waterbodies can be artificially created according to requirements and water availability, aftercareful planning and lay out of the Kottayam town.
At present only two of the ponds, both privately owned, have been beautified as part ofthe town maintenance and beautification scheme like beautification of the municipalparks.
Utilisation of project output
The information gathered on minor water-bodies in Kottayam municipality area may beused, for a number of purposes, in the planning of Kottayam Town.

41
The sewage canals and industrial waste of the town could be channelled into the water bodiesthat already have inlets and outlets of running water like Karapuzha thodu, Kodoor River andMeenachil River. Such inlets and outlets could also be artificially constructed for the otherwater bodies, wherever required. Water quality improvement would thereafter take placewithout any economic input and pollution of the running water sources like rivers would begreatly reduced.
Proper diversion of water in low-lying areas into deep-water bodies would help minimiseflooding. Such water bodies may also be artificially constructed also in other low-lyingareas.
In wards facing water shortage, it is possible, with a little planning and care, to maintainwater quality of a high standard in the minor water bodies, of a quality that permits water tobe used for domestic purposes. The water bodies would also help recharge groundwater. Theeffect of erosive forces could be reduced by bringing down the run-off distance.
At present, only 15.36 per cent of the water bodies are being used for fish-culture. All thewater bodies, except the very highly polluted ones, may be used for this purpose. If larvivorousfishes are also cultivated, mosquito control can also be achieved.
The biota of the pond in addition to performing their natural role of bio-geo-chemical recy-cling, being part of the food chain, gene pool, etc., could also be used by schools andcolleges as biology teaching material and for research purposes.
At present only .05 per cent of the water bodies have been aesthetically constructed. Aconcerted effort would turn all the water-bodies into things of beauty and turn Kottayamtown into an attractive place.
The greatest task in improving the water bodies would be to generate public awareness andinterest, including interest of the municipality. The media have an active role to play ingenerating and fostering this awareness.

42
References
Jeffries, M, Mills, D. 1990. Fresh water ecology, CBS Publishers and Distributors (P) Ltd.,New Delhi.
Jivendra. 1995. Water Pollution Management, A. P. H. Publishing Corporation, New Delhi.
Khana Devraj. 1993. Ecology and Pollution of Ganga River, Ashish Publishing House, NewDelhi.
Kottayam Municipality. 1996. Vikasana Rekha - 1995, Kottayam.
Kumara Swami, N, Kotaiah, B. 1982. Environmental Engineering Laboratory Manual, A.P. H. Publishing Co., New Delhi
Kottayam Development Authority. 1997. Map of Kottayam Municipality area, Kottayam.
Natarajan, S. 1942. On the occurrence of Cardina (Atyidae, Decapoda) in Travancore. CurrentScience 11: 245.
Sharma. 1995. ‘Sustainability of under ground water’ In A.K. Sinha (Ed.) Human Healthand Environment, Vol.2, A.P.H. Publishing Co., New Delhi.
Shastree, K. Nalin. 1997. Environmental Research Management, Anmol Publication Ltd.,New Delhi.
Sinha, A. K. 1997. Human Health and Environment, A. P.H Publishing Corporation, NewDelhi.
Vernat. P. S, Aggarwal V. K. 1978. Principles of Ecology.
Welsch, P. S. 1952. Limnology, McGraw Hill Book Company Inc., New York.

43

44