minnesota value of solar methodologymn.gov/commerce-stat/pdfs/vos-methodology.pdf · vos...
TRANSCRIPT

Minnesota Value of Solar:
Methodology
Minnesota Department of Commerce,
Division of Energy Resources
APRIL 1, 2014*
*reformatted on April 9, 2014

Minnesota Value of Solar: Methodology | Minnesota Department of Commerce
Page i
Prepared by:
Clean Power Research
http://www.cleanpower.com/
Principal Investigators
Benjamin L. Norris
Morgan C. Putnam
Thomas E. Hoff
Prepared for:
Minnesota Department of Commerce,
Division of Energy Resources
Mike Rothman, Commissioner
Bill Grant, Deputy Commissioner
Matt Schuerger, Technical Advisor
Lise Trudeau, Project Manager
651-539-1861
Legal Notice from Clean Power Research
This report was prepared for the Minnesota Department of Commerce by Clean Power Research. This
report should not be construed as an invitation or inducement to any party to engage or otherwise
participate in any transaction, to provide any financing, or to make any investment.
Any information shared with Minnesota Department of Commerce prior to the release of the report is
superseded by the Report. Clean Power Research owes no duty of care to any third party and none is
created by this report. Use of this report, or any information contained therein, by a third party shall be
at the risk of such party and constitutes a waiver and release of Clean Power Research, its directors,
officers, partners, employees and agents by such third party from and against all claims and liability,
including, but not limited to, claims for breach of contract, breach of warranty, strict liability, negligence,
negligent misrepresentation, and/or otherwise, and liability for special, incidental, indirect, or
consequential damages, in connection with such use.
Minnesota Value of Solar: Methodology | Minnesota Department of Commerce
Page ii
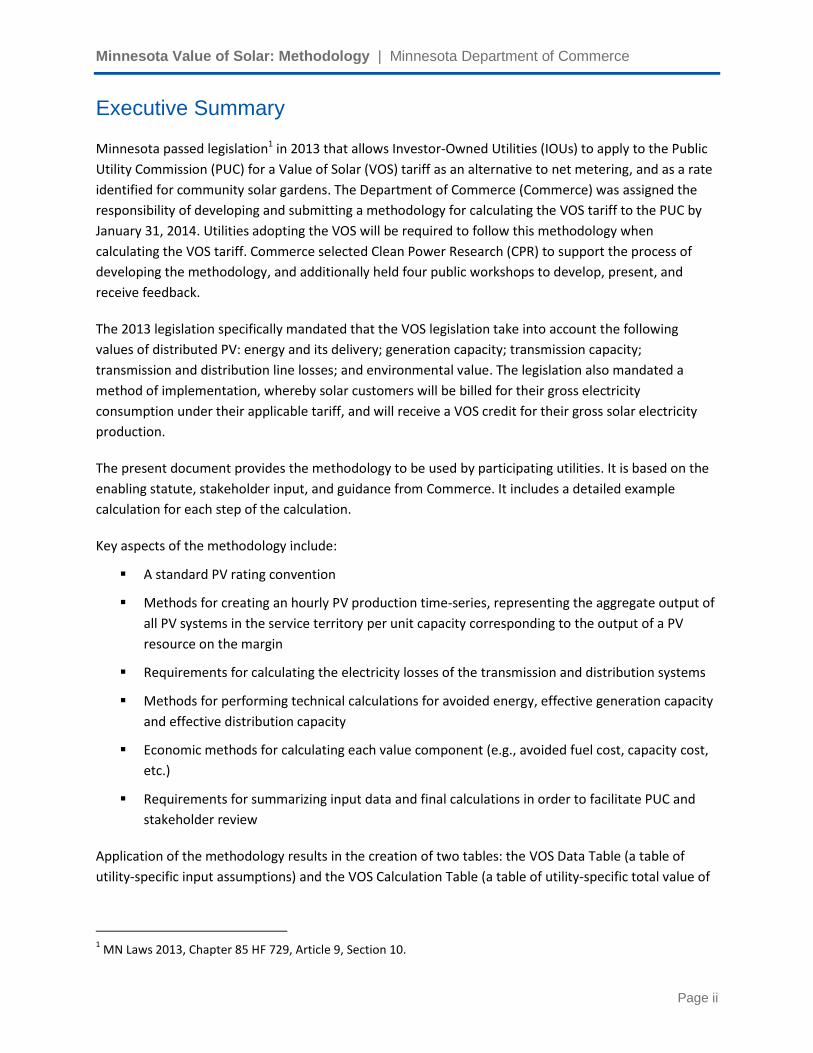
Executive Summary
Minnesota passed legislation1 in 2013 that allows Investor-Owned Utilities (IOUs) to apply to the Public
Utility Commission (PUC) for a Value of Solar (VOS) tariff as an alternative to net metering, and as a rate
identified for community solar gardens. The Department of Commerce (Commerce) was assigned the
responsibility of developing and submitting a methodology for calculating the VOS tariff to the PUC by
January 31, 2014. Utilities adopting the VOS will be required to follow this methodology when
calculating the VOS tariff. Commerce selected Clean Power Research (CPR) to support the process of
developing the methodology, and additionally held four public workshops to develop, present, and
receive feedback.
The 2013 legislation specifically mandated that the VOS legislation take into account the following
values of distributed PV: energy and its delivery; generation capacity; transmission capacity;
transmission and distribution line losses; and environmental value. The legislation also mandated a
method of implementation, whereby solar customers will be billed for their gross electricity
consumption under their applicable tariff, and will receive a VOS credit for their gross solar electricity
production.
The present document provides the methodology to be used by participating utilities. It is based on the
enabling statute, stakeholder input, and guidance from Commerce. It includes a detailed example
calculation for each step of the calculation.
Key aspects of the methodology include:
A standard PV rating convention
Methods for creating an hourly PV production time-series, representing the aggregate output of
all PV systems in the service territory per unit capacity corresponding to the output of a PV
resource on the margin
Requirements for calculating the electricity losses of the transmission and distribution systems
Methods for performing technical calculations for avoided energy, effective generation capacity
and effective distribution capacity
Economic methods for calculating each value component (e.g., avoided fuel cost, capacity cost,
etc.)
Requirements for summarizing input data and final calculations in order to facilitate PUC and
stakeholder review
Application of the methodology results in the creation of two tables: the VOS Data Table (a table of
utility-specific input assumptions) and the VOS Calculation Table (a table of utility-specific total value of
1 MN Laws 2013, Chapter 85 HF 729, Article 9, Section 10.

Minnesota Value of Solar: Methodology | Minnesota Department of Commerce
Page iii
solar). Together these two tables ensure transparency and facilitate understanding among stakeholders
and regulators.
The VOS Calculation Table is illustrated in Figure ES-1. The table shows each value component and how
the gross economic value of each component is converted into a distributed solar value. The process
uses a component-specific load match factor (where applicable) and a component-specific loss savings
factor. The values are then summed to yield the 25-year levelized value.
Figure ES-1. VOS Calculation Table: economic value, load match, loss savings and distributed PV value.
As a final step, the methodology calls for the conversion of the 25-year levelized value to an equivalent
inflation-adjusted credit. The utility would then use the first year value as the credit for solar customers,
and would adjust each year using the latest Consumer Price Index (CPI) data.
Minnesota Value of Solar: Methodology | Minnesota Department of Commerce
Page iv
Contents
Executive Summary ....................................................................................................................................... ii
Introduction .................................................................................................................................................. 1
Background ...................................................................................................................................... 1
Purpose ............................................................................................................................................ 1
VOS Calculation Table Overview ...................................................................................................... 1
VOS Rate Implementation ............................................................................................................................ 3
Separation of Usage and Production ............................................................................................... 3
VOS Components ............................................................................................................................. 3
Solar Penetration ............................................................................................................................. 5
Marginal Fuel ................................................................................................................................... 5
Economic Analysis Period ................................................................................................................ 6
Annual VOS Tariff Update ................................................................................................................ 6
Transparency Elements .................................................................................................................... 6
Glossary ............................................................................................................................................ 6
Methodology: Assumptions .......................................................................................................................... 7
Fixed Assumptions ........................................................................................................................... 7
Utility-Specific Assumptions and Calculations ............................................................................... 10
Methodology: Technical Analysis ............................................................................................................... 12
Load Analysis Period ...................................................................................................................... 12
PV Energy Production .................................................................................................................... 13
PV System Rating Convention ........................................................................................................ 13
Hourly PV Fleet Production ............................................................................................................ 13
PV Fleet Shape ............................................................................................................................... 16
Marginal PV Resource .................................................................................................................... 16

Minnesota Value of Solar: Methodology | Minnesota Department of Commerce
Page v
Annual Avoided Energy .................................................................................................................. 16
Load-Match Factors ....................................................................................................................... 16
Effective Load Carrying Capability (ELCC) ...................................................................................... 17
Peak Load Reduction (PLR) ............................................................................................................ 17
Loss Savings Analysis ...................................................................................................................... 18
Loss Savings Factors ....................................................................................................................... 19
Methodology: Economic Analysis ............................................................................................................... 20
Discount Factors ............................................................................................................................ 20
Avoided Fuel Cost .......................................................................................................................... 21
Avoided Plant O&M – Fixed ........................................................................................................... 26
Avoided Plant O&M – Variable ...................................................................................................... 28
Avoided Generation Capacity Cost ................................................................................................ 29
Avoided Reserve Capacity Cost ...................................................................................................... 31
Avoided Transmission Capacity Cost ............................................................................................. 31
Avoided Distribution Capacity Cost ............................................................................................... 34
System-wide Avoided Costs ........................................................................................................... 34
Location-specific Avoided Costs..................................................................................................... 36
Avoided Environmental Cost ......................................................................................................... 40
Avoided Voltage Control Cost ........................................................................................................ 41
Solar Integration Cost .................................................................................................................... 41
VOS Example Calculation ............................................................................................................................ 43
Glossary ....................................................................................................................................................... 46

Minnesota Value of Solar: Methodology | Minnesota Department of Commerce
Page 1
Introduction
Background
Minnesota passed legislation2 in 2013 that allows Investor-Owned Utilities (IOUs) to apply to the Public
Utility Commission (PUC) for a Value of Solar (VOS) tariff as an alternative to net metering, and as a rate
identified for community solar gardens. The Department of Commerce (Commerce) was assigned the
responsibility of developing and submitting a methodology for calculating the VOS tariff to the PUC by
January 31, 2014. Utilities adopting the VOS will be required to follow this methodology when
calculating the VOS rate. Commerce selected Clean Power Research (CPR) to support the process of
developing the methodology, and additionally held four public workshops to develop, present, and
receive feedback.
The present document provides the VOS methodology to be used by participating utilities. It is based on
the enabling statute, stakeholder input and guidance from Commerce.
Purpose
The State of Minnesota has identified a VOS tariff as a potential replacement for the existing Net Energy
Metering (NEM) policy that currently regulates the compensation of home and business owners for
electricity production from PV systems. As such, the adopted VOS legislation is not an incentive for
distributed PV, nor is it intended to eliminate or prevent current or future incentive programs.
While NEM effectively values PV-generated electricity at the customer retail rate, a VOS tariff seeks to
quantify the value of distributed PV electricity. If the VOS is set correctly, it will account for the real
value of the PV-generated electricity, and the utility and its ratepayers would be indifferent to whether
the electricity is supplied from customer-owned PV or from comparable conventional means. Thus, a
VOS tariff eliminates the NEM cross-subsidization concerns. Furthermore, a well-constructed VOS tariff
could provide market signals for the adoption of technologies that significantly enhance the value of
electricity from PV, such as advanced inverters that can assist the grid with voltage regulation.
VOS Calculation Table Overview
The VOS is the sum of several distinct value components, each calculated separately using procedures
defined in this methodology. As illustrated in Figure 1, the calculation includes a gross component value,
a component-dependent load-match factor (as applicable for capacity related values) and a component-
dependent Loss Savings Factor.
2 MN Laws 2013, Chapter 85 HF 729, Article 9, Section 10.

Minnesota Value of Solar: Methodology | Minnesota Department of Commerce
Page 2
For example, the avoided fuel cost does not have a load match factor because it is not dependent upon
performance at the highest hours (fuel costs are avoided during all PV operating hours). Avoided fuel
cost does have a Loss Savings Factor, however, accounting for loss savings in both transmission and
distribution systems. On the other hand, the Avoided Distribution Capacity Cost has an important Load
Match Factor (shown as Peak Load Reduction, or ‘PLR’) and a Loss Savings Factor that only accounts for
distribution (not transmission) loss savings.
Gross Values, Distributed PV Values, and the summed VOS shown in Figure 1 are all 25-year levelized
values denominated in dollars per kWh.
Figure 1. Illustration of the VOS Calculation Table

Minnesota Value of Solar: Methodology | Minnesota Department of Commerce
Page 3
VOS Rate Implementation
Separation of Usage and Production
Minnesota’s VOS legislation mandates that, if a VOS tariff is approved, solar customers will be billed for
all usage under their existing applicable tariff, and will receive a VOS credit for their gross solar energy
production. Separating usage (charges) from production (credits) simplifies the rate process for several
reasons:
Customers will be billed for all usage. Energy derived from the PV systems will not be used to
offset (“net”) usage prior to calculating charges. This will ensure that utility infrastructure costs
will be recovered by the utilities as designed in the applicable retail tariff.
The utility will provide all energy consumed by the customer. Standby charges for customers
with on-site PV systems are not permitted under a VOS rate.
The rates for usage can be adjusted in future ratemaking.
VOS Components
The definition and selection of VOS components were based on the following considerations:
Components corresponding to minimum statutory requirements are included. These account for
the “value of energy and its delivery, generation capacity, transmission capacity, transmission
and distribution line losses, and environmental value.”
Non-required components were selected only if they were based on known and measurable
evidence of the cost or benefit of solar operation to the utility.
Environmental costs are included as a required component, and are based on existing
Minnesota and federal externality costs.
Avoided fuel costs are based on long-term risk-free fuel supply contracts. This value implicitly
includes both the avoided cost of fuel, as well as the avoided cost of price volatility risk that is
otherwise passed from the utility to customers through fuel price adjustments.
Credit for systems installed at high value locations (identified in the legislation as an option) is
included as an option for the utility. It is not a separate VOS component but rather is
implemented using a location-specific distribution capacity value (the component most affected
by location). This is addressed in the Distribution Capacity Cost section.
Voltage control and solar integration (a cost) are kept as “placeholder” components for future
years. Methodologies are not provided, but these components may be developed for the future.
Voltage control benefits are anticipated but will first require implementation of recent changes
to national interconnection standards. Solar integration costs are expected to be small, but
possibly measureable. Further research will be required on this topic.

Minnesota Value of Solar: Methodology | Minnesota Department of Commerce
Page 4
Table 1 presents the VOS components selected by Commerce and the cost basis for each component.
Table 2 presents the VOS components that were considered but not selected by Commerce. Selections
were made based on requirements and guidance in the enabling statute, and were informed by
stakeholder comments (including those from Minnesota utilities; local and national solar and
environmental organizations; local solar manufacturers and installers; and private parties) and workshop
discussions. Stakeholders participated in four public workshops and provided comments through
workshop panels, workshop Q&A sessions and written comments.
Table 1. VOS components included in methodology.
Value Component Basis Legislative Guidance
Notes
Avoided Fuel Cost Energy market costs (portion attributed to fuel)
Required (energy) Includes cost of long-term price risk
Avoided Plant O&M Cost Energy market costs (portion attributed to O&M)
Required (energy)
Avoided Generation Capacity Cost
Capital cost of generation to meet peak load
Required (capacity)
Avoided Reserve Capacity Cost
Capital cost of generation to meet planning margins and ensure reliability
Required (capacity)
Avoided Transmission Capacity Cost
Capital cost of transmission Required (transmission capacity)
Avoided Distribution Capacity Cost
Capital cost of distribution Required (delivery)
Avoided Environmental Cost
Externality costs Required (environmental)
Voltage Control Cost to regulate distribution (future inverter designs)
Future (TBD)
Integration Cost3 Added cost to regulate system frequency with variable solar
Future (TBD)
3 This is not a value, but a cost. It would reduce the VOS rate if included.

Minnesota Value of Solar: Methodology | Minnesota Department of Commerce
Page 5
Table 2. VOS components not included in methodology.
Value Component Basis Legislative Guidance
Notes
Credit for Local Manufacturing/ Assembly
Local tax revenue tied to net solar jobs
Optional (identified in legislation)
Market Price Reduction Cost of wholesale power reduced in response to reduction in demand
Disaster Recovery Cost to restore local economy (requires energy storage and islanding inverters)
Solar Penetration
Solar penetration refers to the total installed capacity of PV on the grid, generally expressed as a
percentage of the grid’s total load. The level of solar penetration on the grid is important because it
affects the calculation of the Effective Load Carrying Capability (ELCC) and Peak Load Reduction (PLR)
load-match factors (described later).
In the methodology, the near-term level of PV penetration is used. This is done so that the capacity-
related value components will reflect the near-term level of PV penetration on the grid. However, the
change in PV penetration level will be accounted for in the annual adjustment to the VOS. To the extent
that PV penetration increases, future VOS rates will reflect higher PV penetration levels.
Marginal Fuel
This methodology assumes that PV displaces natural gas during PV operating hours. This is consistent
with current and projected MISO market experience. During some hours of the year, other fuels (such as
coal) may be the fuel on the margin. In these cases, natural gas displacement is a simplifying assumption
that is not expected to materially impact the calculated VOS tariff. However, if future analysis indicates
that the assumption is not warranted, then the methodology may be modified accordingly. For example,
by changing the methodology to include displacement of coal production, avoided fuel costs may
decrease and avoided environmental costs may increase.

Minnesota Value of Solar: Methodology | Minnesota Department of Commerce
Page 6
Economic Analysis Period
In evaluating the value of a distributed PV resource, the economic analysis period is set at 25 years, the
assumed useful service life of the PV system4. The methodology includes PV degradation effects as
described later.
Annual VOS Tariff Update
Each year, a new VOS tariff would be calculated using current data, and the new resulting VOS rate
would be applicable to all customers entering the tariff during the year. Changes such as increased or
decreased fuel prices and modified hourly utility load profiles due to higher solar penetration will be
incorporated into each new annual calculation.
Customers who have already entered into the tariff in a previous year will not be affected by this annual
adjustment. However, customers who have entered into a tariff in prior years will see their Value of
Solar rates adjusted for the previous year’s inflation rate as described later.
Commerce may also update the methodology to use the best available practices, as necessary.
Transparency Elements
The methodology incorporates two tables that are to be included in a utility’s application to the
Minnesota PUC for the use of a VOS tariff. These tables are designed to improve transparency and
facilitate understanding among stakeholders and regulators.
VOS Data Table. This table provides a utility-specific defined list of the key input assumptions
that go into the VOS tariff calculation. This table is described in more detail later.
VOS Calculation Table. This table includes the list of value components and their gross values,
their load-match factors, their Loss Savings Factors, and the computation of the total levelized
value.
Glossary
A glossary is provided at the end of this document defining some of the key terms used throughout this
document.
4 NREL: Solar Resource Analysis and High-Penetration PV Potential (April 2010). http://www.nrel.gov/docs/fy10osti/47956.pdf

Minnesota Value of Solar: Methodology | Minnesota Department of Commerce
Page 7
Methodology: Assumptions
Fixed Assumptions
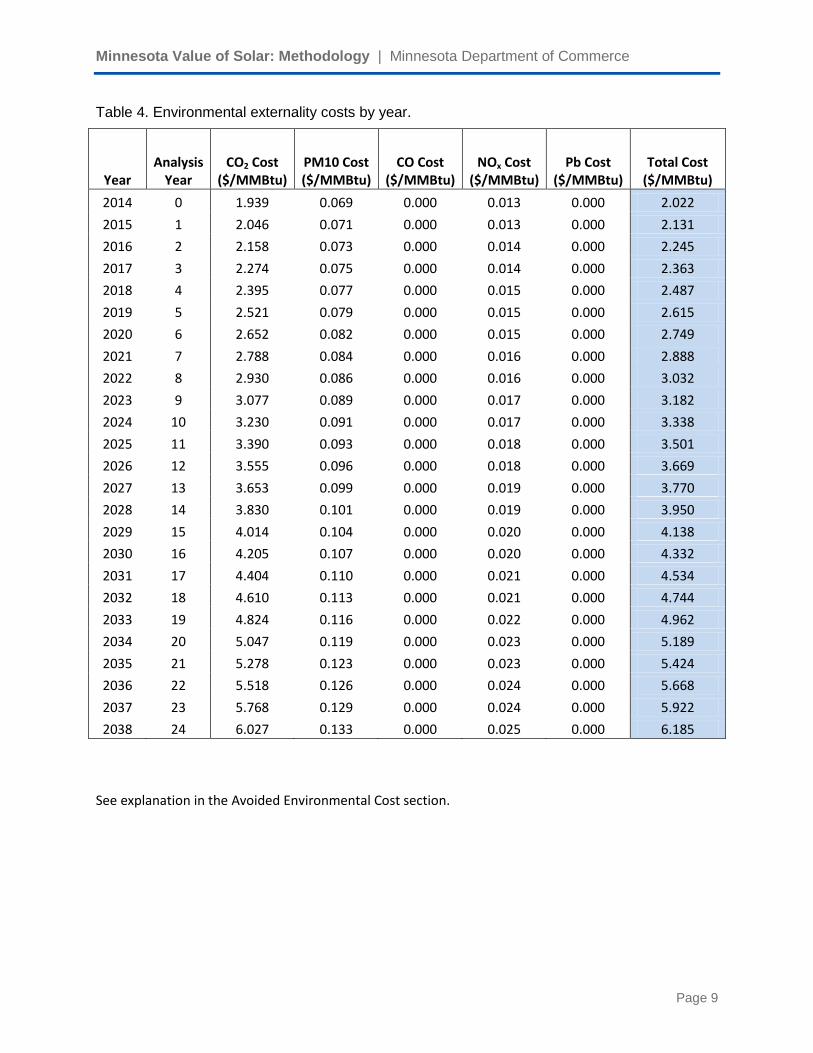
Table 3 and Table 4 present fixed assumptions, common to all utilities and incorporated into this
methodology, that are to be applied to the calculation of 2014 VOS tariffs. These may be updated by
Commerce in future years as necessary when performing the annual VOS update. Table 4 is described in
more detail in the Avoided Environmental Cost subsection. Table terms can be found in the Glossary.
The general escalation rate is calculated as the average annual inflation rate over the last 25 years. The
methodology uses the U.S. Bureau of Labor Statistics’ Urban Consumer Price Index (CPI) data.
To retrieve Urban CPI data follow these steps:
1. Go to the U.S. Bureau of Labor Statistics’s Top Picks for Consumer Price Index – All Urban
Consumers5
2. Select “ U.S. All items, 1982-84=100 - CUUR0000SA0”. Click the “Retrieve Data” button near the
bottom of the page.
3. Across from “Change Output Options”, change the “from” and “to” years to capture the last 25
years of annual average CPI data. For example, a VOS rate calculated in 2014 would enter 1998
(“from” year) and 2013 (“to” year). Click on “go” to generate the data for this time period.
4. Select the annual average CPI numbers for the first and last year of the 25 year period. These
numbers are under the “Annual” column. For example, the 1988 annual CPI factor is 118.3, and
the 2013 factor is 232.957.
5. Use the annual CPI factors in equation (1) to calculate the 25 year average annual inflation rate.
( )
( 1 )
( 2 ) ⁄
( )
=[( ) ]
5 CPI data can currently be found at: http://data.bls.gov/cgi-bin/surveymost?cu

Minnesota Value of Solar: Methodology | Minnesota Department of Commerce
Page 8
Table 3. Fixed assumptions used in Methodology’s Example VOS calculations
Guaranteed NG Fuel Prices
Year Environmental Externalities
2014 $3.93 $ per MMBtu Environmental discount rate (nominal) 5.83% per year
2015 $4.12 $ per MMBtu Environmental costs (shown in separate table)
2016 $4.25 $ per MMBtu
2017 $4.36 $ per MMBtu Economic Assumptions
2018 $4.50 $ per MMBtu General escalation rate 2.75% per year
2019 $4.73 $ per MMBtu
2020 $5.01 $ per MMBtu
2021 $5.33 $ per MMBtu Treasury Yields
2022 $5.67 $ per MMBtu 1 Year 0.13%
2023 $6.02 $ per MMBtu 2 Year 0.29%
2024 $6.39 $ per MMBtu 3 Year 0.48%
2025 $6.77 $ per MMBtu 5 Year 1.01%
7 Year 1.53%
PV Assumptions 10 Year 2.14%
PV degradation rate 0.50% per year 20 Year 2.92%
PV life 25 years 30 Year 3.27%
Minnesota Value of Solar: Methodology | Minnesota Department of Commerce
Page 9
Table 4. Environmental externality costs by year.
Year Analysis
Year CO2 Cost
($/MMBtu) PM10 Cost ($/MMBtu)
CO Cost ($/MMBtu)
NOx Cost ($/MMBtu)
Pb Cost ($/MMBtu)
Total Cost ($/MMBtu)
2014 0 1.939 0.069 0.000 0.013 0.000 2.022
2015 1 2.046 0.071 0.000 0.013 0.000 2.131
2016 2 2.158 0.073 0.000 0.014 0.000 2.245
2017 3 2.274 0.075 0.000 0.014 0.000 2.363
2018 4 2.395 0.077 0.000 0.015 0.000 2.487
2019 5 2.521 0.079 0.000 0.015 0.000 2.615
2020 6 2.652 0.082 0.000 0.015 0.000 2.749
2021 7 2.788 0.084 0.000 0.016 0.000 2.888
2022 8 2.930 0.086 0.000 0.016 0.000 3.032
2023 9 3.077 0.089 0.000 0.017 0.000 3.182
2024 10 3.230 0.091 0.000 0.017 0.000 3.338
2025 11 3.390 0.093 0.000 0.018 0.000 3.501
2026 12 3.555 0.096 0.000 0.018 0.000 3.669
2027 13 3.653 0.099 0.000 0.019 0.000 3.770
2028 14 3.830 0.101 0.000 0.019 0.000 3.950
2029 15 4.014 0.104 0.000 0.020 0.000 4.138
2030 16 4.205 0.107 0.000 0.020 0.000 4.332
2031 17 4.404 0.110 0.000 0.021 0.000 4.534
2032 18 4.610 0.113 0.000 0.021 0.000 4.744
2033 19 4.824 0.116 0.000 0.022 0.000 4.962
2034 20 5.047 0.119 0.000 0.023 0.000 5.189
2035 21 5.278 0.123 0.000 0.023 0.000 5.424
2036 22 5.518 0.126 0.000 0.024 0.000 5.668
2037 23 5.768 0.129 0.000 0.024 0.000 5.922
2038 24 6.027 0.133 0.000 0.025 0.000 6.185
See explanation in the Avoided Environmental Cost section.

Minnesota Value of Solar: Methodology | Minnesota Department of Commerce
Page 10
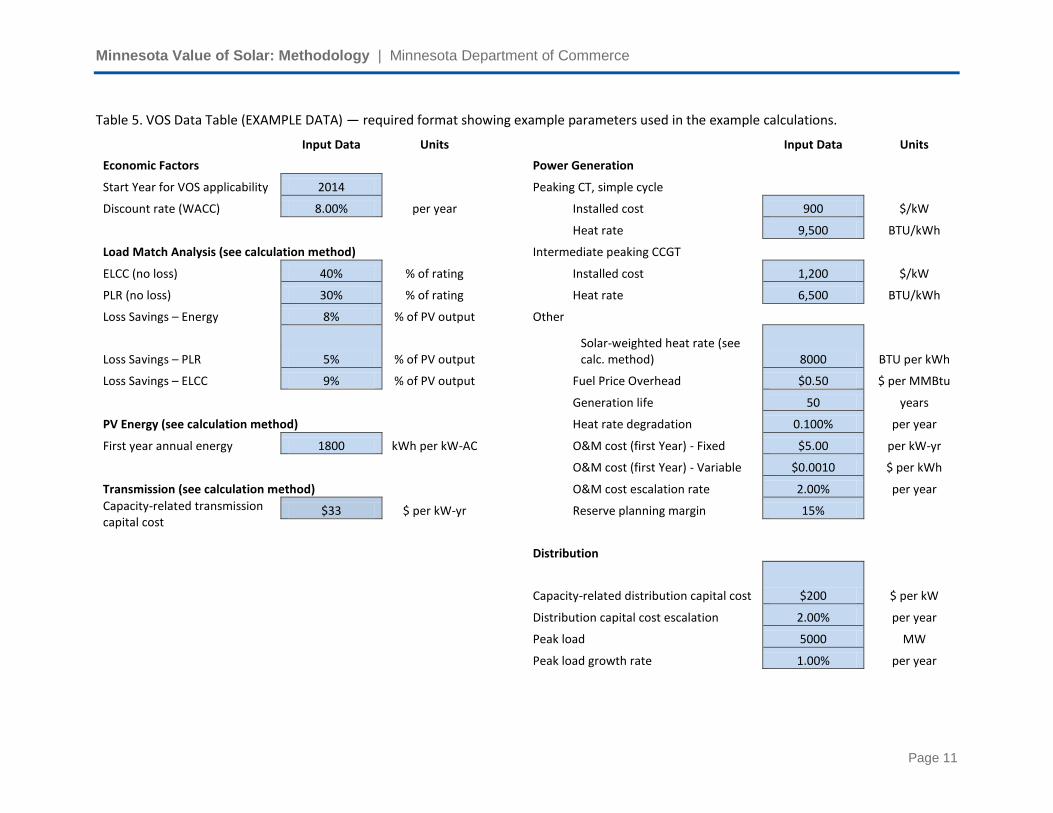
Utility-Specific Assumptions and Calculations
Some assumptions and calculations are unique to each utility. These include economic assumptions
(such as discount rate) and technical calculations (such as ELCC). Utility-specific assumptions and
calculations are determined by the utility, and are included in the VOS Data Table, a required
transparency element.
The utility-specific calculations (such as capacity-related transmission capital cost) are determined using
the methods described in this methodology.
An example VOS Data Table, showing the parameters to be included in the utility filing for the VOS tariff,
is shown in Table 5. This table includes values that are given for example only. These example values
carry forward in the example calculations.
Minnesota Value of Solar: Methodology | Minnesota Department of Commerce
Page 11
Table 5. VOS Data Table (EXAMPLE DATA) — required format showing example parameters used in the example calculations.
Input Data Units
Input Data Units
Economic Factors
Power Generation Start Year for VOS applicability 2014
Peaking CT, simple cycle Discount rate (WACC) 8.00% per year
Installed cost 900 $/kW
Heat rate 9,500 BTU/kWh
Load Match Analysis (see calculation method)
Intermediate peaking CCGT ELCC (no loss) 40% % of rating
Installed cost 1,200 $/kW
PLR (no loss) 30% % of rating
Heat rate 6,500 BTU/kWh
Loss Savings – Energy 8% % of PV output
Other
Loss Savings – PLR 5% % of PV output
Solar-weighted heat rate (see calc. method) 8000 BTU per kWh
Loss Savings – ELCC 9% % of PV output
Fuel Price Overhead $0.50 $ per MMBtu
Generation life 50 years
PV Energy (see calculation method)
Heat rate degradation 0.100% per year
First year annual energy 1800 kWh per kW-AC
O&M cost (first Year) - Fixed $5.00 per kW-yr
O&M cost (first Year) - Variable $0.0010 $ per kWh
Transmission (see calculation method)
O&M cost escalation rate 2.00% per year
Capacity-related transmission capital cost
$33 $ per kW-yr
Reserve planning margin 15%
Distribution
Capacity-related distribution capital cost $200 $ per kW
Distribution capital cost escalation 2.00% per year
Peak load 5000 MW
Peak load growth rate 1.00% per year

Minnesota Value of Solar: Methodology | Minnesota Department of Commerce
Page 12
Methodology: Technical Analysis
Load Analysis Period
The VOS methodology requires that a number of technical parameters (PV energy production, effective
load carrying capability (ELCC) and peak load reduction (PLR) load-match factors, and electricity-loss
factors) be calculated over a fixed period of time in order to account for day-to-day variations and
seasonal effects, such as changes in solar radiation. For this reason, the load analysis period must cover
a period of at least one year.
The data may start on any day of the year, and multiple years may be included, as long as all included
years are contiguous and each included year is a complete one-year period. For example, valid load
analysis periods may be 1/1/2012 0:00 to 12/31/2012 23:00 or 11/1/2010 0:00 to 10/31/2013 23:00.
Three types of time series data are required to perform the technical analysis:
Hourly Generation Load: the hourly utility load over the Load Analysis Period. This is the sum of
utility generation and import power needed to meet all customer load.
Hourly Distribution Load: the hourly distribution load over the Load Analysis Period. The
distribution load is the power entering the distribution system from the transmission system
(i.e., generation load minus transmission losses).
Hourly PV Fleet Production: the hourly PV Fleet production over the Load Analysis Period. The
PV fleet production is the aggregate generation of all of the PV systems in the PV fleet.
All three types of data must be provided as synchronized, time-stamped hourly values of average power
over the same period, and corresponding to the same hourly intervals. Data must be available for every
hour of the Load Analysis Period.
PV data using Typical Meteorological Year data is not time synchronized with time series production
data, so it should not be used as the basis for PV production.
Data that is not in one-hour intervals must be converted to hourly data (for example, 15-minute meter
data would have to be combined to obtain 1-hour data). Also, data values that represent energy must
be converted to average power.
If data is missing or deemed erroneous for any time period less than or equal to 24 hours, the values
corresponding to that period may be replaced with an equal number of values from the same time
interval on the previous or next day if it contains valid data. This data replacement method may be used
provided that it does not materially affect the results.

Minnesota Value of Solar: Methodology | Minnesota Department of Commerce
Page 13
PV Energy Production
PV System Rating Convention
The methodology uses a rating convention for PV capacity based on AC delivered energy (not DC), taking
into account losses internal to the PV system. A PV system rated output is calculated by multiplying the
number of modules by the module PTC rating6 [as listed by the California Energy Commission (CEC)7] to
account for module de-rate effects. The result is then multiplied by the CEC-listed inverter efficiency
rating8 to account for inverter efficiency, and the result is multiplied by a loss factor to account for
internal PV array losses (wiring losses, module mismatch and other losses).
If no CEC module PTC rating is available, the module PTC rating should be calculated as 0.90 times the
module STC rating9. If no CEC inverter efficiency rating is available, an inverter efficiency of 0.95 should
be used. If no measured or design loss factor is available, 0.85 should be used.
To summarize: 10
Rating (kW-AC) = [Module Quantity] x [Module PTC rating (kW)] x [Inverter Efficiency Rating] x [Loss
Factor]
Hourly PV Fleet Production
Hourly PV Fleet Production can be obtained using any one of the following three options:
1. Utility Fleet - Metered Production. Fleet production data can be created by combining actual
metered production data for every PV system in the utility service territory, provided that there
are a sufficient number of systems11 installed to accurately derive a correct representation of
aggregate PV production. Such metered data is to be gross PV output on the AC side of the
6 PTC refers to PVUSA Test Conditions, which were developed to test and compare PV systems as part of the
PVUSA (Photovoltaics for Utility Scale Applications) project. PTC are 1,000 Watts per square meter solar irradiance, 20 degrees C air temperature, and wind speed of 1 meter per second at 10 meters above ground level. PV manufacturers use Standard Test Conditions, or STC, to rate their PV products. 7 CEC module PTC ratings for most modules can be found at:
http://www.gosolarcalifornia.ca.gov/equipment/pv_modules.php 8 CEC inverter efficiency ratings for most inverters can be found at:
http://www.gosolarcalifornia.ca.gov/equipment/inverters.php 9 PV manufacturers use Standard Test Conditions, or STC, to rate their PV products. STC are 1,000 Watts per square
meter solar irradiance, 25 degrees C cell temperature, air mass equal to 1.5, and ASTM G173-03 standard spectrum. 10
In some cases, this equation will have to be adapted to account for multiple module types and/or inverters. In such cases, the rating of each subsystem can be calculated independently and then added. 11
A sufficient number of systems has been achieved when adding a single system of random orientation, tilt, tracking characteristics, and capacity (within reason) does not materially change the observed hourly PV Fleet Shape (see next subsection of PV Fleet Shape definition).

Minnesota Value of Solar: Methodology | Minnesota Department of Commerce
Page 14
system, but before local customer loads are subtracted (i.e., PV must be separately metered
from load). Metered data from individual systems is then aggregated by summing the measured
output for all systems for each one-hour period. For example, if system A has an average power
of 4.5 kW-AC from 11:00 AM to 12:00 PM, and system B has an average power of 2.3 kW-AC
from 11:00 AM to 12:00 PM, the combined average power for 11:00 AM to 12:00 PM would be
6.8 kW-AC.
2. Utility Fleet, Simulated Production. If metered data is not available, the aggregate output of all
distributed PV systems in the utility service territory can be modeled using PV system technical
specifications and hourly irradiance and temperature data. These systems must be deployed in
sufficient numbers to accurately derive a correct representation of aggregate PV production.
Modeling must take into account the system's location and each array's tracking capability
(fixed, single-axis or dual-axis tracking), orientation (tilt and azimuth), module PTC ratings,
inverter efficiency and power ratings, other loss factors and the effect of temperature on
module output. Technical specifications for each system must be available to enable such
modeling. Modeling must also make use of location-specific, time-correlated, measured or
satellite-derived plane of array irradiance data. Ideally, the software will also support modeling
of solar obstructions.
To make use of this option, detailed system specifications for every PV system in the utility's
service territory must be obtained. At a minimum, system specifications must include:
o Location (latitude and longitude)
o System component ratings (e.g., module ratings an inverter ratings)
o Tilt and azimuth angles
o Tracking type (if applicable)
After simulating the power production for each system for each hour in the Load Analysis
Period, power production must be aggregated by summing the power values for all systems
for each one-hour period. For example, if system A has an average power of 4.5 kW-AC from
11:00 AM to 12:00 PM, and system B has an average power of 2.3 kW-AC from 11:00 AM to
12:00 PM, the combined average power for 11:00 AM to 12:00 PM would be 6.8 kW-AC.
3. Expected Fleet, Simulated Production. If neither metered production data nor detailed PV
system specifications are available, a diverse set of PV resources can be estimated by simulating
groups of systems at major load centers in the utility's service territory with some assumed fleet
configuration. To use this method, one or more of the largest load centers in the utility service
territory may be used. If a single load center accounts for a high percentage of the utility's total
load, a single location will suffice. If there are several large load centers in the territory, groups
of systems can be created at each location with capacities proportional to the load in that area.
For each location, simulate multiple systems, each rated in proportion to the expected
capacity, with azimuth and tilt angles such as the list of systems presented in Table 6. Note

Minnesota Value of Solar: Methodology | Minnesota Department of Commerce
Page 15
that the list of system configurations should represent the expected fleet composition. No
method is explicitly provided to determine the expected fleet composition; however, a
utility could analyze the fleet composition of PV fleets outside of its territory.
Table 6. (EXAMPLE) Azimuth and tilt angles
System Azimuth Tilt % Capacity
1 90 20 3.5
2 135 15 3.0
3 135 30 6.5
4 180 0 6.0
5 180 15 16.0
6 180 25 22.5
7 180 35 18.0
8 235 15 8.5
9 235 30 9.0
10 270 20 7.0
Simulate each of the PV systems for each hour in the Load Analysis Period. Aggregate power
production for the systems is obtained by summing the power values for each one-hour
period. For example, if system A has an average power of 4.5 kW-AC from 11:00 AM to
12:00 PM, and system B has an average power of 2.3 kW-AC from 11:00 AM to 12:00 PM,
the combined average power for 11:00 AM to 12:00 PM would be 6.8 kW-AC.
If the utility elects to perform a location-specific analysis for the Avoided Distribution
Capacity Costs, then it should also take into account what the geographical distribution of
the expected PV fleet would be. Again, this could be done by analyzing a PV fleet
composition outside of the utility’s territory. An alternative method that would be
acceptable is to distribute the expected PV fleet across major load centers. Thereby
assuming that PV capacity is likely to be added where significant load (and customer
density) already exists.
Regardless of location count and location weighting, the total fleet rating is taken as the sum
of the individual system ratings.

Minnesota Value of Solar: Methodology | Minnesota Department of Commerce
Page 16
PV Fleet Shape
Regardless of which of the three methods is selected for obtaining the Hourly PV Fleet production, the
next step is divide each hour’s value by the PV Fleet's aggregate AC rating to obtain the PV Fleet Shape.
The units of the PV Fleet Shape are kWh per hour per kW-AC (or, equivalently, average kW per kW-AC).
Marginal PV Resource
The PV Fleet Shape is hourly production of a Marginal PV Resource having a rating of 1 kW-AC.
Annual Avoided Energy
Annual Avoided Energy (kWh per kW-AC per year) is the sum of the hourly PV Fleet Shape across all
hours of the Load Analysis Period, divided by the numbers of years in the Load Analysis Period. The
result is the annual output of the Marginal PV Resource.
( 3 ) ∑
Defined in this way, the Annual Avoided Energy does not include the effects of loss savings. As
described in the Loss Analysis subsection, however, it will have to be calculated for the two loss
cases (with losses and without losses).
Load-Match Factors
Capacity-related benefits are time dependent, so it is necessary to evaluate the effectiveness of PV in
supporting loads during the critical peak hours. Two different measures of effective capacity are used:
Effective Load Carrying Capability (ELCC)
Peak Load Reduction (PLR)
Near term PV penetration levels are used in the calculation of the ELCC and PLR values so that the
capacity-related value components will reflect the near term level of PV penetration on the grid.
However, the ELCC and PLR will be re-calculated during the annual VOS adjustment and thus reflect any
increase in future PV Penetration Levels.

Minnesota Value of Solar: Methodology | Minnesota Department of Commerce
Page 17
Effective Load Carrying Capability (ELCC)
The Effective Load Carrying Capability (ELCC) is the measure of the effective capacity for distributed PV
that can be applied to the avoided generation capacity costs, the avoided reserve capacity costs, the
avoided generation fixed O&M costs, and the avoided transmission capacity costs (see Figure 1).
Using current MISO rules for non-wind variable generation (MISO BPM-011, Section 4.2.2.4, page 35)12:
the ELCC will be calculated from the PV Fleet Shape for hours ending 2pm, 3pm, and 4pm Central
Standard Time during June, July, and August over the most recent three years. If three years of data are
unavailable, MISO requires “a minimum of 30 consecutive days of historical data during June, July, or
August” for the hours ending 2pm, 3pm and 4pm Central Standard Time.
The ELCC is calculated by averaging the PV Fleet Shape over the specified hours, and then dividing by the
rating of the Marginal PV Resource (1 kW-AC), which results in a percentage value. Additionally, the
ELCC must be calculated for the two loss cases (with and without T&D losses, as described in the Loss
Analysis subsection).
Peak Load Reduction (PLR)
The PLR is defined as the maximum distribution load over the Load Analysis Period (without the
Marginal PV Resource) minus the maximum distribution load over the Load Analysis Period (with the
Marginal PV Resource). The distribution load is the power entering the distribution system from the
transmission system (i.e., generation load minus transmission losses). In calculating the PLR, it is not
sufficient to limit modeling to the peak hour. All hours over the Load Analysis Period must be included in
the calculation. This is because the reduced peak load may not occur in the same hour as the original
peak load.
The PLR is calculated as follows. First, determine the maximum Hourly Distribution Load (D1) over the
Load Analysis Period. Next, create a second hourly distribution load time series by subtracting the effect
of the Marginal PV Resource, i.e., by evaluating what the new distribution load would be each hour
given the PV Fleet Shape. Next, determine the maximum load in the second time series (D2). Finally,
calculate the PLR by subtracting D2 from D1.
In other words, the PLR represents the capability of the Marginal PV Resource to reduce the peak
distribution load over the Load Analysis Period. PLR is expressed in kW per kW-AC.
Additionally, the PLR must be calculated for the two loss cases (with distribution losses and without
distribution losses, as described in the Loss Analysis subsection).
12
https://www.misoenergy.org/Library/BusinessPracticesManuals/Pages/BusinessPracticesManuals.aspx

Minnesota Value of Solar: Methodology | Minnesota Department of Commerce
Page 18
Loss Savings Analysis
In order to calculate the required Loss Savings Factors on a marginal basis as described below, it will be
necessary to calculate ELCC, PLR and Annual Avoided Energy each twice. They should be calculated first
by including the effects of avoided marginal losses, and second by excluding them. For example, the
ELCC would first be calculated by including avoided transmission and distribution losses, and then re-
calculated assuming no losses, i.e., as if the Marginal PV Resource was a central (not distributed)
resource.
The calculations should observe the following
Table 7. Losses to be considered.
Technical Parameter Loss Savings Considered Avoided Annual Energy Avoided transmission and distribution losses for every
hour of the load analysis period.
ELCC Avoided transmission and distribution losses during the MISO defined hours.
PLR Avoided distribution losses (not transmission) at peak.
When calculating avoided marginal losses, the analysis must satisfy the following requirements:
1. Avoided losses are to be calculated on an hourly basis over the Load Analysis Period. The
avoided losses are to be calculated based on the generation (and import) power during the hour
and the expected output of the Marginal PV Resource during the hour.
2. Avoided losses in the transmission system and distribution systems are to be evaluated
separately using distinct loss factors based on the most recent study data available.
3. Avoided losses should be calculated on a marginal basis. The marginal avoided losses are the
difference in hourly losses between the case without the Marginal PV Resource, and the case
with the Marginal PV Resource. Avoided average hourly losses are not calculated. For example,
if the Marginal PV Resource were to produce 1 kW of power for an hour in which total customer
load is 1000 kW, then the avoided losses would be the calculated losses at 1000 kW of customer
load minus the calculated losses at 999 kW of load.
4. Distribution losses should be based on the power entering the distribution system, after
transmission losses.
5. Avoided transmission losses should take into account not only the marginal PV generation, but
also the avoided marginal distribution losses.

Minnesota Value of Solar: Methodology | Minnesota Department of Commerce
Page 19
6. Calculations of avoided losses should not include no-load losses (e.g., corona, leakage current).
Only load-related losses should be included.
7. Calculations of avoided losses in any hour should take into account the non-linear relationship
between losses and load (load-related losses are proportional to the square of the load,
assuming constant voltage). For example, the total load-related losses during an hour with a
load of 2X would be approximately 4 times the total load-related losses during an hour with a
load of only X.
Loss Savings Factors
The Energy Loss Savings Factor (as a percentage) is defined for use within the VOS Calculation Table:
( )
Equation 5 is then rearranged to solve for the Energy Loss Savings Factor:
( 5 )
Similarly, the PLR Loss Savings Factor is defined as:
( 6 )
and the ELCC Loss Savings Factor is defined as:
( 4 )
( 7 )

Minnesota Value of Solar: Methodology | Minnesota Department of Commerce
Page 20
Methodology: Economic Analysis
The following subsections provide a methodology for performing the economic calculations to derive
gross values in $/kWh for each of the VOS components. These gross component values will then be
entered into the VOS Calculation Table, which is the second of the two key transparency elements.
Important Note: The economic analysis is initially performed as if PV was centrally-located (without
loss-saving benefits of distributed location) and with output perfectly correlated to load. Real-world
adjustments are made later in the final VOS summation by including the results of the loss savings and
load match analyses.
Discount Factors
By convention, the analysis year 0 corresponds to the year in which the VOS tariff will begin. As an
example, if a VOS was done in 2013 for customers entering a VOS tariff between January 1, 2014 and
December 31, 2014, then year 0 would be 2014, year 1 would be 2015, and so on.
For each year i, a discount factor is given by
( 8 )
The DiscountRate is the utility Weighted Average Cost of Capital.
Similarly, a risk-free discount factor is given by:
(9 )
The RiskFreeDiscountRate is based on the yields of current Treasury securities13 of 1, 2, 3, 5, 7, 10, 20,
and 30 year maturation dates. The RiskFreeDiscountRate is used once in the calculation of the Avoided
Fuel Costs.
Finally, an environmental discount factor is given by:
( 10 )
13
See http://www.treasury.gov/resource-center/data-chart-center/interest-rates/Pages/TextView.aspx?data=yield

Minnesota Value of Solar: Methodology | Minnesota Department of Commerce
Page 21
The EnvironmentalDiscountRate is based on the 3% real discount rate that has been determined to be
an appropriate societal discount rate for future environmental benefits.14 As the methodology requires a
nominal discount rate, this 3% real discount rate is converted into its equivalent 5.61% nominal discount
rate as follows:15
( 11 )
The EnvironmentalDiscountRate is used once in the calculation of the Avoided Environmental Costs.
PV degradation is accounted for in the economic calculations by reductions of the annual PV production
in future years. As such, the PV production in kWh per kW-AC for the marginal PV resource in year I is
given by:
(
12 )
where PVDegradationRate is the annual rate of PV degradation, assumed to be 0.5% per year – the
standard PV module warranty guarantees a maximum of 0.5% power degradation per annum.
is the Annual Avoided Energy for the Marginal PV Resource.
PV capacity in year i for the Marginal PV Resource, taking into account degradation, equals:
( 13 )
Avoided Fuel Cost
Avoided fuel costs are based on long-term, risk-free fuel supply contracts. This value implicitly includes
both the avoided cost of fuel as well as the avoided cost of price volatility risk that is otherwise passed
from the utility to customers through fuel price adjustments.
PV displaces energy generated from the marginal unit, so it avoids the cost of fuel associated with this
generation. Furthermore, the PV system is assumed to have a service life of 25 years, so the uncertainty
in fuel price fluctuations is also eliminated over this period. For this reason, the avoided fuel cost must
take into account the fuel as if it were purchased under a guaranteed, long term contract.
14
http://www.epa.gov/oms/climate/regulations/scc-tsd.pdf 15
http://en.wikipedia.org/wiki/Nominal_interest_rate

Minnesota Value of Solar: Methodology | Minnesota Department of Commerce
Page 22
The methodology provides for three options to accomplish this:
Futures Market. This option is described in detail below, and is based on the NYMEX NG futures
with a fixed escalation for years beyond the 12-year trading period.
Long Term Price Quotation. This option is identical to the above option, except the input pricing
data is based on an actual price quotation from an AA-rated NG supplier to lock in prices for the
25-year guaranteed period.
Utility-guaranteed Price. This is the 25-year fuel price that is guaranteed by the utilities. Tariffs
using the utility guaranteed price will include a mechanism for removing the usage fuel
adjustment charges and provide fixed prices over the term.
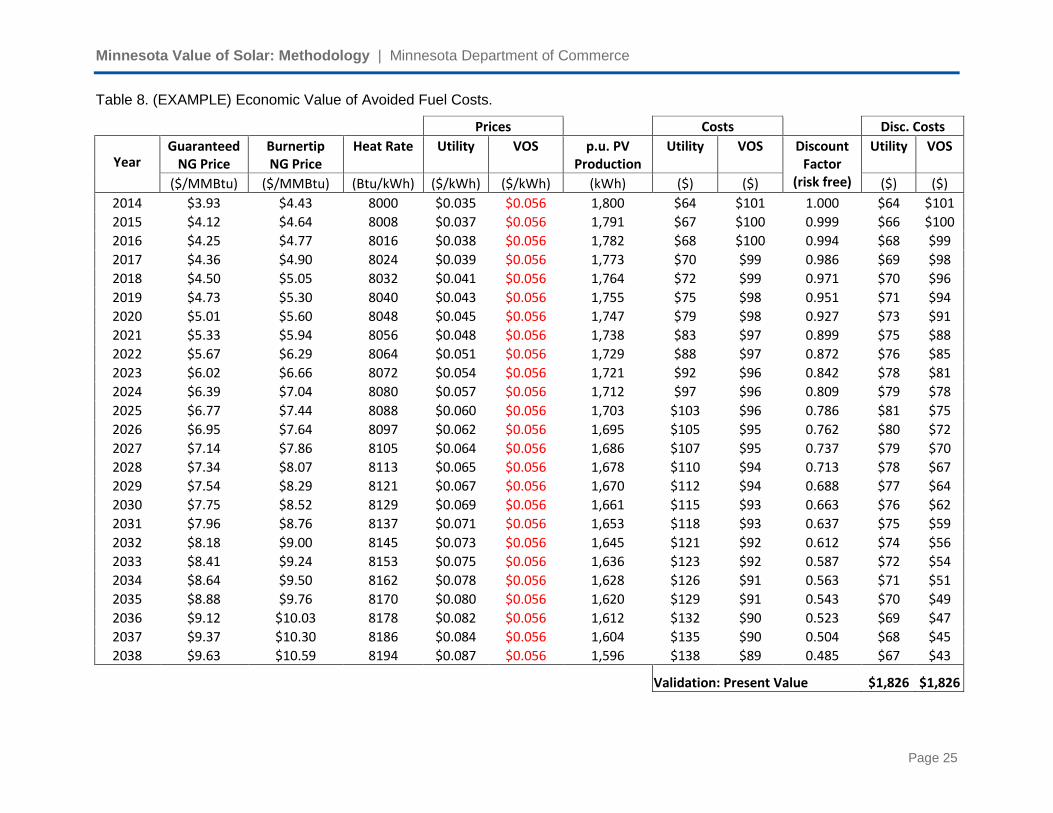
Table 8 presents the calculation of the economic value of avoided fuel costs.
For the Futures Market option, Guaranteed NG prices are calculated as follows. Prices for the first 12
years are based on NYMEX natural gas futures quotes. These quotes are published daily by the CME
Group.16
Guaranteed NG prices are calculated by following these steps:
1. First, monthly prices are determined by averaging the 30 days of NYMEX prices for each
month, starting with the most recent 30 daily prices and then repeating the same 30-
day averaging for every other contract month of the 12 year period. If a utility
calculating a VOS rate does not have historical daily NYMEX prices already collected
internally they can obtain this data by recording quotes for 30 days. The timing of the
data collection should be accounted for in planning the VOS rate calculation.
2. Then, the monthly prices are averaged to give a 12-month average in $ per MMBtu,
resulting in the first 12 annual prices in the set of 25 annual prices. Prices for years
beyond this NYMEX limit are calculated by applying the general escalation rate. An
assumed fuel price overhead amount, escalated by year using the general escalation
rate, is added to the fuel price to give the burnertip fuel price.
3. Prices for years 13 through 25 are calculated by escalating the year 12 annual average
NYMEX quote by the general escalation rate annually for each year.
The guaranteed fuel prices for the methodology’s example calculation are shown in figure 2 below.
16
CME Group’s Natural Gas (Henry Hub) Physical Futures Quotes can be found at: http://www.cmegroup.com/trading/energy/natural-gas/natural-gas.html.

Minnesota Value of Solar: Methodology | Minnesota Department of Commerce
Page 23
Figure 2. (EXAMPLE) Guaranteed Fuel Prices
The first-year solar-weighted heat rate is calculated as follows:
(14 ) ∑
∑
where the summation is over all hours j of the load analysis period, HeatRate is the actual heat rate of
the plant on the margin, and FleetProduction is the Fleet Production Shape time series.
The solar-weighted heat rate for future years is calculated as:
( 15 )
The utility price in year i is:
( 16 )
where the burnertip price is in $ per MMBtu and the heat rate is in Btu per kWh.

Minnesota Value of Solar: Methodology | Minnesota Department of Commerce
Page 24
Utility cost is the product of the utility price and the per unit PV production. These costs are then
discounted using the risk free discount rate and summed for all years. A risk-free discount rate (fitted to
the US Treasury yields shown in Table 3) has been selected to account for the fact that there is no risk in
the avoided fuel cost.
The VOS price (shown in red in Table 8) is the levelized amount that results in the same discounted
amount as the utility price for the Avoided Fuel Cost component.
Minnesota Value of Solar: Methodology | Minnesota Department of Commerce
Page 25
Table 8. (EXAMPLE) Economic Value of Avoided Fuel Costs.
Prices Costs Disc. Costs
Year Guaranteed
NG Price Burnertip NG Price
Heat Rate Utility VOS p.u. PV Production
Utility VOS Discount Factor
(risk free)
Utility VOS
($/MMBtu) ($/MMBtu) (Btu/kWh) ($/kWh) ($/kWh) (kWh) ($) ($) ($) ($)
2014 $3.93 $4.43 8000 $0.035 $0.056 1,800 $64 $101 1.000 $64 $101
2015 $4.12 $4.64 8008 $0.037 $0.056 1,791 $67 $100 0.999 $66 $100
2016 $4.25 $4.77 8016 $0.038 $0.056 1,782 $68 $100 0.994 $68 $99
2017 $4.36 $4.90 8024 $0.039 $0.056 1,773 $70 $99 0.986 $69 $98
2018 $4.50 $5.05 8032 $0.041 $0.056 1,764 $72 $99 0.971 $70 $96
2019 $4.73 $5.30 8040 $0.043 $0.056 1,755 $75 $98 0.951 $71 $94
2020 $5.01 $5.60 8048 $0.045 $0.056 1,747 $79 $98 0.927 $73 $91
2021 $5.33 $5.94 8056 $0.048 $0.056 1,738 $83 $97 0.899 $75 $88
2022 $5.67 $6.29 8064 $0.051 $0.056 1,729 $88 $97 0.872 $76 $85
2023 $6.02 $6.66 8072 $0.054 $0.056 1,721 $92 $96 0.842 $78 $81
2024 $6.39 $7.04 8080 $0.057 $0.056 1,712 $97 $96 0.809 $79 $78
2025 $6.77 $7.44 8088 $0.060 $0.056 1,703 $103 $96 0.786 $81 $75
2026 $6.95 $7.64 8097 $0.062 $0.056 1,695 $105 $95 0.762 $80 $72
2027 $7.14 $7.86 8105 $0.064 $0.056 1,686 $107 $95 0.737 $79 $70
2028 $7.34 $8.07 8113 $0.065 $0.056 1,678 $110 $94 0.713 $78 $67
2029 $7.54 $8.29 8121 $0.067 $0.056 1,670 $112 $94 0.688 $77 $64
2030 $7.75 $8.52 8129 $0.069 $0.056 1,661 $115 $93 0.663 $76 $62
2031 $7.96 $8.76 8137 $0.071 $0.056 1,653 $118 $93 0.637 $75 $59
2032 $8.18 $9.00 8145 $0.073 $0.056 1,645 $121 $92 0.612 $74 $56
2033 $8.41 $9.24 8153 $0.075 $0.056 1,636 $123 $92 0.587 $72 $54
2034 $8.64 $9.50 8162 $0.078 $0.056 1,628 $126 $91 0.563 $71 $51
2035 $8.88 $9.76 8170 $0.080 $0.056 1,620 $129 $91 0.543 $70 $49
2036 $9.12 $10.03 8178 $0.082 $0.056 1,612 $132 $90 0.523 $69 $47
2037 $9.37 $10.30 8186 $0.084 $0.056 1,604 $135 $90 0.504 $68 $45
2038 $9.63 $10.59 8194 $0.087 $0.056 1,596 $138 $89 0.485 $67 $43
Validation: Present Value $1,826 $1,826

Minnesota Value of Solar: Methodology | Minnesota Department of Commerce
Page 26
Avoided Plant O&M – Fixed
Economic value calculations for fixed plant O&M are presented in Table 9. The first year fixed value is
escalated at the O&M escalation rate for future years.
Similarly, PV capacity has an initial value of one during the first year because it is applicable to PV
systems installed in the first year. Note that effective capacity (load matching) is handled separately, and
this table represents the “ideal” resource, as if PV were able to receive the same capacity credit as a
fully dispatchable technology.
The utility cost is the fixed O&M cost times the PV capacity divided by the utility capacity. Utility prices
are the cost divided by the PV production. Costs are discounted using the utility discount factor and are
summed for all years.
The VOS component value is calculated as before such that the discounted total is equal to the
discounted utility cost.

Minnesota Value of Solar: Methodology | Minnesota Department of Commerce
Page 27
Table 9. (EXAMPLE) Economic value of avoided plant O&M – fixed
Prices Costs Disc. Costs
Year O&M Fixed
Utility Capacity
PV Capacity
Utility VOS p.u. PV Production
Utility VOS Discount Factor
Utility VOS
($/kW) (p.u.) (kW) ($/kWh) ($/kWh) (kWh) ($) ($) ($) ($)
2014 $5.00 1.000 1.000 $0.003 $0.003 1800 $5 $6 1.000 $5 $6
2015 $5.11 0.999 0.995 $0.003 $0.003 1791 $5 $6 0.926 $5 $6
2016 $5.21 0.998 0.990 $0.003 $0.003 1782 $5 $6 0.857 $4 $5
2017 $5.32 0.997 0.985 $0.003 $0.003 1773 $5 $6 0.794 $4 $5
2018 $5.43 0.996 0.980 $0.003 $0.003 1764 $5 $6 0.735 $4 $4
2019 $5.55 0.995 0.975 $0.003 $0.003 1755 $5 $6 0.681 $4 $4
2020 $5.66 0.994 0.970 $0.003 $0.003 1747 $6 $6 0.630 $3 $4
2021 $5.78 0.993 0.966 $0.003 $0.003 1738 $6 $6 0.583 $3 $3
2022 $5.91 0.992 0.961 $0.003 $0.003 1729 $6 $6 0.540 $3 $3
2023 $6.03 0.991 0.956 $0.003 $0.003 1721 $6 $6 0.500 $3 $3
2024 $6.16 0.990 0.951 $0.003 $0.003 1712 $6 $6 0.463 $3 $3
2025 $6.29 0.989 0.946 $0.004 $0.003 1703 $6 $6 0.429 $3 $2
2026 $6.42 0.988 0.942 $0.004 $0.003 1695 $6 $6 0.397 $2 $2
2027 $6.55 0.987 0.937 $0.004 $0.003 1686 $6 $6 0.368 $2 $2
2028 $6.69 0.986 0.932 $0.004 $0.003 1678 $6 $6 0.340 $2 $2
2029 $6.83 0.985 0.928 $0.004 $0.003 1670 $6 $6 0.315 $2 $2
2030 $6.97 0.984 0.923 $0.004 $0.003 1661 $7 $6 0.292 $2 $2
2031 $7.12 0.983 0.918 $0.004 $0.003 1653 $7 $6 0.270 $2 $1
2032 $7.27 0.982 0.914 $0.004 $0.003 1645 $7 $5 0.250 $2 $1
2033 $7.42 0.981 0.909 $0.004 $0.003 1636 $7 $5 0.232 $2 $1
2034 $7.58 0.980 0.905 $0.004 $0.003 1628 $7 $5 0.215 $2 $1
2035 $7.74 0.979 0.900 $0.004 $0.003 1620 $7 $5 0.199 $1 $1
2036 $7.90 0.978 0.896 $0.004 $0.003 1612 $7 $5 0.184 $1 $1
2037 $8.07 0.977 0.891 $0.005 $0.003 1604 $7 $5 0.170 $1 $1
2038 $8.24 0.976 0.887 $0.005 $0.003 1596 $7 $5 0.158 $1 $1
Validation: Present Value $67 $67
Minnesota Value of Solar: Methodology | Minnesota Department of Commerce
Page 28
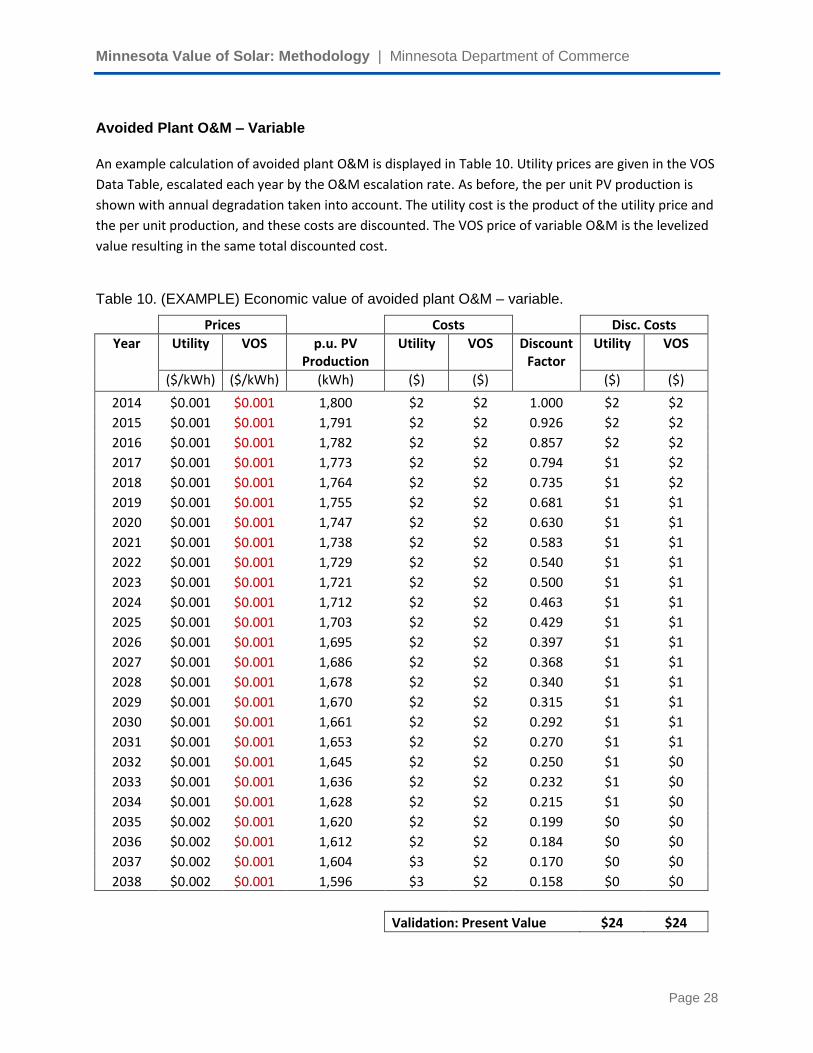
Avoided Plant O&M – Variable
An example calculation of avoided plant O&M is displayed in Table 10. Utility prices are given in the VOS
Data Table, escalated each year by the O&M escalation rate. As before, the per unit PV production is
shown with annual degradation taken into account. The utility cost is the product of the utility price and
the per unit production, and these costs are discounted. The VOS price of variable O&M is the levelized
value resulting in the same total discounted cost.
Table 10. (EXAMPLE) Economic value of avoided plant O&M – variable.
Prices Costs Disc. Costs
Year Utility VOS p.u. PV Production
Utility VOS Discount Factor
Utility VOS
($/kWh) ($/kWh) (kWh) ($) ($) ($) ($)
2014 $0.001 $0.001 1,800 $2 $2 1.000 $2 $2
2015 $0.001 $0.001 1,791 $2 $2 0.926 $2 $2
2016 $0.001 $0.001 1,782 $2 $2 0.857 $2 $2
2017 $0.001 $0.001 1,773 $2 $2 0.794 $1 $2
2018 $0.001 $0.001 1,764 $2 $2 0.735 $1 $2
2019 $0.001 $0.001 1,755 $2 $2 0.681 $1 $1
2020 $0.001 $0.001 1,747 $2 $2 0.630 $1 $1
2021 $0.001 $0.001 1,738 $2 $2 0.583 $1 $1
2022 $0.001 $0.001 1,729 $2 $2 0.540 $1 $1
2023 $0.001 $0.001 1,721 $2 $2 0.500 $1 $1
2024 $0.001 $0.001 1,712 $2 $2 0.463 $1 $1
2025 $0.001 $0.001 1,703 $2 $2 0.429 $1 $1
2026 $0.001 $0.001 1,695 $2 $2 0.397 $1 $1
2027 $0.001 $0.001 1,686 $2 $2 0.368 $1 $1
2028 $0.001 $0.001 1,678 $2 $2 0.340 $1 $1
2029 $0.001 $0.001 1,670 $2 $2 0.315 $1 $1
2030 $0.001 $0.001 1,661 $2 $2 0.292 $1 $1
2031 $0.001 $0.001 1,653 $2 $2 0.270 $1 $1
2032 $0.001 $0.001 1,645 $2 $2 0.250 $1 $0
2033 $0.001 $0.001 1,636 $2 $2 0.232 $1 $0
2034 $0.001 $0.001 1,628 $2 $2 0.215 $1 $0
2035 $0.002 $0.001 1,620 $2 $2 0.199 $0 $0
2036 $0.002 $0.001 1,612 $2 $2 0.184 $0 $0
2037 $0.002 $0.001 1,604 $3 $2 0.170 $0 $0
2038 $0.002 $0.001 1,596 $3 $2 0.158 $0 $0
Validation: Present Value $24 $24

Minnesota Value of Solar: Methodology | Minnesota Department of Commerce
Page 29
Avoided Generation Capacity Cost
The solar-weighted capacity cost is based on the installed capital cost of a peaking combustion turbine
and the installed capital cost of a combined cycle gas turbine, interpolated based on heat rate:
( 17 )
Where HeatRatePV is the solar-weighted heat rate calculated in equation ( 14 ).
Using equation ( 17 ) with the CT/CCGT heat rates and costs from the example VOS Data Table, we
calculated a solar-weighted capacity cost of $1,050 per kW. In the example, the amortized cost is $86
per kW-yr.
Table 11 illustrates how utility costs are calculated by taking into account the degrading heat rate of the
marginal unit and PV. For example, in year 2015, the utility cost is $86 per kW-yr x 0.999 / 0.995 to give
$85 for each unit of effective PV capacity. Utility prices are back-calculated for reference from the per
unit PV production. Again, the VOS price is selected to give the same total discounted cost as the utility
costs for the Generation Capacity Cost component.

Minnesota Value of Solar: Methodology | Minnesota Department of Commerce
Page 30
Table 11. (EXAMPLE) Economic value of avoided generation capacity cost.
Prices Costs Disc. Costs
Year Capacity Cost
Utility Capacity
PV Capacity
Utility VOS p.u. PV Production
Utility VOS Discount Factor
Utility VOS
($/kW-yr) (p.u.) (kW) ($/kWh) ($/kWh) (kWh) ($) ($) ($) ($)
2014 $86 1.000 1.000 $0.048 $0.048 1800 $86 $87 1.000 $86 $87
2015 $86 0.999 0.995 $0.048 $0.048 1791 $85 $86 0.926 $79 $80
2016 $86 0.998 0.990 $0.048 $0.048 1782 $85 $86 0.857 $73 $73
2017 $86 0.997 0.985 $0.048 $0.048 1773 $85 $85 0.794 $67 $68
2018 $86 0.996 0.980 $0.048 $0.048 1764 $84 $85 0.735 $62 $62
2019 $86 0.995 0.975 $0.048 $0.048 1755 $84 $84 0.681 $57 $57
2020 $86 0.994 0.970 $0.048 $0.048 1747 $84 $84 0.630 $53 $53
2021 $86 0.993 0.966 $0.048 $0.048 1738 $83 $84 0.583 $49 $49
2022 $86 0.992 0.961 $0.048 $0.048 1729 $83 $83 0.540 $45 $45
2023 $86 0.991 0.956 $0.048 $0.048 1721 $83 $83 0.500 $41 $41
2024 $86 0.990 0.951 $0.048 $0.048 1712 $82 $82 0.463 $38 $38
2025 $86 0.989 0.946 $0.048 $0.048 1703 $82 $82 0.429 $35 $35
2026 $86 0.988 0.942 $0.048 $0.048 1695 $82 $81 0.397 $32 $32
2027 $86 0.987 0.937 $0.048 $0.048 1686 $81 $81 0.368 $30 $30
2028 $86 0.986 0.932 $0.048 $0.048 1678 $81 $81 0.340 $28 $27
2029 $86 0.985 0.928 $0.048 $0.048 1670 $81 $80 0.315 $25 $25
2030 $86 0.984 0.923 $0.048 $0.048 1661 $80 $80 0.292 $23 $23
2031 $86 0.983 0.918 $0.049 $0.048 1653 $80 $79 0.270 $22 $21
2032 $86 0.982 0.914 $0.049 $0.048 1645 $80 $79 0.250 $20 $20
2033 $86 0.981 0.909 $0.049 $0.048 1636 $80 $79 0.232 $18 $18
2034 $86 0.980 0.905 $0.049 $0.048 1628 $79 $78 0.215 $17 $17
2035 $86 0.979 0.900 $0.049 $0.048 1620 $79 $78 0.199 $16 $15 2036 $86 0.978 0.896 $0.049 $0.048 1612 $79 $77 0.184 $14 $14 2037 $86 0.977 0.891 $0.049 $0.048 1604 $78 $77 0.170 $13 $13 2038 $86 0.976 0.887 $0.049 $0.048 1596 $78 $77 0.158 $12 $12
Validation: Present Value $958 $958

Minnesota Value of Solar: Methodology | Minnesota Department of Commerce
Page 31
Avoided Reserve Capacity Cost
An example of the calculation of avoided reserve capacity cost is shown in Table 12. This is identical to
the generation capacity cost calculation, except utility costs are multiplied by the reserve capacity
margin. In the example, the reserve capacity margin is 15%, so the utility cost for 2014 is calculated as
$86 per unit effective capacity x 15% = $13. The rest of the calculation is identical to the capacity cost
calculation.
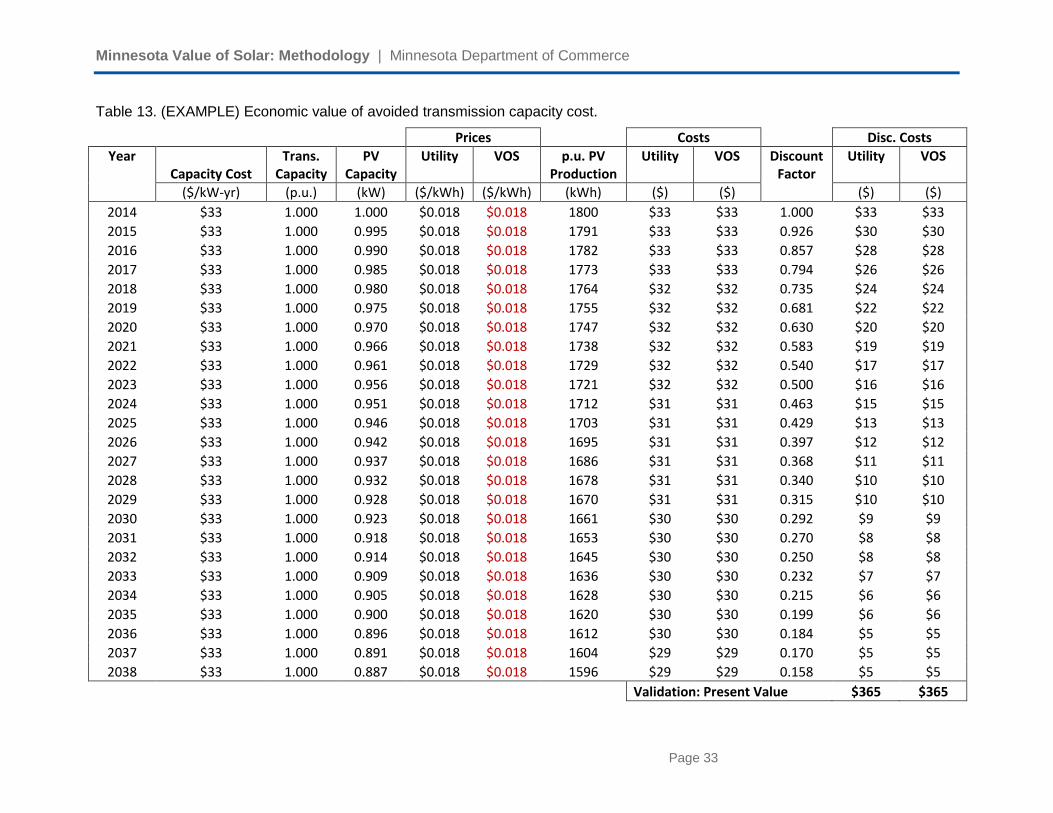
Avoided Transmission Capacity Cost
Avoided transmission costs are calculated the same way as avoided generation costs except in two
ways. First, transmission capacity is assumed not to degrade over time (PV degradation is still accounted
for). Second, avoided transmission capacity costs are calculated based on the utility’s 5-year average
MISO OATT Schedule 9 charge in Start Year USD, e.g., in 2014 USD if year one of the VOS tariff was
2014. Table 13 shows the example calculation.

Minnesota Value of Solar: Methodology | Minnesota Department of Commerce
Page 32
Table 12. (EXAMPLE) Economic value of avoided reserve capacity cost.
Prices Costs Disc. Costs
Year Capacity Cost
Gen. Capacity
PV Capacity
Utility VOS p.u. PV Production
Utility VOS Discount Factor
Utility VOS
($/kW-yr) (p.u.) (kW) ($/kWh) ($/kWh) (kWh) ($) ($) ($) ($)
2014 $86 1.000 1.000 $0.007 $0.007 1800 $13 $13 1.000 $13 $13 2015 $86 0.999 0.999 $0.007 $0.007 1791 $13 $13 0.926 $12 $12 2016 $86 0.998 0.994 $0.007 $0.007 1782 $13 $13 0.857 $11 $11 2017 $86 0.997 0.986 $0.007 $0.007 1773 $13 $13 0.794 $10 $10 2018 $86 0.996 0.971 $0.007 $0.007 1764 $13 $13 0.735 $9 $9 2019 $86 0.995 0.951 $0.007 $0.007 1755 $13 $13 0.681 $9 $9 2020 $86 0.994 0.927 $0.007 $0.007 1747 $13 $13 0.630 $8 $8 2021 $86 0.993 0.899 $0.007 $0.007 1738 $13 $13 0.583 $7 $7 2022 $86 0.992 0.872 $0.007 $0.007 1729 $12 $12 0.540 $7 $7 2023 $86 0.991 0.842 $0.007 $0.007 1721 $12 $12 0.500 $6 $6 2024 $86 0.990 0.809 $0.007 $0.007 1712 $12 $12 0.463 $6 $6 2025 $86 0.989 0.786 $0.007 $0.007 1703 $12 $12 0.429 $5 $5 2026 $86 0.988 0.762 $0.007 $0.007 1695 $12 $12 0.397 $5 $5 2027 $86 0.987 0.737 $0.007 $0.007 1686 $12 $12 0.368 $4 $4 2028 $86 0.986 0.713 $0.007 $0.007 1678 $12 $12 0.340 $4 $4 2029 $86 0.985 0.688 $0.007 $0.007 1670 $12 $12 0.315 $4 $4 2030 $86 0.984 0.663 $0.007 $0.007 1661 $12 $12 0.292 $4 $3 2031 $86 0.983 0.637 $0.007 $0.007 1653 $12 $12 0.270 $3 $3 2032 $86 0.982 0.612 $0.007 $0.007 1645 $12 $12 0.250 $3 $3 2033 $86 0.981 0.587 $0.007 $0.007 1636 $12 $12 0.232 $3 $3 2034 $86 0.980 0.563 $0.007 $0.007 1628 $12 $12 0.215 $3 $3 2035 $86 0.979 0.543 $0.007 $0.007 1620 $12 $12 0.199 $2 $2 2036 $86 0.978 0.523 $0.007 $0.007 1612 $12 $12 0.184 $2 $2 2037 $86 0.977 0.504 $0.007 $0.007 1604 $12 $12 0.170 $2 $2 2038 $86 0.976 0.485 $0.007 $0.007 1596 $12 $12 0.158 $2 $2
Validation: Present Value $144 $144
Minnesota Value of Solar: Methodology | Minnesota Department of Commerce
Page 33
Table 13. (EXAMPLE) Economic value of avoided transmission capacity cost.
Prices Costs Disc. Costs
Year Capacity Cost
Trans. Capacity
PV Capacity
Utility VOS p.u. PV Production
Utility VOS Discount Factor
Utility VOS
($/kW-yr) (p.u.) (kW) ($/kWh) ($/kWh) (kWh) ($) ($) ($) ($)
2014 $33 1.000 1.000 $0.018 $0.018 1800 $33 $33 1.000 $33 $33
2015 $33 1.000 0.995 $0.018 $0.018 1791 $33 $33 0.926 $30 $30
2016 $33 1.000 0.990 $0.018 $0.018 1782 $33 $33 0.857 $28 $28
2017 $33 1.000 0.985 $0.018 $0.018 1773 $33 $33 0.794 $26 $26
2018 $33 1.000 0.980 $0.018 $0.018 1764 $32 $32 0.735 $24 $24
2019 $33 1.000 0.975 $0.018 $0.018 1755 $32 $32 0.681 $22 $22
2020 $33 1.000 0.970 $0.018 $0.018 1747 $32 $32 0.630 $20 $20
2021 $33 1.000 0.966 $0.018 $0.018 1738 $32 $32 0.583 $19 $19
2022 $33 1.000 0.961 $0.018 $0.018 1729 $32 $32 0.540 $17 $17
2023 $33 1.000 0.956 $0.018 $0.018 1721 $32 $32 0.500 $16 $16
2024 $33 1.000 0.951 $0.018 $0.018 1712 $31 $31 0.463 $15 $15
2025 $33 1.000 0.946 $0.018 $0.018 1703 $31 $31 0.429 $13 $13
2026 $33 1.000 0.942 $0.018 $0.018 1695 $31 $31 0.397 $12 $12
2027 $33 1.000 0.937 $0.018 $0.018 1686 $31 $31 0.368 $11 $11
2028 $33 1.000 0.932 $0.018 $0.018 1678 $31 $31 0.340 $10 $10
2029 $33 1.000 0.928 $0.018 $0.018 1670 $31 $31 0.315 $10 $10
2030 $33 1.000 0.923 $0.018 $0.018 1661 $30 $30 0.292 $9 $9
2031 $33 1.000 0.918 $0.018 $0.018 1653 $30 $30 0.270 $8 $8
2032 $33 1.000 0.914 $0.018 $0.018 1645 $30 $30 0.250 $8 $8
2033 $33 1.000 0.909 $0.018 $0.018 1636 $30 $30 0.232 $7 $7
2034 $33 1.000 0.905 $0.018 $0.018 1628 $30 $30 0.215 $6 $6
2035 $33 1.000 0.900 $0.018 $0.018 1620 $30 $30 0.199 $6 $6
2036 $33 1.000 0.896 $0.018 $0.018 1612 $30 $30 0.184 $5 $5
2037 $33 1.000 0.891 $0.018 $0.018 1604 $29 $29 0.170 $5 $5
2038 $33 1.000 0.887 $0.018 $0.018 1596 $29 $29 0.158 $5 $5
Validation: Present Value $365 $365

Minnesota Value of Solar: Methodology | Minnesota Department of Commerce
Page 34
Avoided Distribution Capacity Cost
Avoided distribution capacity costs may be calculated in either of two ways:
System-wide Avoided Costs. These are calculated using utility-wide costs and lead to a VOS rate
that is “averaged” and applicable to all solar customers. This method is described below in the
methodology.
Location-specific Avoided Costs. These are calculated using location-specific costs, growth rates,
etc., and lead to location-specific VOS rates. This method provides the utility with a means for
offering a higher-value VOS rate in areas where capacity is most needed (areas of highest value).
The details of this method are site specific and not included in the methodology, however they
are to be implemented in accordance with the requirements set for the below.
System-wide Avoided Costs
System wide costs are determined using actual data from each of the last 10 years and peak growth
rates are based on the utility’s estimated future growth over the next 15 years. The costs and growth
rate must be taken over the same time period because the historical investments must be tied to the
growth associated with those investments.
All costs for each year for FERC accounts 360, 361, 362, 365, 366, and 367 should be included. These
costs, however, should be adjusted to consider only capacity-related amounts. As such, the capacity-
related percentages shown in Table 14 will be utility specific.

Minnesota Value of Solar: Methodology | Minnesota Department of Commerce
Page 35
Table 14. (EXAMPLE) Determination of deferrable costs.
Account Account Name Additions ($)
[A] Retirements ($)
[R] Net Additions ($)
= [A] - [R] Capacity Related?
Deferrable ($)
DISTRIBUTION PLANT 360 Land and Land Rights 13,931,928 233,588 13,698,340 100% 13,698,340
361 Structures and Improvements 35,910,551 279,744 35,630,807 100% 35,630,807
362 Station Equipment 478,389,052 20,808,913 457,580,139 100% 457,580,139
363 Storage Battery Equipment 364 Poles, Towers, and Fixtures 310,476,864 9,489,470 300,987,394
365 Overhead Conductors and Devices 349,818,997 22,090,380 327,728,617 25% 81,932,154
366 Underground Conduit 210,115,953 10,512,018 199,603,935 25% 49,900,984
367 Underground Conductors and Devices 902,527,963 32,232,966 870,294,997 25% 217,573,749
368 Line Transformers 389,984,149 19,941,075 370,043,074 369 Services 267,451,206 5,014,559 262,436,647 370 Meters 118,461,196 4,371,827 114,089,369 371 Installations on Customer Premises 22,705,193
22,705,193
372 Leased Property on Customer Premises
373 Street Lighting and Signal Systems 53,413,993 3,022,447 50,391,546
374 Asset Retirement Costs for Distribution Plant 15,474,098 2,432,400 13,041,698
TOTAL 3,168,661,143 130,429,387 3,038,231,756 $856,316,173

Minnesota Value of Solar: Methodology | Minnesota Department of Commerce
Page 36
Cost per unit growth ($ per kW) is calculated by taking all of the total deferrable cost for each year,
adjusting for inflation, and dividing by the kW increase in peak annual load over the 10 years.
Future growth in peak load is based on the utility’s estimated future growth over the next 15 years. It is
calculated using the ratio of peak loads of the fifteenth year (year 15) and the peak load from the first
year (year 1):
( 18 )
( )
If the resulting growth rate is zero or negative (before adding solar PV), set the avoided distribution
capacity to zero.
A sample economic value calculation is presented in Table 15. The distribution cost for the first year
($200 per kW in the example) is taken from the analysis of historical cost and estimated growth as
described above. This cost is escalated each year using the rate in the VOS Data Table.
For each future year, the amount of new distribution capacity is calculated based on the growth rate,
and this is multiplied by the cost per kW to get the cost for the year. The total discounted cost is
calculated ($149M) and amortized over the 25 years.
PV is assumed to be installed in sufficient capacity to allow this investment stream to be deferred for
one year. The total discounted cost of the deferred time series is calculated ($140M) and amortized.
Utility costs are calculated using the difference between the amortized costs of the conventional plan
and the amortized cost of the deferred plan. For example, the utility cost for 2022 is ($14M -
$13M)/54MW x 1000 W/kW = $14 per effective kW of PV. As before, utility prices are back-calculated
using PV production, and the VOS component rate is calculated such that the total discounted amount
equals the discounted utility cost.
Location-specific Avoided Costs
As an alternative to system-wide costs for distribution, location-specific costs may be used. When
calculating location-specific costs, the calculation should follow the same method of the system-wide
avoided cost method, but use local technical and cost data. The calculation should satisfy the following
requirements:
The distribution cost VOS should be calculated for each distribution planning area, defined as
the minimum area in which capacity needs cannot be met by transferring loads internally from
one circuit to another.
Distribution loads (the sum of all relevant feeders), peak load growth rates and capital costs
should be based on the distribution planning area.

Minnesota Value of Solar: Methodology | Minnesota Department of Commerce
Page 37
Local Fleet Production Shapes may be used, if desired. Alternatively, the system-level Fleet
Production Shape may be used.
Anticipated capital costs should be evaluated based on capacity related investments only (as
above) using budgetary engineering cost estimates. All anticipated capital investments in the
planning area should be included. Planned capital investments should be assumed to meet
capacity requirements for the number of years defined by the amount of new capacity added (in
MW) divided by the local growth rate (MW per year). Beyond this time period, which is beyond
the planning horizon, new capacity investments should be assumed each year using the system-
wide method.
Planning areas for which engineering cost estimates are not available may be combined, and the
VOS calculated using the system-wide method.
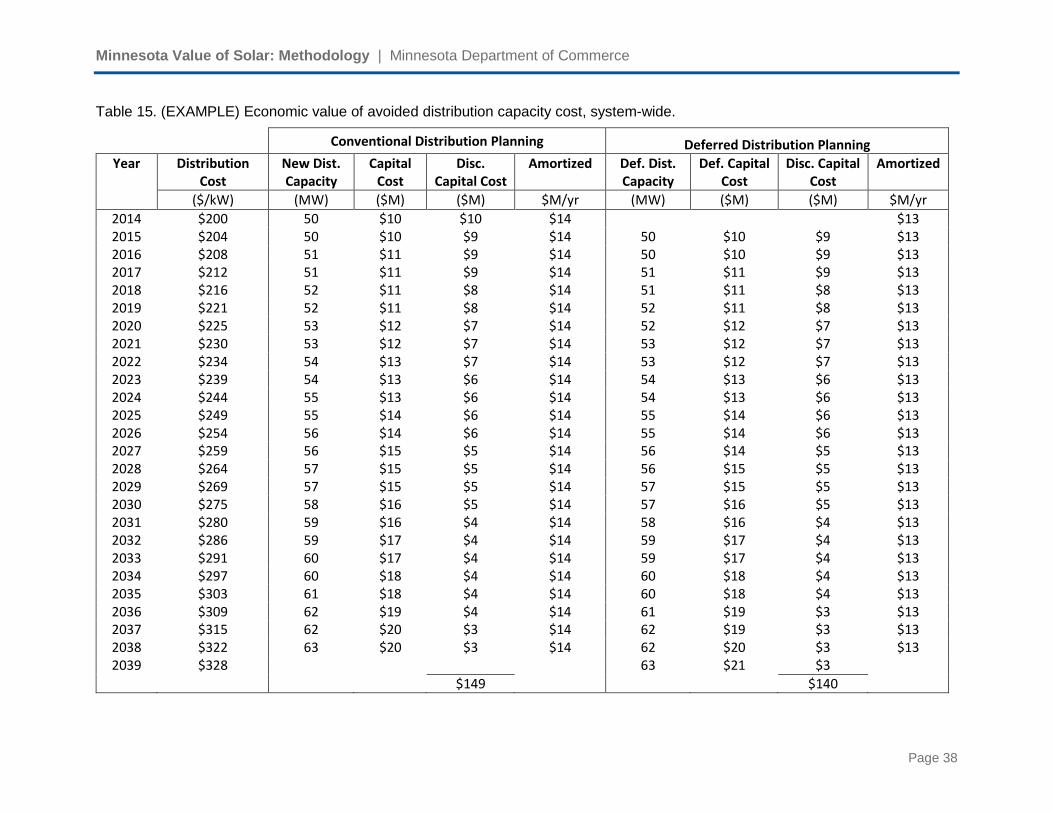
Minnesota Value of Solar: Methodology | Minnesota Department of Commerce
Page 38
Table 15. (EXAMPLE) Economic value of avoided distribution capacity cost, system-wide.
Conventional Distribution Planning Deferred Distribution Planning
Year Distribution Cost
New Dist. Capacity
Capital Cost
Disc. Capital Cost
Amortized Def. Dist. Capacity
Def. Capital Cost
Disc. Capital Cost
Amortized
($/kW) (MW) ($M) ($M) $M/yr (MW) ($M) ($M) $M/yr
2014 $200 50 $10 $10 $14 $13 2015 $204 50 $10 $9 $14 50 $10 $9 $13 2016 $208 51 $11 $9 $14 50 $10 $9 $13 2017 $212 51 $11 $9 $14 51 $11 $9 $13 2018 $216 52 $11 $8 $14 51 $11 $8 $13 2019 $221 52 $11 $8 $14 52 $11 $8 $13 2020 $225 53 $12 $7 $14 52 $12 $7 $13 2021 $230 53 $12 $7 $14 53 $12 $7 $13 2022 $234 54 $13 $7 $14 53 $12 $7 $13 2023 $239 54 $13 $6 $14 54 $13 $6 $13 2024 $244 55 $13 $6 $14 54 $13 $6 $13 2025 $249 55 $14 $6 $14 55 $14 $6 $13 2026 $254 56 $14 $6 $14 55 $14 $6 $13 2027 $259 56 $15 $5 $14 56 $14 $5 $13 2028 $264 57 $15 $5 $14 56 $15 $5 $13 2029 $269 57 $15 $5 $14 57 $15 $5 $13 2030 $275 58 $16 $5 $14 57 $16 $5 $13 2031 $280 59 $16 $4 $14 58 $16 $4 $13 2032 $286 59 $17 $4 $14 59 $17 $4 $13 2033 $291 60 $17 $4 $14 59 $17 $4 $13 2034 $297 60 $18 $4 $14 60 $18 $4 $13 2035 $303 61 $18 $4 $14 60 $18 $4 $13 2036 $309 62 $19 $4 $14 61 $19 $3 $13 2037 $315 62 $20 $3 $14 62 $19 $3 $13 2038 $322 63 $20 $3 $14 62 $20 $3 $13 2039 $328 63 $21 $3
$149 $140

Minnesota Value of Solar: Methodology | Minnesota Department of Commerce
Page 39
CONTINUED Table 15. (EXAMPLE) Economic value of avoided distribution capacity cost, system-wide.
Costs Disc. Costs Prices
Year p.u. PV Production
Utility VOS Discount Factor
Utility VOS Utility VOS
(kWh) ($) ($) ($) ($) ($/kWh) ($/kWh)
2014 1800 $16 $15 1.000 $16 $15 $0.009 $0.008 2015 1791 $15 $15 0.926 $14 $14 $0.009 $0.008 2016 1782 $15 $15 0.857 $13 $13 $0.009 $0.008 2017 1773 $15 $15 0.794 $12 $12 $0.009 $0.008 2018 1764 $15 $15 0.735 $11 $11 $0.009 $0.008 2019 1755 $15 $15 0.681 $10 $10 $0.008 $0.008 2020 1747 $15 $15 0.630 $9 $9 $0.008 $0.008 2021 1738 $15 $15 0.583 $9 $8 $0.008 $0.008 2022 1729 $14 $14 0.540 $8 $8 $0.008 $0.008 2023 1721 $14 $14 0.500 $7 $7 $0.008 $0.008 2024 1712 $14 $14 0.463 $7 $7 $0.008 $0.008 2025 1703 $14 $14 0.429 $6 $6 $0.008 $0.008 2026 1695 $14 $14 0.397 $6 $6 $0.008 $0.008 2027 1686 $14 $14 0.368 $5 $5 $0.008 $0.008 2028 1678 $14 $14 0.340 $5 $5 $0.008 $0.008 2029 1670 $13 $14 0.315 $4 $4 $0.008 $0.008 2030 1661 $13 $14 0.292 $4 $4 $0.008 $0.008 2031 1653 $13 $14 0.270 $4 $4 $0.008 $0.008 2032 1645 $13 $14 0.250 $3 $3 $0.008 $0.008 2033 1636 $13 $14 0.232 $3 $3 $0.008 $0.008 2034 1628 $13 $14 0.215 $3 $3 $0.008 $0.008 2035 1620 $13 $14 0.199 $3 $3 $0.008 $0.008 2036 1612 $13 $13 0.184 $2 $2 $0.008 $0.008 2037 1604 $12 $13 0.170 $2 $2 $0.008 $0.008 2038 1596 $12 $13 0.158 $2 $2 $0.008 $0.008 2039
Validation: Present Value $166 $166

Minnesota Value of Solar: Methodology | Minnesota Department of Commerce
Page 40
Avoided Environmental Cost
Environmental costs are included as a required component and are based on existing Minnesota and
federal externality costs. CO2 and non-CO2 natural gas emissions factors (lb per MM BTU of natural gas)
are from the EPA17and NaturalGas.org.18 Avoided environmental costs are based on the federal social
cost of CO2 emissions19 plus the Minnesota PUC-established externality costs for non-CO2 emissions.20
The externality cost of CO2 emissions shown in Table 4 are calculated as follows. The Social Cost of
Carbon (CO2) values for each year through 2050 are published in 2007 dollars per metric ton.21 These
costs are adjusted for inflation (converted to current dollars), converted to dollars per short ton, and
then converted to cost per unit fuel consumption using the assumed values in Table 16.
For example, the CO2 externality cost for 2020 (3.0% discount rate, average) is $43 per metric ton of CO2
emissions in 2007 dollars. This is converted to current dollars by multiplying by a CPI adjustment factor;
for 2014, the CPI adjustment factor is of 1.13.22 The resulting CO2 costs per metric ton in current dollars
are then converted to dollars per short ton by dividing by 1.102. Finally, the costs are escalated using the
general escalation rate of 2.75% per year to give $54.76 per ton. The $54.76 per ton of CO2 is then
divided by 2000 pounds per ton and multiplied by 117.0 pounds of CO2 per MMBtu = $3.204 per MMBtu
in 2020 dollars.
Table 16. Natural Gas Emissions.
NG Emissions (lb/MMBtu)
PM10 0.007
CO 0.04
NOX 0.092
Pb 0.00
CO2 117.0
17
http://www.epa.gov/climatechange/ghgemissions/ind-assumptions.html and http://www.epa.gov/ttnchie1/ap42/ 18
http://www.naturalgas.org/environment/naturalgas.asp 19
See http://www.epa.gov/climatechange/EPAactivities/economics/scc.html, technical support document appendix, May 2013. 20
“Notice of Updated Environmental Externality Values,” issued June 5, 2013, PUC docket numbers E-999/CI-93-583 and E-999/CI-00-1636. 21
The annual Social Cost of Carbon values are listed in table A1 of the Social Cost of Carbon Technical Support Document. The Technical Support Document can be found at: http://www.whitehouse.gov/sites/default/files/omb/assets/inforeg/technical-update-social-cost-of-carbon-for-regulator-impact-analysis.pdf. 22
The CPI adjustment factor can be calculated through the Bureau of Labor Statistics CPI inflation calculator. The calculator can be found at: http://data.bls.gov/cgi-bin/cpicalc.pl.

Minnesota Value of Solar: Methodology | Minnesota Department of Commerce
Page 41
Pollutants other than CO2 are calculated using the Minnesota externality costs using the following
method. Externality costs are calculated as the midpoint of the low and high values for the urban
scenario, adjusted to current dollars, and converted to a fuel-based value using Table 16. Each utility
may select the set of non-CO2 externality values that is most appropriate for their service territory (e.g.
urban or metropolitan fringe or rural).
For the example, MN PUC’s published 2012 urban externality values for PM10 are $6,291 per ton (low
case) and $9,056 per ton (high case). These are averaged to be ($6291+$9056)/2 = $7674 per ton of
PM10 emissions. For 2020, these are escalated using the general escalation rate of 2.75% per year to
$9,533 per ton. The $9,533 per ton of PM10 is then divided by 2000 pounds per ton and multiplied by
0.007 pounds of PM10 per MMBtu to arrive at a PM10 externality cost of $0.033 per MMBtu. Similar
calculations are done for the other pollutants.
In the example shown in Table 17, the environmental cost is the sum of the costs of all pollutants. For
example, in 2020, the total cost of $3.287 per MMBtu corresponds to the 2020 total cost in Table 4. This
cost is multiplied by the heat rate for the year (see Avoided Fuel Cost calculation) and divided by 106 (to
convert Btus to MMBtus), which results in the environmental cost in dollars per kWh for each year. The
remainder of the calculation follows the same method as the avoided variable O&M costs but using the
environmental discount factor (see Discount Factors for a description of the environmental discount
factor and its calculation).
Avoided Voltage Control Cost
This is reserved for future updates to the methodology.
Solar Integration Cost
This is reserved for future updates to the methodology.

Minnesota Value of Solar: Methodology | Minnesota Department of Commerce
Page 42
Table 17. (EXAMPLE) Economic value of avoided environmental cost.
Prices Costs Disc. Costs
Year Env. Cost Heat Rate Utility VOS p.u. PV Production
Utility VOS Discount Factor
Utility VOS
($/MMBtu) (Btu/kWh) ($/kWh) ($/kWh) (kWh) ($) ($) ($) ($)
2014 2.022 8000 $0.016 $0.027 1,800 $29 $48 1.000 $29 $48
2015 2.131 8008 $0.017 $0.027 1,791 $31 $48 0.945 $29 $45
2016 2.245 8016 $0.018 $0.027 1,782 $32 $47 0.893 $29 $42
2017 2.363 8024 $0.019 $0.027 1,773 $34 $47 0.844 $28 $40
2018 2.487 8032 $0.020 $0.027 1,764 $35 $47 0.797 $28 $37
2019 2.615 8040 $0.021 $0.027 1,755 $37 $47 0.753 $28 $35
2020 2.749 8048 $0.022 $0.027 1,747 $39 $46 0.712 $28 $33
2021 2.888 8056 $0.023 $0.027 1,738 $40 $46 0.673 $27 $31
2022 3.032 8064 $0.024 $0.027 1,729 $42 $46 0.636 $27 $29
2023 3.182 8072 $0.026 $0.027 1,721 $44 $46 0.601 $27 $27
2024 3.338 8080 $0.027 $0.027 1,712 $46 $46 0.567 $26 $26
2025 3.501 8088 $0.028 $0.027 1,703 $48 $45 0.536 $26 $24
2026 3.669 8097 $0.030 $0.027 1,695 $50 $45 0.507 $26 $23
2027 3.770 8105 $0.031 $0.027 1,686 $52 $45 0.479 $25 $21
2028 3.950 8113 $0.032 $0.027 1,678 $54 $45 0.452 $24 $20
2029 4.138 8121 $0.034 $0.027 1,670 $56 $44 0.427 $24 $19
2030 4.332 8129 $0.035 $0.027 1,661 $59 $44 0.404 $24 $18
2031 4.534 8137 $0.037 $0.027 1,653 $61 $44 0.382 $23 $17
2032 4.744 8145 $0.039 $0.027 1,645 $64 $44 0.361 $23 $16
2033 4.962 8153 $0.040 $0.027 1,636 $66 $44 0.341 $23 $15
2034 5.189 8162 $0.042 $0.027 1,628 $69 $43 0.322 $22 $14
2035 5.424 8170 $0.044 $0.027 1,620 $72 $43 0.304 $22 $13
2036 5.668 8178 $0.046 $0.027 1,612 $75 $43 0.287 $21 $12
2037 5.922 8186 $0.048 $0.027 1,604 $78 $43 0.272 $21 $12
2038 6.185 8194 $0.051 $0.027 1,596 $81 $42 0.257 $21 $11
Validation: Present Value $629 $629

Minnesota Value of Solar: Methodology | Minnesota Department of Commerce
Page 43
VOS Example Calculation
The gross economic value, load match, distributed loss savings factor, and distributed PV value are
combined in the required VOS Levelized Calculation Chart. An example is presented in Figure 2 using the
assumptions made for the example calculation. Actual VOS results will differ from those shown in the
example, but utilities will include in their application a VOS Levelized Calculation Chart in the same
format. For completeness, Figure 3 (not required of the utilities) is presented showing graphically the
relative importance of the components in the example.
Figure 3. (EXAMPLE) VOS Levelized Calculation Chart (Required).
Having calculated the levelized VOS credit, an inflation-adjusted VOS can then be found. An EXAMPLE
inflation-adjusted VOS is provided in Figure 5 by using the general escalation rate as the annual inflation
rate for all years of the analysis period. Both the inflation-adjusted VOS and the levelized VOS in Figure
5 represent the same long-term value. The methodology requires that the inflation-adjusted (real) VOS
be used and updated annually to account for the current year’s inflation rate.
To calculate the inflation-adjusted VOS for the first year, the products of the levelized VOS, PV
production and the discount factor are summed for each year of the analysis period and then divided by
the sum of the products of the escalation factor, PV production, and the discount factor for each year of
the analysis period, as shown below in Equation ( 17).
25 Year Levelized ValueEconomic
Value
Load Match
(No Losses)
Distributed
Loss Savings
Distributed
PV Value
($/kWh) (%) (%) ($/kWh)
Avoided Fuel Cost $0.056 8% $0.061
Avoided Plant O&M - Fixed $0.003 40% 9% $0.001
Avoided Plant O&M - Variable $0.001 8% $0.001
Avoided Gen Capacity Cost $0.048 40% 9% $0.021
Avoided Reserve Capacity Cost $0.007 40% 9% $0.003
Avoided Trans. Capacity Cost $0.018 40% 9% $0.008
Avoided Dist. Capacity Cost $0.008 30% 5% $0.003
Avoided Environmental Cost $0.027 8% $0.029
Avoided Voltage Control Cost
Solar Integration Cost
$0.127
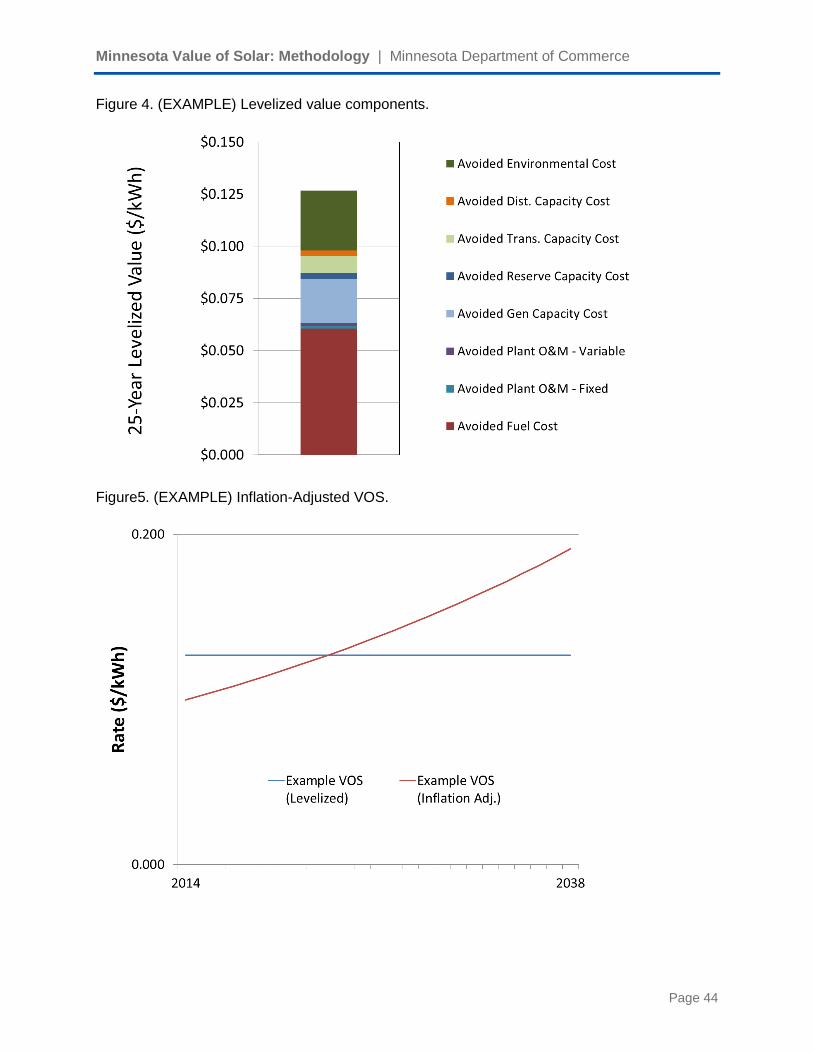
Minnesota Value of Solar: Methodology | Minnesota Department of Commerce
Page 44
Figure 4. (EXAMPLE) Levelized value components.
Figure5. (EXAMPLE) Inflation-Adjusted VOS.

Minnesota Value of Solar: Methodology | Minnesota Department of Commerce
Page 45
( ) ( 19 )
∑
∑
Once the first-year inflation-adjusted VOS is calculated, the value will then be updated on an annual
basis in accordance with the observed inflation-rate. Table 18 provides the calculation of the EXAMPLE
inflation-adjusted VOS shown in Figure 5. In this EXAMPLE, the inflation rate in future years is set equal
to the general escalation rate of 2.75%.
Table 18. (EXAMPLE) Calculation of inflation-adjusted VOS.
Year Discount
Factor Escalation
Factor
Example VOS
(Levelized) Disc.
Example VOS
(Inflation Adj.) Disc.
2014 1.000 1.000 0.127 0.127 0.100 0.100 2015 0.926 1.027 0.127 0.117 0.102 0.095 2016 0.857 1.056 0.127 0.109 0.105 0.090 2017 0.794 1.085 0.127 0.101 0.108 0.086 2018 0.735 1.115 0.127 0.093 0.111 0.082 2019 0.681 1.145 0.127 0.086 0.114 0.078 2020 0.630 1.177 0.127 0.080 0.117 0.074 2021 0.583 1.209 0.127 0.074 0.121 0.070 2022 0.540 1.242 0.127 0.068 0.124 0.067 2023 0.500 1.276 0.127 0.063 0.127 0.064 2024 0.463 1.311 0.127 0.059 0.131 0.061 2025 0.429 1.347 0.127 0.054 0.134 0.058 2026 0.397 1.384 0.127 0.050 0.138 0.055 2027 0.368 1.422 0.127 0.047 0.142 0.052 2028 0.340 1.462 0.127 0.043 0.146 0.050 2029 0.315 1.502 0.127 0.040 0.150 0.047 2030 0.292 1.543 0.127 0.037 0.154 0.045 2031 0.270 1.585 0.127 0.034 0.158 0.043 2032 0.250 1.629 0.127 0.032 0.162 0.041 2033 0.232 1.674 0.127 0.029 0.167 0.039 2034 0.215 1.720 0.127 0.027 0.172 0.037 2035 0.199 1.767 0.127 0.025 0.176 0.035 2036 0.184 1.815 0.127 0.023 0.181 0.033 2037 0.170 1.865 0.127 0.022 0.186 0.032 2038 0.158 1.917 0.127 0.020 0.191 0.030
1.461 1.461

Minnesota Value of Solar: Methodology | Minnesota Department of Commerce
Page 46
Glossary
Table 19. Input data definitions
Input Data Used in Methodology Section Definition
Annual Energy PV Energy Production The annual PV production (kWh per year) per Marginal PV Resource (initially 1 kW-AC) in the first year (before any PV degradation) of the marginal PV resource. This is calculated in the Annual Energy section of PV Energy Production and used in the Equipment Degradation section.
Capacity-related distribution capital cost
Avoided Distribution Capacity Cost This is described more fully in the Avoided Distribution Capacity Cost section.
Capacity-related transmission capital cost
Avoided Transmission Capacity Cost The cost per kW of new construction of transmission, including lines, towers, insulators, transmission substations, etc. Only capacity-related costs should be included.
Discount rate (WACC) Multiple The utility’s weighted average cost of capital, including interest on bonds and shareholder return.
Distribution capital cost escalation Avoided Distribution Capacity Cost Used to calculate future distribution costs.
ELCC (no loss), PLR (no loss) Load Match Factors The “Effective Load Carrying Capability” and the “Peak Load Reduction” of a PV resource expressed as percentages of rated capacity (kW-AC). These are described more fully in the Load Match section.
Environmental Costs Avoided Environmental Cost The costs required to calculate environmental impacts of conventional generation. These are described more fully in the Avoided Environmental Cost section

Minnesota Value of Solar: Methodology | Minnesota Department of Commerce
Page 47
Input Data Used in Methodology Section Definition
Environmental Discount Rate Avoided Environmental Cost The societal discount rate used to calculate the present value of future environmental costs.
Fuel Price Overhead Avoided Fuel Cost The difference in cost of fuel as delivered to the plant and the cost of fuel as available in market prices. This cost reflects transmission, delivery, and taxes.
General escalation rate Avoided Environmental Cost, Example Results
The annual escalation rate corresponding to the most recent 25 years of CPI index data23, used to convert constant dollar environmental costs into current dollars and to translate levelized VOS into inflation-adjusted VOS.
Generation Capacity Degradation Avoided Generation Capacity Cost The percentage decrease in the generation capacity per year
Generation Life Avoided Generation Capacity Cost The assumed service life of new generation assets.
Guaranteed NG Fuel Prices Avoided Fuel Cost The annual average prices to be used when the utility elects to use the Futures Market option. These are not applicable when the utility elects to use options other than the Futures Market option. They are calculated as the annual average of monthly NYMEX NG futures24.
Heat rate degradation Avoided Generation Capacity Cost The percentage increase in the heat rate (BTU per kWh) per year
23 www.bls.gov.
24 See for example http://futures.tradingcharts.com/marketquotes/NG.html.
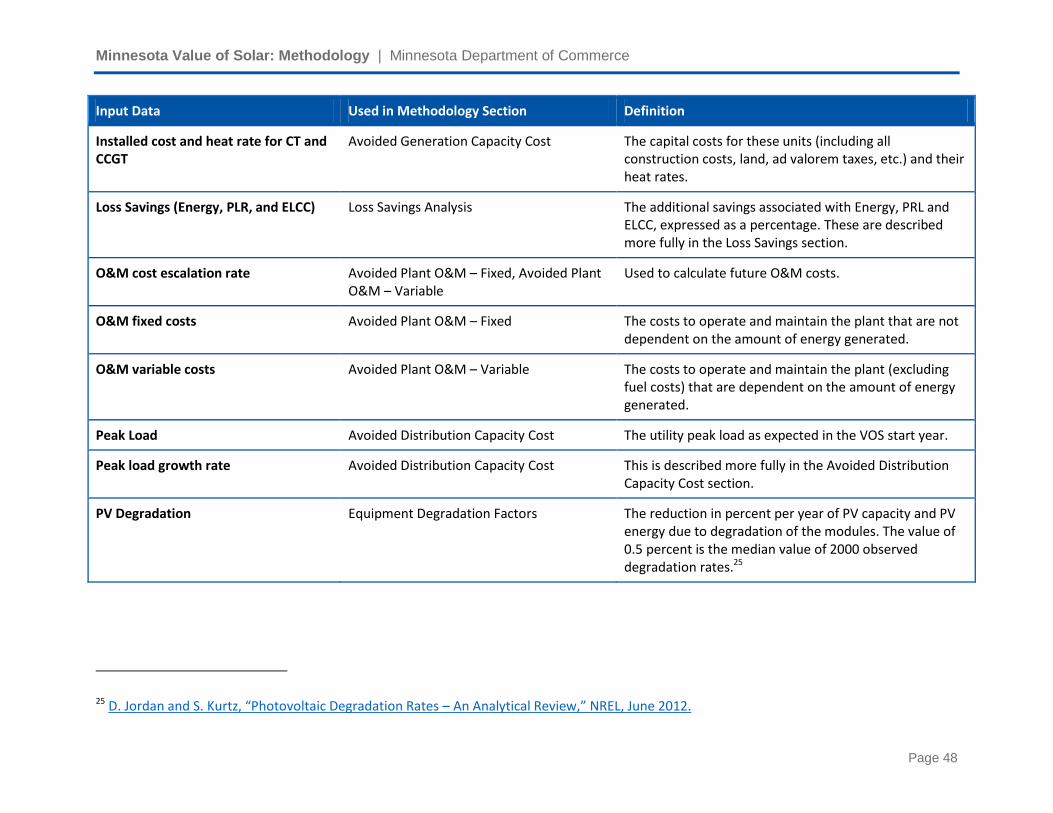
Minnesota Value of Solar: Methodology | Minnesota Department of Commerce
Page 48
Input Data Used in Methodology Section Definition
Installed cost and heat rate for CT and CCGT
Avoided Generation Capacity Cost The capital costs for these units (including all construction costs, land, ad valorem taxes, etc.) and their heat rates.
Loss Savings (Energy, PLR, and ELCC) Loss Savings Analysis The additional savings associated with Energy, PRL and ELCC, expressed as a percentage. These are described more fully in the Loss Savings section.
O&M cost escalation rate Avoided Plant O&M – Fixed, Avoided Plant O&M – Variable
Used to calculate future O&M costs.
O&M fixed costs Avoided Plant O&M – Fixed The costs to operate and maintain the plant that are not dependent on the amount of energy generated.
O&M variable costs Avoided Plant O&M – Variable The costs to operate and maintain the plant (excluding fuel costs) that are dependent on the amount of energy generated.
Peak Load Avoided Distribution Capacity Cost The utility peak load as expected in the VOS start year.
Peak load growth rate Avoided Distribution Capacity Cost This is described more fully in the Avoided Distribution Capacity Cost section.
PV Degradation Equipment Degradation Factors The reduction in percent per year of PV capacity and PV energy due to degradation of the modules. The value of 0.5 percent is the median value of 2000 observed degradation rates.25
25 D. Jordan and S. Kurtz, “Photovoltaic Degradation Rates – An Analytical Review,” NREL, June 2012.

Minnesota Value of Solar: Methodology | Minnesota Department of Commerce
Page 49
Input Data Used in Methodology Section Definition
PV Life Multiple The assumed service life of PV. This value is also used to define the study period for which avoided costs are determined and the period over which the VOS rate would apply.
Reserve planning margin Avoided Reserve Capacity Cost The planning margin required to ensure reliability.
Solar-weighted heat rate Avoided Fuel Costs This is described in the described in the Avoided Fuel Costs section.
Start Year for VOS applicability Multiple This is the first year in which the VOS would apply and the first year for which avoided costs are calculated.
Transmission capital cost escalation Avoided Transmission Capacity Cost Used to adjust costs for future capital investments.
Transmission life Avoided Transmission Capacity Cost The assumed service life of new transmission assets.
Treasury Yields Escalation and Discount Rates Yields for U.S. Treasuries, used as the basis of the risk-free discount rate calculation.26
Years until new transmission capacity is needed
Avoided Transmission Capacity Cost This is used to test whether avoided costs for a given analysis year should be calculated and included.
26 See http://www.treasury.gov/resource-center/data-chart-center/interest-rates/Pages/TextView.aspx?data=yield