ministry of public health z u and sanitation +o ostrategic
TRANSCRIPT

Reversing the trendsThe Second
NATIONAL HEALTH SECTORStrategic Plan of Kenya
Ministry of PublicHealth and Sanitation
December 2008
o +oÞ
Republic of Kenya
�
Uz»
�
-1
ç
-
NO
2Â
Ministry of Public Healthand Sanitation
STRATEGIC PLAN2008–2012

�
Uz»
�
-1
ç
-
NO
2Â
o +oÞ

iStrategic Plan 2008–2012
Reversing the trendsThe Second
NATIONAL HEALTH SECTORStrategic Plan of KenyaRepublic of Kenya
Ministry of Public Healthand Sanitation
STRATEGIC PLAN2008–2012
Ministry of Public Healthand Sanitation
December 2008

ii Ministry of Public Health and Sanitation
z»
�
-1
ç
-
NO
2Â
o +oÞU
ANY PART OF THIS DOCUMENT may be freely reviewed, quoted, reproduced or translated in fullor in part, provided the source is acknowledged. It may not be sold or used in conjunction withcommercial purposes or for profit.
Ministry of Public Health and Sanitation Strategic Plan, 2008–2012
Published by: Ministry of Public Health and SanitationAfya HousePO Box 3469 – City SquareNairobi 00200, KenyaEmail: [email protected]://www.health.go.ke

iiiStrategic Plan 2008–2012
Message from the Minister
As the statement of the investment prioritiesof the Ministry of Public Health andSanitation for the period 2008–2012, thisStrategic Plan is in line with the Govern-
ment’s first Medium-Term Plan and Kenya Vision2030. The plan has been developed through thecollaborative efforts of various health sector stake-holders. It builds on the achievements and challengesarising during the implementation of the SecondNational Health Strategic Plan II (NHSSP II – 2005–2010), which had as its goals “to reduce healthinequalities and to reverse the downward trends inhealth related outcome and impact indicators”.
The vision of my Ministry is to make Kenya “anation free from preventable diseases and ill health”,through primary health care interventions at indivi-dual, household, community and primary healthfacility levels. The strategic plan for the Ministry is amilestone in the history of Kenya, as it is specific topublic health and sanitation interventions. Thus, it isenvisaged that the national resource allocation forpublic health and sanitation services will increasesignificantly.
P riority will be given to scaling up theimplementation of interventions aimed atenhancing the equitability of access to public
health and sanitation services. Such measures willinclude improving immunization coverage forchildren, ensuring that most deliveries are conductedunder the care of skilled health attendants, and
reducing morbidity and mortality from malaria, HIV/AIDS, tuberculosis and non-communicable diseases.
Government will invest substantial resourcesin building the capacity of communities to takecharge of their health care development and
to manage resources for health. This will be done byscaling up the roll out of the Community Strategy toprogressively cover the entire nation in a manner thatis responsive and sensitive to the socio-cultural valuesand practices of the various communities in thecountry. In order to accelerate the CommunityStrategy, the Ministry plans to channel health sectorservices funds directly to all dispensaries and healthcentres.
Successful implementation of this plan will requirethe coordinated action of many sectors and theparticipation of all stakeholders in the health sector. Iam confident that this plan will inform the process ofjoint annual planning. I request and urge all membersof my Ministry to put great effort into implementingthis plan as a means of averting preventable morbidityand mortality in our country and improving Kenyans’quality of life.
Hon. Beth Mugo, EGH, MPMinister for Public Health and SanitationDecember 2008

iv Ministry of Public Health and Sanitation
z»
�
-1
ç
-
NO
2Â
o +oÞU

vStrategic Plan 2008–2012
Acknowledgements
Extensive consultations among variousstakeholders marked the developmentprocess of this strategic plan. Theprocess was organized through clearly
defined working groups reflecting three broadthematic areas: Service Delivery, SupportSystems, and Governance and Financing. Theappointed senior ministry staffs provided therequired leadership to these groups, under thedirect supervision of the acting Director of PublicHealth and Sanitation, Dr. S.K. Sharif. Theeffective stewardship by Head of TechnicalPlanning and Monitoring Dr. Samuel Were waslaudable. The outputs from the groups wereharmonized and summarized before beingconsolidated to produce the first draft. This draftwas then shared internally and with stakeholderswho provided invaluable inputs that have beenduly incorporated into this final document.
I thank all the members of the working teams,who included:• Service Delivery Team: Dr. John Odondi,
Primary Health Services; Dr. Josphine Kibaru,Family Health; Mr. Kepha Ombacho,Sanitation and Environmental Health; and Dr.Salim Ali, Health Promotion.
• Support Systems Team: Mr. S. Kaloki, HumanResources for Health; Mr. Ochola Ondari,Procurement; Mr. Edward Were, PrincipalAccounts Controller; Mr. N.K. Waweru,acting senior deputy secretary; Ms. RachelWairimu, Information and CommunicationsTechnology; Dr. Ruth Kitetu, TechnicalPlanning; Dr. Kibet Sergon, Monitoring andEvaluation and Health ManagementInformation System; and Mr. Kamande,Radiation Protection Board.
• Governance and Finance Team: Dr. SamuelWere, Technical Planning and Monitoring;Mr. Kennedy Nyamao, Chief FinancingOfficer; Mr. Ayub Mwando, Policy andPlanning; and Mrs. Zipporah Momanyi,Health Administrator.
In particular much appreciation goes to theplan secretariat – Dr. Were, Dr. Kitetu, Dr.Sergon, Dr. Richard Pendame and Mr.
Mwando – who patiently worked for long hourstowards the successful preparation of this plan.
Indeed, I cannot underplay the significantinputs and contributions from development and

vi Ministry of Public Health and Sanitation
z»
�
-1
ç
-
NO
2Â
o +oÞU
implementing partners. Their collective opinionsand wisdom contributed greatly to the draftingand finalization of the plan.
The development of the plan was madepossible through the technical advisors obtainedfrom our development partners, in particular theUK’s Department for International Development(DFID) through Essential Health Services (EHS),as well as the German Development Cooperation(GDC); we are very grateful to both of them. Iam especially thankful to Dr. Richard Pendame(EHS) and Prof. Peter Nyarang’o (GDC) for their
great contributions to the development of thisplan.
Finally I thank DFID, which through the EHSprogramme provided financial support todevelop the plan.
Mark Bor, EBSPermanent SecretaryMinistry of Public Health and SanitationDecember 2008

viiStrategic Plan 2008–2012
Contents
Message from the Minister iiiAcknowledgements vList of Tables xList of Figures xiiList of Abbreviations xiiiExecutive Summary xv
1. Introduction 11.1 The Rationale for Ministerial
Strategic Planning 11.2 Methodology for Developing the
Strategic Plan 2
2. Kenya’s Development Agendaand Challenges 4
2.1 The National Development Agenda –Kenya Vision 2030 4
2.2 National, Regional and Global PublicHealth Challenges 52.2.1 National Public Health Challenges 62.2.2 Regional Public Health Challenges 62.2.3 Global Public Health Challenges 6
3. Role of the Ministry of Public Healthand Sanitation 7
3.1 MOPHS Core Functions 73.2 Vision and Mission 8
3.3 Core Values Guiding Public Healthand Sanitation Services 8
3.2 Linkages with Government and HealthSector 9
4. Review of Health Sector Progressand Challenges 11
4.1 Service Delivery Output Indicators 114.2 Service Delivery Impact Indicators 124.3 Equitable Access to Quality Public
Health Services 134.3.1 Geographical Access 134.3.2 Economic Access 144.3.3 Socio-Cultural Access 14
4.4 Quality of Public Health Services 144.4.1 Human Resources 144.4.2 Health Facilities 154.4.3 Equipment 154.4.4 Drugs and Supplies 154.4.5 Insufficient Evidence for Decision
Making 154.4.6 Quality Standards and Guidelines 154.4.7 Public Health Legislation 15
4.5 Human Resources Management System 154.5.1 HR Information Systems 164.5.2 Recruitment and Deployment 164.5.3 Staff Development 16

viii Ministry of Public Health and Sanitation
z»
�
-1
ç
-
NO
2Â
o +oÞU
4.5.4 HR Planning and Management 164.5.5 Staff Performance Systems 164.5.6 Salaries, Attrition and Staff
Distribution 174.6 The Health Infrastructure 17
4.6.1 Buildings and Equipment 174.6.2 Transport System 174.6.3 Information and Communication
Technology (ICT) 174.7 Public Finance Management System
(PFMS) 184.7.1 Budget 184.7.2 Financial Information System 18
4.8 Health Management InformationSystem (HMIS) 18
4.9 Procurement and Commodity LogisticsManagement Systems (General) 19
4.10 Policy Planning 194.11 Partnership 194.12 Financing Public Health Services 204.13 Review of Public Health Expenditures,
2005/06–2007/08 21
5 Strategic Model 235.1 Strategic Thrusts for Public Health
and Sanitation 235.2 Implementation Framework for
Achieving the Strategic Priorities 245.2.1 Strategic Thrust 1: Improving
Equitable Access to Public Healthand Sanitation Services 24
5.2.2 Strategic Thrust 2: Improvingthe Quality and the Responsivenessof MOPHS Services 26
5.2.3 Strategic Thrust 3: Improve theEfficiency of Public Health andSanitation Services 30
5.2.4 Strategic Thrust 4: FosteringPartnerships 33
5.2.5 Strategic Thrust 5: ImprovingFinancing of Public Healthand Sanitation Services 34
6. Coordination Framework 366.1 Coordination Structures at the National
Level 376.1.1 Joint Inter Agency Coordinating
Committee (JICC) 376.1.2 Health Sector Coordinating Com-
mittee (HSCC) 386.1.3 Technical Stakeholders Committee
(TSC) 38
6.1.4 Ministerial Management Unit(MMU) 38
6.2 Coordination Structures at the Sub-national Level 386.2.1 Provincial Health Stakeholder
Forum (PHSF) 386.2.2 District Health Stakeholder
Forum (DHSF) 386.2.3 Health Facility Committee (HFC) 386.2.4 Community Health Committee
(CHC) 38
7. Capacity 397.1 Management Structure and Functions at
the National Level 397.1.1 Office of the Permanent Secretary 417.1.2 Office of the Director of Public
Health and Sanitation (DPHS) 417.1.3 Parastatals and Statutory Boards 427.1.4 Support Services 427.1.5 Ministerial Support Units 42
7.2 Management Structures and Functionsat the Subnational Levels 42
8 Resource Flows 458.1 Costing of Public Health Interventions 45
8.1.1 Overall Cost of the Plan 458.1.2 Distribution of Costs by Input
Categories 468.2 Sources of Financing 478.3 Resource Gap 47
9. Accountability and Risk 499.1 Goals and Responsibilities 499.2 Risk Assessment 49
9.2.1 Risk A: Government Funding DoesNot Increase 50
9.2.2 Risk B: Development PartnersReduce Funding to the HealthSector 50
9.2.3 Risk C: Corruption in theCountry Remains Unchanged 51
9.2.4 Risk D: Further Increase inPoverty Levels 51
9.2.5 Risk E: The Imminent Collapse ofFaith-Based Health CareServices Becomes Real 51
9.2.6 Risk F: Insufficient Improvementof the Weak Managementand Coordination Systems 52
9.2.7 Risk G: The Expanded Sector WillLead to Relative Reduction ofResources to Public Health 52

ixStrategic Plan 2008–2012
9.2.8 Risk H: Food Security andNutrition May Get Worse ifFood Production Falls 52
9.2.9 Risk I: The Insecurity in Com-modity Management Will Persist 53
9.2.10 Risk J: Negative Public Perception of Government Health Care Services 53
10. Monitoring, Evaluation and Reporting 5410.1 Framework for Monitoring and
Reporting 5410.2 Indicators for Monitoring Progress 5510.3 Interpretation of Performance 5610.4 Monitoring and Reporting Process 57
References 58
AnnexesA Priority Health Sector Interventions
for Acceleration in the Medium Term,arising from the Midterm Review ofNHSSP II 59
B Causes of Prevailing Health Problemsand Challenges 61
C MOPHS Staff Requirements, Estab-lishment and Gaps 62
D Transport Requirements 67

x Ministry of Public Health and Sanitation
z»
�
-1
ç
-
NO
2Â
o +oÞU List of Tables
3.1: Primary care services of the Ministryof Pubic Health and Sanitation atthe different levels of the health caresystem 8
4.1: KEPH indicator targets for cohort 1 124.2: KEPH indicator targets for cohorts 2
and 3 124.3: KEPH indicator targets for cohorts 4,
5 and 6 134.4: Progress towards achievement of
MDG targets 134.5: Ministry of Public Health and Sanitation:
Gross actual expenditure(Ksh million) 214.6: Analysis of total recurrent MOPHS
expenditures by category (Kshmillion) 21
4.7: Core poverty programmes byexpenditure category in the Ministry,2005/06–2007/08 (Ksh million) 22
5.1: Results framework for StrategicThrust 1 – Increasing equiaccess topublic health services 25
5.2: Results framework for StrategicThrust 2 – Improving qualityand responsiveness of Public Healthand Sanitation services 27
5.3: Results framework for StrategicThrust 3 – Improving efficiency ofpublic health and sanitation services 31
5.4: Results framework for StrategicThrust 4: Fostering partnerships 33
5.5: Results framework for StrategicThrust 5: Improving financing ofpublic health and sanitation services 35
7.1: Functions of departments anddivisions under the office of the DPHS 41
7.2: Core functions of parastatal andstatutory boards under MOPHS 42
7.3: Core functions of departments/unitsunder the Director of Administration 43
7.4: Core functions of ministerial supportunits 42
7.5: Core functions of subnational manage-ment structures 44
7.6: Core responsibilities and staff require-ments for units at the subnational level 44
8.1: Summary resource requirements bythrusts, 2009/10–2011/12 (Ksh 000and percentage) 46
8.2: Distribution of costs by budget category, 2009/10–2011/12 (Ksh 000 andpercentage) 46

xiStrategic Plan 2008–2012
8.3: Estimated financing for MOPHS 2008/09–2011/12, budgetary and cost-sharing (Ksh 000,000) 47
8.4: Distribution of estimated availableresources by main budget categories,2008/09–2011/12 (Ksh 000,000) 47
8.5: Distribution of expenditure (includingFIF) estimates by main budgetcategories, 2008/09–2011/12 47
8.6: Comparison: Budget, MTEF allocationsand funding gap 48
9.1: Summary risk–impact matrix 499.2: Objectives, goals and responsible
parties 50
10.1: Core indicators for monitoringoutcomes 55
10.2 End of term and midterm measure indicators 56
10.3: Interpretation of indicators against dashboard 57
10.4: Monitoring and review framework 57
C1: Vehicles per level and units 67C2: Transport requirements by province,
district and location 67

xii Ministry of Public Health and Sanitation
z»
�
-1
ç
-
NO
2Â
o +oÞU List of Figures
1.1: Linkage between Government-specificand health sector planning processes 2
2.1: Pillars of Kenya’s development frame-work – Vision 2030 5
3.1: Vision and mission of the Ministry ofPublic Health and Sanitation 8
3.2: Linkages of MOPHS, governmentministries/agencies and other healthsector stakeholders 9
4.1: KEPH levels of care – Communities arethe foundation of the pyramid 11
4.2: Public health expenditure trends,2005/06–2007/08 (Ksh million) 21
5.1: MOPHS strategic thrusts and links toKenya Vision 2030, MTP and NHSSP II 24
6.1: Ministry of Public Health and Sanitation coordination structure 37
7.1: Ministerial structure at national level 407.2: Organization structure for subnational
management levels and reporting officesat headquarters level 43
8.1: Summary resource requirements bystrategic thrusts (Ksh 000,000) 46
8.2: Total estimated available resources bymain budget categories (Ksh 000,000) 47

xiiiStrategic Plan 2008–2012
List of Abbreviations
AIDS Acquired immune deficiency syndromeAIE Authority to incur expenditureANC Antenatal careAOP Annual operational planART Anti-retroviral therapyBCC Behaviour change communicationBCG Bacille Calmette-Guerin (TB vaccine)CBHMIS Community-based health management
information systemCDF Constituency Development FundCFO Chief Financing OfficerCHEW Community health extension workerCHW Community health workerCORP Community-owned resource personCP Chief PharmacistDCH Division of Child HealthDEH Division of Environmental HealthDFID Department for International Develop-
ment (UK)DHMB District Health Management BoardDHMT District Health Management TeamDHP District health planDHSF District Health Stakeholder ForumDMOH District Medical Officer of HealthDOMC Division of Malaria ControlDPHS Director of Public Health and SanitationDRH Division of Reproductive Health
DSRS Department of Standards and Regu-latory Services
EMMS Essential Medicines and MedicalSupplies
ERS Economic Recovery Strategy (forWealth and Employment Creation)
EU European UnionFBO Faith-based organizationFP Family planningGDC German Development CooperationGFATM Global Fund to Fight AIDS, TB and
MalariaGOK Government of KenyaP4H Providing for HealthHACCP Hazardous analysis critical control
pointHBC Home-based careHIV Human immuno-deficiency virusHMIS Health management information
systemHQ Headquarters (generally refers to
MOPHS)HRD Human Resource DevelopmentHRH Human resources for healthHRIO Health records and information officerHSCC Health Sector Coordinating CommitteeHSSF Health Sector Services Fund

xiv Ministry of Public Health and Sanitation
z»
�
-1
ç
-
NO
2Â
o +oÞU
ICT Information and communicationtechnology
IDSR Integrated disease surveillance andresponse
IEC Information, education and commu-nication
IFMIS Integrated financial managementinformation system
IHP International Health PartnershipsIMCI Integrated management of childhood
illnessIMR Infant mortality rateIPT Intermittent prophylactic treatment (for
malaria)JICC Joint Inter-Agency Coordinating
CommitteeJPWF Joint Programme of Work and FundingJSP Joint Support ProgrammeKEMSA Kenya Medical Supply AgencyKENWA Kenya Network of Women with AIDSKEPH Kenya Essential Package for HealthKEPI Kenyan Expanded Programme of
ImmunizationKMTC Kenya Medical Training CollegeKNH Kenyatta National HospitalKsh Kenya shillingLBW Low birth weightLLITN Long-lasting insecticide treated bed netM&E Monitoring and evaluationMCH Mother and child healthMDGs Millennium Development GoalsMDR Multi drug resistantMMR Maternal mortality ratioMMU Ministerial Management UnitMOH Ministry of HealthMOMS Ministry of Medical ServicesMOPHS Ministry of Public Health and Sani-
tationMOU Memorandum of understandingMPER Ministerial public expenditure reviewMTEF Medium-term expenditure framework
(three-year rolling plan)MTPP Medium-term procurement planMTRH Moi Teaching and Referral HospitalNA Not available
NASCOP National AIDS and STD ControlProgramme
NBTS National Blood Transfusion ServiceNGO Non-government organizationNHSSP II Second National Health Sector Strategic
Plan 2005–2010NLTP National Leprosy and TB ProgrammeNPHLS National Public Health Laboratory
ServicesNS Not statedNSHIF National Social Health Insurance FundOBA Output-based approachPAC Principal Accounts ControllerPDMS Provincial Director of Medical ServicesPEPFAR President’s Emergency Plan for AIDS
ReliefPFM Public finance and managementPGH Provincial General HospitalPHMT Provincial Health Management TeamPME Performance-based monitoring and
evaluationPMO Provincial Medical OfficerPMSMT Provincial Medical Services Manage-
ment TeamPMTCT Prevention of mother-to-child trans-
mission (of HIV)PRM Planning, review and monitoringPS Permanent SecretaryPU Procurement UnitRBM Results-based managementRH Reproductive healthRRI Rapid results initiativeSCC SWAp Coordinating CommitteeSOP Standard operating proceduresSSOP Sanitary standard operating proceduresSWAp Sector-wide approachTB TuberculosisTOR Terms of referenceTOT Training/trainer of trainersTSC Technical Stakeholders CommitteeVCT Voluntary counselling and testingWG Working groupWHO World Health OrganizationWIT Work Improvement TeamsWRA Women of reproductive age

xvStrategic Plan 2008–2012
Executive Summary
As part of the Government of Kenya’songoing public sector reforms, thismedium-term Strategic Plan for theMinistry of Public Health and
Sanitation (MOPHS) charts the way forward forthe Ministry over the next four years. Key policydocuments that informed the articulation of theplan were Kenya Vision 2030, the first Medium-Term Plan (2008–2010), Kenya Health PolicyFramework 1994–2010, the second NationalHealth Sector Strategic Plan (NHSSP II – 2005–2010) and the Medium-Term ExpenditureFramework (MTEF) 2008–2011.
The plan intends to support the imple-mentation of these key policy documents and alsoto guide the formulation of the Ministry’s annualoperational plans and performance contracts.
The ProcessUsing guidelines set by the Ministry of Planning,National Development and Vision 2030, threeworking groups undertook the process ofdeveloping this plan. The process includedseveral steps: Existing policy documents werereviewed, a situation assessment was undertakento determine successes and challenges for theMinistry, and, through a series of workshops, the
Among the priorities of this Plan are:• Articulating an Infrastructure Investment
Policy and Strategy• Building and/or rehabilitating 780 level
2 and 3 health facilities• Setting up 40 nomadic clinics• Creating 2,550 community units• Recruiting 23,645 new technical staff• Scaling up behaviour change and
communication interventions at level 1to reduce HIV incidence
• Institutionalizing quality assurancesystems
• Developing key health sector policydocuments
• Institutionalizing the Health SectorServices Fund
priorities, strategies and implementation matrixof the plan were developed.
Internal as well as health sector stakeholderconsultations on the draft plan were undertakenand comments incorporated into the final plan.
The PrioritiesThe priorities of this strategic plan are derivedfrom Kenya’s development agenda, public health

xvi Ministry of Public Health and Sanitation
z»
�
-1
ç
-
NO
2Â
o +oÞU
challenges, the MOPHS mandates, and thelessons learnt in the delivery of public health andsanitation services in the country. These prioritiesare supposed to contribute to the achievement ofthe objectives of the First Medium-Term Plan forthe Government of Kenya.
Strategic ThrustsFive strategic thrusts define the priority areas forpublic health and sanitation services during theperiod 2008–2012. These are:• Improving equitable access to public health
and sanitation services• Improving quality and responsiveness of
public health and sanitation services• Improving efficiency of public health and
sanitation services• Fostering partnerships• Improving financing for public health and
sanitation services
Specific Goals and StrategiesFor each thrust, specific goals and implemen-tation strategies were developed. These are:
Thrust 1: Improving equitable access to publichealth and sanitation services1.1) Increase the proportion of communities
that live within 5 km of a functional healthfacility from 52% to 62%
1.2) Increase the proportion of deliveriesconducted by skilled attendants from 42%to 60%
Thrust 2: Improve quality of public health andsanitation services2.1) Reduce the vacancy rate of technical staff
by 40%2.2) Increase the health workforce trained to
40,255 staff by 2012, by carrying out atraining needs assessment and develop atraining programme
2.3) Rehabilitate and adequately equip 50% oflevel 2 and 3 and other public healthfacilities
2.4) Reduce proportion of facilities reporting nostock outs by 100%, by maintainingadequate stock levels of medicines,commodities and supplies throughmeasures such as proper forecasting, timelyprocurement and efficient distribution.
2.5) Increase sanitation coverage from 46% to66%
2.6) Increase the number of households utilizingsafe water by 20% by promoting use oftreated water at household level
2.7) Increase the number of facilities with healthcare waste management systems from 20%to 100%
2.8) Increase client satisfaction by 50% in 2,408health facilities
2.9) Reduce the incidence of food-bornediseases/illnesses by 5%
2.10) Reduce mortality rate due to emergencyto below 1/10,000 persons at risk per day
2.11) Increase the utilization of cost-effectivereproductive health services by 50%
2.12) Increase the utilization of cost-effective childhealth care services by 50%
2.13) Reduce new HIV infections by 50% byscaling up behaviour change initiatives atcommunity/household level
2.14) Increase TB case detection and treatment to90% by increasing the capacity of level 2 and3 to diagnose and treat
2.15) Reduce malaria incidence to 15% byutilizing cost effective control measuressuch as long-lasting insecticide treated netsand indoor household spraying
2.16) Reduce the incidence of malnutrition ofchildren <5 years by 20% by providingVitamin A supplements to 100% of all thoseeligible
Thrust 3: Improve efficiency of public health andsanitation services3.1) Reduce the staff vacancy rate by 60%3.2) Increase the proportion of staff trained as
per government policy by 50%3.3) Increase the proportion of employee job
satisfaction by 90%3.4) Increase the availability and utilization of
information and communication tech-nology (ICT) by 60%
3.5) Improve the utilization of transport servicesby 50%
The strategic plan anticipates reducing by20% the incidence of malnutrition amongchildren under five years by providingVitamin A supplements to 100% of allthose eligible.
xviiStrategic Plan 2008–2012
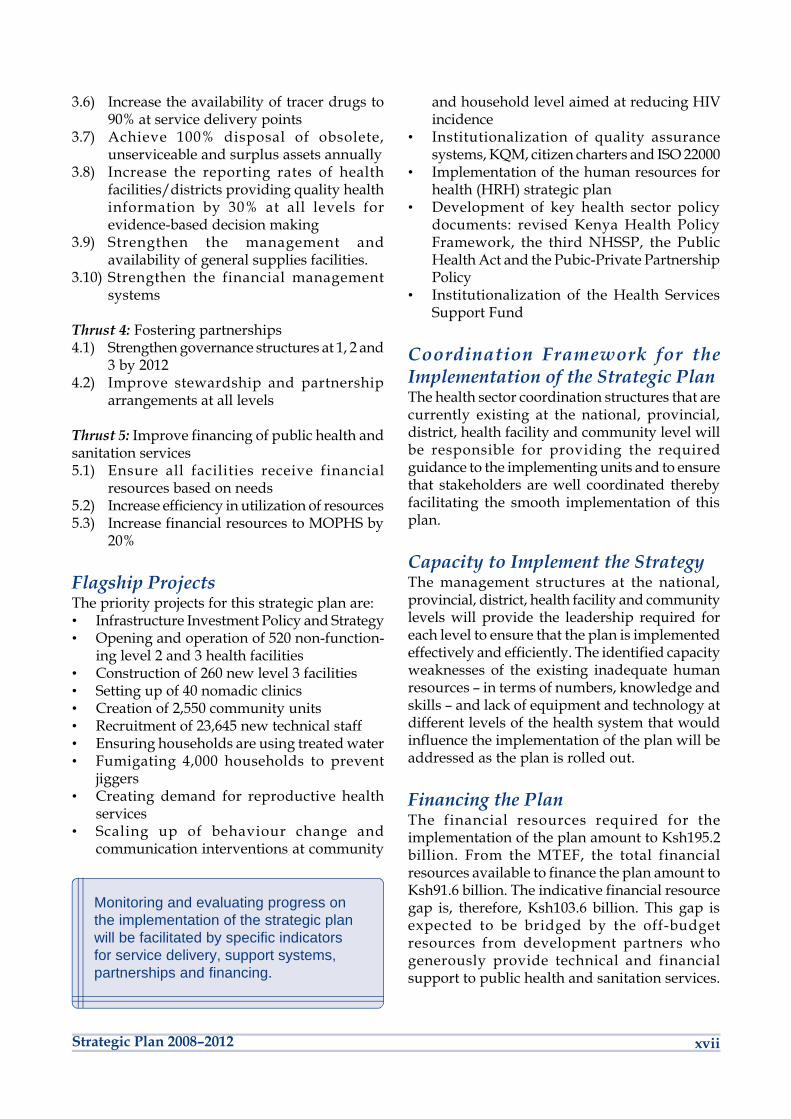
3.6) Increase the availability of tracer drugs to90% at service delivery points
3.7) Achieve 100% disposal of obsolete,unserviceable and surplus assets annually
3.8) Increase the reporting rates of healthfacilities/districts providing quality healthinformation by 30% at all levels forevidence-based decision making
3.9) Strengthen the management andavailability of general supplies facilities.
3.10) Strengthen the financial managementsystems
Thrust 4: Fostering partnerships4.1) Strengthen governance structures at 1, 2 and
3 by 20124.2) Improve stewardship and partnership
arrangements at all levels
Thrust 5: Improve financing of public health andsanitation services5.1) Ensure all facilities receive financial
resources based on needs5.2) Increase efficiency in utilization of resources5.3) Increase financial resources to MOPHS by
20%
Flagship ProjectsThe priority projects for this strategic plan are:• Infrastructure Investment Policy and Strategy• Opening and operation of 520 non-function-
ing level 2 and 3 health facilities• Construction of 260 new level 3 facilities• Setting up of 40 nomadic clinics• Creation of 2,550 community units• Recruitment of 23,645 new technical staff• Ensuring households are using treated water• Fumigating 4,000 households to prevent
jiggers• Creating demand for reproductive health
services• Scaling up of behaviour change and
communication interventions at community
and household level aimed at reducing HIVincidence
• Institutionalization of quality assurancesystems, KQM, citizen charters and ISO 22000
• Implementation of the human resources forhealth (HRH) strategic plan
• Development of key health sector policydocuments: revised Kenya Health PolicyFramework, the third NHSSP, the PublicHealth Act and the Pubic-Private PartnershipPolicy
• Institutionalization of the Health ServicesSupport Fund
Coordination Framework for theImplementation of the Strategic PlanThe health sector coordination structures that arecurrently existing at the national, provincial,district, health facility and community level willbe responsible for providing the requiredguidance to the implementing units and to ensurethat stakeholders are well coordinated therebyfacilitating the smooth implementation of thisplan.
Capacity to Implement the StrategyThe management structures at the national,provincial, district, health facility and communitylevels will provide the leadership required foreach level to ensure that the plan is implementedeffectively and efficiently. The identified capacityweaknesses of the existing inadequate humanresources – in terms of numbers, knowledge andskills – and lack of equipment and technology atdifferent levels of the health system that wouldinfluence the implementation of the plan will beaddressed as the plan is rolled out.
Financing the PlanThe financial resources required for theimplementation of the plan amount to Ksh195.2billion. From the MTEF, the total financialresources available to finance the plan amount toKsh91.6 billion. The indicative financial resourcegap is, therefore, Ksh103.6 billion. This gap isexpected to be bridged by the off-budgetresources from development partners whogenerously provide technical and financialsupport to public health and sanitation services.
Monitoring and evaluating progress onthe implementation of the strategic planwill be facilitated by specific indicatorsfor service delivery, support systems,partnerships and financing.

xviii Ministry of Public Health and Sanitation
z»
�
-1
ç
-
NO
2Â
o +oÞU
RisksThe implementation of this plan and hence therealization of the 2008–2012 targets may beaffected by a number of factors: reduced financingfrom Government and development partners,corruption, poverty, non-functioning faith-basedservices, weak management and coordinationsystems, food insecurity, and poor quality ofGovernment health care services. The mitigationmeasures for these perceived risks are outlinedin the plan.
Monitoring, Evaluation and ReportingA framework for monitoring and evaluatingprogress on the implementation of the strategicplan has been developed. Specific indicators forservice delivery, support systems, partnershipsand financing have been identified for monthly,
quarterly, and annual monitoring of progress.Impact indicators for evaluating mid and end-term evaluations are also identified. A dashboardapproach to measure performance in the deliveryof services will be done jointly with the Ministryof Medical Services.

1Strategic Plan 2008–2012
1Introduction
NHSSP II aimed to reduce healthinequalities and reverse the downwardtrends in health-related outcome andimpact indicators. The plan has thefollowing objectives:w Increase equitable access to health
servicesw Improve the quality and responsiveness
of servicesw Foster partnerships in improving health
and delivering servicesw Improve the efficiency and effectiveness
of service deliveryw Improve financing of the health sector
Strategic planning constitutes a majorplank in the Government of Kenya’songoing public sector reforms, whichhave the objective of enhancing public
service delivery. In addition, strategic planningprovides a forum through which the Govern-ment can communicate with all stakeholders onthe use of public resources for the common good.Following the launch of Vision 2030 and its FirstMedium-Term Plan (MTP) 2008–2012, allGovernment ministries are required to developministerial strategic plans for the period 2008–2012.
1.1 The Rationale forMinisterial StrategicPlanning
F or the Ministry of Public Health andSanitation (MOPHS), this strategic plan,like others within the public sector, is
expected to support the implementation of Vision2030 and MTP 2008–2012, along with the broad
goals of the second National Health SectorStrategic Plan (NHSSP II) 2005–2010.1 TheMOPHS strategic plan will also form the basisfor identifying deliverables under the performancecontracting mechanism and for individualannual performance appraisal.
Because the strategic plan has linkages to themedium-term expenditure framework (MTEF)as well as human resource planning, it delineatesthe necessary financial resources for programme

2 Ministry of Public Health and Sanitation
z»
�
-1
ç
-
NO
2Â
o +oÞUFigure 1.1: Linkage between Government-specific and health sector planning processes
Government wide develop-ment goals
Health sector policyimperatives
Government wide mediumterm priorities
Health sector-wide strategicobjectives
Ministry investment plan toachieve its mandate
Annual operational outputs
Annual Governmentcommitments
VISION 2030
Health Sector Policy Framework
Government WideMedium-Term Plan
National Health Sector Strategic Plan
Programme/System Investment Plans
MINISTRY STRATEGIC PLAN
Annual Operational Plans and RespectiveMedium-Term Expenditure Framework
Performance Contracts
u
q
q
q
q
q
activities, as well as the human capacity tofacilitate their successful implementation.
Both the current Health Sector PolicyFramework (HSPF) 1994–2010 and NHSSP II,therefore, informed this strategic plan. Togetherwith the medium-term plan of our sister healthministry, the Ministry of Medical Services(MOMS), and the input of our developmentpartners and implementing partners, thisstrategic plan will serve as the foundation of thepublic health sector’s annual operational plans.The MOPHS strategic plan will also inform the
performance contract of the Ministry. Theselinkages and processes are schematicallypresented in Figure 1.1.
1.2 Methodology forDeveloping the StrategicPlan
Working groups in three major areas –service delivery, support systems, andgovernance and financing – consisting
of officers from the central MOPHS were giventhe responsibility of undertaking the process ofdeveloping this strategic plan. The workinggroups conducted a review of existing policydocuments such as Kenya Vision 2030, NHSSPII, the Joint Programme of Work and Funding(JPWF),2 the Midterm Review of NHSSP II
This strategic plan is expected to supportthe implementation of Vision 2030 andMTP 2008–2012, along with the broadgoals of the second National Health SectorStrategic Plan (NHSSP II) 2005–2010. Theplan also has linkages to the medium-termexpenditure framework.

3Strategic Plan 2008–2012
(MTR), Norms and Standards,3 Roadmap forAcceleration of Implementation of Interventions toAchieve the Objectives of NHSSP II, the JointSupport Programme, and other relevantministerial documents.
Representatives from all departments anddivisions conducted a desk situation assessment,which was followed by a five-day workshop todevelop the priorities, strategies, outputs andimplementation matrix of the plan. The basicstructure of the plan follows guidelines providedto all the ministries by the Ministry of Planning,National Development and Vision 2030. The
draft plan was circulated internally and to healthsector stakeholders for comments; these wereincorporated into the final plan.
Chapter Notes
1 Ministry of Health, 2005, Reversing the Trends – The SecondNational Health Sector Strategic Plan of Kenya: NHSSP II – 2005–2010, Nairobi, Kenya.2 Ministry of Health, 2006, Joint Programme of Work and Fundingfor the Kenya Health Sector 2006/07–2009/10, Nairobi, Kenya.3 Ministry of Health, 2006, Norms and Standards for Health ServiceDelivery, Nairobi, Kenya.

4 Ministry of Public Health and Sanitation
z»
�
-1
ç
-
NO
2Â
o +oÞU 2Kenya’s Development Agenda and
Challenges
Confronted by pervasive poverty anddeclining health indicators, Kenya setabout overcoming the obstacles andmoving forward with deliberate
speed and determination to improve the socio-economic status of its citizens, and especiallytheir health. Two important steps have beentaken to accomplish this. One is the ambitiousdeclaration of Vision 2030, which has a clearview of the role of people’s health in the devel-opment agenda, and another is the fast-trackingof actions to meet the Millennium DevelopmentGoals (MDGs) by 2015.
2.1 The NationalDevelopment Agenda –Kenya Vision 2030
V ision 2030 details the Government ofKenya’s long-term developmentaspirations for the country. The aim of
Vision 2030 is to create “a globally competitiveand prosperous country with a high quality oflife by 2030” by transforming Kenya from a thirdworld country into an industrialized, middle
Vision 2030 aims to provide equitable andaffordable health care at the highestaffordable standard to all citizens, byrestructuring health care delivery systemsto shift the emphasis to preventive andpromotive health care. The emphasis willbe on access, equity, quality, capacity andinstitutional frameworks.
income country. The First Medium-Term Plan(MTP) for realizing the ambitions of the Visionoutlines the key policy actions, reforms,programmes and projects that the GrandCoalition Government intends to implementbetween 2008 and 2012, the first stage in thepush towards accomplishing the Vision.
As illustrated in Figure 2.1, Vision 2030specifies strategies for reaching its economic,social and governance targets. Achieving thedevelopment goals outlined in Vision 2030 willrequire increasing the productivity of both peopleand processes. Thus the health sector is expectedto play a critical supportive role in maintainingthe healthy workforce necessary for theincreased labour productivity that Kenyarequires in order to match its global competitors.

5Strategic Plan 2008–2012
Health is, therefore, one of the key componentsin delivering the Vision’s social pillar, “Investingin the people of Kenya”.
Kenya’s vision for health is to provide equi-table and affordable health care at the highestaffordable standard to all citizens, involving(among other things) the restructuring of thehealth care delivery systems in order to shift theemphasis to preventive and promotive healthcare. Key focal areas of access, equity, quality,capacity and institutional framework will beachieved through a devolution approach thatwill allocate funds and responsibility for deliveryof health care to hospitals, health centres anddispensaries, thereby empowering Kenyanhouseholds and social groups to take an activerole in maintaining and managing their healthcare.
The health sector objectives stipulated in theMTP are to:1. Reduce under-5 five mortality from 120 to
33 per 1,000 live births.2. Reduce the maternal mortality ratio (MMR)
from 410 to 147 per 100,000 live births.3. Increase the proportion of deliveries by
skilled personnel from the current 42% to90%.
4. Increase the proportion of immunizedchildren below one year from 71% to 95%.
5. Reduce the number of cases of TB from 888to 444 per 100,000 persons.
6. Reduce the proportion of in-patient malariafatality to 3%.
7. Reduce the national adult HIV prevalenceto less than 2%.
The MTP flagship projects for health arerehabilitating health facilities, strengthening theKenya Medical Supply Agency (KEMSA), fullyimplementing the Community Strategy,1 de-linking the health ministries from servicedelivery, building the human resource capacityand developing equitable financing mechanisms.
2.2 National, Regional andGlobal Public HealthChallenges
In today’s world no country is immune fromglobal health concerns, and numerousinternational initiatives have been taken to
address health issues, both existing and emerg-ing. Significant among these are the Alma-AtaDeclaration and the Millennium Declaration,which articulated the MDGs, many of whichdeal directly with health. Thus any nationalhealth sector is part of a bigger picture thatincludes the immediate regional neighbourhoodas well as the international concerns.
Figure 2.1: Pillars of Kenya’s development framework – Vision 2030
Source: Kenya National Economic and Social Council.

6 Ministry of Public Health and Sanitation
z»
�
-1
ç
-
NO
2Â
o +oÞU
2.2.1 National Public HealthChallenges
At the national level, maternal and childmortality remains a major public health problemfor Kenya. Despite the Government’s commit-ment to the international and regional healthagenda, the country has lagged behind in meet-ing most of the targets set in the internationaland regional declarations. Besides communi-cable diseases, lifestyle related diseases such ashypertension, diabetes, heart disease and cancersare increasing, hence posing a threat to thehealth care system in terms of diverting resourcesfrom basic health care services to these diseases.
The huge burden of disease is due primarilyto pervasive poverty, compounded by years oferratic application of policy, with the result thatmost of the population lacks the enablingenvironment for health, such as good nutrition,clean water, quality housing and a conduciveliving environment. Weak public health systemscharacterized by inadequate financial andhuman resources, inefficient support systems,and poorly coordinated responses to publichealth problems are responsible for the poorperformance of the health care system.
The Government’s budget allocation tohealth care, which is currently at 8%, is far shortof the 15% target agreed in the AbujaDeclaration.2 For example, the number of nursesand doctors per population is 33/100,000 and17/100,000, respectively, which is below thestandard recommended by the World HealthOrganization (WHO). Kenya will, therefore,struggle to attain the health-related MDGswithout increased resources to the sector.
Political instability is an additional threat topublic health. As a result of the violencefollowing the 2007 presidential elections, thedelivery of basic health services to Kenyans andhence the performance of the health sector wasseriously disrupted. Access to and availabilityof services were affected by the skirmishes.Similarly, the high incidence of gender-basedviolence during the period will have a seriousimpact on new HIV infections in the affectedareas and among displaced persons. The govern-ment reorganization following the formation ofthe Grand Coalition Government resulted in thesplit of the Ministry of Health into two, a decisionthat poses a challenge to health sector steward-ship and coordination.
2.2.2 Regional Public HealthChallenges
Political instability in Kenya’s neighbouringcountries – especially Somalia and Sudan – withthe subsequent influx of refugees into Kenya hasimposed an increased demand for healthservices and at the same time heightened the riskof spreading communicable diseases. The latterthreat includes a measles outbreak in 2007/08,as well as cases of polio – a disease not seen inKenya in many years.
2.2.3 Global Public Health ChallengesPublic health challenges globally have a bearingon the health situation in the country. New andemerging communicable diseases, especiallyEbola, SARS (severe acute respiratory syndrome)and avian flu, along with HIV/AIDS, do notrespect border crossings.
And in addition, geography and a highpercentage of arid and semi-arid lands contributeto make Kenya particularly vulnerable to theimpact of global warming and climate change.The effects of this phenomenon are, in fact,already being felt through prolonged droughtand more intense flooding than have beenknown in the past. Over the next few decadesincreasing temperatures are expected to extendthe areas of malaria endemicity to zones thatare presently relatively free of the disease.3
Climate change is also a factor in the increasedprevalence of other diseases such as chikun-gunya, dengue fever, cholera and dysentery.
Drought induced food shortages, com-pounded by recent enormous fluctuations in theinternational commodity markets, also posechallenges to food security strategies, withnegative implications for nutrition and the abilityof people to maintain their health status.
Chapter Notes
1 Ministry of Health, 2006, Taking the Kenya Essential Package forHealth to the Community: A Strategy for the Delivery of LEVELONE SERVICES, Nairobi, Kenya .2 Commitment by the Heads of State and Government of theAfrican Union, Abuja, Nigeria, 2001.3 United Nations Population Fund/AU Liaison Office, 2009,State of the African Population Report 2008 – Population Dynamicsand Climate Change: Implications for Africa’s Sustainable Development,Addis Ababa, Ethiopia.
In today’s world no country is immunefrom global health concerns.

7Strategic Plan 2008–2012
3Role of the Ministry of PublicHealth and Sanitation
Public health is about managing threatsto the health of a community, payingspecial attention to the social context ofdisease and health. The concept is based
on the premise that many diseases are prevent-able through simple, non-medical methods. Itwas defined in 1920 by Charles-Edward AmoryWinslow (1877–1957) as the “science and art ofpreventing disease, prolonging life and pro-moting health through the organized efforts andinformed choices of society, organizations(private and health), communities and indivi-duals”. The goal of public health is to improvelives through a focus on the prevention ortreatment of disease, surveillance of cases, andpromotion of healthy behaviours.
3.1 MOPHS Core Functions
Defined roles and functions for MOPHSare stipulated in Presidential CircularNo. 1/2008. The Ministry is central in
providing a leadership role in ensuring thatpublic health policy objectives are implementedto facilitate the attainment of the health sector
MOPHS’s core function is to provideprimary care services at the community,dispensary and health centre levels. TheMinistry is mandated to support theattainment of the health goals of the peopleof Kenya by implementing priorityinterventions in public health based on itsmandate and guided by the strategicframework provided by the Strategy forNational Transformation 2008–2012 andthe wider health sector.
objectives and targets set in the Strategy forNational Transformation (SNT) 2008–2012 andthe MDGs.
The mandate of MOPHS, as defined byGovernment, are as follows:a. Public health and sanitation policyb. Preventive and promotive health servicesc. Community health servicesd. Health educatione. Reproductive healthf. Food quality and hygieneg. Health inspection and other public health
servicesh. Quarantine administration

8 Ministry of Public Health and Sanitation
z»
�
-1
ç
-
NO
2Â
o +oÞU
i. Oversight of all sanitation servicesj. Preventive health programme including
vector controlk. National public health laboratoriesl. Government Chemistm. Dispensaries and health centres (i.e., levels
2 and 3)n. Kenya Medical Research Institute (KEMRI)o. Radiation Protection Boardp. Member of KEMSA Boardq. Member of Kenya Medical Training College
(KMTC) Board
The MOPHS presidential mandate translatesinto the core function of providing primary careservices at the first three levels of the health caresystem – the community, dispensary and healthcentre – as outlined in Table 3.1.
3.2 Vision and Mission
F rom its mandate and core functions,grounded in the aspirations of NHSSP IIand the development paradigm detailed
in Vision 2030 and MTP, MOPHS has articulatedthe vision and mission illustrated in Figure 3.1.
Level 1• Reproductive health
– Community midwifery– Family planning
• Child health– Community nutrition
• Basic health care– Treatment of common ailments– Referral– Home based care
• TB/HIV/malaria– Follow-up/defaulters– Case management
• School health programme• Behaviour change communication• Environmental health
– Water– Sanitation and hygiene– Food safety
• Community surveillance
Levels 2 and 3• Maternal health care
– Antenatal care– Delivery– Postnatal care– Family planning
• Child health care– Immunization– Growth monitoring
• Basic health care/Treatment of minor ailments• HIV/AIDS/TB• Voluntary counselling and testing• Anti-retroviral therapy/Prevention of mother to child transmission• Malaria• Environmental health
– Waste management• Health promotion (behaviour change communication/Health
education)• Outreach• Surveillance
Figure 3.1: Vision and mission of the Ministry ofPublic Health and Sanitation
The VisionA nation free from preventable
diseases and ill health
The MissionTo provide effective leadership and
participate in the provision of quality publichealth and sanitation services that areequitable, responsive, accessible and
accountable to Kenyans
Table 3.1: Primary care services of the Ministry of Pubic Health and Sanitation at the different levelsof the health care system
3.3 Core Values GuidingPublic Health andSanitation Services
I n providing services and public healthguidance in the sector, the Ministry upholdsthe following principles and values:
• People first: Commitment to provide publichealth services that are responsive andsensitive to the socio-cultural values andneeds of the various communities in Kenya.

9Strategic Plan 2008–2012
3.2 Linkages with Govern-ment and Health Sector
In the reorganization of government, MOPHSis grouped together with the ministries ofMedical Services, Education, and Labour to
form the Human Resource Development sector.It is through the human resource cluster that theMinistry plans, budgets and obtains its resources.
In addition, the Ministry interacts with otherministries outside the human resource sector,especially central ministries and departments(Finance, Vision 2030, Public Services, Audit),as well as Parliament, on policy development,strategic planning, resource mobilization andmanagement, and monitoring and evaluationissues. Within the health sector, MOPHS, jointlywith the Ministry of Medical Services (MOMS),provides stewardship to the health sector’s devel-opment and implementing partners.
The linkages between MOPHS and othergovernment ministries, departments andagencies are shown in Figure 3.2.
Figure 3.2: Linkages of MOPHS, government ministries/agencies and other health sector stakeholders
Central Ministries/Departments
Finance
Planning andVision 2030
Public Service
Audit
Developmentpartners
Non-state serviceproviders
Implementingpartners
Public(community,
media)
Parliament
Human resource sector
MOMS MOPHS u
q
q
q
u
u
q
u
u
u
u
q
q
q
q
q
• Social justice and equity: Human rightsapproach and equitable access arefundamental guiding principles to informdelivery of public health services in thecountry.
• Partnership and collaboration: Closeworking relationship with all stakeholdersto promote synergy.
• Result oriented: Results for Kenyans.• Professionalism: Skills and competence of
the highest standards.• Accountability: Responsibility and
answerability for our actions.• Integrity: Moral excellence in service.• Teamwork: Coordinated commitment to
collaboration and working together toachieve a common goal.
These principles represent our commitmentto the people of Kenya, as we strive to improveour social accountability to them. They form thebasis of how we will monitor and review ourprogress against the priorities we will beimplementing.

10 Ministry of Public Health and Sanitation
z»
�
-1
ç
-
NO
2Â
o +oÞU
The nature of the interactions can besummarized as follows:• Policy development, strategic planning,
resource management, monitoring andevaluation– The Ministry of Medical Services– Development partners– Non-state health service providers (non-
government organizations, private not-for-profit and private for-profit healthcare providers)
– Quasi-formal working arrangements thatguide the linkages defined in the Codeof Conduct
• Implementation of programmes andinterventions– Not-for-profit health care service
providers (faith-based organizations –FBOs)
– Community organizations
• Management of public health service delivery– MOMS at provincial and district levels
in the coordination of health inter-ventions
– The Office of the President in financialmanagement through the districttreasury
– The community in the management ofhealth facilities and community pro-grammes (the Health Sector ServicesFund [HSSF] and the CommunityStrategy initiative)

11Strategic Plan 2008–2012
4Review of Health Sector Progressand Challenges
M OPHS health service deliveryinterventions at levels 1 to 3 of thehealth care system are based onthe Kenya Essential Package for
Health (KEPH) approach introduced in NHSSPII. The KEPH approach integrates healthprogrammes into a single package that focuseson interventions to improve health in each ofsix defined cohorts of the human developmentcycle, and to organize the delivery of servicesaround six well-defined levels of care (Figure 4.1).The idea is to develop synergy and mutuallyreinforce health care programmes.
The health sector has been reviewing itsperformance towards the achievement of NHSSPII targets and the MDGs through joint annualreviews and the midterm evaluation of NHSSPII. The review of the health sector progress andchallenges presented here is derived from thesereview reports. NHSSP II and KEPH, forexample, intended to take the health care systemto a new dimension – moving away from thelong-standing emphasis on curing disease to thepromotion of programmes and actions toimprove individual health. Significantly, the shiftintroduced a major focus at the community level(level 1).
4.1 Service Delivery OutputIndicators
During the first two years of implemen-tation of NHSSP II, performanceassessments show that progress towards
achieving the KEPH output targets (whichmostly are related to public health interventions)
Figure 4.1: KEPH levels of care – Communitiesare the foundation of the pyramid
Interface between community & formal health system
1Community: Village/households/families/individuals
6Tertiary
hospitals
2Dispensaries/clinics
3Health centres, maternities, nursing
homes
4Primary hospitals
5Secondary hospitals

12 Ministry of Public Health and Sanitation
z»
�
-1
ç
-
NO
2Â
o +oÞU
for a summary of the priority health sectorinterventions recommended by the MidtermReview1 of NHSSP II for acceleration in themedium term.
4.2 Service Delivery ImpactIndicators
Kenya continues to be burdened with thedouble epidemics of communicable(especially HIV/AIDS, malaria, TB and
pneumonia) and non-communicable diseases(cancer, hypertension, heart disease anddiabetes). Maternal mortality and childmorbidity and mortality remain a major publichealth problem. Despite the significant mile-stones that the country has attained, there havebeen few inroads in achieving the MDGs, asshown in Table 4.4.
Table 4.1: KEPH indicator targets for cohort 1
Indicators NHSSP II AOP 1 AOP 2 AOP 3 NHSSP IIbaseline achievement achievement achievement target2004/05 (2005/06) (2006/07) (2007/08) 2010
% WRA receiving family planning commodities 10% 13% 43% 37% 60%% ANC clients (4 visits) coverage 54% 56% 52% 39% 80%% Deliveries conducted by skilled attendant in
health facilities 42% 18% 37% 27% 90%% Newborns with low birth weight (less than 2,500g) 2% 6% 4%% HIV+ pregnant women receiving nevirapine (PMTCT) 10% 90,985 29% 8% 50%# Long-lasting insecticide treated bed nets (LLITNs)
distributed to pregnant women 55,000 362,345 445,497 549,466% ANC clients receiving IPT 2 4% 44% 40% 33%# Health facilities providing basic emergency
obstetric care (BEOC) 9 12 646 1,217
Source: AOP 1, 2 and 3 reports.
Table 4.2: KEPH indicator targets for cohorts 2 and 3
Indicators NHSSP II AOP 1 AOP 2 AOP 3 NHSSP IIbaseline achievement achievement achievement target2004/05 (2005/06) (2006/07) (2007/08) 2010
Early childhood 2 weeks – 5 years)% Children < 1 yr immunized against measles 74% 67% 80% 72% 95%% Children < 1 yr fully immunized 58% 59% 80% 70% 100%% Newborns receiving BCG 84% 96% 99% 78% 95%% Children <5 attending CWC and found underweight 9% 11% 7%% Children <5 attending growth monitoring services
(new visits) 20% 61% 54%% Children <5 receiving Vit A supplement 33% 15% 34% 44% 80%# LLITN distributed to children under 5 yrs 250,000 1,739,675 2,773,293 620,898Late childhood (6 to 12 years)% School children correctly dewormed at least
once in the planned period 25% 5% 43% 63% 80%
Source: AOP 1, 2 and 3 reports.
is good for cohorts 2–6, most notably inimproved immunization rates. In other areas,however, interventions are not progressing aswell as planned.
For cohort 1, performance has been poor andit is likely that the targets for this cohort will notbe achieved by the end of the NHSSP II imple-mentation period. Tables 4.1–4.3 summarize theannual achievements against the NHSSP IIbaseline and targets for the KEPH indicators forthe different cohorts. Refer to Annex A, as well,
The NHSSP II/KEPH Life-Cycle Cohorts
• Pregnancy and the newborn (up to 2weeks of age)
• Early childhood (2 weeks to 5 years)• Late childhood (6–12 years)• Youth and adolescence (13–24 years)• Adulthood (25–59 years)• Elderly (60+ years)

13Strategic Plan 2008–2012
4.3 Equitable Access toQuality Public HealthServices
If people can’t get to a health centre, or affordto pay for the service, they are not likely toseek health services. Access is thus a
prerequisite to high utilization of health servicesas it brings the services closer to the people.Access is influenced by geographical, economicand socio-cultural factors
4.3.1 Geographical AccessPoor distribution of facilities, poor road network,weak referral systems, insufficient communityhealth services and weak collaborations withother service providers all combine to reducegeographical access to health services. There areimbalances in geographical distribution of healthfacilities in different regions with under-servedareas, such as North Eastern, North Rift Valley,Nyanza and Eastern provinces.
Per the 2006 Norms and Standards for HealthService Delivery, the estimated infrastructurerequirement is: 6,425 community units, 3,313level 2 and 649 level 3 facilities to deliver KEPH.The gap for L1, L2 and L3 was 6,425, -169 and422, respectively. As a result of inadequatefunding, 86 health facility projects stalled andseveral others are not functional. In addition,1,600 health facilities that were developed underConstituency Development Fund (CDF) pro-grammes are not functional because of lack ofequipment, health workers and drugs. This
Table 4.3: KEPH indicator targets for cohorts 4, 5 and 6
Indicators NHSSP II AOP 1 AOP 2 AOP 3 NHSSP IIbaseline achievement achievement achievement target2004/05 (2005/06) (2006/07) (2007/08) 2010
# HIV+ patients started on ART 8,000 65,502 164,827 13,198# VCT clients 200,000 474,899 780,261 1, 071, 391# New outpatient (curative) visits 0.08 0.4 22,572,807 22,516,265# Over five years treated for malaria 4,824,691 5, 392, 672# Condoms distributed (million) 80,000,000 43,950,000 46,122,511 25,727,361TB cure rate 67% 75% 80% 82% 75%TB treatment completion rate (Sm+/DOTS) 80% 83% 81% 81% 88%# Community health workers trained 0 5,294 9,445# Functioning community health units 0 129 91# Houses sprayed with IRS 2,500 443,575 514,714 413,333
Source: AOP 1, 2 and 3 reports.
Table 4.4: Progress towards achievement of MDG targets
Baseline Achieved TargetsMDG objective / Proxy Indicators 2003/04 2004/05 2005/06 2006/07 2004/05 2005/06 2006/07
Reduce infant mortalityFully immunized <12 months (%) 57 57 61 72 65 67 70
Reduce maternal mortalityBirths attended by skilled personnel (%) 42 42 56 37 60 65 70
Reduce burden of diseaseInpatient malaria mortality (%) 30 26 18 17 16 15 14
Reduce HIV prevalenceHIV+ pregnant women 15–24 year attending ANC (%) 13 10 6.4 6.3 9.2 8.4 8
Adapted from Millennium Development Goals: Status Report for Kenya 2007.
The Millennium Development Goals
1.Eradicate extreme poverty and hunger.2.Achieve universal primary education.3.Promote gender equality and empower women.4.Reduce infant mortality.5.Improve maternal health.6.Combat HIV/AIDS, malaria and other diseases.7.Ensure environmental sustainability.8.Develop a global partnership for development.

14 Ministry of Public Health and Sanitation
z»
�
-1
ç
-
NO
2Â
o +oÞU
strategic plan envisions collaboration with thelocal communities, rehabilitation of the non-functional GOK facilities, operation of CDFfacilities and construction of new facilities aspossible interventions to increase access to healthservices.
4.3.2 Economic AccessPoor utilization of primary health care servicesat levels 2 and 3 is more often a result ofeconomic barriers to accessing care because oflow household income. High poverty levels (46%of Kenyans live below the poverty line) meanthat most households cannot afford to pay forhealth services. Although government intro-duced the 10/20 policy and free services forchildhood illnesses and maternity services atlevels 2 and 3, current public expenditure track-ing surveys have shown that the implementationof these initiatives is not adhered to and clientsare still paying for the free services or payinghigher fees rather than the 10/20 policy.However, piloting of an output-based approach(OBA), through provision of vouchers fordelivery, has shown to be successful in improvingaccess to maternity services.
4.3.3 Socio-Cultural AccessSocio-cultural barriers associated with lowliteracy levels, religious beliefs and gender bias
hinder access to healthservices, especially bywomen, children, ado-lescents, the disabled andother vulnerable groups.Recognizing this prob-lem, NHSSP II envision-ed making the provision
of health services more humane, compassionateand dignified.
Targeted measures include ensuring privacyin the course of service delivery, especially forwomen. The human rights approach will bepromoted in clinical settings, as well as estab-
lishing youth-friendly clinics and prioritizinggender issues.
4.4 Quality of Public HealthServices
Service delivery faces quality constraints onmany fronts: the low calibre of the humanresource, deteriorating facilities and equip-
ment, lack of drugs, and insufficient informationon which to base both policy and targetedresponses. Other factors that detract fromservice quality are insufficient standards andlack of enforcement of existing laws – which them-selves need to be updated. Quality challenges aresummarized in the following paragraphs;Annex B illustrates the root causes of theprevailing health problems and challenges.
4.4.1 Human ResourcesInadequate staffing levels, lack of appropriateskills, poor staff attitude, low morale and weaksupervision undermine the quality of publichealth services provided at the rural health faci-lities. There areregional dispari-ties in staff distri-bution.
The Normsand Standards forHealth ServiceDelivery esti-mated that todeliver KEPHservices, 321,253community health workers (CHWs) and 12,500community health extension workers (CHEWs)were required at level 1.
At level 2, requirements were set at 9,638health workers (6,425 nurses and 3,213 publichealth officers) and a similar number of supportstaff. At level 3, the estimated workforcerequirement was 21,418 health workers ofvarious cadres and 8,567 support staff. Acomparison with the existing staff reveals seriousshortages. Most affected are the CHWs, CHEWs,nurses and clinical officers, with vacancy ratesof 97%, 95%, 53% and 77%, respectively.
In the public sector there are 2,609 nurses atL3 and 2,913 nurses in L2, against a requirement
Socio-culturalbarriers:• Low literacy• Religious beliefs• Gender bias
Human resourceconstraints:• Inadequate numbers• Skills development• Mal-distribution of human
resource• Staff attitude• Low morale
Geographical access constraints:• Mal-distribution of facilities• Lack of funding• Poor road network• Poor coordination of infrastructure
development

15Strategic Plan 2008–2012
of 5,710 and 4,244 in L3 and L2, respectively.This translates to vacancy rates of 54% for L3and 31% for L2. The number of clinical officersin post is 600 against a requirement of 930, avacancy rate of 36%.
4.4.2 Health FacilitiesThe quality of service delivery is influenced bythe quality of the service delivery environment –
specifically, theavailability ofadequate and ser-viceable facilitiessuch as surgicaltheatres, exam-ination rooms,offices and staffhouses. Inade-quate facilitiesaffect staff moti-vation and ser-
vice quality. Poor preventive maintenance of exist-ing facilities is a major obstacle to service quality.
Suitability of facilities and maintenance area result of poor planning and lack of definedstandards for facilities, with the result that thereis a variety of different forms of facilities avail-able around the country. Among other issues,inadequate water and electricity suppliesjeopardize infection prevention and drugquality, while poor food storage threatensnutrition supplements. Facilities such as toiletsfor patients and incinerators for handling healthfacility waste (used dressings, tubings, placenta,etc.) affect the quality of services being offered.
4.4.3 EquipmentThere is general lack of basic medical equipmentto support service delivery in primary healthfacilities. Contributing to the lack of basic equip-ment are the absence of standard equipmentguidelines developed in line with the expectedfunctions and staffing requirements, inadequatesecurity guidelines and maintenance procedures,and low budgetary provisions for procurementand maintenance.
4.4.4 Drugs and SuppliesInterruptions in the supply of essential medicinesand medical and laboratory supplies negativelyaffect the quality of services offered at primaryhealth facilities. Weaknesses have been identifiedin the organizational setting, structures, compe-tencies, procedures for procurement, logisticsystem and prescribing practices.
4.4.5 Insufficient Evidence forDecision Making
An effective health management informationsystem (HMIS) contributes to service quality byproviding necessary information on healthdelivery for decision making. Unfortunately,surveillance and operation research is weak,especially at the district level, owing to lack ofpersonnel, structures, systems and budgetaryprovisions. Moreover, at present the countrylacks an integrated system to provide therequired information.
4.4.6 Quality Standards andGuidelines
Constraints relating to quality standards andguidelines include insufficient standards andguidelines, non compliance with existingstandards and guidelines, poor dissemination ofthe guidelines that do exist, and inadequatefacilitative supervision. The Service Charterdeveloped as one of the provisions of NHSSP IIhas not yet been fully disseminated and pro-moted among the general public so that clientsare fully aware of their rights and obligations.
4.4.7 Public Health LegislationNon compliance with public health legislationcontributes to the poor quality of services.Because of budgetary constraints, inspection andenforcement of existing laws have been weak.
4.5 Human ResourcesManagement System
Health care is a people-intensive activity.Effective management of the humanresource for health (HRH) aims to
ensure that adequate numbers of appropriatelyskilled and motivated workers are available to
Facility constraints:• Inadequate space and
room• Poor maintenance• Lack of privacy• Poor planning• Inadequate storage
space• Inadequate staff housing
Equipment constraints:• Lack of basic equipment• Lack of standard equipment guidelines• Poor maintenance

16 Ministry of Public Health and Sanitation
z»
�
-1
ç
-
NO
2Â
o +oÞU
deliver public health services. In order to meetthe numerical staffing requirements and toensure that staff are used optimally, a numberof HR policies and practices need to be in placeand operating effectively. These include HRinformation systems, recruitment, deployment,performance management, and training anddevelopment (including in-service training/continuous professional development).
4.5.1 HR Information SystemsThere is limited information available to informdecision making on HR planning, managementand development. Currently, Kenya has nodedicated HR information system and the HMISproduces limited information on HRH. Thequality of the information is also an issue; muchof the HR information is paper-based and of anadministrative/operational nature, which maymake it inappropriate and irrelevant for strategicdecision making. The HR information that isavailable is not utilized effectively and in somecases not at all. Even information generatedfrom recent studies is not widely available, hasnot been updated and is not being used for HRplanning. Unless health sector HR staff haveadequate capacity and skills, however, even thebest information will not be effectively used forstrategic HR planning. The current HR staff donot have this capacity. There is therefore a needto improve the consolidation, quality, consis-tency and utilization of HR information.
4.5.2 Recruitment and DeploymentMOPHS is a new ministry, and many of the postson the staff establishment are vacant. Currently,procedures and processes for recruitment anddeployment are sparse if they exist at all. In 2006,the former Ministry of Health developed normsand standards based on 2003 populationnumbers (workforce projections). These did nottake into consideration regional variations anddisease burdens and were not disaggregated bytype of provider.
The current authorized establishment for thehealth ministry has not been reviewed for overten years and preceded the scale up of HIVservices and the renewed commitment toachieving the MDGs. Thus it should be informedby the recommendations of the 2008 joint taskforce review, which looked at the currentestablishment and current needs. Moreover, the
current establishment is an aggregate, hencedoes give a regional breakdown of differentcadres nor does it take into account the level ofeducation attained by the staff. One result is thatregional distribution depends on administrativedecisions, thus the mal-distribution. There isneed for MOPHS to develop its recruitment anddeployment policy, quantify the norms andstandards, and revise the staff establishment. Ofnote is that an HRH strategic plan is currentlyunder development as a joint effort of the twohealth ministries. (Refer to Annex C for abreakdown of the staff requirements andestablishment.)
4.5.3 Staff DevelopmentThere will be a greater need for education,training and development initiatives to matchthe increased staff and to equip the staff withnew and relevant skills (technical, leadership,management and supervisory) to deliverservices. Currently, skill levels need strengthen-ing to enable staff to do more than one job (multi-skill). Post-basic and in-service trainingopportunities are not well coordinated ormanaged. Individual health workers often seektraining for their own personal development,and this may or may not conform withorganizational needs to improve performanceand address service requirements.
4.5.4 HR Planning and ManagementThe success of any plan to improve humanresources will hinge on the capacity to plan for,manage and develop the workforce. Capacity isneeded within MOPHS to develop a strategicapproach for HRH issues in addition to the cur-rent functioning, which is basically administrative.
The current task of establishing a newministry provides an ideal opportunity fordefining the HR functions required by theMinistry and identifying the most appropriatestructures, systems and capacity for carryingthem out. But a strong case for a stronger, morestrategic HR function needs to be made.
4.5.5 Staff Performance SystemsGiven staff shortages, it is critical thatperformance and productivity of all availableworkforce be effectively managed and support-ed. The National Performance Framework (NPF)institutionalizes the results-based management

17Strategic Plan 2008–2012
approach adopted by Kenya’s public service andwill hold institutions and individuals account-able for service delivery and achievement oftargeted results. In addition, the Government hasapproved for implementation a new perform-ance appraisal system (PAS) for the publicservice. This development will help to strengthenperformance management systems, both facilityand individual. Support will be required,however, for the effective introduction andinstitutionalization of the PAS at all levels.
4.5.6 Salaries, Attrition and StaffDistribution
Effective pay and compensation systems arerequired to attract and retain staff, especiallycritical staff for under-served and other hardshipareas (for example, Tana Delta, North EasternProvince [NEP]).
4.6 The Health Infrastructure
Infrastructure in the health sector refers tothree main components: buildings andequipment, both medical and non-medical;
transport; and information and communicationtechnology (ICT).
4.6.1 Buildings and EquipmentCurrently, the quality of buildings andequipment at headquarters, some of theprovincial and district health offices, and theprimary health facilities is poor. The key issuesaffecting realization of the required infra-structure include:• Lack of a defined standards for infrastruc-
ture and equipment in the Ministry, resultingin different forms of buildings and equip-ment, some of which are substandard.
• Poor maintenance of buildings and equip-ment, leading to malfunctioning of a largeproportion of them.
• Poor maintenance of infrastructure as aresult of lack of a comprehensive mainte-nance plan, absence of written guidelines ormanuals on infrastructure maintenance,inadequate budget allocation for mainte-nance of infrastructure or security of equip-ment items, and inefficient disposal of nonfunctioning equipment.
• Absence of a master plan on health facilityconstruction and rehabilitation, whichresults in unequal distribution of healthfacilities and haphazard construction of newhealth facilities, especially through the CDF.
4.6.2 Transport SystemAn efficient transport system is very importantin the delivery of health services. Reliabletransportation enables patients, commoditiesand staff to be available at places of servicedelivery. The performance of the system dependson the availability of vehicles that are suitablefor the intended purpose and the controlmechanisms that are put in place.
With the split of MOH, all ambulancevehicles belong to MOMS. But most of theseambulances lack four-wheel drive, are low basedand poorly equipped, and thus not suitable forthe rural areas where most of the primaryfacilities (levels 2–3) are. There is need to haveproperly equipped and rural terrain friendlyambulances. For areas that are not accessible byvehicles, other forms of ambulances such asmotor boat and “motorcycle ambulances” needto be provided. Currently there are three motorboat ambulances serving Lamu, Bondo andSuba. The use of motorcycle ambulances forreferral of maternity cases is being piloted inNyanza Province.
MOPHS has a total of 323 utility vehicles (12at HQ, 221 at provincial and district levels, and99 with national programmes). The gap isestimated to be 161 four-wheel drive vehiclesand 2 seven-tonne lorries. There are 300 motor-cycles and 3,000 bicycles. An additional 3,000motorcycles and 140,000 bicycles will berequired for the period of this plan. Annex Dshows the overall transport needs at all levels.
In order to support the appropriate use ofvehicles, there is need to have a transport policyin place that defines the rationale for thenumbers, types and distribution of vehicles need-ed and guides the preventive maintenance andtransport control systems throughout theMinistry.
4.6.3 Information and CommunicationTechnology (ICT)
Increasingly in this communication era, the useof modern modes of communication is vital toany organization. The Government has

18 Ministry of Public Health and Sanitation
z»
�
-1
ç
-
NO
2Â
o +oÞU
developed an ICT policy whose strategies willto be implemented by all Government depart-ments. For MOPHS to implement the strategyof e-government, a health sector ICT policy,additional hardware and software, and capacitybuilding of IT staff and users will be required.There will also be need to improve networkconnectivity, automation, inter-operability andintegration of the different information systemsin the Ministry. Areas with poor networkcoverage will need to have UHF radios and V-Sat and other new technologies in order toenhance connectivity. The number of staffrequired to run and maintain ICT systems needsto be reviewed and the gap filled.
4.7 Public Finance Manage-ment System (PFMS)
This system is responsible for efficientexecution of the budget, ensuring that the
funds available are timely, transparentlyaccounted for and used for the purpose intended.
4.7.1 BudgetCurrently, there are challenges in budgeting.There is no programme budget managementsystem, and some budget items such aspersonnel and commodities are not disaggre-gated by levels of care. In an attempt to addressthis, a process of developing a “functionalbudget” has been adopted, but this basicallyduplicates work. To avoid this duplication, areview of the formal budget classifications andformats in order.
The feeling is that the current budgetingprocess is not very well linked to the planningprocess. There is therefore need to revisebudgeting and planning formats and timeframesto ensure linkages of these two processes.
Moreover, budget release to districts is notefficient. Dispersal of funds to district healthoffices is done by the central Ministry officethrough the Treasury in the form of an authorityto incur expenditure (AIE). The districts areusually not informed about the final approvedbudgets and have to operate on the basis of theirquarterly AIEs. The AIEs are approved late andsometimes are not followed by availability offunds in the district accounts. The provincial and
district health offices are not allocated fundingin the current budget. Primary health facilitieshave been allocated financial resources foroperation and maintenance, as is the case withlevels 4 and 5. The facilities rely on handouts ofsupplies from the district level. It is importanttherefore to ensure that the new initiative torelease funding from headquarters directly toprovincial, district and primary health facilitiesis implemented.
4.7.2 Financial Information SystemThe Government-approved integrated financialmanagement information system (IFMIS) hasnot been rolled out in MOPHS. As a result,management of the financial information thatis critical for accountability and expenditurecontrol remains a challenge. There is thereforeneed to accelerate the implementation of theIFMIS in the Ministry.
For the public financial system to work, it isnecessary to address the current staff shortagein finance and accounting departments atheadquarters, provincial and district levels. Inaddition, the capacity of existing staff needs tobe enhanced with up-to-date knowledge, skillsand tools of the trade.
4.8 Health Management Infor-mation System (HMIS)
HMIS serves the entire health sector andtherefore strengthening of healthinformation is a key priority for the two
health ministries. NHSSP II provides policy andstrategic directions for the development of acomprehensive national HMIS, and manyassessment reports have been carried out on howto improve the HMIS. Despite the attention,however, there is currently no substantial finan-cial allocation to support this system from theMinistry. Furthermore, the culture of infor-mation use is not fully embraced in the healthsector.
On the other hand, some progress is beingmade in laying the groundwork for a usefulsystem. Review, harmonization and adoption ofhealth sector indicators have been finalized inline with the data requirements of the two healthministries with the aim of reducing the data

19Strategic Plan 2008–2012
transaction costs. Data requirements, summarytools and data capture tools (registers) have beenrevised and distributed for use.
As for the human resource, 572 healthrecords and information officers (428 HRIT and144 HRIOs) with two-year (certificate) and three-year (diploma) training, respectively, arepresently serving in the health system. Yet thisnumber amounts to only 11% (572 against 4,882staff complement), which is far below therequirement.
The key challenge is to beef up the currentlow investment levels to ensure full implementa-tion and sustainability of strategies. Suchinvestment is needed in the areas of financial,equipment and human resource capacity. Thereare equally many opportunities that can bemaximized to improve the HMIS, especiallyutilization of ICT to improve communication anddata transfer with most of the districts andservice delivery points. These efforts shouldinclude rationalizing the different databasemanagement software and taking to scale astandard model for information management inthe health sector. Such initiatives are ongoing toimprove the performance of HMIS.
4.9 Procurement and Commo-dity Logistics ManagementSystems (General)
S ince 1997, a series of reforms has beenmade to streamline public procurement inorder to reduce corruption and improve
value for money and efficiency in servicedelivery. The main weaknesses in the procure-ment system are:• Poor procurement planning, stemming from
the fact that there are no annual plans.• Loose links with budgets.• Delays in procurement processes often
arising from poor documentation, flawedbids or proposed evaluations, and protracteddecisions for contract award.
• Low capacity of procurement staff (both innumbers and in competence).
• Weak oversight.• Lack of adequate equipment and working
tools (computers, procurement manuals,guidelines).
In the Roadmap for Acceleration of Implemen-tation of Interventions to Achieve Objectives NHSSPII, the main priorities in strengtheningprocurement systems included the establishmentof functional procurement committees at alllevels, development of the annual medium-termprocurement plan, and capacity building of theprocurement units with adequate and skilledstaff including provision of appropriate tools ofthe trade. The Roadmap also emphasizes thedevelopment of procurement tracking systemsthat will show the efficiency and effectivenessof the procurement system.
To ensure proper management of procuredgoods, it is also important for efficient storesmanagement systems to be put in place. Thisincludes logistics management informationsystems for medical supplies.
4.10 Policy Planning
Policy and planning have experienced,competent, innovative staff withcapacities in results-based management.
There are limitations, however, especiallystemming from high staff turnover, lack ofbudgetary provision in the MTEF budget andinadequate staff numbers. But, there areopportunities such as deepening of public servicereforms, existence of an evolving performancemanagement and accountability framework,goodwill from development partners to establishmonitoring and evaluation (M&E) systems andevolving budget processes towards programmeand outcome-based budgets. Among the threatsare inadequate financial and technical resourcesand weak sector-wide linkages, particularly withrespect to ICT use in M&E.
4.11 Partnership
NHSSP II realizes that partnership is themain vehicle through which the plan’stargets can be achieved as it allows all
health sector stakeholders to collaborate andcoordinate their actions, recognizing each one’sspecific responsibilities. Towards that end, since2005, the following initiatives have been ongoing

20 Ministry of Public Health and Sanitation
z»
�
-1
ç
-
NO
2Â
o +oÞU
in the sector to strengthen coordination and col-laboration, as part of the sector-wide approach(SWAp) to the health sector reform agenda:• Joint planning• Joint performance monitoring and eval-
uation• Joint financing• Use of common management arrangements• Strengthening sector leadership at all levels
of the health system• Institutionalization of partnership structures
at all levels of the health system• Institutionalization of governance structures
at all levels
The main outputs that have been achievedsince 2005 are:• Joint sector planning and performance
monitoring are now firmly in place.• Partnership and governance structures are
in place and functioning at all levels of thehealth system.
• The code of conduct (COC) for the SWApwas developed and signed by health sectorstakeholders.
• Leadership and management capacitybuilding for top and mid level managers isunder way.
While there has been remarkable progress inthe implementation of most of these initiatives,movement has been slow on implementingstrategies aimed at joint financing and the useof common management arrangements.
Since Kenya has subscribed to theInternational Health Partnership, which is toensure implementation of the Paris Declarationon Aid Effectiveness, MOPHS needs to fosterpartnership of all stakeholders involved infinancing, implementing and utilizing publichealth and sanitation services.
As such, there is need for the Ministry tocontinue with strengthening of joint planning,performance monitoring and financing of publichealth and sanitation services; capacity buildingon leadership at all levels of the health system;and partnership and governance structures atall levels of the health system. Special attentionand effort need to be given to implementingstrategies or interventions that would enablejoint financing and the use of commonmanagement arrangements for public healthand sanitation services. There is also need to put
in a place a mechanism for assessing compliancewith the COC by all the signatories.
4.12 Financing Public HealthServices
Mobilization of adequate resources forimplementing the activities identifiedin the strategic plan is critical to our
ability to achieve the overall goal of reducingpreventable ill-health among the people ofKenya. This section of the plan assesses pasttrends in financing of preventive health servicesin the country and forecasts resource needswithin the strategic plan period. The links amongthe three strategic thrusts and with the six sub-programmes in the MTEF budget for publichealth and sanitation are established.
An analysis of trends in MOH expendituresover the last three years indicates that publichealth expenditures increased from Ksh6.09billion in 2005/06 to Ksh7.6 billion 2006/07, butdeclined to Ksh6.9 billion in 2007/08.
During the last four years, overall recurrentexpenditures averaged slightly more than Ksh4billion. Whereas budget estimates for develop-ment expenditure have been at around Ksh8billion per year, actual absorption of thoseresources has been around Ksh3 billion annually.Recurrent spending has therefore been consis-tently higher than development expenditure.
The share of personnel emoluments has beenat approximately 16.5% of total recurrent expen-diture in the past three years. This percentageunderstates the amount of money used to payworkers in MOPHS, however, since around2,000 workers – especially community healthnurses – are still reflected as being paid from theMinistry of Medical Services. Procurement ofdrugs accounts for approximately 30% of therecurrent budget.
Cost-sharing revenue has varied betweenKsh1 billion and 1.5 billion over the last threeyears and has provided a useful source ofrevenue for operating health facilities, especiallylevels 2 and 3.
Table 4.5 and Figure 4.1 summarize the trendof recurrent and development expenditures.These are disaggregated according to categoryin Table 4.6.

21Strategic Plan 2008–2012
4.13 Review of Public HealthExpenditures, 2005/06–2007/08
Further breakdown of the expenditures interms of public health programmes andthose that provide a fundamental link to
the operation of the strategic plan is shown inTable 4.7.
During the implementation of this strategicplan, health care financing is expected to besignificantly and positively influenced by theMTEF, through which resources will continuebeing allocated to Ministries through MTEFsectors. To that extent, various initiatives arebeing implemented – especially the Health SectorServices Fund (HSSF), output-based approach(OBA) and the Joint Programme of Work andFunding (JPWF) – that are anticipated toenhance access to health financial resources bythe poor and vulnerable. Full operation of aNational Health Insurance Fund in the courseof the plan period is expected to further easehouseholds’ expenditure shocks attributed to theburden of disease.
One of the major looming challenges forMOPHS is the prospect of low funding levels asa result of hard budget constraints. The shortageof necessary resources is likely to be aggravatedby effects of the worldwide financial crisis,which is contributing to depressed economicperformance as the global financial meltdownpercolates into the country’s systems. Thesechallenges will be addressed through furtherausterity measures and a tightening of financialgovernance systems to enhance integrity and
Table 4.5: Ministry of Public Health and Sanitation: Gross actual expenditure (Ksh million)
Original budget estimates Actual expenditure 2005/06 2006/07 2007/08 2005/06 2006/07 2007/08
Recurrent (Ksh million) 4,350 4,726 4,018 4,013 4,191 4,182Development (Ksh million) 7,166 7,232 9,170 2,076 3,360 2,753Total (Ksh million) 11,517 11,958 13,187 6,088 7,551 6,935Recurrent as % of total MOPHS expenditure 37.8 39.5 30.5 65.9 55.5 60.3Development as % of total MOPHS expenditure 62.2 60.5 69.5 34.1 44.5 39.7Total (%) 100.0 100.0 100.0 100.0 100.0 100.0
Table 4.6: Analysis of total recurrent MOPHSexpenditures by category (Kshmillion)
Category Actual expenditure2005/06 2006/07 2007/08
Salaries and other personnel 1,111 1,026 1,044as % total recurrent 27.7 24.5 25.0
Transfers, subsidies and grants 854 881 967as % total recurrent 21.3 21.0 23.1
Drugs and medical consumables 1,261 1,287 1,668as % total recurrent 31.4 30.7 39.9
Other operations and maintenance 535 786 465as % total recurrent 13.3 18.8 11.1
Purchase of plant and equipment 252 211 38as % total recurrent 6.3 5.0 0.9
Total recurrent (gross) 4,013 4,191 4,182% 100.0 100.0 100.0
Figure 4.2: Public health expenditure trends, 2005/06–2007/08 (Ksh million)

22 Ministry of Public Health and Sanitation
z»
�
-1
ç
-
NO
2Â
o +oÞUaccountability in resource use throughout thepublic health system. To further this objective,work has commenced on the development of ahealth financing strategy.
Table 4.7: Core poverty programmes by expenditure category in the Ministry, 2005/06–2007/08 (Kshmillion)
Priority programme Expenditure by category (Ksh million)Recurrent expenditure non-wage Development expenditure
2005/06 2006/07 2007/08 2005/06 2006/07 2007/08
National AIDS/STD Control Programme 17.4 18.8 34.3 0.0 0.0 0.0Environmental health services 188.4 279.9 312.4 3.4 30.7 0.0Communicable and vector-borne diseases 127.7 94.7 41.8 8.2 3.7 0.0Nutrition programme 14.4 13.7 13.2 0.4 0.0 0.0Family planning, maternal/child health care 10.8 38.4 77.8 0.0 0.0 0.0Rural health centres and dispensaries 2,796.8 2,688.2 2,712.6 522.1 1,770.2 655.8Rural health training and demonstration centres 84.8 95.8 84.9 0.0 0.0 0.0Drug control inspectorate 1.2 1.0 0.2 0.0 0.0 0.0National leprosy and tuberculosis services 18.5 23.1 14.5 0.0 0.0 0.0Integrated rural health services 0.0 0.0 0.0 197.7 5.8 0.0KEPI 42.7 242.6 0.0 0.0 0.0 0.0Specialized global fund – HIV/AIDS 0.0 0.0 0.0 706.6 198.1 382.0Special global fund – TB 0.0 0.0 0.0 129.3 126.9 68.8Special global fund – malaria 0.0 0.0 0.0 199.4 1,206.6 1,111.6
Past expenditure trends in the operation of public health activities show that financing of rural health centres and dispensaries, environ-mental health services, communicable and vector-borne diseases, and the Kenya Expanded Programme on Immunization (KEPI) havetaken the lion’s share of the overall MOPHS budget. This trend is not anticipated to change during the implementation of the MTP.
Chapter Notes
1 Ministry of Health, 2007, NHSSP II Midterm Review Report,and Roadmap for Acceleration of Implementation ofInterventions to Achieve the Objectives of NHSSP II, Nairobi,Kenya.
23Strategic Plan 2008–2012
5Strategic Model
T he model on which this plan wasbased provides for a series of broadstrategic thrusts, each one with its ownset of goals, objectives, and targets.
Because the Ministry’s mandate focuses on thecommunity and the health services closest to thecommunity, the emphasis is on public service.
5.1 Strategic Thrusts for PublicHealth and Sanitation
Five strategic thrusts define the priority areasMOPHS will address in the years 2008–2012. These priority areas are in line with
the First Medium-Term Plan 2008–2012 andNHSSP II and are derived from the situationalanalysis presented above in Chapter 4 of thisstrategic plan. The five strategic thrusts are:1. Strategic thrust 1: Improving equitable
access to public health and sanitation services2. Strategic thrust 2: Improving the quality and
responsiveness of public health andsanitation services
3. Strategic thrust 3: Improving efficiency ofpublic health and sanitation services
4. Strategic thrust 4: Fostering partnerships
The plan’s five strategic thrusts hingeon MOPHS principles and values:• People first• Social justice and equity• Partnership and collaboration• Result oriented• Professionalism• Accountability• Integrity• Teamwork
5. Strategic thrust 5: Improving financing ofpublic health and sanitation services
The linkages of these strategic thrusts withthe health goals of NHSSP II, MTP and Vision2030 are illustrated in Figure 5.1.
5.2 ImplementationFramework for Achievingthe Strategic Priorities
I n what follows, each of the five broadstrategic thrusts is broken down by specificgoals and the strategies for achieving the

24 Ministry of Public Health and Sanitation
z»
�
-1
ç
-
NO
2Â
o +oÞU
Figure 5.1: MOPHS strategic thrusts and links to Kenya Vision 2030, MTP and NHSSP II
p
Overarching development vision(Vision 2030)
A globally competitive and prosperous nation with a high quality of life
Sector Medium-Term GoalReduce health inequalities and to reverse the downward
trend in health-related outcome and impact indicators
Strategic objective 1Increase equitableaccess to healthservices
Strategic thrust 1Improving equitableaccess to public healthand sanitation services
Strategic objective 2Improve quality and theresponsiveness ofservices in the sector
Strategic thrust 2Improving quality andresponsiveness ofpublic health andsanitation services
Strategic objective 3Foster partnerships inimproving health anddelivering services
Strategic thrust 3Improving efficiency ofpublic health andsanitation services
Strategic objective 4Improve the efficiencyand effectiveness ofservice delivery
Strategic thrust 4Fostering partnership
Strategic objective 5Improve thefinancing of thehealth sector
Strategic thrust 5Improving financing tothe Ministry of PublicHealth and Sanitation
Health Sector Policy Objectives
Ministry of Public Health and Sanitation Strategic Thrusts
p
p
goals. A brief explanation for the rationale foreach thrust is given, while a series of tables sum-marizes the goals, strategies, yearly indicatorsand targets, and annual projected costs.
5.2.1 Strategic Thrust 1: ImprovingEquitable Access to Public Healthand Sanitation Services
As noted earlier, geographical, economic andsocio-cultural barriers can be formidableobstacles to people’s ability to access publichealth and sanitation services. To improveaccess, this thrust outlines the specific goals andstrategies itemized below.
1.1) Increase the proportion of communitiesthat live within 5 km of a functionalhealth facility from 52% to 62%, by:1.1.1) Carrying out GIS mapping for
development of a policy and stra-tegy (norms and standards) forinvesting in health infrastructure,
1.1.2) Increasing the number of func-tional public health facilities by 480for level 3 and 300 for level 2:– Rehabilitation of 100 non-
functional GOK and 100 CDFlevel 2 facilities.
– Construction of 100 new level 2facilities.
– Rehabilitation of 160 non-func-tional GOK and 160 CDF level 3health facilities.
– Construction of 160 additionalnew level 3 health facilities.
1.1.3) Designing and implementing inno-vative public health serviceapproaches for special groups (e.g.,pastoralist communities) at 120nomadic, mobile and congregatesettings,
1.1.4) Adding and operating 40 nomadicclinics, 40 mobile clinics and 40stand-alone clinics, and
1.1.5) Implementing a comprehensiveschool health programme.
1.2) Increase the proportion of deliveriesconducted by skilled attendants from42% to 60%, by:1.2.1) Implementing the Community
Strategy by establishing 2,550community units,
1.2.2) Strengthening the referral system,1.2.3) Training CHWs and improving
communication, e.g., using mobilephones, and

25Strategic Plan 2008–2012
Targets against each strategy (outputs)
Cost in Ksh ’000 Goals for 2012 (outcome indicators)
Strategies (including flagship projects)
Target description
Unit
Yr 1 08/09
Yr 2 09/10
Yr 3 10/11
Yr 4 11/12
Yr 1 08/09
Yr 2 09/10
Yr 3 10/11
Yr 4 11/12
GIS mapping conducted
1 20,000 0 0 0 Carrying out GIS mapping for develop-ment of a policy and strategy for investing in health infrastructure
investment policy and strategy developed
Doc 1 5,000 0 0 0
Non functional GOK facilities operating
No 65 65 65 65 853,722 853,722 853,722 853,722 Increasing number of functional public health facilities
CDF facilities operating
No 65 65 65 65 853,722 853,722 853,722 853,722
New facilities constructed
No 65 65 65 65 1,517,134 1,517,134 1,517,134 1,517,134
Nomadic clinics
No 10 20 30 40 80,000 80,000 80,000 80,000
Outreach/ mobile clinics
No 10 20 30 40 80,000 80,000 80,000 80,000
Increase the proportion of commu-nities that live within 5 km of func-tional health facility from 52% to 62%
Designing and imple-menting innovative approaches for special groups to access public health services
Clinics in congregate settings
No 10 20 30 40 80,000 80,000 80,000 80,000
Implementing comprehen-sive school health programme
Schools imple-menting com-prehensive school health programme
No 300 800 1,300 1,800 90,000 165,000 180,000 195,000
Scaling up Community Strategy nationally
Functional community units
No 300 1,050 1,800 2,550 1,029,534 2,573,835 2,573,835 2,573,835 Increase proportion of deliveries by skilled attendants from 42% to 60%
Strengthen-ing level 1 and 2 referral system
Level 2 facili-ties with communica-tion system
No 500 1,500 2,500 3,500 5,000 15,000 25,000 35,000
Scaling up strategies for demand creation
Identified strategies in operation
Docs 2 2 2 2 20,000 20,000 20,000 20,000
Total Strategic Thrust 1 4,634,112 6,238,413 6,263,413 6,288,413
1.2.4) Scaling up strategies for demandcreation by implementing twoidentified strategies annually (e.g.,strengthening the capacity ofCHWs including TBAs to playdesignated roles including promo-tion of skilled attendance atdelivery; strengthen communitylevel institutions such as VillageHealth Committees to increase
Table 5.1: Results framework for Strategic Thrust 1 – Increasing equitable access to public healthservices
demand for RH services at level 1,identifying and providing orientationfor community midwives to createawareness and offer skilled attend-ance at delivery at level 1).
Table 5.1 summarizes goals, strategies,indicators and targets for thrust 1 on increasingaccess to public health services.

26 Ministry of Public Health and Sanitation
z»
�
-1
ç
-
NO
2Â
o +oÞU
5.2.2 Strategic Thrust 2: Improving theQuality and Responsiveness ofMOPHS Services
A wide range of specific interventions forimproving the quality and responsiveness ofpublic health and sanitation services is proposed.As summarized in Table 5.2, the following goals,with corresponding strategies, are set for thisthrust:
2.1) Reduce the vacancy rate of technicalstaff by 40%, by:2.1.1) Recruiting 23,645 new health
workers: 7,385 to fill existingvacancies and another 16,260 to fillvacancies arising from the rehabili-tation of GOK and CDF facilities,and the addition of new facilities,and
2.1.2) Identifying 321,426 CHWs toprovide services at the communityunits.
2.2) Increase the health workforce trained to40,255 staff by 2012, by carrying out atraining needs assessment anddeveloping a training programme.
2.3) Rehabilitate and adequately equip 50%of level 2 and 3 and other public healthfacilities, by:2.3.1) Renovating 2,262 health facilities
(1,788 level 2 and 474 level 3) andprocuring equipment, and
2.3.2) Conducting annual preventivemaintenance in all level 2 and 3health facilities.
2.4) Reduce proportion of facilities reportingno stock outs by 100%, by maintainingadequate stock levels of medicines, com-modities and supplies through measuressuch as proper forecasting, timelyprocurement and efficient distribution.
2.5) Increase sanitation coverage from 46%to 66%, by:2.5.1) Implementing the environmental
and hygiene policy and strategy,2.5.2) Constructing 32,000 demonstra-
tion pit latrines in public insti-tutions annually, with an equal
number of rural waste disposalmethods (compost pits) for repli-cation, and
2.5.3) Mobilizing 350,000 households topractise hand washing with soapin the same period.
2.6) Increase the number of householdsutilizing safe water by 20% bypromoting use of treated water athousehold level, by:2.6.1) Working with other sector partners
to promote use of treated water by1,700,000 households at the end offive years, and
2.6.2) Working with communities toidentify and protect/treat commu-nal water supply sources, e.g.,springs, wells, catchment surfaces(roofs, rocks, dams, pans) andwater treatment at household levelusing approved chlorine-basedcompounds.
2.7) Increase the number of facilities withhealth care waste management systemsfrom 20% to 100%, by:2.7.1) Identifying a central regional
facility and providing an incinera-tor, as well as providing appropri-ate transport to collect waste fromthe satellite facilities, and
2.7.2) Implementing health care wasteguidelines and training staff onsame.
2.8) Increase client satisfaction by 50% in2,408 health facilities, by:2.8.1) Reviewing, developing and imple-
menting standards and guidelines,2.8.2) Implementing KQM model,2.8.3) Implementing ISO 9001, and2.8.4) Scaling up implementation of the
Citizens’ Charter in those facilities.
2.9) Reduce the incidence of food-bornediseases/illnesses by 5%, by:2.9.1) Finalizing, disseminating and
implementing food safety policyand strategy, and
2.9.2) Ensuring compliance with Cap 254and 242.

27Strategic Plan 2008–2012
2.10) Reduce mortality rate due to emergencyto below 1/10,000 persons at risk perday.
2.11) Increase the utilization of cost-effectivereproductive health services by 50%.
2.12) Increase the utilization of cost-effectivechild health care services by 50%, by:2.12.1) Increasing the capacity of level 2
and 3 facilities to provide integratedmanagement of childhood illness(IMCI) services, and
2.12.2) Increasing the proportion of child-ren receiving immunizationservices.
2.13) Reduce new HIV infections by 50% byscaling up behaviour change initiativesat community/household level.
2.14) Increase TB case detection and treat-ment to 90% by increasing the capacityof level 2 and 3 to diagnose and treat.
2.15) Reduce malaria incidence to 15% byutilizing cost effective control measuressuch as LLITNs and indoor householdspraying.
2.16) Reduce the incidence of malnutrition ofchildren <5 years by 20% by providingVitamin A supplements to 100% of allthose eligible.
Continued
Table 5.2: Results framework for Strategic Thrust 2 – Improving quality and responsiveness of PublicHealth and Sanitation services
Targets against each strategy (outputs)
Cost in Ksh ’000 Goals for 2012 (out-come indicators)
Strategies (including flagship projects)
Target description
Unit
Yr 1 08/09
Yr 2 09/10
Yr 3 10/11
Yr 4 11/12
Yr 1 08/9
Yr 2 09/10
Yr 3 10/11
Yr 4 11/12
Reduce the vacancy rate by 40%
Recruiting new staff
New staff recruits
No 5,911 11,822 17,733 23,645 2,277,240 5,238,131 8,789,100 12,986,512
Increase trained health work-force by 100%
Building staff capacity
Trained health workers
No 6,059 14,485 26,178 40,235 151,475 362,125 654,450 1,005,950
Renovating facilities and procure equipment
Rehabilitated facilities
No 529 1,058 1,660 2,262 4,441,697 4,761,843 5,081,988 5,402,134 Rehabilitate and ade-quately equip 50% of level 2, 3 and other public health facilities
Carrying out preventive maintenance of facilities and equip-ment
Maintained facilities
No 529 1,058 1,660 2,262 418,109 874,302 1,369,043 1,901,866
Maintaining adequate stock levels of medi-cines, com-modities, and supplies
Facilities with no stock out
No 1,103 2,272 3,511 4,822 15,025,558 18,628,516 23,186,925 28,817,581
Districts with functional system
No 10 20 35 50 253,540 253,540 380,311 380,311
Reduce proportion of facilities reporting stock outs by 100%
Scaling up establish-ment of integrated surveillance and response system
Districts with labs upgraded to perform tests on diseases of public health importance
No 10 20 35 50 45,000 46,000 46,000 46,000

28 Ministry of Public Health and Sanitation
z»
�
-1
ç
-
NO
2Â
o +oÞU
Table 5.2, continued: Results framework for Strategic Thrust 2
Continued
Targets against each strategy (outputs) Cost in Ksh ’000 Goals for 2012 (out-come indicators)
Strategies (including flagship projects)
Target description
Unit
Yr 1 08/09
Yr 2 09/10
Yr 3 10/11
Yr 4 11/12
Yr 1 08/9
Yr 2 09/10
Yr 3 10/11
Yr 4 11/12
Reduce proportion of facilities reporting stock outs, continued
Scaling up establishment of integrated surveillance and response system, continued
Districts with capa-city to detect and respond to public health emer-gencies
No 10 20 35 50 189,000 173,000 177,200 179,300
Improving HMIS and CHMIS capacity
Facilities with reporting capacity
No 500 100 1,500 2,000 50,000 50,000 50,000 50,000
Strengthening operational research
Operations research activities
No 5 5 5 5 100,000 120,000 140,000 150,000
Households with latrines
No 161,000 322,000 483,000 644,000 322,000 322,000 322,000 322,000
Households with waste disposal system
No 161,000 322,000 483,000 644,000 322,000 322,000 322,000 322,000
People practising hand-washing hygiene
No 350,000 700,000 1,050,000 1,400,000 35,000 35,000 35,000 35,000
Provinces with mapped pollution sources
No 2 4 6 8 20,000 20,000 20,000 20,000
Premises inspected for compliance
No 1,000 2,000 3,000 4,000 10,000 10,000 10,000 10,000
Jigger infested households fumigated
No 1,000 2,000 3,000 4,000 20,000 20,000 20,000 20,000
Increase sanitation coverage from 46% to 66%
Implementing the environ-mental and hygiene policy and strategy
Vector and vermin breeding sites controlled
No 1,000 2,000 3,000 4,000 20,000 20,000 20,000 20,000
Increase the number of households utilizing safe water by 20% by promoting use of treated water at household level
Improving water safety at household level
Households using treated water
No 161,000 322,000 483,000 644,000 322,000 322,000 322,000 322,000
Increase the number of facilities with health care waste man-agement systems from 20% to 100%
Implementing health care waste guidelines
Facilities with proper health care waste systems
No 630 1,260 1,890 2,520 12,600 12,600 12,600 12,600

29Strategic Plan 2008–2012
Continued
Table 5.2, continued: Results framework for Strategic Thrust 2Targets against each strategy
(outputs) Cost in Ksh ’000 Goals for
2012 (out-come indicators)
Strategies (including flagship projects)
Target description
Unit
Yr 1 08/09
Yr 2 09/10
Yr 3 10/11
Yr 4 11/12
Yr 1 08/9
Yr 2 09/10
Yr 3 10/11
Yr 4 11/12
Reduce the incidence of food-borne diseases/ illnesses by 5%
Finalizing and implementing food safety policy and strategy
Premises implementing HACCP and its prerequi-sites (SOPs and SSOPs)
No 1,000 2,000 3,000 4,000 10,000 10,000 10,000 10,000
Premises inspected for compliance
No 1,000 2,000 3,000 4,000 10,000 10,000 10,000 10,000 Ensuring compliance with Cap 254 and 242
Non compli-ance cases prosecuted
No 10 20 30 40 10,000 10,000 10,000 10,000
Pregnant women attending at least four ANC visits
% 60 70 80 90 66,000 77,000 88,000 99,000
Women delivering under skilled attendants
% 50 60 70 80 305,000 366,000 427,000 488,000
Increase the utiliza-tion of cost-effective RH services by 50%
Increasing capacity of level 2 and 3 facilities to provide RH services
Contracep-tive use
% 50 60 70 80 1,850,000 2,220,000 2,590,000 2,960,000
Facilities providing treatment using IMCI guidelines
% 25 35 45 55 293,720 308,406 323,826 340,017 Increase the utiliza-tion of cost-effective child health care services by 50%
Increasing capacity of level 2 and 3 facilities to provide IMCI and other child health care services
Children <1 yr fully immu-nized
% 60 80 90 100 0 1,091,936 1,146,533 1,203,860
Communica-tion strategy in place
No 1 0 0 Reduce new HIV infections by 50%
Scaling up behaviour change and community/ household interventions
HIV+ preg-nant women using PMTCT
% 40 50 60 70 0 61,238,130 183,714,390 0
Number of people counselled and tested for HIV
No 4,141,937 5,382,662 5,596,119 0 289,167 375,764 0
Proportion of HIV+ preg-nant women receiving ARV for prophylaxis
% 66 70 75 80 0 57,717 95150 0
Scaling up coverage of core of HIV prevention interventions
Number of males cir-cumcised across all regions for HIV preven-tion
No 20,000 150,000 200,000 20,000 0 61,238 183,714 0
MDR centre in place
No 1 2 5 5 60,000 60,000 300,000 300,000 Increase TB case detection and treatment to 90%
Increasing capacity of level 2 and 3 facilities to diagnose and treat TB
Cases detected
% 70 81 82 83 2,100 2,300 2,500 2,700

30 Ministry of Public Health and Sanitation
z»
�
-1
ç
-
NO
2Â
o +oÞU
5.2.3 Strategic Thrust 3: Improve theEfficiency of Public Health andSanitation Services
From the situation analysis, a number of crosscutting issues and challenges can be identifiedthat thwart the efficiency of the public healthsupport systems. These include:• Inadequate support staff at provincial and
district levels, as well as at levels 1 and 2 (mal-distribution in some areas, e.g., Tana Delta).
• Inadequate ICT at all levels.• Inadequate knowledge and skills of support
staff.• Inadequate transport for coordination/
facilitation/supervision.• Inadequate funds.• Inadequate office equipment.• Weak inventory management system/lack of
planning/implementation.• Poor attitude towards work/Motivation.
The following goals and strategies areproposed to counter these challenges andimprove the workings of the support systems:
Targets against each strategy (outputs)
Cost in Ksh ’000 Goals for 2012 (outcome indicators)
Strategies (including flagship projects)
Target description
Unit
Yr 1 08/09
Yr 2 09/10
Yr 3 10/11
Yr 4 11/12
Yr 1 08/9
Yr 2 09/10
Yr 3 10/11
Yr 4 11/12
Increasing pro-vision of sup-plements and therapeutic feeds
Children < 5 receiving Vitamin A supplement
% 60 80 90 100 163 164 167 170 Reduce the incidence of malnutrition in children <5 years by 30% Reviewing,
developing and implementing standard guidelines
Facilities implementing guidelines
No 602 1,204 1,806 2,408 150,500 150,500 150,500 150,500
Implementing KQM
Facilities imple-menting KQM
602 1,204 1,806 2,408 150,500 150,500 150,500 150,500 Increase client satisfaction by 50% in 2,408 health facilities
Implementing ISO 22000
Facilities imple-menting ISO
No 602 1,204 1,806 2,408 150,500 150,500 150,500 150,500
Scaling up im-plementation of Citizens Charter
Facilities imple-menting Citizen Charter
No 602 1,204 1,806 2,408 150,500 150,500 150,500 150,500
Create an efficient and effective emer-gency and disaster manage-ment mechanism
Finalizing development of disaster management policy
Policy in place Doc 1 10,000 0 0 0
Constituting and training disaster response teams
Disaster response teams
No 10 20 30 40 100,000 200,000 300,000 400,000
Ensure L2 and 3 have smooth operations and maintenance
Provide O&M funds to level L2 and 3
Primary health facilities (L2&3)
No 4,142 4,142 4,352 4,352 3,380,000 3,380,000 3,380,000 3,380,000
Total Strategic Thrust 2 28,219,482 35,926,759 45,756,998 56,718,124
Table 5.2, continued: Results framework for Strategic Thrust 2
3.1) Reduce the staff vacancy rate by 60%, by:3.1.1) Recruiting 43,965 support staff,3.1.2) Developing recruitment and de-
ployment policy,3.1.3) Revising Ministry’s staff establish-
ment for new posts, and3.1.4) Revising norms and standards to
suit MOPHS needs.
3.2) Increase the proportion of staff trainedas per government policy by 50%.
3.3) Increase the proportion of employee jobsatisfaction by 90%, by:3.3.1) Decentralizing HR functions to
provinces and districts,3.3.2) Instituting incentives for staff retention,3.3.3) Enhancing opportunities for staff
promotions,3.3.4) Providing office space and fittings,
and3.3.5) Developing human resource
capacity.

31Strategic Plan 2008–2012
3.4) Increase the availability and utilizationof ICT by 60%, by:3.4.1) Improving capacity of staff in ICT,3.4.2) Providing Internet connectivity and
networking to all levels, and3.4.3) Establishing linkages and data
warehouses incorporating infor-mation from IFMIS, HRIS, LMIS,HMIS, etc.
3.5) Improve the utilization of transportservices by 50%, by:3.5.1) Developing a transport policy
(improve the transport system),3.5.2) Increasing the vehicle fleet –
Automobiles, motorboats, motor-bikes and bicycles, and
3.5.3) Improving the quality of auto-mobiles.
3.6) Increase the availability of tracer drugsto 90% at SDPs.
3.7) Achieve 100% disposal of obsolete,unserviceable and surplus assetsannually.
3.8) Increase the reporting rates of healthfacilities/districts providing qualityhealth information by 30% at all levelsfor evidence-based decision making, by:3.8.1) Providing data capture and sum-
mary tools at all health facilities,
3.8.2) Utilizing ICT in health informationto strengthen data managementcapacity (collection, analysis,computerization and use) at alllevels,
3.8.3) Scaling up establishment of inte-grated surveillance and responsesystems,
3.8.4) Establishing a community-basedhealth management informationsystem (CBHMIS),
3.8.5) Strengthening operational research,and
3.8.6) Coordinating PM&E, HMIS andIDSR information sources.
3.9) Strengthen the management andavailability of general supplies, by:3.9.1) Developing annual procurement
plans, and3.9.2) Decentralizing the procurement
systems to provincial and districtlevels and facilities.
3.10) Strengthen the financial managementsystems, by:3.10.1) Operating HSSF (to address the
25% policy issue),3.10.2) Strengthening capacity in financial
management at all levels,3.10.3) Improving data capture on PFM,
and3.10.4) Introducing IFMIS at all levels.
Table 5.3 summarizes the goals, strategies,indicators and targets for thrust 3 on improvingthe efficiency of public health services.
Continued
Targets against each strategy (outputs)
Cost in Ksh ’000 Goals for 2012 (out-come indicator)
Strategies (including flagship projects)
Target description
Unit Base-line
Yr 1 08/09
Yr 2 09/10
Yr 3 10/11
Yr 4 11/12
Yr 1 08/9
Yr 2 09/10
Yr 3 10/11
Yr 4 11/12
Developing recruitment and deploy-ment policy
Policy document
No 1 0 0 0 0 Reduce vacancy rate by 60%
Developing Ministry-specific staff establishment
Approved staff estab-lishment
No 1 0 0 0 0
Table 5.3: Results framework for Strategic Thrust 3 – Improving efficiency of public health andsanitation services
ICT will be applied at all levels to supportdecision making and strengthen datamanagement capacity – collection,analysis, computerization and use.

32 Ministry of Public Health and Sanitation
z»
�
-1
ç
-
NO
2Â
o +oÞU
Targets against each strategy (outputs)
Cost in Ksh ’000 Goals for 2012 (out-come indicator)
Strategies (including flagship projects)
Target description
Unit Base-line
Yr 1 08/09
Yr 2 09/10
Yr 3 10/11
Yr 4 11/12
Yr 1 08/9
Yr 2 09/10
Yr 3 10/11
Yr 4 11/12
Approved staff norms and standards
No 1 0 0 0 0 Revising norms and standards to suit MOPHS
Support staff employed (technical) employed
No - 7,626 12,113 12, 113 12,113 3,453 5,000 5,200 5,400
Support staff trained
- 3948 5,061 6174 7287 98,700 126,525 154,350 182,175 Increase proportion of staff trained per gov-ernment training policy by 50%
Strengthening capacity of staff
Technical staff trained
- 3,678 14,678 25,678 36,678 213,324 366,950 641,950 916,950
Enhancing opportunities for staff promotions
Staff promotions
- - 1,185 1,185 1,185 11,850 12,324 12,817 13,330
Awards at HQ 3 3 3 3 60 60 60 60 Instituting incentive awards
Awards at province
3 3 3 3 60 60 60 60
Increase the pro-portion of employee job satis-faction to 90%
Awards at district
3 3 3 3 100 100 100 100
Awards at facility level
5 5 5 5 60 60 60 60
Providing office space and fittings (improve the working environment)
Adequate office space at all levels
215 60 155 100 20,000 5,000 8,000 10,000
Improving staff capacity in ICT
Support of staff trained on ICT
No 500 1,500 2,500 3,000 5,000 1,5000 2,500 3,000 Increase availability and use of ICT by staff by 60%
Technical staff trained on ICT
% 3 3 4 4 600 1,000 1,200 1,600
Facilities with VSAT installed
% 8 10 20 45 2,000 4,100 5,100 Providing In-ternet connec-tivity and networking to all levels
LAN set up % 20 40 50 3,000 5,400 6,900
Harmonizing linkages of automation systems (HRIS, HMIS, LMIS, IFMIS) at all levels
Systems automated
4 - 4 - 5 76,000 76,000 76,000 76,000
Developing and dissemi-nating trans-port policy
Policy in place
No 1 - - - - 1,500 500 500
Increase the vehicle fleet
No 632 150 30 30 30 50 50 50 0
Improve provision and utili-zation of transport services by 50%
Improving the transport system Motorboats No 3 1 1 1 - 8,000 8,000 8,000 0
Motorbikes No 300 1500 400 400 400 20,000 20,000 20,000 20,000 Bicycles No 3,000 35,000 35,000 35,000 35,000 10,000 10,000 10,000 10,000 Improving
vehicle quality Vehicles maintained
No - 80 80 80 80 20,000 20,000 20,000 20,000
Strengthening the referral system
Ambulance purchased
No - 150 20 10 100,000 100,000 100,000 100,000
Table 5.3, continued: Results framework for Strategic Thrust 3
Continued
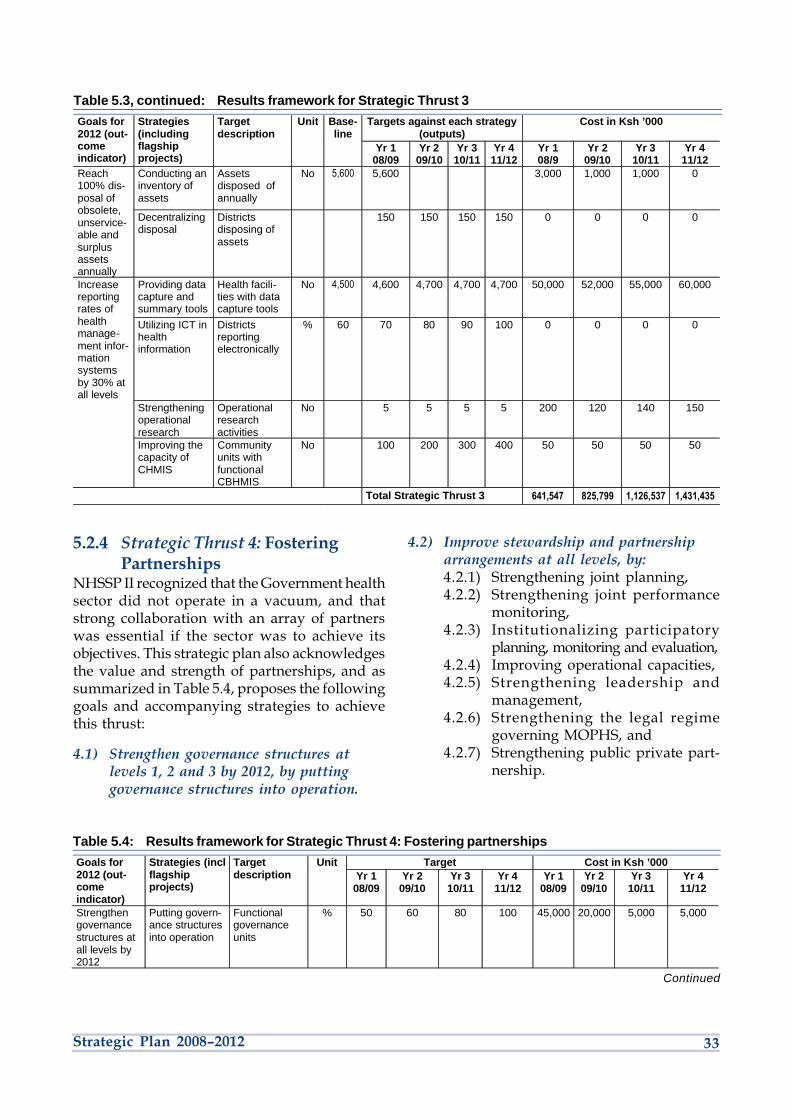
33Strategic Plan 2008–2012
Targets against each strategy (outputs)
Cost in Ksh ’000 Goals for 2012 (out-come indicator)
Strategies (including flagship projects)
Target description
Unit Base-line
Yr 1 08/09
Yr 2 09/10
Yr 3 10/11
Yr 4 11/12
Yr 1 08/9
Yr 2 09/10
Yr 3 10/11
Yr 4 11/12
Conducting an inventory of assets
Assets disposed of annually
No 5,600 5,600 3,000 1,000 1,000 0 Reach 100% dis-posal of obsolete, unservice-able and surplus assets annually
Decentralizing disposal
Districts disposing of assets
150 150 150 150 0 0 0 0
Providing data capture and summary tools
Health facili-ties with data capture tools
No 4,500 4,600 4,700 4,700 4,700 50,000 52,000 55,000 60,000 Increase reporting rates of health manage-ment infor-mation systems by 30% at all levels
Utilizing ICT in health information
Districts reporting electronically
% 60 70 80 90 100 0 0 0 0
Strengthening operational research
Operational research activities
No 5 5 5 5 200 120 140 150
Improving the capacity of CHMIS
Community units with functional CBHMIS
No 100 200 300 400 50 50 50 50
Total Strategic Thrust 3 641,547 825,799 1,126,537 1,431,435
Table 5.3, continued: Results framework for Strategic Thrust 3
5.2.4 Strategic Thrust 4: FosteringPartnerships
NHSSP II recognized that the Government healthsector did not operate in a vacuum, and thatstrong collaboration with an array of partnerswas essential if the sector was to achieve itsobjectives. This strategic plan also acknowledgesthe value and strength of partnerships, and assummarized in Table 5.4, proposes the followinggoals and accompanying strategies to achievethis thrust:
4.1) Strengthen governance structures atlevels 1, 2 and 3 by 2012, by puttinggovernance structures into operation.
4.2) Improve stewardship and partnershiparrangements at all levels, by:4.2.1) Strengthening joint planning,4.2.2) Strengthening joint performance
monitoring,4.2.3) Institutionalizing participatory
planning, monitoring and evaluation,4.2.4) Improving operational capacities,4.2.5) Strengthening leadership and
management,4.2.6) Strengthening the legal regime
governing MOPHS, and4.2.7) Strengthening public private part-
nership.
Target Cost in Ksh ’000 Goals for 2012 (out-come indicator)
Strategies (incl flagship projects)
Target description
Unit Yr 1
08/09 Yr 2
09/10 Yr 3
10/11 Yr 4
11/12 Yr 1
08/09 Yr 2
09/10 Yr 3
10/11 Yr 4
11/12
Strengthen governance structures at all levels by 2012
Putting govern-ance structures into operation
Functional governance units
% 50 60 80 100 45,000 20,000 5,000 5,000
Continued
Table 5.4: Results framework for Strategic Thrust 4: Fostering partnerships

34 Ministry of Public Health and Sanitation
z»
�
-1
ç
-
NO
2Â
o +oÞU
Target Cost in Ksh ’000 Goals for 2012 (out-come indicator)
Strategies (incl flagship projects)
Target description
Unit Yr 1
08/09 Yr 2
09/10 Yr 3
10/11 Yr 4
11/12 Yr 1
08/09 Yr 2
09/10 Yr 3
10/11 Yr 4
11/12
Annual oper-ational plan
No 1 1 1 1 52,500 55,125 57,881 60,775
Ministerial strategic plan (2008–2012)
Doc 1 - - - 20,000 - - -
Kenya Health Policy Frame work (2010–2025)
Doc - 1 - - 5,000 17,500 - -
Improve coordina-tion, stew-ardship and partnership arrange-ments at all levels
Strengthen-ing joint planning
NHSSP III (2010–2015)
Doc - 1 - 5,000 22,500 - -
Annual per-formance review reports
No 1 1 1 1 10,000 10,500 11,025 11,576
COC monitored
No 1 1 1 1 500 500 500 500
Strengthen-ing joint performance monitoring
Ministerial strategic plan midterm and end term reviews
No 1 1 - 22,000 - 22,500
Developing and institu-tionalizing joint financing
JFA No - 1 - - - 3,180 - -
Strengthen-ing leader-ship and management
Capacity building for leadership and manage-ment at all levels
No 600 600 600 600 50,751 60,000 60,500 70,000
Strengthen-ing the legal regime governing MOPHS
Public Health Act reviewed
No 1 5,000
Strengthen-ing public-private partnership
PPP policy Doc - 1 - - - 12,500 - -
Total Strategic Thrust 4 188,751 223, 805 139, 906 170, 351
Table 5.4, continued: Results framework for Strategic Thrust 4
5.2.5 Strategic Thrust 5: ImprovingFinancing of Public Health andSanitation Services
The strategic thrusts articulated in this plan areoutstanding concerns identified by the Ministrywith considerable effect on governance andfinance. This component on improving financingof the public health and sanitation services hasbeen broken down into three goals and variousstrategies to achieve the desired results. The goalsand their corresponding strategies are:5.1) Ensure all facilities receive financial
resources based on needs by 2012, by:5.1.1) Allocating financial resources
based on needs, and
5.1.1) Fostering pro-poor financingmechanisms.
5.2) Increase efficiency in utilization ofresources, by:5.2.1) Improving budget management
and efficient and equitable resourceallocation and distribution,
5.2.2) Rolling out the operation of HSSF,5.2.3) Institutionalizing OBA, and5.2.4) Developing cost containment
measures.
5.3) Increase financial resources to MOPHSby 20% over a period of five years, by:5.3.1) Tapping into NHIF benefit package,

35Strategic Plan 2008–2012
Targets against each strategy (outputs)
Cost in Ksh ’000 Goals for 2012 (out-come indicator)
Strategies (including flagship projects)
Target descrip-tion
Unit
Yr 1 08/09
Yr 2 09/10
Yr 3 10/11
Yr 4 11/12
Yr 1 08/9
Yr 2 09/10
Yr 3 10/11
Yr 4 11/12
Allocating resources based on needs
Facilities allo-cated resources according to needs
No 4,142 4,142 41,342 41,342 3,000 4,000 5,000 6,000 Ensure that financial resources to all facilities are based on needs by 2012
Fostering pro-poor financing mechanisms
Financial resources allo-cated for pro- poor health care
% 100 100 100 100 5,000 6,000 6,000 7,000
Improving budget compliance
Allocated funds used for intend-ed purpose
% 100 100 100 100 2,500 3,000 4,000 5,000 Increase efficiency in utilization of resources
Operating HSSF
Health facilities receiving alloca-tions through HSSF
% 0 20 20 30 0 150,000 10,000 12,000
Institution-alizing OBA
Increased pro-portion of Ministry alloca-tion to OBA
% 0 0 1 2 5,000 8,000 12,000 12,000
Costing services
Service delivery levels using costing instrument
% 0 20 40 70 1,000 1,000 1,000 1,000
Developing cost contain-ment mechan-isms and instruments
Compliance with budget require-ments
% 100 1100 100 100 1,000 1,000 1,000 1,000
Tapping into NHIF benefit package
Health facilities receiving alloca-tion through HSSF
No 50 70 80 99 1,000 1,000 1,000 1,000
Resources from NHIF to Ministry PHS
% 10 20 30 40 0 0 0 0
Increase financial resources to MOPHS by 20% over a period of five years
Increasing GOK budgetary allocation to the Ministry
% 1 4 6 10 0 0 0 0
Enhancing resource mobilization
Resources mobilized from development partners
% 18 20 22 25 1,000 5,000 4,000 4,500
Resources mobilized from devolved funds
% 5 20 40 50 100 200 400 500
Total Strategic Thrust 5 19,600 179,200 44,400 50,000
5.3.2) Increasing GOK allocation to theMinistry,
5.3.3) Mobilizing resources from devel-opment partners, and
5.3.4) Mobilizing resources from devolvedfunds.
Table 5.5: Results framework for Strategic Thrust 5: Improving financing of public health and sanita-tion services
Table 5.5 presents the results framework forstrategic thrust 5 on improving financing ofpublic health services. The table summarizes thegoals, strategies, indicators and targets that areproposed.

36 Ministry of Public Health and Sanitation
z»
�
-1
ç
-
NO
2Â
o +oÞU 6Coordination Framework
Structures and mechanisms forcoordinating collaboration across the twoministries have been elaborated at alllevels of the sector. Thus MOPHS willuse the existing sector coordinationframework to coordinate theimplementation of this ministerialmedium-term plan.
Effective coordination of health sectoractivities is recognized as key to efficienthealth care systems and to the provisionof quality services. It is for this reason
that NHSSP II clearly spelt out coordinationstructures at the different levels as a componentof the SWAp. These structures have alreadybeen institutionalized and are functioning, andboth MOPHS and MOMS have agreed tocontinue using them for coordinating all healthsector stakeholders. The structures are describedbelow and illustrated in Figure 6.1.
Nevertheless, several priority areas ingovernance and partnership structures requirestrengthening during the strategic plan period.To be addressed individually and jointly by thetwo ministries, these are:• Ensuring that the partnership structures are
functioning adequately at all the levels ofcare: national Health Sector CoordinatingCommittee (HSCC), Provincial HealthStakeholders Forum (PHSF), District HealthStakeholders Forum (DHSF), DivisionalHealth Stakeholders Forum (DIVHSF) andthe community health committee (CHC).
• Defining the framework to guide pooledfunding arrangements (Joint Financing
Agreements) and commence implementa-tion.
• Completing the framework for aligningfunding from all partners (shadow budget).
• Strengthening the process of monitoringadherence to the Code of Conduct.
• Accelerating the articulation of public–private partnership policy.
• Undertaking comprehensive leadership andmanagement training for all managersespecially at subnational levels.
• Scaling up measures of social accountabilitytowards clients of health services.

37Strategic Plan 2008–2012
Figure 6.1: Ministry of Public Health and Sanitation coordination structure
Roles Structures Stewardship
Policy level
Policy level
Technicalstrategicdirection
Support system
Joint Interagency Coordinating Committee(JICC)
Technical Stakeholders Forum
Provincial Health Stakeholders Forum
Minister’s Office
Permanent Secretary
Director of PublicHealth & Sanitation
Provincial Director ofPublic Health &
Sanitation
Health Sector Coordinating Committee(HSCC)
GIC & other subcommittees
p
p
p
q
q
District Health Stakeholders Forum
Health Facility Committee
District MedicalOfficer of Health
q
Developmentpartners
MMU
Implementingmanagement
p
q
p
q
p
Health FacilityIn-Charge
Community Health Committeeq
u
u
u
u
u
u
u
uuu u
Implementingpartners
u
t
t
t
t
t
t
6.1 Coordination Structures atthe National Level
MOPHS will use the existing sectorgovernance and coordination frame-work to facilitate the implementation
of this strategic plan. Structures and mechanismsfor coordinating collaboration across the twohealth ministries have been elaborated at alllevels of the sector, and most are already inoperation. The main coordination organs atnational level comprise both joint activities bythe two ministries and activities that are specificto MOPH, as described below.
6.1.1 Joint Inter Agency CoordinatingCommittee (JICC)
This is the cross-sector coordination structurewhose key role is to provide political and policydirection, thereby ensuring that the sector isworking towards achieving the policy objectivesset out in Vision 2030 and the MTPs. Themembers of the committee meet under theleadership of the Minister of Medical Servicesand the Minister of Public Health and Sanitationas conveners. The Permanent Secretaries for bothministries serve as the secretariat.

38 Ministry of Public Health and Sanitation
z»
�
-1
ç
-
NO
2Â
o +oÞU
6.1.2 Health Sector CoordinatingCommittee (HSCC)
The overall strategic coordination of theimplementation of this strategic plan will beundertaken through the Health Sector Coor-dinating Committee (HSCC). The main role ofthis committee is to ensure that the ministerialstrategic plan is implemented to achieve thehealth sector policy objectives. Meetings of theHSCC are co-chaired by the PermanentSecretaries of MOMS and MOPHS on a rotation-al basis. Sector partners will participate in bothJICC and HSCC.
6.1.3 Technical StakeholdersCommittee (TSC)
Technical coordination of the implementation ofthe ministerial strategic plan will be undertakenby the Technical Stakeholders Committee. Itsrole will be to ensure that the strategies beingimplemented are contributing towards theachievement of the specific strategic goals of thisstrategic plan. Two or more technical stake-holder committees may cooperate to addresscross-cutting technical issues in both ministries.Meetings of the TSC will be co-chaired by theDirectors of MOMS and MOPHS on a rotationalbasis.
6.1.4 Ministerial Management Unit(MMU)
This unit is the secretariat to the MinisterialManagement Committee. The main task of thisunit is to monitor the implementation of theministerial strategic plan.
6.2 Coordination Structures atthe Subnational Level
At subnational levels separate governanceand coordination organs will facilitateprovincial and district operations of the
strategic plan. The various forums and commit-tees will coordinate delivery of health careservices for all partners within their areas ofjurisdiction.
6.2.1 Provincial Health StakeholderForum (PHSF)
Provincial level coordination will be through theProvincial Health Stakeholders Forum. Thisstructure will coordinate all issues within itscontribution jurisdiction. It will be chaired bythe Provincial Director of Public Health andSanitation.
6.2.2 District Health StakeholderForum (DHSF)
The main role of this forum will be to managethe implementation of the plan and strengthencollaboration among all stakeholders in a districton health-related issues. The forum will bechaired by the District Medical Officer of Health.
6.2.3 Health Facility Committee (HFC)The committee’s main role will be to manage theimplementation of priority public healthinterventions. It will be chaired by the healthfacility in-charge
6.2.4 Community Health Committee(CHC)
Greater ownership by the community will beachieved through the community healthcommittee and the individual Health FacilityCommittee.

39Strategic Plan 2008–2012
7MOPHS became fully operational in
July 2008 following the definitionof its structures and priorities.Being newly created, the Ministry
will continue to work to improve its operationsand functioning at all levels.
The immediate focus for improvingoperations of the Ministry will be:1. Identifying competent persons to fill all the
posts within the management structure inorder to have the required managementcapacity needed to carry out the respectivemandates of the different units in thestructure.
2. Articulating performance targets for eachunit in the management structure, in linewith the Government’s results-based
Capacity
management framework, to ensure that theunits are clear about the performanceexpected of them in terms of their mandates.
7.1 Management Structureand Functions at theNational Level
The mandate assigned to MOPHS consistsof public health and sanitation policy,preventive and promotive health services,
and community health services. The particularfocus is on service delivery at KEPH levels 1–3.
Among the specific functions are healtheducation, reproductive health, food quality andhygiene, quarantine administration, vectorcontrol, health inspection, and other publichealth services. The parastatals and semi-autonomous government agencies under theMinistry include KEMRI and the RadiationProtection Board. All these functions arereflected in the organogram illustrated in Figure7.1. The key management positions at nationallevel are described below.
Performance targets for each unit in themanagement structure, in line with theGovernment’s results-basedmanagement framework, will help toensure that the units are clear about theperformance expected of themaccording to their mandates.

40 Ministry of Public Health and Sanitation
z»
�
-1
ç
-
NO
2Â
o +oÞU
Key
: H
MIS
= H
ealth
man
agem
ent
info
rmat
ion
syst
em;
HR
D =
Hum
an r
esou
rces
dev
elop
men
t; H
RM
= H
uman
res
ourc
es m
anag
emen
t; IC
T =
Info
rmat
ion
and
com
mun
icat
ions
tec
hnol
ogy;
KE
MR
I =
Ken
ya M
edic
al R
esea
rch
Inst
itute
; M
MU
= M
inis
teria
l Man
agem
ent
Uni
t; P
RO
= P
ublic
Rel
atio
ns O
ffice
.
MIN
ISTE
R
AS
SIS
TAN
T M
INIS
TER
PE
RM
AN
EN
T S
EC
RE
TAR
Y
Dir
ecto
r o
f Pu
blic
Hea
lth
& S
anit
atio
n
Inte
rnat
ion
alH
ealt
hD
isa
ste
rP
rep
are
d-
ne
ss
&R
es
po
ns
e
Tec
hn
ical
Pla
nn
ing
&P
erf
orm
an
ce
Mo
nit
ori
ng
Dis
ease
Co
ntr
ol
Fam
ily H
ealt
hS
anit
atio
n &
En
viro
nm
enta
lH
ealt
h
Hea
lth
Pro
mo
tio
nP
rim
ary
Hea
lth
Se
rvic
es
Nat
iona
l Pub
licH
ealth
Lab
s
Vec
tor-
Bor
ne &
Neg
lect
edD
isea
ses
AID
S/S
TI C
ontro
l
Tub
ercu
losi
s,Le
pros
y &
Lun
gD
isea
ses
Mal
aria
Con
trol
Non
-Com
mun
i-ca
ble
Dis
ease
s
Dis
ease
Sur
veill
ance
and
Res
pons
e
Rep
rodu
ctiv
eH
ealth
Chi
ld a
ndA
dole
scen
tH
ealth
Imm
uniz
atio
nS
ervi
ce
Vec
tor
& V
erm
inC
ontr
ol
Pol
lutio
n C
ontro
l&
Hou
sing
Occ
upat
iona
lH
ealth
Food
Qua
lity
&S
afet
y
Hea
lth C
omm
uni-
catio
n &
Soc
ial
Mar
ketin
g
Pol
icy
Adv
ocac
y&
Stra
tegi
cA
llian
ces
Set
tings
Pro
gram
me
Hea
lthA
dmin
istr
atio
n
Com
mun
ityH
ealth
Ser
vice
s
Com
mod
ities
&S
uppl
ies
Sta
ndar
ds &
Qua
lity
Ass
ura
nce
Hea
lth F
acili
tyS
ervi
ces
Nut
ritio
n
San
itatio
n
Por
t H
ealth
Wat
er S
afet
y
PRO
ICT
HR
M
Fin
ance
Acc
ount
s
Pro
cure
men
t
HR
D
Gen
eral
Adm
inis
trat
ion
Tec
hnic
alP
lann
ing
HM
IS &
Mon
itorin
g
Sec
tor
Coo
rdin
atio
n &
Par
tner
ship
s
Res
earc
hC
oord
inat
ion
&R
efor
mIm
plem
enta
tion
Aud
itM
MU
Rad
iati
on
Pro
tect
ion
Bo
ard
KE
MR
ID
irec
tor
of A
dm
inis
trat
ion
Pre
vent
ive
Oph
thal
mic
Ser
vice
s
Gov
ernm
ent
Che
mis
t
Pla
nnin
g &
Pol
icy
Fig
ure
7.1
: Min
iste
rial
str
uct
ure
at n
atio
nal
leve
l

41Strategic Plan 2008–2012
7.1.1 Office of the PermanentSecretary
The Permanent Secretary has the responsibilityof oversight of the overall operations of theMinistry. In executing these functions he will besupported by the Director of Public Health andSanitation, the Director of Administration,Principal Accounts Controller, Chief FinanceOfficer, and Director of Human Resources.Besides these, the Audit Department and theMMU provide additional support to the
Permanent Secretary through their respectivemandates.
7.1.2 Office of the Director of PublicHealth and Sanitation (DPHS)
The office of the DPHS is responsible for thetechnical operations of the Ministry. Sevendepartments provide support to and are directlyunder the supervision of the DPHS. The mandateand functions of the departments and divisionsunder the DPHS are shown in Table 7.1.
Technical department Divisions FunctionsDisease Prevention Non-Communicable Disease Design and promote strategies that reduce risk of disease as aand Control result of lifestyle or exposure to known health hazards.
Malaria Control Design and promote strategies for individual, family or communitypractices that prevent exposure to malaria infection, for ecologicalvector control and for early treatment for malaria.
Tuberculosis and Leprosy Control Design and implement strategies for reducing the risk of TB and leprosyinfection; improve case detection and effective treatment as well assurveillance for drug resistance.
Vector-Borne and Neglected Promote practices that prevent vector-borne infections, promoteDisease early case detection and effective treatment; advocate for and mobilize
resources for neglected diseases and infections.National Public Health Laboratory Develop laboratory services for public health investigations and disease
diagnosis at levels 1, 2 and 3.Government Chemist Support forensic services and toxicological investigationsPreventive Ophthalmology Design strategies for the prevention of eye infections, effective eye
care and effective treatment of eye diseases.Disease Surveillance Design disease surveillance systems, early warning systems and
support to management of disease outbreaks.
Family Health Reproductive Health Develop policies, strategies and interventions that are responsive tosexual and reproductive health needs of individuals, adolescents,families and communities.
Child and Adolescent Health Develop policies, strategies and interventions for the promotion of childhealth, prevention of diseases affecting children and adolescents, andeffective treatment and care for children and adolescents.
Nutrition Promote nutritional practices that maintain health and strategies forappropriate supplementation.
Immunization Promote strategies for high coverage in routine immunization andintegration of new vaccines into the public health schedule.
Health Promotion Health Communication Develop the Community Strategy and its effective implementation;support other departments and programmes to effectively communicatehealth messages.
Policy Advocacy Develop and advocate for health polices that are responsive to theneeds of individuals, families and communities; champion a rightsapproach to health.
Settings programmes Increase access to effective health promotion interventions withininstitutions; build capacity of institutions to respond to health challenges.
Environmental Health Sanitation and Hygiene Reduce health risks arising from inadequate sanitation.and Sanitation Food Quality Protect consumers’ health by ensuring that food produced,
distributed, marketed and consumed meets required standards of foodsafety and quality.
Water Safety Protect consumers’ health by ensuring water safety.Occupational Health Protect people against ill health arising from daily activities in the
workplace.Pollution Control and Housing Reduce factors that contribute to poor housing and environmental
pollution.Vector and Vermin Control Ensure control of all disease vectors and vermin in vessels, households
and the environment in line with Cap 242.Port Health Reduce disease transmission through ports of entry including airports,
seaports and frontier posts.
Continued
Table 7.1: Functions of departments and divisions under the office of the DPHS

42 Ministry of Public Health and Sanitation
z»
�
-1
ç
-
NO
2Â
o +oÞU
Primary Health Provincial Health Services Coordinate and oversee the delivery of public health and sanitationservices in the country; support decentralization of service planning andprovision; monitor and evaluate service delivery.
Community Health Services Scale up implementation of the Community Strategy; mobilize resources,monitor and evaluate quality of community-based health care services.
Facility Health Services Provide public health services at levels 1, 2 and 3, support the referralsystem, implement quality assurance strategies, assess quality of careand user satisfaction.
Commodities and Supplies Ensure availability of commodities (drugs, non-pharmaceuticals andmedical equipment/devices) at primary health levels.
Standards and Quality Assurance Coordinate M&E and formulate standards
Disaster Preparedness Disaster Prevention and Risk Establish early warning systems, coordinate response and resourceand Response Reduction mobilization; provide tools and guidelines for prediction; build capacity.
Emergency Preparedness Carry out disaster mapping; database development and emergencyand Response coordination and management.Surveillance, Monitoring, Develop and install surveillance systems, thresholds and evaluationEvaluation and Research systems; carry out surveillance and operations research.
International Health International Health Coordinate regional and international strategies and interventions,enhance implementation of international health protocols.
Technical Planning Technical Planning Provide technical guidance to other departments in the developmentand Monitoring of short-, medium- and long-term plans and performance monitoring
reports; coordinate AOP planning, joint M&E, sector policy development.HIMS and Monitoring Collect and collate all relevant information including research relevant for
planning of service delivery and the supporting systemsSector Coordination and Coordinate stakeholders to ensure that the delivery of public healthPartnership and sanitation services is harmonized; develop the public health and
sanitation reform agenda and ensure implementation of such reforms;support SWAp processes.
Research Coordination and Facilitate the development of research policies and agenda; ensureResearch application of results from operations research.
Table 7.1, continued
Technical department Divisions Functions
7.1.3 Parastatals and Statutory BoardsThe Ministry has one semi-autonomous agency,KEMRI, and one statutory board, the RadiationProtection Board. The core functions of theseinstitutions are summarized in Table 7.2.
Table 7.2: Core functions of parastatal andstatutory boards under MOPHS
Parastatal/Board Mandate
KEMRI Conduct research, surveys andsurveillance programmes anddisseminate results.
Radiation Protection Oversee quality assurance andBoard development of guidelines, rules
and regulations, and enforce rules.
7.1.4 Support ServicesThe Director of Administration oversees ninedepartments/units. Their mandates andfunctions are summarized in Table 7.3.
7.1.5 Ministerial Support UnitsThere are two ministerial support units for theMinistry, Internal Audit and the MinisterialManagement Unit (MMU). The core functionsof the two units are outlined in Table 7.4.
Table 7.4: Core functions of ministerial supportunits
Unit Mandate
Internal Audit Ensure that effective systems for ensur-ing transparency, accountability and lowfiduciary risk.
MMU Coordinate performance contracting andto monitor performance.
7.2 Management Structuresand Functions at theSubnational Levels
P rovincial and district managementstructures are responsible for managingservice delivery at their respective levels.
The organizational structures for each level areillustrated in Figure 7.2 and their functions aresummarized in Table 7.5.
The core functions and staff requirements fordepartments/units at the subnational levels areoutlined in Table 7.6.

43Strategic Plan 2008–2012
Support services Department/Division Mandate
Finance and administration General administration Develop and institutionalize administrative systems to support the effectivedelivery of public health and sanitation services; manage logistics and developsystems.
Finance Ensure that the Ministry has efficient financial management and control systemsthat effectively support the delivery of quality public health and sanitationservices.
Accounts Ensure that the Ministry has efficient accounting systems in support of thedelivery of public health and sanitation services.
Procurement Ensure that procurement procedures are in place that ensure value-for-money,transparency and accountability of procurement of commodities, equipment andsupplies for effective delivery of public health and sanitation services.
ICT Enable citizens to access Ministry services and information as efficiently andas effectively as possible through use of Internet and other channels ofcommunication.
Human resource Human Resource Ensure that an adequate, skilled and motivated workforce is available tomanagement Development provide quality public health and sanitation services; oversee personnel
management, performance appraisal, personnel emoluments and budget.Human Resource Ensure that the Ministry is staffed with the right people at the right placesManagement and at the right time; conduct strategic planning, build capacity.
Policy and planning Ensure adequate financing of the Ministry in support of the delivery of qualitypublic health and sanitation services; conduct long-term strategic planning;oversee performance management and accountability framework for results-based management, rapid results initiative, and monitoring and evaluation ofimplementation of MTP and Vision 2030.
PRO Communicate with the public and the media.
Table 7.3: Core functions of departments/units under the Director of Administration
PRIMARY HEALTH SERVICES
EnvironmentalHealth, Water& Sanitation
HealthEducation
DiseaseControl
District Medical Officer of Health
Provincial Director of Public Health and Sanitation
Community Health Extension Worker
MOPHSHeadquarters
Provincial HealthManagementTeam (PHMT)
District HealthManagementTeam (DHMT)
Divisional HealthManagement
Team (DivHMT
Planning,Monitoring &Evaluation
DistrictHospital
Superintendents
Finance &Administration
Community Unit
PublicHealthNurse
PublicHealthOfficer
Level 2 and 3Facility In-Charges
Community HealthWorker
Community HealthWorker
FamilyHealth
EnvironmentalHealth, Water& Sanitation
HealthEducation
DiseaseControl
Planning,Monitoring &Evaluation
DistrictHospital
Superintendents
Finance &Administration
FamilyHealth
Community HealthWorker
Figure 7.2: Organization structure for subnational management levels and reporting offices at head-quarters level

44 Ministry of Public Health and Sanitation
z»
�
-1
ç
-
NO
2Â
o +oÞU
Table 7.6: Core responsibilities and staff requirements for units at the subnational level
Management team Unit Minimum officers Core responsibilities
Provincial and District Medical Officer of Health Overall management and coordination of services inHealth Management the province.Teams Disease control Overall coordinator Planning and coordination of public health interventions
1 HIV coordinator targeting specific diseases NCDs, infectious diseases,1 TB coordinator etc.); epidemic (malaria, TB, HIV, preparedness and
response.Health education 1 Design and implementation of health promotion interventions.Environmental health, 1 Environmental health, food and water safety and hygiene,water and sanitation vector control, and enforcement of Public Health Act.Family health 1 Coordination and planning for reproductive and child health
services.Planning, monitoring 1 Planning, M&E, surveillance, mapping resources andand evaluation officer services, HMIS, quality assurance.Medical superintendent 1 Ex-officio member, responsible for ensuring harmony with
medical services.Finance and administration 1 General administration, logistics support, personnel and
finance.Divisional Health Public health nurse 1 Coordination of disease control and family health services.Management Team Public health officer 1 Coordination of health education, environmental health,
water and sanitation services.Facility in charges 3 Coordination of planning, monitoring, surveillance, resource
and service mapping, information management, qualityassurance, and finance and administration for public healthin the division.
Community Unit CHEWs (PHTs, etc.) 2 Planning, coordination of implementation, monitoring andsupervision of all public health services in the communityunit.
CHWs 50 Implementation of defined health services.
Level Core functions/Mandate
Province • Overall coordination and management of health services in the province• Strategic, and operational planning for public health services in the province• Performance monitoring, evaluation and supervision• Capacity building and support to districts and local authorities• Quality assurance• Disease surveillance and control• Emergency response• Governance and linkages with other sectors• Infrastructure development• Logistics support and commodity security• Resource mobilization• Environmental protection and sanitation
District • Overall coordination and management of health services in the district• Strategic and operational planning for public health services in the district• Performance monitoring, evaluation and supervision• Capacity building and support to divisions, community and local authorities• Quality assurance• Disease surveillance and control• Emergency response• Governance and linkages with other sectors• Infrastructure development• Logistics support and commodity security• Resource mobilization• Environmental protection and sanitation
Division • Planning for health services in the division• Coordination of monitoring and reporting (for public health services) in division• Provision of preventive services• Logistics management• Resource mobilization• Supervision of community health care services
Community • Coordination of implementation of the comprehensive community health services• Participatory planning and action• Targeted health promotion• Water and sanitation activities• Vector control• Home-based care• Delivery of defined health programme interventions• Monitoring and reporting on community actions
Table 7.5: Core functions of subnational management structures

45Strategic Plan 2008–2012
8Resource Flows
Financial projections made for allocatingresources are aligned to the fivestrategic thrusts of this strategic plan:• Improving equitable access• Improving service quality and
responsiveness• Improving the efficiency of public health
systems• Fostering partnerships• Improving financing
Consistent with the programme-basedapproach adopted in developing thisplan, the cost estimates for itsimplementation have been organized
along the five strategic thrusts: improvingequitable access; improving service quality andresponsiveness; improving the efficiency ofpublic health system; fostering partnerships; andimproving financing.
8.1 Costing of Public HealthInterventions
E stimated cost of the public healthinterventions proposed here has beenaligned with the expenditure ceilings of
the MTEF for 2008/09–2011/12, and brokendown into specific expenditure categories –personnel emoluments, infrastructure andequipment, operations and maintenance O&M),and medical commodities.
8.1.1 Overall Cost of the Plan
Table 8.1 presents the cost estimates for the fivestrategic thrusts. The annual cost of the plan
increases from Ksh33.7 billion in 2008/09 toKsh64.6 billion in 2011/12, bringing the totalcost of the plan to Ksh195.2 billion over the fouryears. (See Figure 8.1.)
Strategic thrust 2, on improving the qualityand responsiveness of public health and sani-tation services, constitutes the core of the plan –accounting for about 85% of the resourcerequirements for the period 2008/09–2011/12.
The main cost drivers are medical com-modities, personnel emoluments, equipment,construction of latrines and establishment ofmodern waste disposal technologies in targetcommunities.

46 Ministry of Public Health and Sanitation
z»
�
-1
ç
-
NO
2Â
o +oÞU
Table 8.2: Distribution of costs by budget category, 2009/10–2011/12 (Ksh 000 and percentage)
Input category 2008/09 2009/10 2010/11 2011/12
Ksh 000 % Ksh 000 % Ksh 000 % Ksh 000 %Personnel emoluments 2,428,715 7 5,600,256 12.9 9,443,550 17.5 13,992,462 21.3Drugs and non-pharmaceuticals 15,025,721 45 18,628,680 42.9 23,187,092 42.9 28,817,751 43.9Operations & maintenance 7,865,304 23 10,009,989 23.1 10,477,675 19 10,769,254 16.1Vehicles/motorboats 138,050 0 138,050 0.3 138,050 1 130,000 1.2Infrastructure 8,239,662 24 9,002,001 20.7 10,059,887 19.6 10,914,856 17.4Equipment 5,000 0 15,000 25,000 35,000 Total 33,702,452 100 43,393,976 100.0 53,331,254 100 64,659,323 100
Table 8.1: Summary resource requirements by thrusts, 2009/10–2011/12 (Ksh 000,000 and percentage)
Thrust 2008/09 2009/10 2010/11 2011/12 Ksh 000 % Ksh 000 % Ksh 000 % Ksh 000 %Improving equitable access to public health services 4,634,112 14 6,238,413 14 6,263,41312 6,288,413 10Improving service quality and responsiveness public health services 28,219,482 84 35,926,759 8245,756,998 86 56,718,124 88Improving efficiency of public health services 640,507 2 825,799 2 1,126,537 21,431,435 2Fostering partnerships 188,751 1 223,805 1 139,906 0 170,351 0Improving financing of public health services 19,600 0 179,200 0 44,400 0 51,000 0Total 33,702,452 100 43,393,976 100 53,331,254 100 64,659,323 100
Table 8.1: Summary resource requirements by thrusts, 2009/10–2011/12 (Ksh 000,000 and percentage)
Thrust 2008/09 2009/10 2010/11 2011/12
Ksh 000 % Ksh 000 % Ksh 000 % Ksh 000 %Improving equitable access
to public health services 4,634,112 14 6,238,413 14 6,263,413 12 6,288,413 10Improving service quality and
responsiveness publichealth services 28,219,482 84 35,926,759 82 45,756,998 86 56,718,124 88
Improving efficiency of publichealth services 640,507 2 825,799 2 1,126,537 2 1,431,435 2
Fostering partnerships 188,751 1 223,805 1 139,906 0 170,351 0Improving financing of public
health services 19,600 0 179,200 0 44,400 0 51,000 0Total 33,702,452 100 43,393,976 100 53,331,254 100 64,659,323 100
To improve equitable access to publichealth and sanitation services, the plan willdevelop the health infrastructure and beefup equipment maintenance to supportservice provision. A particular emphasis ison the construction of new health facilitiesespecially in nomadic communities.
Figure 8.1: Summary resource requirements bystrategic thrusts (Ksh 000,000)
17,78816,498
11,288
5,638
689
25,040
0
5000
10000
15000
20000
25000
30000
Drugs & non-pharmaceuticals
Personnelemoluments
Infrastructure &equipment
Operations &maintenance
Grants Vehicle purchase
This is followed by thrust 1 on improvingequitable access to health services, whichrepresents about 11.9% of the estimated resourcerequirements. For instance, the plan is toincrease the number of health facilities withfunctional infrastructure and equipment from1,058 in 2008/09 to about 2,262 in 2011/12, andto increase the number of nomadic clinics from10 in 2009/10 to 40 clinics by 2011/12.
8.1.2 Distribution of Costs by InputCategories
A breakdown of the costs by specific inputcategories shows that medical commodities,personnel emoluments and infrastructurerequirements are the main cost drivers. Table 8.2shows the costs by category in Kenya shillingsand the percentage share of the total costs.
From Table 8.2, it can be seen that the maincost drivers for this strategic plan are: drugs andnon-pharmaceuticals; personnel emoluments;and infrastructure.

47Strategic Plan 2008–2012
8.2 Available Financing
Budgetary allocations complemented withcost sharing revenues collected andretained by health facilities are expected
to form the main sources of finance for MOPHSover the current MTEF period. The level of costsharing revenues has been kept constant over theperiod at the amount reported in 2007/08.
On the other hand, as indicated in Table 8.3and summarized in Figure 8.2, budgetaryallocations to the Ministry are expected toincrease, from Ksh10 billion in 2008/09 to Ksh25billion in 2011/12. This estimated availableresources excludes off-budget financing to publichealth and sanitation services from thedevelopment resources. Table 8.4 shows thetrend in expected expenditures (including costsharing revenues) 2008/09 to 2011/12.
8.3 Resource Gap
Table 8.5 distributes the estimates fromTable 8.4 by the main thrusts andcompares the MTEF allocations (including
cost sharing resources) with the MTP budgetestimates. The overall financing gap is Ksh103.6billion over the four years. This is distributed byyear as follows: Ksh256 billion in 2008/09;Ksh23.8 billion in 2009/10; Ksh32.2 billion in2010/11; and Ksh42.0 billion in 2011/12.
Table 8.4: Distribution of estimated available resources by main budget categories, 2008/09–2011/12(Ksh 000,000)
2008/09 2009/10 2010/11 2011/12
Drugs & non-pharmaceuticals 2,370 6,403 7,431 8,836Infrastructure & equipment 309 5,211 5,420 5,558Operations & maintenance 2,448 2,760 2,963 3,117Personnel emoluments 2,875 4,991 4,999 4,923Vehicle purchase 100 194 196 199Grants 1,313 1,360 1,413 1,552
Total 9,418 20,920 22,424 24,187
Source: MTEF estimates.
Table 8.3: Estimated financing for MOPHS 2008/09–2011/12, budgetary and cost sharing (Ksh 000,000)
Category 2008/09 2009/10 2010/11 2011/12
Budgetary allocations 8,627 20,309 21,961 23,873Cost sharing revenues 1,572 1,572 1,572 1,572Budgetary + cost sharing 10,199 21,881 23,533 25,445
Source: Medium-Term Expenditure Framework (MTEF); MOPHS 2009.
Figure 8.2: Total estimated available resourcesby main budget categories(Ksh 000,000)
17,78816,498
11,288
5,638
689
25,040
0
5000
10000
15000
20000
25000
30000
Drugs & non-pharmaceuticals
Personnelemoluments
Infrastructure &equipment
Operations &maintenance
Grants Vehicle purchase
The gap is further distributed by each of thefive thrusts as follows: Thrust 1, Ksh15.2 billion;Thrust 2, Ksh105.4 billion; Thrust 3, Ksh2.3billion; Thrust 4, Ksh0.5 billion; and Thrust 5,Ksh0.02 billion. As shown in Table 8.5, thelargest financing gap is in thrust 2 ( improvingthe quality and responsiveness of public healthservices), which accounts for about 85% of thetotal gap. Large financing gaps by input cate-gories are on drugs and non-pharmaceuticals,infrastructure including equipment and person-nel emoluments.
The main cost drivers for this strategicplan are: drugs and non-pharmaceuticals;personnel emoluments; andinfrastructure.

48 Ministry of Public Health and Sanitation
z»
�
-1
ç
-
NO
2Â
o +oÞU
Tab
le 8
.5: C
om
par
iso
n: B
ud
get
, MT
EF
allo
cati
on
s; a
nd
fun
din
g g
ap
MT
P c
ost
est
imat
esM
TE
F b
ud
get
(K
sh 0
00)
Fu
nd
ing
gap
2008
/09
2009
/10
2010
/11
2011
/12
2008
/09
2009
/10
2010
/11
2011
/12
2008
/09
2009
/10
2010
/11
2011
/12
To
tal
Str
ateg
ic t
hru
st 1
: In
crea
se e
qu
itab
le a
cces
s to
pu
blic
hea
lth
In
fras
truc
ture
dev
elop
men
t 2
,615
,856
2,6
25,8
56 2
,635
,856
2,6
45,8
56 9
8,14
7 1
,517
,663
1,5
84,3
94 1
,343
,066
-2,5
17,7
09-1
,108
,193
-1,0
51,4
62-1
,302
,790
-5,9
80,1
53C
omm
unity
hea
lth s
ervi
ces
(O&
M)
2,0
18,2
56 3
,612
,557
3,6
27,5
57 3
,642
,557
628
,274
996
,280
1,0
26,1
34 1
,054
,433
-1,3
89,9
82-2
,616
,277
-2,6
01,4
23-2
,588
,124
-9,1
95,8
05S
ubto
tal
4,6
34,1
12 6
,238
,413
6,2
63,4
13 6
,288
,413
726
,421
2,5
13,9
44 2
,610
,529
2,3
97,4
99-3
,907
,691
-3,7
24,4
69-3
,652
,884
-3,8
90,9
14-1
5,17
5,95
8
Str
ateg
ic t
hru
st 2
: Im
pro
ve q
ual
ity
and
res
po
nsi
ven
ess
of
pu
blic
hea
lth
an
d s
anit
atio
n s
ervi
ces
O&
M f
or L
2 &
3 fa
cilit
ies
3,3
80,0
00 3
,380
,000
3,3
80,0
00 3
,380
,000
1,0
52,1
79 9
32,1
45 9
56,1
07 9
78,4
29-2
,327
,821
-2,4
47,8
55-2
,423
,893
-2,4
01,5
71-9
,601
,139
PE
(te
chni
cal)
2,4
28,7
15 5
,600
,256
9,4
43,5
50 1
3,99
2,46
2 2
,875
,983
4,9
91,0
02 4
,999
,132
4,9
23,8
94 4
47,2
68-6
09,2
54-4
,444
,418
-9,0
68,5
68-1
3,67
4,97
2M
edic
ines
and
pub
lic h
ealth
com
mod
ities
15,
025,
721
18,
628,
680
23,
187,
092
28,
817,
751
2,3
70,7
19 6
,403
,510
7,4
31,7
22 8
,836
,322
-12,
655,
002
-12,
225,
170
-15,
755,
370
-19,
981,
429
-60,
616,
971
O&
M f
or c
entra
l pr
ogra
mm
es 1
,776
,240
1,9
31,6
78 2
,305
,325
2,2
33,9
11 5
52,9
36 5
32,7
23 6
52,1
12 6
46,6
64-1
,223
,304
-1,3
98,9
55-1
,653
,213
-1,5
87,2
47-5
,862
,719
Infr
astr
uctu
re/E
quip
. 5
,608
,806
6,3
86,1
45 7
,441
,031
8,2
94,0
00 2
10,4
42 3
,690
,994
3,9
99,1
32 4
,210
,128
-5,3
98,3
64-2
,695
,151
-3,4
41,8
99-4
,083
,872
-15,
619,
286
Sub
tota
l 2
8,21
9,48
2 3
5,92
6,75
9 4
5,75
6,99
8 5
6,71
8,12
4 7
,062
,259
16,
550,
374
18,
038,
206
19,
595,
437
-21,
157,
223
-19,
376,
385
-27,
718,
792
-37,
122,
687
-105
,375
,087
Str
ateg
ic t
hru
st 3
: Im
pro
ve e
ffic
ien
cyO
&M
for
adm
inis
tratio
n/m
anag
em
ent/p
rovi
nce
and
dist
rict
482
,457
682
,749
980
,487
1,2
91,4
35 1
50,1
87 1
88,2
90 2
77,3
52 3
73,8
39-3
32,2
70-4
94,4
59-7
03,1
35-9
17,5
96-2
,447
,459
Infr
astr
uctu
re 2
0,00
0 5
,000
8,0
00 1
0,00
0 7
50 2
,890
4,3
00 5
,076
-19,
250
-2,1
10-3
,700
-4,9
24-2
9,98
4V
ehic
les/
Mot
orbo
ats,
etc
. 1
38,0
50 1
38,0
50 1
38,0
50 1
30,0
00 1
00,4
50 1
94,3
42 1
96,4
50 1
99,5
50-3
7,60
0 5
6,29
2 5
8,40
0 6
9,55
0 1
46,6
42S
ubto
tal
640
,507
825
,799
1,1
26,5
37 1
,431
,435
251
,387
385
,522
478
,102
578
,466
-389
,120
-440
,277
-648
,435
-852
,969
-2,3
30,8
01
Str
ateg
ic t
hru
st 4
: F
ost
er p
artn
ersh
ips
O
&M
188
,751
223
,805
139
,906
170
,351
58,
757
61,
722
39,
575
49,
313
-129
,994
-162
,083
-100
,331
-121
,038
-513
,446
Sub
tota
l 1
88,7
51 2
23,8
05 1
39,9
06 1
70,3
51 5
8,75
7 6
1,72
2 3
9,57
5 4
9,31
3-1
29,9
94-1
62,0
83-1
00,3
31-1
21,0
38-5
13,4
46
S
trat
egic
Th
rust
5:
Imp
rove
fin
anci
ng
O
&M
19,
600
179
,200
44,
400
51,
000
6,1
01 4
9,42
0 1
2,56
0 1
4,76
3-1
3,49
9-1
29,7
80-3
1,84
0-3
6,23
7-2
11,3
56S
ubto
tal
19,
600
179
,200
44,
400
51,
000
6,1
01 4
9,42
0 1
2,56
0 1
4,76
3-1
3,49
9-1
29,7
80-3
1,84
0-3
6,23
7-2
11,3
56
Gra
nd
to
tal
33,
702,
452
43,
393,
976
53,
331,
254
64,
659,
323
8,1
04,9
26 1
9,56
0,98
2 2
1,17
8,97
1 2
2,63
5,47
8-2
5,59
7,52
6-2
3,83
2,99
4-3
2,15
2,28
3-4
2,02
3,84
5-1
23,6
06,6
48

49Strategic Plan 2008–2012
9Development of this strategic plan
entailed a formal risk assessment, aswell as the identification or assign-ment of the parties responsible for
ensuring the delivery of the proposed activities.The section presents, first, the responsible unitsfor accountability purposes for each of the goalsof the plan and then an itemized tracking of theidentified risks with suggestions for possiblemitigation of their impact. The risks are keyedto the risk–impact matrix summarized in Table9.1.
Table 9.1: Summary risk–impact matrix
Probabilityê Impactè Low Medium HighLow E,IMedium A,F,G HHigh J B C,D
9.1 Goals and Responsibilities
The responsibility for successful executionof the plan lies with the various divisions,districts, facilities and community health
workers. The responsible institutions for each ofthe goals is detailed in Table 9.2.
Accountability and Risk
Unprecedented global recession, highinflation and pervasive poverty in Kenya, aswell as the transition from one sector andone ministry, mean that the overall risk tothis plan is assessed at medium to high.
9.2 Risk Assessment
The plan will be implemented during aperiod of unprecedented global recession.In Kenya, the plan coincides with an
inflationary trend that has affected all segmentsof consumers. The world’s leading economies,which are also the principal contributors topublic health interventions, are under siege witha potential knock-on effect to official develop-ment assistance (ODA). Without Governmentintervention, Kenya’s low and middle incomegroups are facing the threat of unaffordablebasics of life, including adequate access to food.In view of these circumstances and in the lightof the transition from one sector and oneministry, the overall risk to this plan is assessedat medium to high. Some key risks that mayhinder the ability of MOPHS to implement the

50 Ministry of Public Health and Sanitation
z»
�
-1
ç
-
NO
2Â
o +oÞU
NHHSP II Objective
Strategic thrust – MOPHS
Goal for 2012 Responsible unit
Increase the proportion of communities that live within 5 km of functional health facility from 52% to 62%
Division of Community Strategy
Increase financial access to health care services DFA /DPP /NHIF
Increase equitable access to health services
Improve equitable access to public health and sanitation services Increase proportion of deliveries by skilled attendant from 42% to
60% Div. RH /DHP
Reduce the staff vacancy rate by 40% DHRM Increase proportion of health workforce trained by 100% DHRM Rehabilitate and adequately equip 50% of level 2 and 3 and other public health facilities
DCH
Improve the quality and responsiveness of health services in the sector
Improve the quality and responsiveness of public health and sanitation services Reduce proportion of facilities reporting stock outs by 100% DCH
Increase number of districts with functional surveillance systems by 30%
Div. HMIS
Increase number of facilities with health care waste management system from 20% to 100%
DEH&S/DHP
Increase sanitation coverage from 46% to 66% DEH&S/DHP Increase the proportion of households utilizing safe water by 20% DEH&S /DHP Increase client satisfaction by 50% DPHS Reduce the incidence of food-borne diseases/illnesses by 5% DEH&S /DHP Reduce mortality rate due to emergency to below 1/10000 persons DEPR Increase the utilization of cost-effective RH services by 50% DFH Increase the utilization of cost-effective child health care services by
50% DCAH
Reduce new HIV infections by 50% NASCOP/DDPC Increase TB case detection and treatment to 90% NASCOP Reduce malaria incidence to 15% through utilization of cost-
effective control measures DDPC/M
Reduce the incidence of malnutrition in children <5 years by 30% Div. N Reduce vacancy rate by 60% DHRMD Improve efficiency
and effectiveness of service delivery
Improve efficiency of the public health system
Increase the proportion of staff who are trained as per the Government training policy by 50%
DHRMD
Increase the proportion of employee job satisfaction to 90% DPHS Increase the availability and utilization of ICT by staff by 60% DICT Improve provision and utilization of transport services by 50% DFA Achieve 100% disposal of obsolete, unserviceable and surplus
assets annually DFA
Ensure all facilities receive financial resources based on needs by 2012
DPP/DTP
Increase efficiency in utilization of resources DPP/DTP
Improve financing of the health sector
Improve financing of the public health and sanitation services Increase financial resources to MOPHS by 20% over a period of five
years DPP/DTP
Strengthen governance structures at levels 1–3 by 2012 DCH Foster partnership in improving health and service delivery
Foster partner-ships in improving public health service delivery
Improve coordination and partnership arrangements at all levels Department of Technical Planning
Table 9.2: Objectives, goals and responsible parties
planned strategies are discussed in the followingsections.
9.2.1 Risk A: Government FundingDoes Not Increase
The trend in government allocation to the healthsector has stagnated at around 7%. Historically,public health has received comparatively insigni-ficant government allocations. During this year’sbudget, the allocation to the Ministry remainedlow but was an improvement from past alloca-tions. This is paradoxical in the fiscal planningof the country, as preventive and health promo-tion services are considered to be public goods.
Mitigation: MOPHS engaged in theMTEF process for the first time, and
public health and sanitation costs arereflected in the framework. It is ex-pected that this will lead to Govern-ment commitment to preventive andhealth promotion services throughsupport to the Community Strategyand to life saving procedures such asimmunization and vaccination, provi-sion of ART, and free LLITNs.
9.2.2 Risk B: Development PartnersReduce Funding to the HealthSector
Despite the bleak economic outlook among thecountries providing most aid to public healthinterventions, particularly for HIV/AIDS,

51Strategic Plan 2008–2012
tuberculosis and malaria, the commitment to thesector remains high. However, as partnercountries sink deeper into recession, the risk isreal that they may be forced to re-programmeor even reduce their aid. This will be in responseto pressing domestic needs and the need to injectmore money into the markets.
Mitigation: The external politicalcommitment towards Kenya is notlikely to change, particularly if thecountry continues with the post-election violence reform agenda. Thegrowing advocacy in support of theMDGs, for example through Interna-tional Health Partnerships (IHP),Providing for Health (P4H) and otherinitiatives, will rally support to publichealth programmes in Kenya andsimilar countries. The Kenya HealthSWAp and public–private partnerships(PPP) will be expected to contribute toaid effectiveness and efficiency inpublic health and sanitation.
9.2.3 Risk C: Corruption in the CountryRemains Unchanged
Kenya continues to be on the list of countrieswith a high corruption index. The negativeimpact and corrosion affects all the sectors ofthe country including health. Corruption in thehealth sector has the outcome of reducing theavailability of resources through actual haemor-rhaging, inefficiency and poor quality of care,leading to low utilization. This will beaccentuated by the concerns about Global Fundsupport.
Mitigation: Government has put inplace public service reforms that in-clude streamlining procurement,recruitment and performance con-tracts. In addition, Government isplanning to re-think the civil servicesalary structure. These initiatives,together with efforts of the Kenya Anti-Corruption Council, are expected toprovide strong disincentives to corrup-tion. Efforts by civil society groups andthe media to educate the public shouldalso help to reduce corruption.
9.2.4 Risk D: Further Increase inPoverty Levels
In view of the bleak economic outlook, moreKenyans may slip through the gaps and anincreasing number fall below the poverty line.Poor people are sick more often and less produc-tive than those who are better off financially.Most sick and poor people suffer from prevent-able disease, thus putting greater demand on theservices of MOPHS. The poor also often live insubstandard housing in marginalized areas,whether in rural or urban settings, predisposingthem to poor access to health care.
Mitigation: The Government hasembarked on the implementation of theMTP, which is the guide for the firstphase in transforming the country intoa middle income economy by 2030. Theplan proposes more investment in areasof production including manufactur-ing, tourism and services. Better marketregulation measures are also envisaged.
9.2.5 Risk E: The Imminent Collapse ofFaith-Based Health Care ServicesBecomes Real
Faith-based organizations are an integral partof Kenya’s health services as they often targetthe poor and marginalized in rural areas, aridand semiarid areas, as well as urban slums. Inthe recent past these services have come underintense pressure from the highly subsidized andtax-based Government health services. Govern-ment and donor grants to these groups havecontinued to trickle away and may dry alto-gether. Weak systems aggravate the prevailingunhealthy conditions. One response has been toraise user fees, which are the principal source offunding for the FBOs, but this only contributesto lower utilization rates, leading to even greaterreduction in revenue.
The scaling up of the Community Strategywill improve people’s participation in andownership of their health care services.

52 Ministry of Public Health and Sanitation
z»
�
-1
ç
-
NO
2Â
o +oÞU
Mitigation: The FBOs have drawn amemorandum of understanding thatwill for the first time provide security toGovernment contributions to theseservices. Already Government is pro-viding drug kits and public healthdrugs to the FBOs. In the proposedHealth Sector Services Fund, FBOfacilities will also receive public alloca-tions and development partner fundswill increasingly be channelled throughthe HSSF. Reforms to the NationalHospital Insurance Fund will contrib-ute to increasing the patronage of FBOfacilities. Lastly, through the PPP policyand strategy as an integral element ofthe Kenya health SWAp, pooled fundswill support FBOs and NGOs.
9.2.6 Risk F: Insufficient Improvementof the Weak Management andCoordination Systems
The health sector suffers the ill effects of weakhuman resource, financial management andplanning systems. The net effect is out-migrationby the health workforce, reduced value formoney, and erratic development of health careinfrastructure and services. The mushroomingof CDF facilities constructed without regard tosector standards is an example of these ineffi-ciencies in the system.
Mitigation: The development of Minis-try-specific plans modelled on MTPand Vision 2030, as well as the commit-ment to “one sector plan/one AOP,one Joint Programme of Work and oneJoint Financing Framework”, are allstrategies for redressing fragmentationand weak coordination and planning.A review of institutional structures andstrengthening of the management ofthe HSCC, internal management andcoordination are other strategies form-ing part of this plan.
9.2.7 Risk G: The Expanded Sector WillLead to Relative Reduction ofResources to Public Health
The Ministry of Finance has for the first timeadded two big ministries to the traditional health
sector cluster, to form a new sector – humanresource development. This means that theministries have to fight for MTEF allocations inthe face of ring-fenced resources to personnelemoluments. The Ministry of Education has byfar the highest proportion of the ring-fencedfunds in this new sector. With the expandedcluster, resources to the other economic cate-gories in the MTEF budget will receive propor-tionately lower allocations, which will have adeleterious impact on service delivery.
Mitigation: The MTEF process, whichincludes public hearings, is expected toredress any imbalances. The signing ofthe JFA will form a further instrumentfor rational resource allocation. In-crease in development partner fundsthat are on-budget and on-account willimprove predictability of funding andtherefore yield better planning.
9.2.8 Risk H: Food Security andNutrition May Get Worse if FoodProduction Falls
The current high cost of farm inputs has affectedfood production and the willingness of farmersto sell produce to the government stores at thegovernment set prices. The situation favoursincreased export of foodstuffs to neighbouringcountries. The consequence will be increasedrates of malnutrition and ill-health, particularlyamong children, women and HIV/AIDSpatients. This is happening against the absenceof a food security policy in the country.
Mitigation: The Ministry of Agricultureand Ministry of Finance are constantlyreviewing prices of farm produce vis-à-vis the inputs. Recently there have beeninstances of government subsidy toconsumers covering maize meal. Thereare plans to subsidize farm inputs.
The net effect of existing weak humanresources, financial management andplanning systems is out-migration by thehealth workforce, reduced value formoney, and erratic development of healthcare infrastructure and services

53Strategic Plan 2008–2012
9.2.9 Risk I: The Insecurity inCommodity Management WillPersist
Deficiencies in drug supply chain managementmay continue to dog the public health sector, inthat KEMSA may not deliver. Moreover, theprocurement and distribution functions arelargely outside the purview of MOPHS. Theresult will be persistent drug shortages andfrequent stock outs.
Mitigation: The Minister for MedicalServices plans to implement the recom-mendations of the Task Force onKEMSA. One of these is to allowKEMSA its legally mandated manage-ment autonomy in drugs and suppliesmanagement.
9.2.10 Risk J: Negative PublicPerception of Government HealthCare Services
The public may continue to harbour negativeviews of the quality and management of publicservices, and more so services for the poor. Forexample, this perception is thought to be the rootcause for women not delivering under the careof trained health professionals. This will affectutilization and unfavourable health seekingbehaviour among the people.
Mitigation: The scaling up of theCommunity Strategy will improvepeople’s participation and ownershipof the services. Moreover, the humanfactors that affect user satisfaction andutilization are central in this strategicplan.

54 Ministry of Public Health and Sanitation
z»
�
-1
ç
-
NO
2Â
o +oÞU 10A robust monitoring and review
mechanism is essential to achievingthe Ministry’s strategic priorities. Toenable adequate follow up and
implementation of its priorities, the Ministry willhave a clear review and monitoring mechanismto ensure that commitment to achieving thestrategic priorities is maintained. The processwill focus on ensuring appropriate linkages tohealth sector and wider Government monitoringand review processes.
10.1 Framework for Monitoringand Reporting
The monitoring and review process definedhere is at both the operational and thestrategic level. At the strategic level, the
monitoring process will be in line with moni-toring support towards the strategic objectivesof the overall health sector. On the other hand,the operational monitoring will focus on mon-itoring progress towards the strategic prioritiesof the Ministry.
Strategic monitoring will be done at themidterm and end term of this plan period. The
Monitoring, Evaluation andReporting
The performance appraisal system willbe part of the sector monitoring.Indicators will be utilized to measureprogress against set targets.
midterm review will coincide with the formalarticulation of a new policy direction for thehealth sector. As such, it will focus on:• Reviewing progress made and identifying
challenges and strategies for acceleration,and
• Incorporating any realignment of thestrategic priorities of the Ministry, in linewith the new policy framework.
All levels of the Ministry will be involved inthe process of strategic monitoring, as will itspartners, including the Ministry of MedicalServices. Each level of service delivery will carryout its own monitoring and evaluation.
Operational monitoring will be carried outmonthly, quarterly and annually. This will focuson monitoring progress against interventionsand activities set out in the operational plans.Each planning unit at all levels in the Ministrywill be involved.

55Strategic Plan 2008–2012
The performance monitoring process will bethe cornerstone of the sector monitoring.Indicators will be utilized to measure progressagainst set targets. The indicators will be usedin two ways:
1. Sector-wide indicators: The set of indicatorsthe sector will use to inform on progress atthe strategic level. One or at most twoindicators will be utilized for each result area(service delivery and systems) the sector isworking towards. Collection and monitoringof progress will be the responsibility of thesector.
2. Programme indicators: Indicators that therespective programme areas will use toinform on progress towards programmeobjectives. The number will depend on theparticular programme area. Monitoring of
Table 10.1: Core indicators for monitoring outcomes
progress will be the responsibility of therespective programme area.
10.2 Indicators for MonitoringProgress
Several specific indicators have been selectedfor use in monitoring the performance ofthe plan. Most of the indicators will be
collected as part of routine reporting andcaptured in the HMIS. A few of them, such asuser satisfaction, will be obtained through annualsurveys. The core indicators are described inTable 10.1, and Table 10.2 gives the midterm andend of term benchmarks.
No Outcome area
No Indicator Indicator calculation: N/D*100 Frequency of collection
1 Service delivery
1a % Women in reproductive age receiving family planning commodities
Numerator: Number of WRA who received FP commodity Denominator: Estimated total WRA
Annually, part of AOP monitoring
1b % Pregnant women attending at least 4 ANC visits
Numerator: Number of ANC clients who have made 4 clinic visits Denominator: Estimated number of pregnant women
Annual – MOH register
1c % Deliveries conducted by skilled attendants
Numerator: # deliveries conducted by trained health staff Denominator: Estimated number of expected deliveries
Annual
1d % HIV+ mothers receiving preventive ARV to prevent PMTCT
Numerator: # of HIV+ pregnant women who received preventive ARVs Denominator: # HIV+ pregnant women
Annual
1e % Pregnant women receiving LLITN
Numerator: # pregnant women who receive LLITNs during current pregnancy Denominator: # pregnant women in catchment area
Annual
1f % Newborns receiving BCG (TB vaccination)
Numerator: # of children <1 yr receiving vaccination against TB Denominator: Estimated number of live births in catchment
Annual
1g % Children <1 year receiving measles immunization
Numerator: # of children <1 yr receiving vaccination against measles Denominator: Estimated number of surviving children <1 year
Annual
1h % Children <1 year fully immunized
Numerator: # of children <1 receiving all antigens Denominator: Estimated number of surviving children <1 year
Annual
1i % New cases of children under 5 years old attending CWC
Numerator: # of children <5 yrs new cases child welfare clinic Denominator: Estimated number of children <5 years in catchment
Annual
1j % Children < 5 years old receiving LLITNs
Numerator: # children <5 years receiving LLITNs Denominator: Estimated number of children <5 years in catchment
Annual
Continued

56 Ministry of Public Health and Sanitation
z»
�
-1
ç
-
NO
2Â
o +oÞU
No Outcome area
No Indicator Indicator calculation: N/D*100 Frequency of collection
Service delivery, continued
1k Infant mortality rate Numerator: # of deaths of children <1 yr in catchment area Denominator: # of live births in catchment area
Annual, survey
1l Under 5 years mortality rate Numerator: # of deaths of children <5 yrs in catchment area Denominator: # of children <5 years in catchment area
Annual, survey
1m % School children correctly de-wormed
Numerator: # of school children de-wormed during the year Denominator: # school children in the catchment area during the year
Annual
1n % Population counselled and tested for HIV
Numerator: # of persons counselled and tested in specified period Denominator: # of population in catchment area
Quarterly, annual
1o # Condoms distributed Numerator: # of condoms distributed Denominator: None
Quarterly, Annual
1p TB Case detection rate Numerator: # of new TB cases detected Denominator: Estimated number of new Tb cases in the catchment area
Annual
1q % Households sprayed with IRS Numerator: # of households sprayed with IRS Denominator: # of households in catchment area
Quarterly, annual
1r % Functioning community health units (CHUs)
Numerator: # CHUs with trained CHCs, CHWs and have kits Denominator: # of expected CHU
Quarterly, annual
2 Support systems
2a % Clients satisfied with services Numerator: # clients satisfied with services Denominator: # Interviewed
Survey
2b % Facilities without all 14 tracer drugs for more than 2 weeks.
Numerator: # of facilities without tracer drugs >2 weeks Denominator: # of facilities in catchment area
Survey
2c % Facilities that submit timely accurate reports to the national level
Numerator: # facilities submit accurate reports on time to national level Denominator: # facilities in catchment area
Quarterly, Annual
2d % Facilities that submit complete and accurate reports to the national level
Numerator: # facilities submit accurate reports on time to district level Denominator: : # facilities in catchment area
Quarterly, annual
3 Governance and financing
3a % Districts with functional district stakeholder forum
Numerator: # districts with functional stakeholder forum Denominator: # of districts in catchment area
Quarterly, annual
Table 10.1, continued
10.3 Interpretation ofPerformance
W e will use what is known as a“dashboard” approach to measureour progress towards the goals of this
strategic plan. This means that rather than
assessing each target individually, we will belooking at our achievements in the aggregate –forward (ideally) movement on all or most ofthe indicators together. (See Table 10.3 for themechanism.) This is really the only way to makesubstantive progress in public health andsanitation services.
Table 10.2: End of term and midterm measure indicators
Indicator Baseline Midterm target End of term target
1 Under-5 mortality rate 120 80 332 Maternal mortality ratio 414 284 1473 Proportion of deliveries by skilled attendants 28 62 954 Proportion of fully immunized children 70 82 955 Proportion of pregnant receiving nevirapine (%) 21 50 706 HIV prevalence rate (%) 7.4 5.0 2.07 TB cases/100,000 population 888 650 444
Source of baseline data: KDHS 2003 and AOP 3 report (HMIS).

57Strategic Plan 2008–2012
Table 10.3: Interpretation of indicators against dashboard
Interpretation of dashboard
Interpretation Implications for Government and partners
Excellent progress
Over 80% of dashboard indicators with performance of 120% or more than targeted achievement
Performance warrants additional resources above what is already committed to be provided, particularly for targeted areas based on sub analyses.
Significant progress
Over 80% of dashboard indicators with performance of at least 80–120% of targeted achievement
Performance adequate to maintain planned resources, with additional commitments individually determined for areas with poor performance.
Adequate progress
Over 50% of dashboard indicators with performance of at least 80–120%
Performance adequate to maintain planned resources.
Inadequate progress
50–80% of dashboard indicators with performance under 80% of targeted achievement
Performance inadequate to warrant additional resources. Committed resources at risk.
Poor progress Over 80% of dashboard indicators with performance of under 80% of targeted achievem ent
Performance inadequate, committed resources seriously under threat.
10.4 Monitoring and ReportingProcess
Monitoring will be conducted jointlywith the Ministry of Medical Servicesas they share sector-specific outputs
and outcomes. Monthly reviews, however, willbe Ministry specific. The time plan for themonitoring and reporting is given in Table 10.4
Frequency Target Focus Level of monitoring and review
Monthly Monthly activity reports
Identify activities whose implementation is delaying delivery of outputs, and plan to address challenges
Activity level
Quarterly Quarterly progress reports
Identify outputs whose achievement during the year is threatened, and plan to address challenges affecting them
Output level
Annually Annual progress reports
Identify progress, issues and challenges affecting implementation of outputs, and make recommendations of priorities for coming year
Output level
Mid term Midterm review Identify progress, issues and challenges affecting implementation of outcomes towards supporting the achievement of the overall goal, and make recommendations for the remaining half of the strategic plan
Outcome level
End term End term review Identify progress, issues and challenges that affected achievement of the overall goal, and make recommendations for the next strategic plan focus to enable it to support achievement of overall sector policy
Goal level
The plan proposes the use of what isknown as a “dashboard” approach tomeasure progress towards goals. Thismeans that rather than assessing eachtarget individually, achievements will bereviewed in the aggregate – forward(ideally) movement on all or most of theindicators together.
Table 10.4: Monitoring and review framework

58 Ministry of Public Health and Sanitation
z»
�
-1
ç
-
NO
2Â
o +oÞU References
CBS, MOH and ORC Macro. 2004. Kenya Demographicand Health Survey, 2003. Calverton, Maryland:Central Bureau of Statistics, Kenya Ministry ofHealth and ORC Macro.
KNBS. 2007. Kenya Integrated Household Budget Survey,2007. Kenya National Bureau of Statistics, Nairobi,Kenya.
KNBS. 2008. Economic Survey 2008. Kenya NationalBureau of Statistics. Government Printer, Nairobi,Kenya.
MOH. 1994. Kenya’s Health Policy Framework 1994–2010.Nairobi: Government Printer.
MOH. 1999. The National Health Sector Strategic Plan:1999–2004. Nairobi: Government Printer.
MOH. June 2004. “Report on an Inter-Sectoral Work-shop on Traditional Medicine, HIV/AIDS,Research and Sustainable Development in Kenya”.Ministry of Health, Nairobi.
MOH. 2005. Reversing the Trends – The Second NationalHealth Sector Strategic Plan of Kenya: NHSSP II –2005–2010. Ministry of Health, Nairobi.
MOH. 2006a. Joint Programme of Work and Funding 2006/07–2009/10 for the Kenya Health Sector. Health SectorReform Secretariat, Ministry of Health, Nairobi
MOH. 2006b. Norms and Standards for Health ServiceDelivery in Kenya. Ministry of Health, Nairobi.
MOH. 2007a. Reversing the Trends: The Second NationalHealth Sector Strategic Plan of Kenya – The KenyaEssential Package for Health. Ministry of Health.Nairobi.
MOH. 2007b. Reversing the Trends: The Second NationalHealth Sector Strategic Plan of Kenya – NHSSP II:Midterm Review Report. Sector Planning and Moni-toring Department, Ministry of Health, Nairobi.
MPND. 2003. Economic Recovery Strategy for Wealth andEmployment Creation 2003–2007 (ERSWEC).Ministry of Planning and National Development,Nairobi.
NCAPD, MOH, CBS and Macro International. 2005.Kenya Service Provision Assessment Survey 2004.Nairobi: National Coordinating Agency forPopulation and Development, Ministry of Health,Central Bureau of Statistics, and Macro Inter-national.
Office of the Prime Minister, Ministry of State for Plan-ning, National Development and Vision 2030. 2008.First Medium-Term Plan (2008–2012). Nairobi.

59Strategic Plan 2008–2012
Annex APriority Health Sector Interventions forAcceleration in the Medium Term, arising
from the Midterm Review of NHSSP II
NHSSP II objective
Priority interventions
Objective 1: Increase equitable access to health services
§ Provide support to ensure universal access to maternal and neonatal health services for cohort 1, involving demand creation and supply-side interventions such as free delivery, skilled attendants, effective referral and other emergency obstetric care components.
§ Comprehensively implement guides and frameworks for cohorts 4 and 6. § Develop a policy, strategic approach and implementation framework for NCDs to address healthy
lifestyles and provision of direct medical care for individuals in a clinical setting (all cohorts). § Reduce morbidity and mortality from malaria by accelerating implementation of the national malaria
strategy, which has been revised in line with NHSSP II, particularly targeting cohorts 2, 3 and 5. § Strengthen implementation of existing service delivery efforts for child health for cohorts 2 and 3,
with a particular focus on coordination. § Accelerate implementation of TB control initiatives (cohort 5). § Accelerate Community Strategy implementation (level 1), by rolling out the community health worker
structure, providing behaviour change communication, scaling up outreach services, etc. § Accelerate dissemination of the Kenya Essential Package for Health (KEPH) throughout the sector. § Develop a strategy to influence the implementation of KEPH outside the health sector. § Strengthen public-private partnerships in delivery of services, particularly in under-served areas, by
improving formal frameworks and facilitating access to the HSSF.
Objective 2: Improve the quality and responsiveness of services
§ Roll out service charter – to be displayed publicly – containing information on services, standards, complaints and the mechanisms to redress.
§ Develop and implement country-specific hospital reforms to support and complement services at the primary care level.
§ Re-categorize and accredit health facilities in line with KEPH to guide the identification of inputs required within the context of existing KEPH Norms and Standards.
§ Update and implement clinical and management guidelines for service delivery. § Creating facility-based incentives to improve quality of services, such as institutionalizing processes
for recognition and reward. § Put in place national strategy for integrated supportive supervision, involving clear definitions and
implementation arrangements and linkages to annual plans and performance appraisal, as well as incorporating new service delivery guidelines.
§ Fast track leadership and management capacity strengthening initiatives in accordance with the decentralization of management in the sector, including in-service training and patient centred accountability.
Objective 3: Foster partner-ships in improving health and delivery services
§ Strengthen sector coordination and participation structures at all levels. § Monitor adherence to COC principles and obligations, including the development of aid
effectiveness indicators and targets, and integrate their measurement in sector annual reviews. § Provide joint support and responsibility to strengthen common management arrangements, so as to
ensure use of country systems for support. § Ensure partners are providing coordinated and demand driven technical assistance and
cooperation. § Support implementation of common monitoring tools and systems including utilization of the Joint
Review Missions for review and planning of sector interventions. § Develop mechanisms for generating, sharing and using information with implementing partners. § Build the capacity of coordinating secretariats for partnership (HENNET and private sector). § Encourage development partners to increasingly channel funds through joint financing
arrangements and use in-country systems § Establish and implement coordination mechanism for partner missions to the country. § Coordinate and pool capacity development support, particularly for systems strengthening.
Continued

60 Ministry of Public Health and Sanitation
z»
�
-1
ç
-
NO
2Â
o +oÞU
NHSSP II objective
Priority interventions
Objective 4: Improve efficiency and effectiveness
§ Fast track implementation of HRH initiatives. § Strengthen the management and availability of commodities and supplies. § Align infrastructure, communication & ICT strategies to ensure they support service delivery
effectively. § Strengthen the public financial management systems. § Strengthen use of strategies for bottom up planning and budgeting. § Scale up use of performance monitoring mechanism (including HMIS).
Objective 5: Improve financing of the health sector
§ Establish mechanisms to increase availability of resources. § Improve budget management and the efficiency and equitability of resource allocation and
utilization, particularly by developing costing frameworks, improving pro-poor resource allocation formulas, instituting cost-effectiveness analysis to aid prioritization, availing finance/cost information to the public, and incorporating all income sources for expenditure tracking.
§ Complete and implement health care financing strategy. § Implement HSSF, through more comprehensive district budgeting, finalization of guidelines, training,
and ensuring that fiduciary risk is low. § Implement the shadow budget as a means to link planning and budgeting processes for the entire
sector. § Improve predictability of resources by holding partners accountable to provide information on their
frameworks and budgets, and quarterly disbursement data.

61Strategic Plan 2008–2012
Cau
ses
of P
reva
ilin
g H
ealt
h Pr
oble
ms
and
Cha
llen
ges
Hig
h m
orb
idit
y an
d m
ort
alit
y d
ue
to p
reve
nta
ble
dis
ease
(m
ater
nal
, n
eon
atal
, U
5, H
IV/A
IDS
, T
B,
mal
aria
)
Hum
an r
esou
rce
1.N
umbe
r2.
Ski
lls3.
Atti
tude
4.S
uper
visi
on
Low
cov
erag
e1.
Imm
uniz
atio
n (5
1–88
%)
2.A
NC
– 4
vis
its (
35.7
%)
3.D
eliv
ery
skill
ed a
ttend
ant
(42%
), P
NC
<20
%4.
Fam
ily p
lann
ing
(2%
–58%
)5.
HIV
/TB
/Mal
aria
con
trol
6.M
anag
emen
t of m
inor
ailm
ents
7.Lo
w s
anita
tion
and
wat
er q
ualit
y8.
Non
-com
mun
icab
le d
isea
se
Ineq
uity
in
dist
ribut
ion
of s
ervi
ces
Low
util
izat
ion
Poo
r ac
cess
to
serv
ices
Eco
nom
ic
Hou
seho
ldin
com
e
“Sic
knes
s fu
nd”
Res
ourc
eal
loca
tion
Wea
k co
llabo
ratio
n w
ith o
ther
prov
ider
s
Geo
grap
hica
l(P
hysi
cal)
Dis
trib
utio
n of
faci
litie
s
Roa
ds a
ndtr
ansp
ort
Wea
k re
ferr
alsy
ste
m
Insu
ffic
ient
com
mun
ityhe
alth
car
e se
rvic
es
Inad
equa
tefu
ndin
gR
esou
rce
allo
catio
nN
o m
appi
ng/
quan
tific
atio
n
Gen
der
Rel
igio
n
Hou
seho
ld w
aste
Hos
pita
l was
te
Eff
icie
ncy
Pub
lic h
ealth
legi
slat
ion
Soc
io-c
ultu
ral
Infr
astr
uctu
re
Equ
ipm
ent
Dru
gs a
ndsu
pplie
s
Insu
ffic
ient
evi
denc
efo
r de
cisi
on m
akin
g
Poo
r qu
ality
of
serv
ices
Res
earc
hS
urve
illan
ce
Poo
r w
aste
man
agem
ent
Sta
ndar
ds a
nd g
uide
lines
not
avai
labl
e, n
ot u
sed;
no s
uper
visi
on
Low
lite
racy
/kn
owle
dge
Soc
io-c
ultu
ral
Eco
nom
ic
Hea
lth s
eeki
ngbe
havi
our/
prac
tices
Res
ourc
es
Wat
er/H
ygie
ne
Foo
d qu
ality
/N
utrit
ion
Low
lite
racy
/K
now
ledg
e
Pla
nt a
ndeq
uipm
ent
Ski
lls a
nd s
afet
y
Po
licy
cons
trai
nts
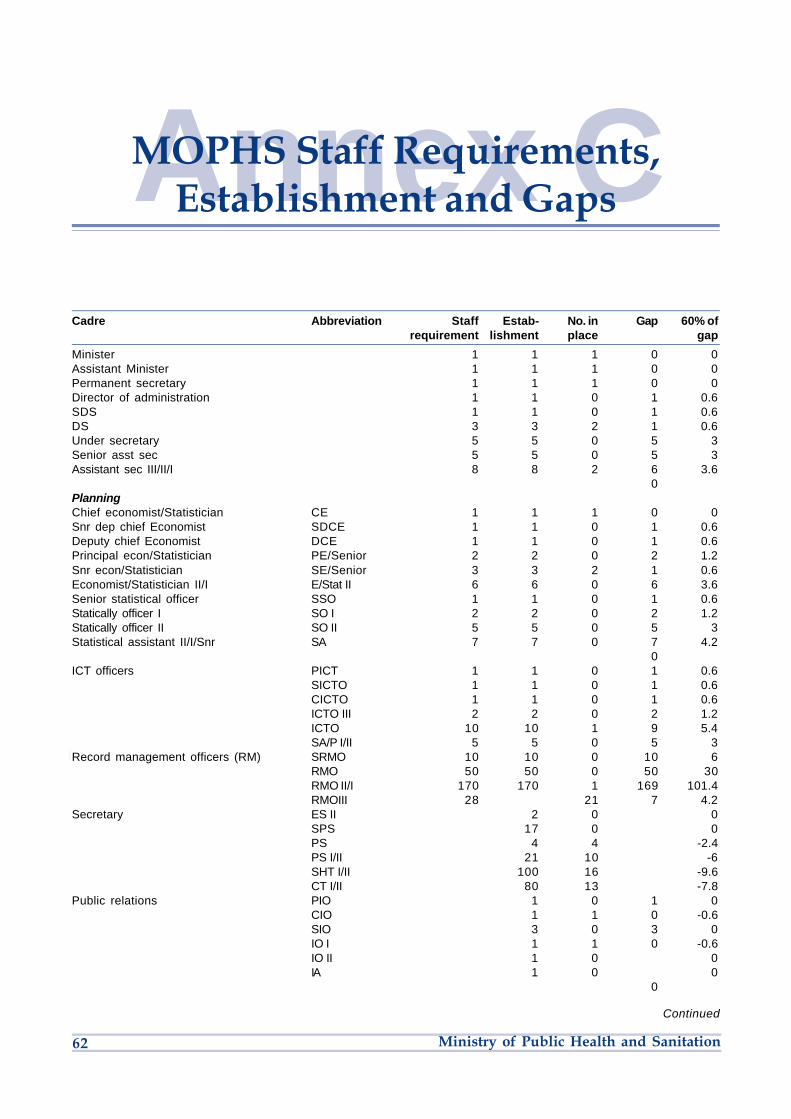
62 Ministry of Public Health and Sanitation
z»
�
-1
ç
-
NO
2Â
o +oÞU
Annex CMOPHS Staff Requirements,Establishment and Gaps
Cadre Abbreviation Staff Estab- No. in Gap 60% of requirement lishment place gap
Minister 1 1 1 0 0Assistant Minister 1 1 1 0 0Permanent secretary 1 1 1 0 0Director of administration 1 1 0 1 0.6SDS 1 1 0 1 0.6DS 3 3 2 1 0.6Under secretary 5 5 0 5 3Senior asst sec 5 5 0 5 3Assistant sec III/II/I 8 8 2 6 3.6 0PlanningChief economist/Statistician CE 1 1 1 0 0Snr dep chief Economist SDCE 1 1 0 1 0.6Deputy chief Economist DCE 1 1 0 1 0.6Principal econ/Statistician PE/Senior 2 2 0 2 1.2Snr econ/Statistician SE/Senior 3 3 2 1 0.6Economist/Statistician II/I E/Stat II 6 6 0 6 3.6Senior statistical officer SSO 1 1 0 1 0.6Statically officer I SO I 2 2 0 2 1.2Statically officer II SO II 5 5 0 5 3Statistical assistant II/I/Snr SA 7 7 0 7 4.2 0ICT officers PICT 1 1 0 1 0.6 SICTO 1 1 0 1 0.6 CICTO 1 1 0 1 0.6 ICTO III 2 2 0 2 1.2 ICTO 10 10 1 9 5.4 SA/P I/II 5 5 0 5 3Record management officers (RM) SRMO 10 10 0 10 6 RMO 50 50 0 50 30 RMO II/I 170 170 1 169 101.4 RMOIII 28 21 7 4.2Secretary ES II 2 0 0 SPS 17 0 0 PS 4 4 -2.4 PS I/II 21 10 -6 SHT I/II 100 16 -9.6 CT I/II 80 13 -7.8Public relations PIO 1 0 1 0 CIO 1 1 0 -0.6 SIO 3 0 3 0 IO I 1 1 0 -0.6 IO II 1 0 0 IA 1 0 0 0
Continued

63Strategic Plan 2008–2012
Security services SSO 1 0 0 SO II 3 0 0Assist security officer ASO 6 0 6 0S. security warden SSW 5 0 0 Procurement officers SPPO 1 1 0 1 0.6 PPO 1 1 0 1 0.6 CPO 1 1 1 0 0 SPO 3 1 2 -0.6 PO I 3 2 1 -1.2 PO II 5 3 2 -1.8 P Asst 12 4 8 -2.4 Senior storekeeper 1 0 1 0 Storekeeper 53 2 51 -1.2 0
Telephone supervisors TS II 1 1 0 -0.6 TO I/II /Senior 1 1 0 -0.6
Finance officers CFO 1 0 1 0DCFO 1 0 1 0SPFO 1 0 1 0FO I 4 1 3 -0.6FO III/II 3 0 3 0
Accounting officers PAC 1 0 1 0 AC 1 0 1 0 CA 1 1 0 -0.6 SA 7 3 4 -1.8 AC I 19 7 12 -4.2 AC II 64 2 62 -1.2 AA II/I 90 6 84 -3.6 0
Human resource management officers DD HRM 1 0 1 0 SAD(HRM) 1 0 1 0 ADHRM 1 1 0 -0.6 PHRMO 1 1 0 -0.6 CHRMO 1 0 1 0 SHRMO 3 0 3 0 HRMO I 1 0 1 0 HRMO II 9 4 5 -2.4 HRM Asst III/ II/I 39 4 35 -2.4Human resource development
officers (HRDO) ADHRMO 1 0 0 CHRDO 1 0 1 0 CTO 1 0 0
Clerical officers 645 15 630 -9 0Drivers Driver III/II/I/Senior 498 383 298.8
Librarian Library I 1 0 1 0 Library II 4 0 4 0 Library asst 1 0 1 0Audio visual aids officer 6 0 0Audio visual aid asst III/IIB/IIA/I 1 0 0Chief training officer (mass media) 1 0 0Chief supp printer 1 0 0Designer II 3 0 0Photographer II 2 0 0Photographer III 1 0 0Photo lithographer 1 0 0Cameraman III 1 0 0
Cadre Abbreviation Staff Estab- No. in Gap 60% of requirement lishment place gap
Continued
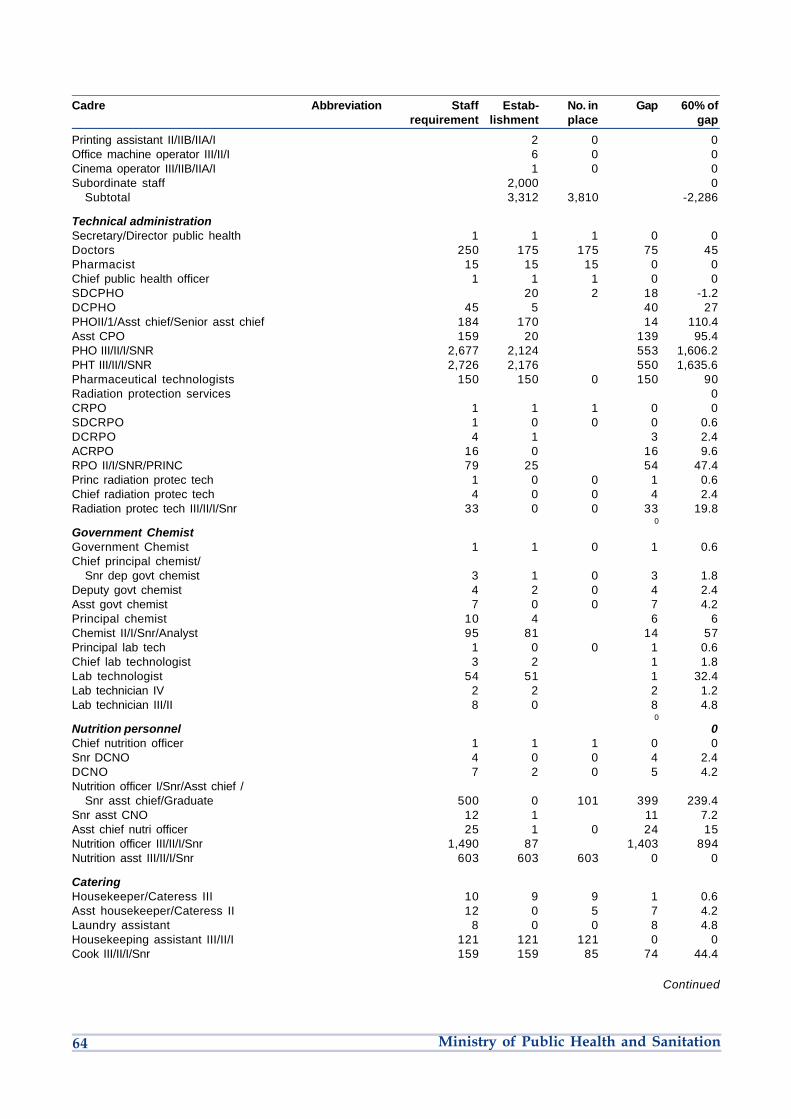
64 Ministry of Public Health and Sanitation
z»
�
-1
ç
-
NO
2Â
o +oÞU
Printing assistant II/IIB/IIA/I 2 0 0Office machine operator III/II/I 6 0 0Cinema operator III/IIB/IIA/I 1 0 0Subordinate staff 2,000 0 Subtotal 3,312 3,810 -2,286
Technical administration Secretary/Director public health 1 1 1 0 0Doctors 250 175 175 75 45Pharmacist 15 15 15 0 0Chief public health officer 1 1 1 0 0SDCPHO 20 2 18 -1.2DCPHO 45 5 40 27PHOII/1/Asst chief/Senior asst chief 184 170 14 110.4Asst CPO 159 20 139 95.4PHO III/II/I/SNR 2,677 2,124 553 1,606.2PHT III/II/I/SNR 2,726 2,176 550 1,635.6Pharmaceutical technologists 150 150 0 150 90Radiation protection services 0CRPO 1 1 1 0 0SDCRPO 1 0 0 0 0.6DCRPO 4 1 3 2.4ACRPO 16 0 16 9.6RPO II/I/SNR/PRINC 79 25 54 47.4Princ radiation protec tech 1 0 0 1 0.6Chief radiation protec tech 4 0 0 4 2.4Radiation protec tech III/II/I/Snr 33 0 0 33 19.8 0
Government Chemist Government Chemist 1 1 0 1 0.6Chief principal chemist/
Snr dep govt chemist 3 1 0 3 1.8Deputy govt chemist 4 2 0 4 2.4Asst govt chemist 7 0 0 7 4.2Principal chemist 10 4 6 6Chemist II/I/Snr/Analyst 95 81 14 57Principal lab tech 1 0 0 1 0.6Chief lab technologist 3 2 1 1.8Lab technologist 54 51 1 32.4Lab technician IV 2 2 2 1.2Lab technician III/II 8 0 8 4.8 0
Nutrition personnel 0Chief nutrition officer 1 1 1 0 0Snr DCNO 4 0 0 4 2.4DCNO 7 2 0 5 4.2Nutrition officer I/Snr/Asst chief /
Snr asst chief/Graduate 500 0 101 399 239.4Snr asst CNO 12 1 11 7.2Asst chief nutri officer 25 1 0 24 15Nutrition officer III/II/I/Snr 1,490 87 1,403 894Nutrition asst III/II/I/Snr 603 603 603 0 0
Catering Housekeeper/Cateress III 10 9 9 1 0.6Asst housekeeper/Cateress II 12 0 5 7 4.2Laundry assistant 8 0 0 8 4.8Housekeeping assistant III/II/I 121 121 121 0 0Cook III/II/I/Snr 159 159 85 74 44.4
Cadre Abbreviation Staff Estab- No. in Gap 60% of requirement lishment place gap
Continued

65Strategic Plan 2008–2012
Vector-borne disease staff Chief medical parasitologist/Entomologist 0 0 1 1 -0.6Snr deputy chief parasitologist/
Entomologist 2 0 2 1.2Deputy chief parasitologist/Entomologist 10 0 0 10 6Asst chief medical parasitologist/
Entomologist 30 1 1 29 17.4Medical parasitologist/ Entomologist II/I/
Snr/Principal 200 17 17 183 109.8Mortuary attendant III/II 856 40 816 513.6Ent field lab tech III/II/I/Snr 369 67 302 221.4Ent field tech III/II/I/Snr 359 359 359 0 0Chief medical biochemist 1 0 0 1 0.6Snr deputy chief medical biochemist 4 0 0 4 2.4Deputy chief medical biochemist 6 6 0 6 3.6Asst deputy chief medical biochemist 18 0 0 18 10.8Medical biochemist II/I/Snr/Chief 94 11 0 83 56.4Snr biochemist 3 3 0 3 1.8Biochemist II/I 10 10 2 8 4.8Biologist II 1 1 1 0 0Asst. livestock officer 0 1 1 -0.6Livestock health assistant 1 1 1 1 0Junior animal house asst 2 2 0 2 1.2Leprosy asst II B 2 2 0 2 1.2
National Public Health Lab Services Chief medical lab technologist 1 1 0 1 0.6Snr deputy chief medical lab. technologist 3 0 0 3 1.8Deputy chief medical lab tech 10 1 0 9 6Snr asst chief medical lab technologist 100 1 99 60Asst chief medical lab tech. 214 0 1 213 127.8Medical lab. tech I/Snr./asst. chief/
Snr asst chief (Graduates) 900 11 14 3 531.6Medical lab technologist III/II/I/Snr (Dip) 3,196 638 720 82 1,485.6Chief medical lab technician 0Deputy chief medical lab technician 0Snr medical lab technician 0Medical lab technician III/II/I 736 1,106 918 188 -109.2
Health promotion Chief health education officer 3 0 3 0Deputy chief health education officer 4 0 4 0Snr health educ officer 1 0 1 0Education officer III/II/I 30 0 30 0Snr family planning field educator 1 0 1 0Family planning filed officer II 40 0 40 0Family planning field officer II/IIB/IIA 171 0 171 0Lecturer I 0 0 -1 0Khadi I 0 1 -1 -0.6Pricing officer 0 1 -1 -0.6Licensing officer II 0 1 -1 -0.6
Mental health services Prin social welfare officer 1 1 1 1 0Chief social welfare officer 1 1 0 1 0.6Snr social welfare officer 2 2 1 1 0.6Social welfare officer I 9 9 2 7 4.2Social welfare officer II 21 21 0 21 12.6Social welfare officer III 37 37 4 33 19.8Social welfare asst. III/IIB/IIA/I 27 27 0 27 16.2
Cadre Abbreviation Staff Estab- No. in Gap 60% of requirement lishment place gap
Continued

66 Ministry of Public Health and Sanitation
z»
�
-1
ç
-
NO
2Â
o +oÞU
Health administration services Chief health administrative officer 1 1 0 1 0.6Snr dep chief health administrative officer 0Deputy chief health administrative officer 2 2 1 1 0.6Asst chief health administrative officer 10 10 10 0 0Snr health administrative officer 165 165 99Health administrative officer I 790 790 474Health administrative officer II 511 511 306.6 Nursing Chief nursing officer 1 1 0 1 0.6Snr dep chief nursing officer 0Dept chief nursing officer 0Asst chief nursing officer 200 120Snr nursing officer 6,383 3,829.8Nursing office III/II 8,305 4,983Enrolled nurse III/II/I 16,370 9,822 0Clinical officers 1,300 500 500 800 480 0Community oral health officers 806 483.6Laboratory technicians 806 483.6Pharmaceutical technologist 806 483.6Statistical clerks 1,612 967.2Clerks/cashiers 806 483.6General attendants 1,612 967.2Cooks 806 483.6Watchmen 1,612 967.2General attendants 5,344 3,206.4Watchmen 2,672 1,603.2 0Total 68,467 17,877 7,626 8,078 36,504.6
Cadre Abbreviation Staff Estab- No. in Gap 60% of requirement lishment place gap

67Strategic Plan 2008–2012
Annex DTransport Requirements
Table C1: Vehicles per level and units
Region Programmes
HQ NBI Nyanza R/V Western Eastern Central Coast NEP HQ NASCOP NTLB KEPI Malaria
Available 16 27 4 18 47 35 40 30 20 12 27 9 20 4Required 28 23Gap 12 3Drivers 6 59 20 37 20 15Ambulances 34
Table C2: Transport requirements by province, district and location
Category Requirement Available Gap
Minister 1 4WD, 2 others 3 3 -Asst Minister Prado 1 1 0PS PradoPGT 2 2 0HQ 4WD double cabin (4)4WD Prado (4) 25 15 10HQ – Pool D/Cain/Prado Nissan XTrail (2) 22 12 10Programmes 4WD (60) 109 99 4
Lorry (7) 9 7 2Provinces (8) 4WD double cab (2) 16 -2
Utility vehicle, 4WD (2) 16 -10 seater (2) 16 -
Districts (150) 4WD (1) 150 -10 seater (1) 150 -4WD Ambulance (1) 150 0 150Motorboat (2):Bondo, Lamu, Busia, Suba 6 3 3
Locations (7,100) Bicycles (20) 142,0000 3,000 139,000Motorbikes (1) 3,000 300 2,700
Notes:1. The information for the vehicles available was difficult to get and inconsistent in nature.2. On requirements, it is assumed that each PHMT and DHMT will require two 4WD utility vehicles and one 4WD ambulance for eachdistrict and there are currently 170 districts.3. The following are the cost estimates used for the various vehicles
• Purchase of new fully equipped ambulances @ Ksh4M
• Utility vehicles @ Ksh3M
• 7-tonne Lorry @ Ksh8M (or equivalent to three utility vehicles)
• Motor boats - 3M
• Motorbikes @ Ksh350,00
• Bicycles @ Ksh6,000
• Regular maintenance programmes @ Ksh500,000 per vehicle per year.

68 Ministry of Public Health and Sanitation
z»
�
-1
ç
-
NO
2Â
o +oÞU

�
Uz»
�
-1
ç
-
NO
2Â
o +oÞ

Ministry of Public Health and SanitationAfya HouseCathedral RoadPO Box 3469 – City SquareNairobi 00200, Kenya
www.health.go.ke