mining waste treatment technology selection - clu-in · mining waste treatment ... right moves...
TRANSCRIPT

11
1
Mining Waste Treatment Technology Selection
An ITRC Web-based Technical and Regulatory Guidance Document
Welcome – Thanks for joining this ITRC Training Class
Sponsored by: Interstate Technology and Regulatory Council (www.itrcweb.org) Hosted by: US EPA Clean Up Information Network (www.cluin.org)
Mining produces millions of tons of waste each year. Contaminants from unreclaimed or unremediated areas have affected millions of acres of land and over 10,000 miles of stream. Historical mining practices and the absence of routine mined-land reclamation, remediation, and restoration have led to legacy sites with significant environmental and human health impacts. New mining operations continue to have severe waste issues that must be addressed during and after the actual mining operation. Conventional remedial solutions are often lengthy, expensive, and unacceptable to the regulated and regulatory communities, as well as to the public.ITRC’s Mining Waste Team developed the ITRC Web-based Mining Waste Technology Selection site to assist users in selecting an applicable technology, or suite of technologies, which can be used to remediate mine waste contaminated sites. Decision trees, through a series of questions, guide users to a set of treatment technologies that may be applicable to that particular site situation. Each technology is described, along with a summary of the applicability, advantages, limitations, performance, stakeholder and regulatory considerations, and lessons learned. Each technology overview links to case studies where the technology has been implemented. In this associated Internet-based training, instructors provide background information then take participants through the decision tree using example sites. users, regulators, site owners, and community stakeholders should attend this training class to learn how to use the ITRC Web-based Mine Waste Technology Selection site to identify appropriate technologies, address all impacted media, access case studies, and understand potential regulatory constraints. ITRC (Interstate Technology and Regulatory Council) www.itrcweb.orgTraining Co-Sponsored by: US EPA Technology Innovation and Field Services Division (TIFSD) (www.clu-in.org) ITRC Training Program: [email protected]; Phone: 402-201-2419

2
2
Housekeeping
Course time is 2¼ hoursQuestion & Answer breaks• Phone - unmute #6 to ask
question out loud• Simulcast - ? icon at top to
type in a questionTurn off any pop-up blockers
Move through slides• Arrow icons at top of screen• List of slides on left
Feedback form available from last slide – please complete before leavingThis event is being recorded
Go to slide 1
Move back 1 slide
Download slides as PPT or PDF
Move forward 1 slide
Go to seminar
homepage
Submit comment or question
Report technical problems
Go to last slide
Copyright 2014 Interstate Technology & Regulatory Council, 50 F Street, NW, Suite 350, Washington, DC 20001
Although I’m sure that some of you are familiar with these rules from previous CLU-IN events, let’s run through them quickly for our new participants.
We have started the seminar with all phone lines muted to prevent background noise. Please keep your phone lines muted during the seminar to minimize disruption and background noise. During the question and answer break, press *6 to unmute your lines to ask a question (note: *6 to mute again). Also, please do NOT put this call on hold as this may bring unwanted background music over the lines and interrupt the seminar.
You should note that throughout the seminar, we will ask for your feedback. You do not need to wait for Q&A breaks to ask questions or provide comments using the ? icon. To submit comments/questions and report technical problems, please use the ? icon at the top of your screen. You can move forward/backward in the slides by using the single arrow buttons (left moves back 1 slide, right moves advances 1 slide). The double arrowed buttons will take you to 1st and last slides respectively. You may also advance to any slide using the numbered links that appear on the left side of your screen. The button with a house icon will take you back to main seminar page which displays our presentation overview, instructor bios, links to the slides and additional resources. Lastly, the button with a computer disc can be used to download and save today’s presentation slides.

3
3 ITRC (www.itrcweb.org) – Shaping the Future of Regulatory Acceptance
Host organizationNetwork• State regulators
All 50 states, PR, DC• Federal partners
• ITRC Industry Affiliates Program
• Academia• Community stakeholders
Disclaimer• Full version in “Notes” section• Partially funded by the U.S.
governmentITRC nor US government warrantee materialITRC nor US government endorse specific products
• ITRC materials copyrighted
Available from www.itrcweb.org• Technical and regulatory
guidance documents• Internet-based and classroom
training schedule• More…
DOE DOD EPA
The Interstate Technology and Regulatory Council (ITRC) is a state-led coalition of regulators, industry experts, citizen stakeholders, academia and federal partners that work to achieve regulatory acceptance of environmental technologies and innovative approaches. ITRC consists of all 50 states (and Puerto Rico and the District of Columbia) that work to break down barriers and reduce compliance costs, making it easier to use new technologies and helping states maximize resources. ITRC brings together a diverse mix of environmental experts and stakeholders from both the public and private sectors to broaden and deepen technical knowledge and advance the regulatory acceptance of environmental technologies. Together, we’re building the environmental community’s ability to expedite quality decision making while protecting human health and the environment. With our network of organizations and individuals throughout the environmental community, ITRC is a unique catalyst for dialogue between regulators and the regulated community.For a state to be a member of ITRC their environmental agency must designate a State Point of Contact. To find out who your State POC is check out the “contacts” section at www.itrcweb.org. Also, click on “membership” to learn how you can become a member of an ITRC Technical Team.
Disclaimer: This material was prepared as an account of work sponsored by an agency of the United States Government. Neither the United States Government nor any agency thereof, nor any of their employees, makes any warranty, express or implied, or assumes any legal liability or responsibility for the accuracy, completeness, or usefulness of any information, apparatus, product, or process disclosed, or represents that its use would not infringe privately owned rights. Reference herein to any specific commercial product, process, or service by trade name, trademark, manufacturer, or otherwise does not necessarily constitute or imply its endorsement, recommendation, or favoring by the United States Government or any agency thereof. The views and opinions of authors expressed herein do not necessarily state or reflect those of the United States Government or any agency thereof and no official endorsement should be inferred.The information provided in documents, training curricula, and other print or electronic materials created by the Interstate Technology and Regulatory Council (“ITRC” and such materials are referred to as “ITRC Materials”) is intended as a general reference to help regulators and others develop a consistent approach to their evaluation, regulatory approval, and deployment of environmental technologies. The information in ITRC Materials was formulated to be reliable and accurate. However, the information is provided "as is" and use of this information is at the users’ own risk. ITRC M t i l d t il dd ll li bl h lth d f t i k d ti

44
4
Meet the ITRC Trainers
Cherri BaysingerMissouri Department of Health and Senior ServicesJefferson City, MO [email protected]
Paul Eger St Paul, MN [email protected]
Doug Bacon Utah Department of
Environmental QualitySalt Lake City, UT 801-536-4282 [email protected]
Cherri Baysinger is the Administrator for the Section of Epidemiology for Public Health Practices with the Missouri Department of Health and Senior Services in Jefferson City, MO. She has worked for the state of Missouri since 1991, dividing her time between the Missouri Department of Health and Senior Services and the Department of Natural Resources. Regardless of which agency she was working for, Cherri has spent most of her career working on mining waste sites. Since 2007, she has overseen environmental health activities occurring throughout the state, including around Missouri’s current and historic lead mining sites. In previous positions, she has worked on the Superfund project management side and prepared risk assessments for mining sites and other hazardous waste sites. Cherri is a regular guest lecturer in undergraduate and graduate level environmental health courses, covering topics such as risk assessment, hazardous waste, air and water quality. In her spare time, Cherri enjoys swimming, canoeing and dancing with her husband, Tom, and spending time with her three adorable, yet loud, granddaughters. Cherri has been a co-team leader for ITRC’s Mining Waste Team since 2005. Cherri earned a bachelor's degree in Biology and a master’s degree in Forestry, Fisheries and Wildlife from the University of Missouri-Columbia in 1982 and 1989, respectively. Paul Eger is a volunteer with Minnesota Department of Natural Resources. He specializes in passive treatment of mining influenced water, waste management, reclamation and regulatory issues. Prior to 2011, he was a principal engineer with the Minnesota Department of Natural Resources, Division of Lands and Minerals, where for over 30 years he worked with environmental issues related to mining. He was a pioneer in the use of wetlands to remove trace metals from mine drainage, and much of his work focused on the development of successful passive treatment systems to control mine drainage problems. He has also been a leader in the development of cost-effective and environmentally safe reclamation using waste products, such as municipal solid waste compost, paper processing waste, and dredge material from Lake Superior. He served as an expert witness on water quality issues and at reclamation rules hearings and served on the Department's hazardous waste team, where he was responsible for the clean up of abandoned dump sites. Paul has been involved with ITRC for 10 years; initially as a member and instructor for the Constructed Treatment Wetlands team and later as a co-team leader and training instructor for the ITRC Mitigation Wetlands and Mining Waste teams. He earned a bachelor’s degree in chemical engineering from the University of Rochester in Rochester, NY. Paul is a registered professional engineer. Douglas Bacon has worked for the Utah Department of Environmental Quality (UDEQ) since 1997. He is currently a project manager for the Utah Division of Environmental Response & Remediation, located in Salt Lake City, Utah. His responsibilities include overseeing the CERCLA and State Natural Resource Damage Claim response actions at the Kennecott South and North Zones (Copperton and Magna, Utah). He has been involved with the negotiation of multiple CERCLA response decisions, federal consent decrees, contracts to implement terms and conditions of the State natural resource damage settlement, and contracts/plans to insure the long-term management and oversight of response actions at his sites. Douglas previously worked for the Utah Division of Water Quality (another division of UDEQ) as a water quality monitor sampling lakes and streams. From 1995 to 1997 Douglas worked for the Lake Sunapee Protection Association in Sunapee, New Hampshire as a field and lab technician (during and after college). Since 1995 he has had experience investigating and addressing water quality and soil contamination concerns, and since 1999 he has had regulatory experience within the mining industry. In his spare time he enjoys hiking, skiing, and biking in and around the mountains of Utah. He has been active in the ITRC since 2007 serving as Utah’s team member on the Mining Waste team from its inception. Douglas earned a bachelor’s degree in Environmental Biology with a minor in Marine Studies from Plymouth State College in Plymouth, New Hampshire in 1997. He is currently a Certified Public Manager.

55
5
Team is fairly diverse(35 participants)
Products• 2007 - Mine Waste Issues of the United States: A White Paper• 2010 - ITRC’s Mining Waste Technology Selection Guidance
Quick method of selecting potential technologies to address multiple environmental conditions at a site
• 2013 - Biochemical Reactors for Mining-Influenced Water technology guidance
ITRC Mining Waste Team
States29%
Federal Agencies
29%
Industry33%
University2%
Community Stakeholders
5%International2%
Team is fairly diverse, encompassing several states and federal agencies, as well as representatives from industry, academia and the public. We even have one token bear.
The team produced a white paper in 2007 which generally described issues related to mining waste. The team has also put in a new proposal for 2011 to further explore one of the technologies, Biochemical Reactors. This is a probably one of the more controversial technologies that our team explored.
Finally, our team has produced the Mining Waste Technology Selection Guidance. This is a guidance aimed at assisting individuals who are managing mining waste sites in choosing appropriate technologies for sites which they are managing. Those individuals may be state, federal or industrial users. The guidance may also be useful for the public or other interested stakeholders because factors in the decision making process as well as information related to treatment technologies are included in the guidance.
ITRC’s Mining Waste Technology Selection Guidance offers the user a quick method of selecting potential technologies to address multiple environmental conditions at a site

66
6
Mine Waste – A Burning Issue
Underground oxidation occurring in a coal mine in Venezuela.

7
7
Value of this Guidance
Web-address: www.itrcweb.org/miningwaste-guidance(right click to open hyperlink to website)
Quick tool to identify appropriate technologies
Applies to all potentially impacted media
Access to case studies
Reference tool for new personnel
Describes potential regulatory constraints
Quick tool to identify appropriate technologiesSaves timeSaves money
Applies to all potentially impacted media soilchat, tailings or other solid mine wastessurface water and groundwatermine pools
Access to existing case studiesexamples where these technologies have been used
Reference tool for new personnelmanaging a mining site can be a daunting taskintroduce some of the thought processes that go into decision makingintroduce and describes many remedial technologies
Describes potential regulatory constraintsinnovative ways to overcome regulatory constraintsproblem vs. technologyPassive vs. active
8
8
What We Will Cover Today
Background to mining issues
Overview of guidance• Decision trees
• Technologies
• Case studies
• Regulatory issues
Case study: Dunka Mine, Minnesota
Case study: Bingham Mine, Utah
What are we going to cover during this training?Background on mining issues - CherriBrief overview of what all is in the guidance - CherriWork through the guidance using two case studies
Dunka Mine in Minnesota - PaulBingham Mine in Utah – Doug
8

9
9
Goals
Provide participants with an understanding of issues related to mining wasteFamiliarize participants with the content and components of the Mining Waste Technology Selection GuidanceFamiliarize participants with the use of the guidance using case studies
No associated notes.

1010
10
Mining is Important
Issues• Mining practices• Lack of mined land reclamation and
restoration laws Needs• Innovative technologies
and approaches • Solutions for
regulatory barriers
Mining is important to out economy.Need metals, minerals and fuels that are mined to support current lifestyleIf you can’t grow it, you mine it!
However, mining is messy. Over 90% of the material brought up to the surface from a mine is waste material. Creates large volumes of solid mine waste. The lack reclamation and restoration laws led to sites with significant environmental and human health issues associated with exposure to mine waste materials.Current regulatory solutions to deal with mine wastes are expensive and take a long time to implement, and are often not acceptable to the public, the regulatory community and the regulated community. Innovative technologies and approaches are needed to deal with these issues.Any time you use innovative approaches and technologies, you generally run into regulatory barriers. Solutions for these barriers are also needed

1111
11
Scale of the Problem
Large sitesSingle sites• Annapolis Lead Mine, MO• Anaconda Superfund Site, MT
Mining districts• St. Francois County, MO• Affect large areas• Many small mines
Mining sites tend to be large. Affected areas range from many acres to 100’s of square milesSingle sites
Annapolis Lead MineMining siteRelatively small - less than 1 square mile with over 1.1
million tons of mining waste material deposited in a ravine.Anaconda Superfund site, MT
Mining, smelting complex~ 300 square miles
In both cases, Uplands, wetlands, groundwater, streams, soils and residents affected
Mining districtsOld Lead Belt of southeast MissouriMining, milling and smelting area Mining occurred over 108 yearsCovers about 200 square milesMany small mines located throughout the area – there are approximately 1,000 miles of abandoned multilevel mine tunnels, with 300 miles of underground mainline railroad tracksSoil, air water, biota and residents have been affected

12
12
Media Affected by Mining Waste
AirWaterSoilVegetation
1
2
34
Mining waste can affect all media in an area.Photo 1 shows fine tailings blowing off the Elvins/Rivermines chat pile in the old lead belt of southeast Missouri. Fine tailings, which contain residual metals, are picked up and transported offsite by wind. As the fine tailings are in the air, people or other organisms can be exposed to the metals in the tailings through inhalation. Exposure to the fine tailings may also occur after they have been deposited on soil.
Photo 2 shows typical red acid mine drainage. AMD is caused when water flows over or through sulfur-bearing materials and forms solutions of net acidity. AMD can dissolve and transport heavy metals such as copper, lead, mercury into ground or surface water.
The red circled areas in Photos 3&4 show soil and vegetation affected by mine waste. The picture in the center is the fine tailings area at the base of the National Tailings Pile, again in the old lead belt of southeast Missouri. The remaining picture is of the historic Bingham & Garfield rail corridor. This rail line transported ore from the Bingham Pit to the smelters located in Arthur and Garfield (north of Copperton, Utah). Both of these pictures show soil and vegetation affected by mine waste. While affected soil may be difficult to see from these pictures, the patchiness of vegetation is more evident.
12

13
13
Solid Mining Waste
Includes• Mine pits and workings• Waste rock stockpiles• Tailings• Smelter waste• Other
Contain residual metals orother chemicals
Hundreds of square miles affected
Residual minerals left in place or brought to the surface as waste rock or tailings are exposed to water and to the atmosphere, which may mobilize those minerals and metals, allowing them to move out of the existing formations and into soil and water. Once this occurs, people and biota are more likely to come into contact with them.
Top photo: A mine in Colorado with the tailings piled down a mountainside.Bottom photo: National Tailings Pile, one of the six large tailings piles in the Old Lead Belt in Park Hills, MO.

1414
14
Mining-Influenced Water
Mine drainage• pH• Contaminants
Over 10,000 stream miles impactedGroundwater impacts
MIW can either be acidic or have a ph around to 7, or what we consider circumneutral. Particularly if it is acidic, mining-influenced water can have unacceptably high levels of cyanide and metals. Nationwide, over 10,000 stream miles have been affected by mining-influenced water. In some areas, groundwater may also be affected. This can be an issue when groundwater is used for drinking water.
Photo: typical red acid mine drainage from a mine in Minnesota.

15
15
Objectives of the Guidance
Select applicable technology(s)Provide information on technologiesRemediate mine waste contaminated sites
Flambeau Mine, WIDuring mining
Flambeau Mine, WIAfter reclamation
Flambeau Deposit was mined between 1993 and 1997. During these four years operating life, Flambeau Mine produced 181,000 tons of copper; 334,000 ounces of gold and 3.3 million ounces of silver.
15

16
16
Approach
Problem based technology/regulatory guidance• Multiple technologies solve problems• Select appropriate technologies
Optimize your approach • Clean up the source• Clean up the media
Sites are huge, many issues, can be daunting to take one on.Problem based tech reg guidance – there are generally many ways to solve a problem. This guidance is aimed at helping Users select
Instead of taking one technology and exploring all aspects of the technology, we chose to take a problem – mine waste sites, and develop a guidance around selecting the appropriate technology to deal with the problem. Multiple technologies may be used to address any situation – this will give you a series of options for any given issueOptimize your approach –In some instances, it may be more appropriate to clean up the source – tailings piles or chat pilesIn other instances, because of location, size of the source or accessibility, it may be more appropriate to clean up the contaminated media.
16

17
17
Advantages of Web-based Approach
Interactive• Easy to navigate
Graphics• Color images, photos, etc can be used for
illustrationFlexible• Easier to update site as new information or case
studies become available
No associated notes.

18
18
Content of Guidance
Overview
Decision Trees
Technology Overviews
Case Studies
Regulatory Issues
Stakeholders Concerns
Additional Resources
Overview – general information on issues related to miningDecision Trees – to help guide a project manager to a set of potential technologies which may be used at a siteTechnology overviews – 22 technologies are coveredCase studies – 58 case studies which have used these technologiesA section on regulatory issues and potential strategies for navigating the issuesA section on stakeholder concerns and a section with links to additional resources which may be useful to those working on mining sites.
18

19
19
Overview Page
Sidebar Navigation
Register for
Internet based
training
Print PDF versions
of the page
Overview page has general information on issues related to mining waste.
All pages have:A link to register for IBT, which you may have used to register for this trainingSidebar navigation to allow users to quickly move around the guidanceA link to a PDF of the page
19

20
20
Overview Page
Navigation in the footer
Contact information for Team Leaders and ITRC
Disclaimer, Privacy and Usage Policies
Again, all pages haveNavigation in the footer – to allow the user to move around the siteContact information for ITRCAnd the fine print
20

21
21
Decision Trees – Getting Started
>2 years
<2 years
Mine problems may include contaminated groundwater, residential yards, large areas of mine waste, or surface waters.
Decision trees present a series of questions that lead a user to a series of technologies that may be applicable to their situation.
Showing the decision trees as an overview. I don’t expect you to read through the questions on the trees. Paul will walk you through the trees as he presents a case study.
The first question presented is whether you have a situation that needs to be addressed immediately (in the is case, within two years) or if you have a longer time period in which to complete your action. Immediate actions generally necessary when you have actual human or environmental exposures above acceptable levels. Immediate vs. longer term is loosely based on the Superfund removal/remedial programs.
Beyond that, actions can be taken to address solid mine wastes, such as tailings or chat, generally the sources for mining-influenced water, or actions can be taken to address mining-influenced waters.
The user should go through the decision tree separately for each issue to be addressed

22
22
Immediate Decision Tree
Navigation aids• Titles• “You are here” diagram
There are a couple of navigation aids within the decision trees.Each page of the decision tree has a descriptive title, which includes “Part One” or “Part Two,” where applicable.In the upper corner of each page under the Printer Friendly Version button is a schematic of the entire decision tree, with the particular part of the decision tree you are in highlighted.I will just flip through the rest of the decision trees to point out some features. Paul and Doug will go through the decision trees in more detail in a little bit.

23
23
Solid Mining Waste Decision Tree
Links to Technology Overviews
At the end of each series of questions, there is a list of potentially applicable technologies. Click on the technology to bring up the technology overview page.
23

24
24
Mining-Influenced Water Decision Tree
Links back to other trees as necessary
In some cases, a user will need to move from one part of the decision tree to another. Those links are provided where necessary.
A word about color:In general, those parts of the decision tree related to solid mining waste are green, those parts related to mining-influenced water are blue and those points where you “jump” into one part of the decision tree to another are big orange arrows. As you progress deeper into the tree, the colors get darker.

25
25
Technology Overviews
Focus• Information on
newer technologies
• Novel uses of conventional technologies
• Provide case studies and additional references
The focus of the tech overviews is to :Present information on newer technologiesDiscuss new approaches in conventional technologiesProvide case studies and additional references
Each technology consists of:Introduction/OverviewApplicabilityAdvantagesLimitationsPerformance (Results)Cost ConsiderationsRegulatory ConsiderationsStakeholder Considerations / Public AcceptanceLessons LearnedCase StudiesReferences
25

26
26
Technology Overviews
1. Administrative and Engineering Controls *
2. Aeration3. Anoxic Limestone Drains4. Backfilling, Subaqueous
Disposal5. Biochemical Reactors *6. Capping, Covers and Grading7. Chemical Stabilization8. Constructed Treatment
Wetlands *9. Diversionary Structures10. Electrokinetics11. Electrocoagulation
12. Excavation and Disposal13. In situ Biological Treatment14. In situ Treatment 15. Ion Exchange16. Microbial Mats17. Passivation18. Permeable Reactive Barriers *19. Phosphate Treatment –Chemical
Stabilization20. Phytotechnologies *21. Pressure Driven Membrane
Separation22. Reuse and Reprocess
* ITRC has guidance documents
There are technology overviews for 22 different technologies. The technology overviews are not design manuals. The Mine waste team has coordinated with Acid Drainage Technology initiative (ADTI) and International Network for Acid Prevention (INAP) to avoid duplication of effortsRecent publications provide design information
Global Acid Rock Drainage (GARD) Guidehttp://www.gardguide.com/index.php/Main_PageManagement Technologies for Metal Mining Influenced Water—Mitigation of Metal Mining Influenced Water (Volume 2)Gusek, James J. and Figueroa, Linda A. 2009. Society for Mining,Metallurgy, and Exploration, Inc.www.smenet.org
26

27
27
Case Studies
Site InformationRemedial Actions and TechnologiesPerformanceCostRegulatory ChallengesStakeholder ChallengesOther Challenges/ Lessons LearnedReferences
No associated notes.
27

2828
28
Case Study Distribution
# Mining Case StudiesTotal of 59 Case Studies
(as of August 2010)
423
5
9
6
1
7
8
10
11 12
13 1415
16
17
18
19
20
2122
23
24
25
26
2728
29
30
31
32 3334
35 36
3738
39
40
41
44
43
4248
47
45
4652
51
4950
55
53 5457
5658 59
59 Case studies collected and summarized
29
29
Regulatory Issues
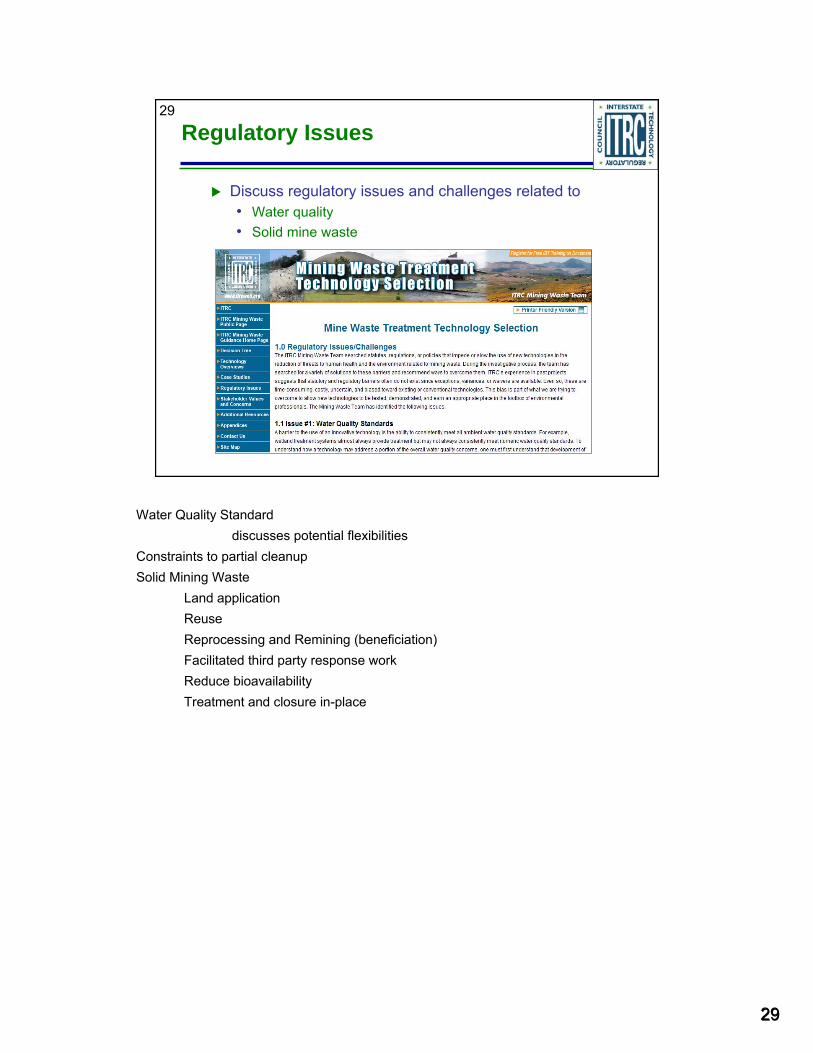
Discuss regulatory issues and challenges related to• Water quality• Solid mine waste
Water Quality Standarddiscusses potential flexibilities
Constraints to partial cleanupSolid Mining Waste
Land applicationReuseReprocessing and Remining (beneficiation)Facilitated third party response workReduce bioavailabilityTreatment and closure in-place
29
30
30
Stakeholder Concerns
Competing values may slow the cleanup • Public health• Ecological health
Full vs. partial cleanup• Why not clean up to background
Economics • Workforce
Public well being-livabilityRelocationHistorical value – landscapeDo no harm

31
31
Summary
Web-based guidance• Assumes site is characterized• Help select appropriate technologies to remediate
contaminated mine sites• May need to go through decision trees several
timesTechnology overviews - not design manualsUnique site characteristics and costs must be carefully considered
No associated notes.

32
32
Course Road Map
Background to mining issues
Overview of guidance• Decision trees
• Technologies
• Case studies
• Regulatory issues
Case study: Dunka Mine, Minnesota
Case study: Bingham Mine, Utah
No associated notes.

33
33
Case Study – Site Location
Project located in north eastern Minn at the east range of the Mesabi Iron Range
33

34
34
Case Study – Dunka Mine
Open pit taconite mine~ 3 mile long ~ ¾ mile wide ~ 300 feet deepBegan in early 1960’s, closed mid 1990’sAbout 395 AcresOver 50 million metric tons of sulfide-containing waste had been stockpiled adjacent to the pitSite sits along the western edge of a small watershed (about 2,275 acres) characterized by a series of upland ridges and low areas containing wetlands
Stockpiles that cause problems are located along east side of the pit (top of photo)
34

35
35
Waste Rock Stockpiles
Stockpiles at Dunka Mine
Since there had never been a water quality problem with iron mining, no special precautions taken with waste managementDig a hole as deep as possible and pile up the waste as close to the pit as possible and as high as possibleStockpiles at Angle of repose ~ 1-1.5:1
35

3636
36 Dunka Pit Geology Cross-Section (Schematic)
Dunka Pit
BiwabikIron Formation
Duluth Complex
Giants RangeGranite
Virginia Formation
Mineralized Zone
Unique feature of this mine was that the iron formation is partly overlain by a sulfide bearing formation, duluth complex, contains copper, nickel and iron sulfidesNo one realized that stockpiling this material could pose environmental problems

37
37
Fresh sulfides Oxidized sulfidesOxidized sulfides
Fresh sulfides
Duluth Complex, Copper-Nickel Deposit
Sulfide minerals unstable in presence of oxygenReact to release metals and form sulfuric acidDuluth Complex contains Ni, Cu and Fe sulfides

38
38
Precipitation exceeds evapotranspirationEffluent from the stockpile
Dunka Mine Effluent
Since there is an excess of precipitation, groundwater is shallow, 0-10 feet with lots of wetlands, surface seeps developedWaste rock was placed in wetlands and in this photo covered a portion of the stream
38

39
39
The Problem
5 major seeps Flow• Average ~ 5 – 250 gpm
(19-946 L/min) pH• Generally >7• One site pH ~ 5
Trace metal concentrations, mg/l• Nickel, ~ 1-10• Copper ~ 0.01 – 1 • Cobalt ~ 0.01- 0.1• Zinc ~0.01 - 2
Even though most of the seeps are circumneutral, trace metals are a problem, particularly nickel
39
40
40
Problem – Mining-Influenced Water
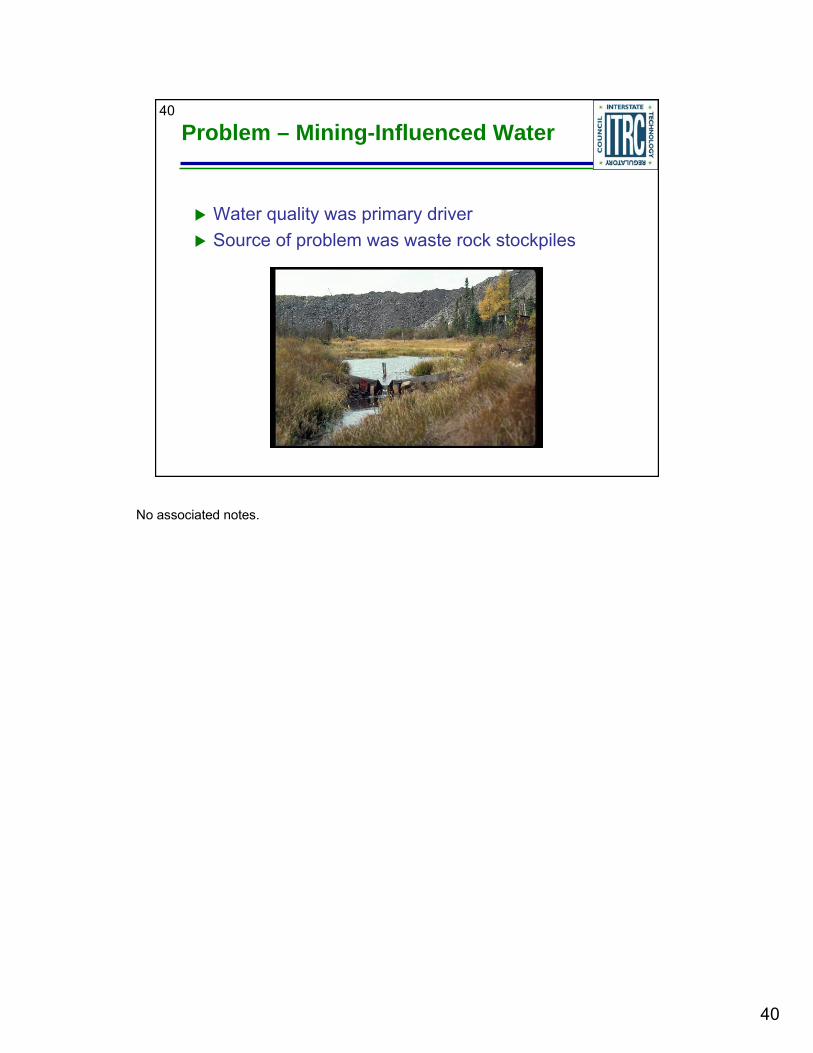
Water quality was primary driverSource of problem was waste rock stockpiles
No associated notes.

41
41
Decision Trees - Getting Started
>2 years
<2 years
Immediate does not mean we have known about it for along time.
Immediate or Acute RISK to human health or ecological
No housing nearbyThere is a viable biological community in the stream not a drinking water sourceCircumneutral waterNot an immediate problem

42
42
Decision Trees - Getting Started
>2 years
<2 yearsSolid Mining Waste
Mining-Influenced
Water
Water is driverWater issue is driven by solid waste which will be addressed separately
Format recd ovals, are the question we are askingRed rectangles and lines show the path we have taken through the decision tree

43
43
Decision Trees - Getting Started
>2 years
<2 years
Need to use mining-influenced water tree

44
44 Mining-Influenced Water Decision Tree
Mining-Influenced WaterDo you need to control water quality at the human receptor
or at the source?
Control at source, since no human or critical ecological receptors
44

45
45 Mining-Influenced Water Decision Tree
SourceCan you eliminate the mining-
influenced water by addressing the solid mining waste source?
Control at sourceSince could not completely eliminate the problem with source control so need to continue down the decision tree:stockpile built prior to rules, side slopes, angle of repose, ~ 1.5 to 1
The key word is eliminate, if can’t eliminate the problem completely then must deal with the residual water
45

46
46 Mining-Influenced WaterDecision Tree
NoDo you need to control water
quality in groundwater or surface water?
Surface water problemAny water that infiltrates into groundwater tends to discharge to nearby wetlands or surface water
46

47
47 Mining-Influenced WaterDecision Tree
Surface WaterDo you need a treatment technology that is more passive or can you use
a more active technology?
Key question, Next slide defines difference between active and passive
47
48
48
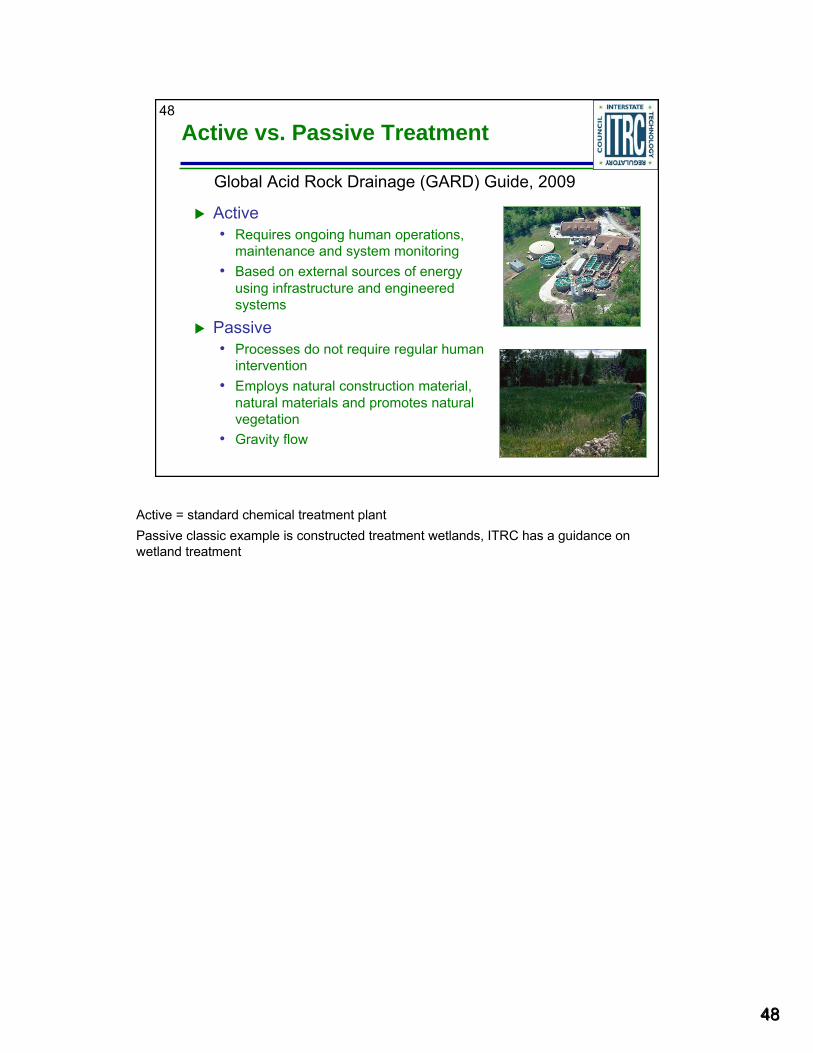
Active vs. Passive Treatment
Active• Requires ongoing human operations,
maintenance and system monitoring• Based on external sources of energy
using infrastructure and engineered systems
Passive• Processes do not require regular human
intervention• Employs natural construction material,
natural materials and promotes natural vegetation
• Gravity flow
Global Acid Rock Drainage (GARD) Guide, 2009
Active = standard chemical treatment plantPassive classic example is constructed treatment wetlands, ITRC has a guidance on wetland treatment
48

49
49 Mining-Influenced WaterDecision Tree
Passive
Since mine water problems can last for decades, the Company selected passive approach
49

50
50
Why Passive?
Closure Costs, Million dollars (1986)
Dunka Mine Cost EvaluationDriving factor in selecting passive was the much lower O&M costMine drainage problems last for hundreds of years so O&M really adds up
50

51
51 Mining-Influenced WaterDecision Tree
Constructed Treatment Wetlands
Since wetlands were already present at the site and had been shown to remove metals, the company decided to explore this option
51

52
52
Technology Overview
Note:Reference to Existing ITRC Guidance
Opening page for tech overview for constructed treatment wetlandsNote reference to existing ITRC guidanceAdvantages: Cost, Minimal maintenance, Long-term operation potential
As discussed earlier in the training the TO discuss the applicability of the technology including advantages and limitations etc.

53
53
Limitations
To reduce the area required, needed to reduce input flow
Required treating the solid mine waste
Requires appropriate land for wetlands construction
Large remedial footprint per unit treated Requires appropriate land for wetlands construction
There was not sufficient land area available for all the seeps
Needed to reduce flow into the wetlands to make wetlands work effectively
Had to treat stockpiles (go back to solid waste tree)
Even though we could not eliminate the problem, we could reduce it.
53

54
54
Solid Mining Waste Decision Tree
Solid Mining WasteDo you have saturated sediments
affected by mine waste?
Don’t have sediments

55
55
Solid Mining Waste Decision Tree
NoDo you need to control exposure
to mining wastes which have been transported indoors?
Not indoors

56
56
Solid Mining Waste Decision Tree
NoDo you need to control
exposure in a residential yard?
Not residential yards

57
57
Solid Mining Waste Decision Tree
NoIs it feasible to remove
the mine waste?
Cannot economically move ( no place to move them 50 million tons)

58
58
Solid Mining Waste Decision Tree
NoCan you control exposure by treating the mining waste?
Treatment means doing something to the waste to stop releaseGiven the large stockpiles, mixed sizes would not be possible to effectively treat all the mine waste and stop metal releasePhoto show lab study application of a passivation chemical to stop sulfide oxidation

59
59
Solid Mining Waste Decision Tree
NoCan you control exposure
with physical barriers?
Can control with barriers (caps, covers and grading)

60
60
Solid Mining Waste Decision Tree
Capping, Covers and GradingDiversionary Structures
Company evaluated both caps and covers as well as diversionsWill focus on caps, but additional information on diversions in the case study

61
61
Capping, Covers, Grading
Classify stockpilesCap accordingly• Soil cover
~ $13,000/acre ($32,000/ ha)
• Membrane cover~ $50,000/acre ($124,000/ha)
Problem• Could only cap flat portions • Side slopes ~ 1.5:1
Stockpiles were classified based on the existing water quality and the potential to produce poor water quality in the future (based on sulfur content)
Major concerns were stockpiles that already had low pH drainage or had the probability of producing low pH drainageThese stockpiles received covers that minimized water infiltration, i.e. geomembrane covers
61

62
62
40 ml LDPE Liner
InstallationSince slopes were so steep could only cap top portion of piles
62

63
63
Routing Water Off Stockpile
Water had to be routed off the top of piles using large culverts
63

64
64
Capping Performance
Overall Mass
Reduction 94%
BUT . . . Nickel concentrations still exceeded the standard
Nickel standard0.2 mg/L
Flow Mass Release
Nickel ConcentrationBefore After Before After
Before After
Flow
L/se
c
12080400 M
ass
Rel
ease
mg/
min
600
400
200
0
Nic
kel C
once
ntra
tion
mg/
L
43210
Performance of coverSizeable reduction in mass release at seeps but concentrations still above limit
64

65
65
Mining-Influenced Water Conclusion
Could not completely control problem with source controlStill needed to treat waterConstructed treatment wetlands
No associated notes.
65
66
66
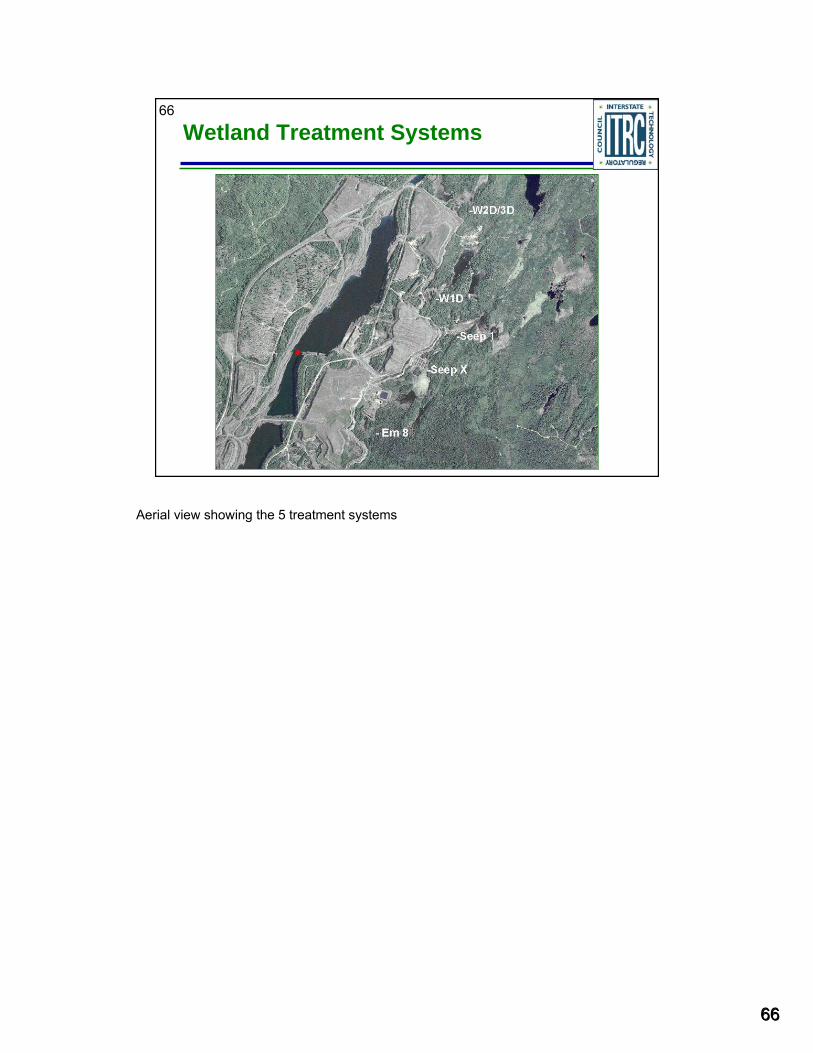
Wetland Treatment Systems
Aerial view showing the 5 treatment systems
66

67
67
Wetland - Before and After
Wetland construction
No associated notes.
67

6868
68
Wetland Treatment Performance
Inflow Outflow Inflow Outflow
Nic
kel C
once
ntra
tion,
mg/
L
Nic
kel C
once
ntra
tion,
mg/
L
Nickel is major parameter of concern, so have used this to indicate performance
All systems remove metals, but these are the 2 best performing systems
The top system has been in compliance since 1992The bottom system came into compliance after the system was expanded in 1995
costs have ranged from $18/m2 (about $1.70/ft2), for the systems built in 1992 and 1997, to $24-28/m2 (about $2.27 to @2.65/ft2)for the systems with under drains built in 1995.

69
69
Regulatory Approach
Initially used chronic standards• All systems removed metals• Not all systems consistently met standards
Flexibility• Final acute value
Effluent cannot be toxicSummation of individual metal toxicities
• Variances • Receiving stream monitoring
Invertebrates, fishToxicity testing
Some of the other systems were too small even after diversions and flow reductionsAnd could not meet the original permit limits
Required regulatory flexibility
Minimum standard: Effluent can not be toxicDrainage contains copper, nickel, cobalt and zincSo adopted an additive acute toxicity standard
Sum: metal concentration in outfall < 1final acute value
Included toxicity testing of receiving stream to insure no impact
Even with this 2 systems required a VarianceNo additional area for wetland expansionFAV > 1As part of variance increased biological monitoring of stream
69

70
70
Course Road Map
Background to mining issues
Overview of guidance• Decision trees
• Technologies
• Case studies
• Regulatory issues
Case study: Dunka Mine, Minnesota
Question and answer breakCase study: Bingham Mine, Utah
No associated notes.

71
71 Using Technology Overviews and Case Studies to Select a Technology
Covered so far• Overview of web-based
guidance document• Decision trees to reach
a list of technologies
Now• How to select from the
list of technologies
Example, Bingham Canyon Water Treatment Plant, Bingham Mine, Utah
Speaker points on introducing section:• The previous discussions covered an overview of the web-based guidance document &
how to use the decision trees to reach a list of technologies.
• Now we will explain how the technology overviews and case studies can assist with selecting a particular technology over another (for a site).
1. We will use the case study for the Bingham Canyon Water Treatment Plant, Kennecott South Zone, Copperton, Utah (located at the Bingham Mine, Utah) during this portion of the training.
• During the discussion we will cover the sections of the technology overviews, with a focus on the sections covering the applicability, advantages and limitations on the use of the technology.
• We will also discuss the information provided in the case studies & how this information can narrow the list of potentially applicable technologies.
• Lets begin with an introduction about the Case Study site.
All photos have been provided by Kennecott Utah Copper LLC (except where otherwise noted).
Pictured is Bingham Creek (after soil remediation activities) which overlies the Zone A plume of the Southwest Jordan Valley Groundwater site (Operable Unit No. 2 of the Kennecott South Zone CERCLA site).

72
72 Case Study– Bingham Canyon Water Treatment Plant
Speaker points on the location of the case study:• The area (Operable Unit No. 2 of the Kennecott South Zone) impacted by mining-
influenced water is located to the east of the Bingham Mining District (in the down gradient valley aquifer).
• The Bingham Mining District is located within the Oquirrh Mountains (which form the western boundary of the Salt Lake Valley) and is outlined by the red box.
• The overall mining property extends from:1. Butterfield Canyon along the south margin of the mountain range (bottom axis
of the red box) to the Great Salt Lake on the north end of the mining property, and
2. The Salt Lake County western foothills to the eastern foothills of Tooele County.
• The mining district is located approximately 18 miles (as the crow flies) from Salt Lake City, Utah.
72
73
73
Sources of Mining-Influenced Water
Ore body and waste rock• Gold-silver-moly-copper
porphyry body surrounded by a pyrite halo
• 4 to 5 billion tons of sulfide bearing waste rock
• Meteoric water and acidic leach solutions
• Mining-influenced water not entirely captured
1
2
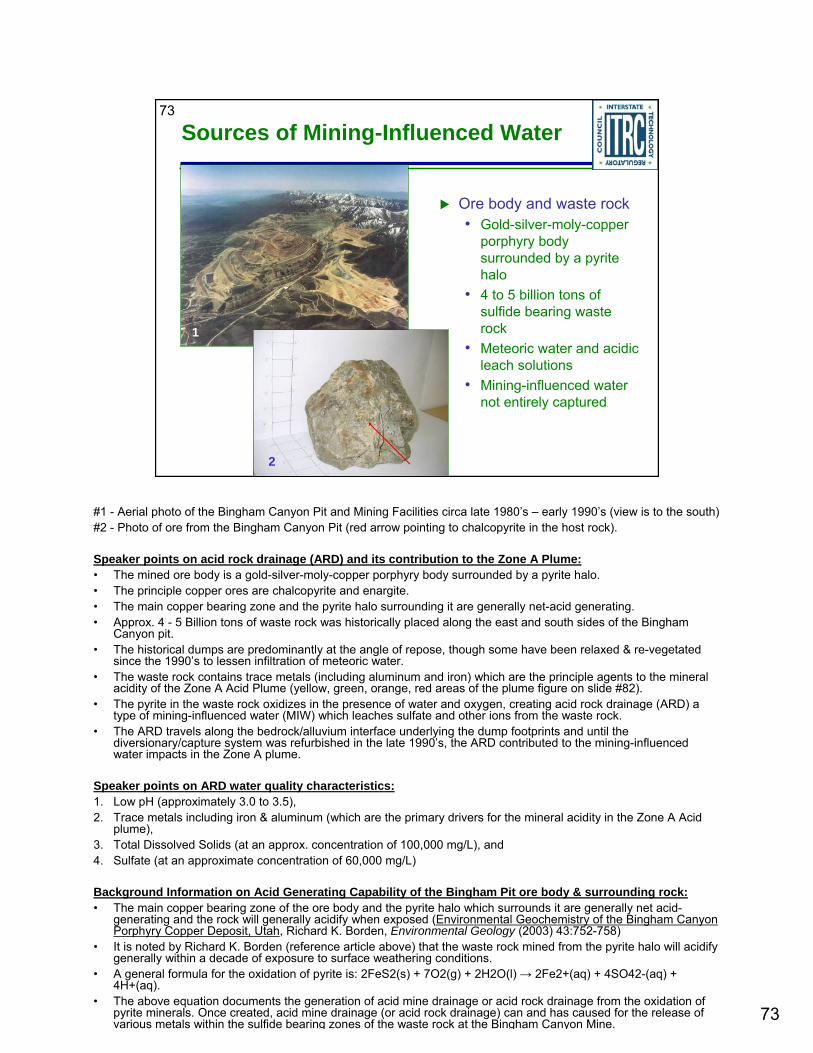
#1 - Aerial photo of the Bingham Canyon Pit and Mining Facilities circa late 1980’s – early 1990’s (view is to the south)#2 - Photo of ore from the Bingham Canyon Pit (red arrow pointing to chalcopyrite in the host rock).
Speaker points on acid rock drainage (ARD) and its contribution to the Zone A Plume:• The mined ore body is a gold-silver-moly-copper porphyry body surrounded by a pyrite halo.• The principle copper ores are chalcopyrite and enargite.• The main copper bearing zone and the pyrite halo surrounding it are generally net-acid generating.• Approx. 4 - 5 Billion tons of waste rock was historically placed along the east and south sides of the Bingham
Canyon pit. • The historical dumps are predominantly at the angle of repose, though some have been relaxed & re-vegetated
since the 1990’s to lessen infiltration of meteoric water. • The waste rock contains trace metals (including aluminum and iron) which are the principle agents to the mineral
acidity of the Zone A Acid Plume (yellow, green, orange, red areas of the plume figure on slide #82).• The pyrite in the waste rock oxidizes in the presence of water and oxygen, creating acid rock drainage (ARD) a
type of mining-influenced water (MIW) which leaches sulfate and other ions from the waste rock. • The ARD travels along the bedrock/alluvium interface underlying the dump footprints and until the
diversionary/capture system was refurbished in the late 1990’s, the ARD contributed to the mining-influenced water impacts in the Zone A plume.
Speaker points on ARD water quality characteristics:1. Low pH (approximately 3.0 to 3.5), 2. Trace metals including iron & aluminum (which are the primary drivers for the mineral acidity in the Zone A Acid
plume), 3. Total Dissolved Solids (at an approx. concentration of 100,000 mg/L), and 4. Sulfate (at an approximate concentration of 60,000 mg/L)
Background Information on Acid Generating Capability of the Bingham Pit ore body & surrounding rock:• The main copper bearing zone of the ore body and the pyrite halo which surrounds it are generally net acid-
generating and the rock will generally acidify when exposed (Environmental Geochemistry of the Bingham Canyon Porphyry Copper Deposit, Utah, Richard K. Borden, Environmental Geology (2003) 43:752-758)
• It is noted by Richard K. Borden (reference article above) that the waste rock mined from the pyrite halo will acidify generally within a decade of exposure to surface weathering conditions.
• A general formula for the oxidation of pyrite is: 2FeS2(s) + 7O2(g) + 2H2O(l) → 2Fe2+(aq) + 4SO42-(aq) + 4H+(aq).
• The above equation documents the generation of acid mine drainage or acid rock drainage from the oxidation of pyrite minerals. Once created, acid mine drainage (or acid rock drainage) can and has caused for the release of various metals within the sulfide bearing zones of the waste rock at the Bingham Canyon Mine.

74
74
Sources of Mining-Influenced Water
Impounded leach and process waters• Mine and non-mining
influenced waterStored in the historic unlined Bingham Reservoirs1960’s to 1990’s
• Reservoir complex leaked ~1 million gallons a day
• Water quality similar to acid rock drainage (ARD)
Pictured is the historic Large and Small Bingham Reservoirs prior to the CERCLA ordered remediation performed the mid 1990’s.
Speaker points on the impounded mining-influenced water at the historic Bingham Reservoirs:
• The historic reservoirs stored mining-influenced waters (for example, barren or pregnated leach water with a similar quality as acid rock drainage) from the mining and leaching operations located in Bingham Canyon.
• The Reservoir’s were not lined.• The Large Bingham Reservoir was built on top of tailings left by previous milling
operations, which acted as a source of metal ions that were leached as the mining-influenced water infiltrated from the ponds.
• The Large Bingham Reservoir leaked approximately 1 million gallons a day. • Mining-influenced water infiltrating into the underlying aquifer from the reservoir complex
had a water quality similar to ARD:1. Approximate pH of 3 to 3.5, 2. Trace metals including aluminum, arsenic, cadmium, iron, lead, 3. Total Dissolved Solids (TDS) with an average concentration of 100,000 mg/L,
and 4. Sulfate with an average concentration of 60,000 mg/L.

75
75
Map of the Two Plumes
With population growth, the impacted aquifer represents approximately ¼ of the potential drinking water for the Salt Lake Valley
Bingham Reservoir Footprint
Waste Rock Dump Footprints
Sulfate concentrations:20,000+ mg/L 15,000 to 19,000 mg/L10,000 to 14,999 mg/L
5,000 to 9,999 mg/L1,500 to 4,999 mg/L
500 to 1,499 mg/L
Speaker points on the history of mining-influenced water at the Kennecott South Zone (Bingham Mine):• Over 100 years of mining and mismanagement of mining-influenced water created 2 plumes of groundwater
contamination at the Kennecott South Zone.• Southwest Jordan Valley Groundwater Plumes (OU2 – Kennecott South Zone) site is a Superfund site in
EPA Region 8.1. The Zone A and Zone B plumes of the site underlie the communities of West Jordan, South
Jordan, Riverton and Herriman, Utah.2. The Zone A Plume is comprised of two plumes (an Acid and Sulfate plume).
• In the Zone A plume the colors on the figure represent sulfate concentrations:1. Light Blue – 500 to 1,499 mg/L2. Dark Blue – 1,500 to 4,999 mg/L3. Green – 5,000 to 9,999 mg/L4. Yellow – 10,000 to 14,999 mg/L5. Orange – 15,000 to 19,000 mg/L6. Red – 20,000+ mg/L
• The Zone A Sulfate Plume is also a State lead Natural Resource Damage site. • The Zone A Sulfate Plume underlies approx. 10 square miles.• The Zone A Sulfate Plume is in the principle aquifer of southwest quadrant of Salt Lake Valley, approx. 300 to
650 feet bgs.• The Zone A Sulfate plume contains elevated Total Dissolve Solids (TDS) and Sulfate concentrations above
the State of Utah primary drinking water standards.• The Bingham Canyon Water Treatment Plant case study (used herein as an example) focuses on the
treatment process selected to treat groundwater extracted from the Zone A Sulfate Plume (light and dark blue colored areas).
Speaker points on why cleanup is necessary:• Groundwater is used in the arid west as a source of drinking water. • In the Salt Lake Valley the overall site (both Zone A and B) represent about a ¼ of the overall source of
potential drinking water for the Salt Lake Valley (statistic from the Jordan Valley Water Conservancy District, 2009).
• At the time of remedial investigation there were a few municipal and private extraction wells used in this area to extract groundwater for public consumption.
• With an increasing populace, existing sources of drinking water are being used thus leading to pressure to develop the resource represented by these two plumes.
O th t lid ill id d t di f h th id d t ld h b d
76
76
Selecting a Technology – 1st Step
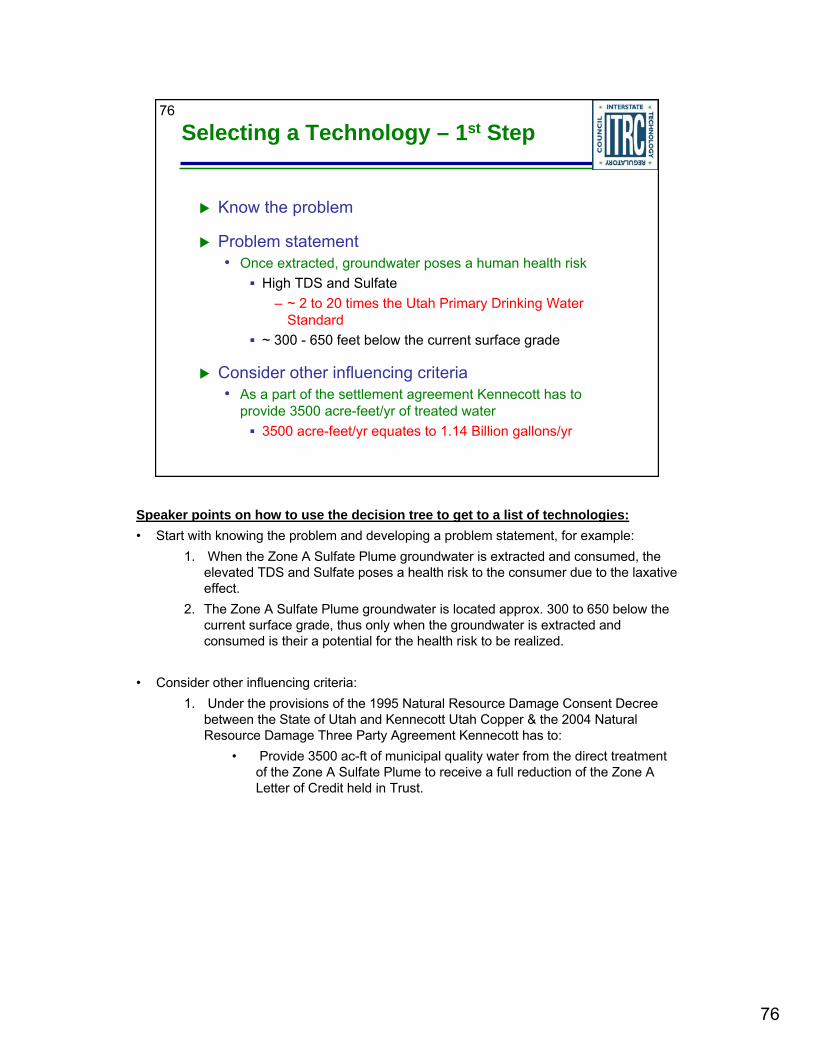
Know the problem
Problem statement• Once extracted, groundwater poses a human health risk
High TDS and Sulfate– ~ 2 to 20 times the Utah Primary Drinking Water
Standard~ 300 - 650 feet below the current surface grade
Consider other influencing criteria• As a part of the settlement agreement Kennecott has to
provide 3500 acre-feet/yr of treated water3500 acre-feet/yr equates to 1.14 Billion gallons/yr
Speaker points on how to use the decision tree to get to a list of technologies:• Start with knowing the problem and developing a problem statement, for example:
1. When the Zone A Sulfate Plume groundwater is extracted and consumed, the elevated TDS and Sulfate poses a health risk to the consumer due to the laxative effect.
2. The Zone A Sulfate Plume groundwater is located approx. 300 to 650 below the current surface grade, thus only when the groundwater is extracted and consumed is their a potential for the health risk to be realized.
• Consider other influencing criteria:1. Under the provisions of the 1995 Natural Resource Damage Consent Decree
between the State of Utah and Kennecott Utah Copper & the 2004 Natural Resource Damage Three Party Agreement Kennecott has to:
• Provide 3500 ac-ft of municipal quality water from the direct treatment of the Zone A Sulfate Plume to receive a full reduction of the Zone A Letter of Credit held in Trust.

77
77
Selecting a Technology – 2nd step
Use Decision Tree
Mining-Influenced WaterDo you need to control water quality at the human receptor
or at the source?
Receptor
Speaker points on how to drill through the MIW decision tree :• Based upon the problem statement, the following points would influenced the result of
working through the MIW decision tree:1. The Zone A Sulfate Plume represents a potential source of drinking water absent
the mining influence.2. The Zone A Sulfate Plume is not readily accessible to the public, absent an
extraction method (i.e. extraction well).3. The extracted groundwater represents a health risk at the receptor level (due to
the laxative/dehydration effects) when consumed, absent treatment.
• Answering the first question of the MIW tree (as it pertains to the case study), we conclude that the mining-influenced water of the Zone A Sulfate Plume needs to be addressed at the receptor level.

78
78
Selecting a Technology – 2nd Step
Review box of potentially applicable technologies
Administrative/Engineering Controls
Pressure Drive Membrane Separation
Ion Exchange
Speaker points on how to drill through the MIW decision tree :• After deciding to address the MIW at the receptor level three potentially viable
technologies are recommended for consideration by the decision tree: 1. Administrative / Engineering Controls (AECs)2. Ion Exchange (IX)3. Pressure Drive Membrane Separation (PDMS)
• In the web based guidance document each of the listed three technologies is a live link that will direct a user to a technology overview and a list of case studies that can help to narrow the selection of one of these technologies.
• Over the next slides we will discuss the sections of the technology overviews which can help to narrow the list of potential technologies.

79
79
Selecting a Technology – 3rd Step
Three key sections of the Technology Overviews include
• Applicability
• Advantages
• Limitations
Speaker points on how the Applicability, Advantages and Limitations sections will help to quickly pick a technology:
• These 3 sections provide an understanding of where or when a particular technology is best suited for use.
• These 3 sections cover the effectiveness (or lack there of) of the technology to directly or indirectly address the mining-influenced water in question.
• These 3 sections assist a user to brain storm about whether their problem statement is accurate and consider other parameters to the mining-influenced water problem that may have not been considered by the user.
• These 3 sections can help narrow the list of technologies down based upon specific conditions that might have already been recognized as limitations to the use of a particular technology at another site.
• Over the next slides we shall exemplify a review of these three key sections for the AECS, IX and PDMS overviews and how such could have led to the selection of a Pressure Driven Membrane Separation technology for use at the case study site.
80
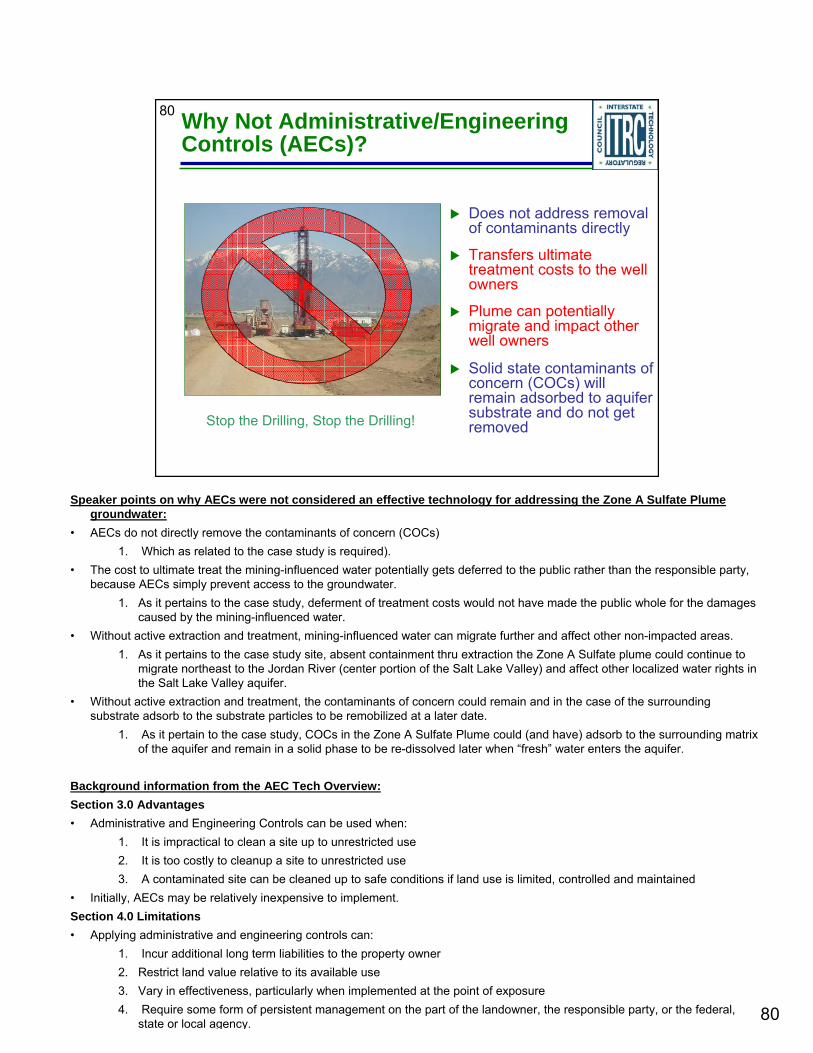
80 Why Not Administrative/Engineering Controls (AECs)?
Does not address removal of contaminants directly
Transfers ultimate treatment costs to the well owners
Plume can potentially migrate and impact other well owners
Solid state contaminants of concern (COCs) will remain adsorbed to aquifer substrate and do not get removedStop the Drilling, Stop the Drilling!
Speaker points on why AECs were not considered an effective technology for addressing the Zone A Sulfate Plume groundwater:
• AECs do not directly remove the contaminants of concern (COCs)1. Which as related to the case study is required).
• The cost to ultimate treat the mining-influenced water potentially gets deferred to the public rather than the responsible party, because AECs simply prevent access to the groundwater.
1. As it pertains to the case study, deferment of treatment costs would not have made the public whole for the damages caused by the mining-influenced water.
• Without active extraction and treatment, mining-influenced water can migrate further and affect other non-impacted areas.1. As it pertains to the case study site, absent containment thru extraction the Zone A Sulfate plume could continue to
migrate northeast to the Jordan River (center portion of the Salt Lake Valley) and affect other localized water rights in the Salt Lake Valley aquifer.
• Without active extraction and treatment, the contaminants of concern could remain and in the case of the surrounding substrate adsorb to the substrate particles to be remobilized at a later date.
1. As it pertain to the case study, COCs in the Zone A Sulfate Plume could (and have) adsorb to the surrounding matrix of the aquifer and remain in a solid phase to be re-dissolved later when “fresh” water enters the aquifer.
Background information from the AEC Tech Overview:Section 3.0 Advantages• Administrative and Engineering Controls can be used when:
1. It is impractical to clean a site up to unrestricted use 2. It is too costly to cleanup a site to unrestricted use 3. A contaminated site can be cleaned up to safe conditions if land use is limited, controlled and maintained
• Initially, AECs may be relatively inexpensive to implement.Section 4.0 Limitations• Applying administrative and engineering controls can:
1. Incur additional long term liabilities to the property owner2. Restrict land value relative to its available use 3. Vary in effectiveness, particularly when implemented at the point of exposure 4. Require some form of persistent management on the part of the landowner, the responsible party, or the federal,
state or local agency.

81
81
Why Not Ion Exchange (IX)?
Does not reduce TDS appreciably
Dependent upon required treatment volumes, water quality standards to be attained and cost efficiencies: • Comparably IX can have
higher capital costs and reagent costs
Disposal limitationsTDS I have
escaped!
Speaker points on why ion exchange is not an effective technology for addressing the Zone A Sulfate Plume groundwater :• IX Does not reduce TDS (a COC) appreciably.
1. As it pertains to the case study, if the TDS is not reduce measurably below the drinking water standards of the State of Utah than the goals of the cleanup are not met.
• As the name implies, IX works great for exchanging calcium and magnesium ions for sodium ions by ultimately does not lower the TDS concentration.• IX can have higher capital costs & reagent costs, for a resin regeneration system.• The potential higher capital, operation and maintenance costs are dependent upon:
1. The water quality standards that have to be achieved. I.e. if strict drinking water quality standards have to be achieved, a PDMS treatment system may be more costs efficient to treat the feed water rather than an IX system or an IX with added treatment).
2. The volume of water that has to be treated and produced. I.e. if a large volume of feed water is intended to be treated (again to drinking water standards), a PDMS treatment system may be more efficient (from a costs perspective) than an IX system.
3. There are potential discharge limitations for the waste stream produced by the resin regeneration system.
Background information from the Ion Exchange Tech Overview:Section 3.0 Advantages
1. Temporary or Permanent Applications 2. Immediate Results 3. Standard tank sizes available for small to intermediate flows which allow quick installation 4. Minimal maintenance with standard size tank systems 5. Waste disposal can be handled by supplier
• Ion exchange resins are available in standard size tanks that can be delivered and set up on site. • A permanent shelter is not required, but the tanks must not freeze. • Power is needed to pump water through the resin, but can be supplied by a generator. • Once operational, the tanks can treat water until the exchange capacity is exhausted. • Site specific capacities can be developed and used to schedule tank replacement. • When all the removal sites are filled the resin must be regenerated, this can be done on site or off site by the resin supplier.• The removed substance must be chemically stripped from the resin. • In general, an acid is used to remove trace metals from the resin and sometimes these metals can be recovered.
4.0 Limitations1. Chemical Characteristics of the Influent Mine Water 2. Generally not effective for low pH 3. Generally not effective for high concentrations Fe, Mn, Al 4. Generally not effective for complex mixtures of metals 5. Suspended solids need to be removed prior to treatment 6. Resin regeneration 7. Resin fouling 8. Ongoing operational costs
• In general, ion exchange works best for waters in the pH range of 4-8 with low suspended solids and low concentrations of Fe and Al.• The more complex the mixture the harder it is to remove all metals effectively. • Resins can be designed to target specific groups, e.g. trace metals, but within these groups there is a hierarchy of removal. • For example, the typical preference for cations on strong acid resins: Pb2+, Ca2+, Ni2+, Cd2++, Cu2+, Zn2+, Mg2+, K+, NH4+, Na+, H+
A d th t i l f f i t b i SO42 NO3 Cl OH

82
82Why Pressure Driven Membrane Separation (PDMS) Was Selected…
Active treatmentCleans both aqueous and solid phaseRemoves Sulfate and TDS• Other COCs
Disposal location for the concentrate was available
Attains applicable drinking water standardsProduces various volumes of treated waterTested and tried technology
Image from: http://www.americasbestairandwater.com/media/ROMembrane.jpg
Brine SealFeed Solution
Feed Channel SpacerMembrane
Perforated Central Tube
Permeate
Concentrate
Permeate Collection Material Outer Wrap
Feed Channel Spacer
Speaker points on why a PDMS process was selected for use to address the Zone A Sulfate Plume groundwater:• PDMS is an active treatment process that overtime efficiently (cost per treated volume) removes contaminants of concern (COCs).
1. As it pertains to the case study, for $1.2 M annually the Zone A Sulfate Plume groundwater (once extracted and treated) is treated by a reverse osmosis system recovering approximately 73% of the feed water as treated water.
• PDMS technology can remove both aqueous and solid phase COCs.1. As it pertains to the case study, solid phase COCs are removed from the aquifer substrate by the combined action of drawing
pore volumes of impacted water from the groundwater, removing the COCs from the extracted water and allowing “fresh” water to flow into the aquifer to re-dissolved the solid phase COCs from the substrate.
• PDMS technologies can remove both Sulfate & TDS from the feed water.1. As it pertains to the case study, both COCs are removed producing a treated water that complies with the State of Utah
drinking water standards (cost efficiently).• PDMS technologies can remove a range of other COCs.
1. As it pertain to the case study, if metals from the Zone A Acid Plume appear at the extraction wells these two will be removed by the reverse osmosis membranes.
• PDMS technologies can treat and produce a range of water volumes.1. As it pertains to the case study, the reverse osmosis system is able to produce enough water for approx. 3500 single family (of
four) dwellings, for a year.• PDMS technologies are a tested & tried technology within the drinking water industry.• PDMS technologies do have a few limitations on their use, one significant one is how to manage the concentrate (or brine stream)
produced by these systems as waste.1. As it pertains to the case study, there was also a location for the disposal of the concentrate from the reverse osmosis system
available for use at the mine site.
Background information from the Pressure Driven Membrane Separation tech overview: • Section 3.0 AdvantagesPressure Driven Membrane Separation technologies have the following advantages:
1. Long term effectiveness 2. Large range of solute rejection 3. Tested technology & flexible application with a relatively small footprint 4. Attainment of stringent regulatory standards 5. Volume reduction and waste minimization
• Section 4.0 LimitationsPressure Driven Membrane Separation technologies have the following limitations:
1. High capital and O&M costs 2. Needs applied pressure to compensate for the osmotic pressures of the feed solution 3. Fouling of membranes & scale production 4. Reliance on external rower 5. Concentrate disposal options can be limited 6 F d l ti / Q lit di t bilit T ti i th t k l d f th lit f f d t i d d

83
83Other Selection Information Is Available in Technology Overviews
PDMS Technology includes four types:• Microfiltration• Ultrafiltration• Nanofiltration• Reverse Osmosis (RO)
These membrane systems differ in terms of the • Solutes they reject • Operating pressures • Configuration options
Image from: http://www.watekwater.com/images/particles.jpg
Speaker points on the types of PDMS technologies that are covered in the PDMS technology overview:
• PDMS technology has four primary types: 1. Microfiltration, 2. Ultrafiltration, 3. Nanofiltration, 4. Reverse Osmosis (RO).
• These membrane systems differ in terms of the solutes they reject, their operating pressures, and their configuration options.
• The screen shot provides a general understanding what size and weight molecules each of the four PDMS technologies will remove from a feed water source.
1. The PDMS technology overview provides a similar synopsis in Table 1-1 in Section 1.0 Introduction.

84
84Why RO Was Chosen for Use at the Case Study Site
Allows only water molecules to pass through
Removes a wide range of contaminants of concern (COCs)
Can attain strict drinking water standards
Recovery efficiency around 75%
Used in 1995 to calculate the value of the lost resource in the Zone A Sulfate Plume
Existing and functional disposal facility for the concentrate (or waste water)
Speaker points on why Reverse Osmosis was chosen for use to treat the Zone A Sulfate Plume:
• RO was selected for use at the Bingham Canyon Water Treatment Plant (BCWTP) because RO can:
1. Block suspended solids, bacteria, viruses, multivalent ions, mono-valent ions; only water molecules get through the membrane pore space.
2. Removes TDS and Sulfate, and can address metal ions that might be extracted overtime if the Zone A Acid Plume migrates.
3. RO can attain strict drinking water standards efficiently (based upon required volumes of treated water at the BCWTP).
4. Produces permeate (treated water) at recovery efficiency of 71 to 74% (as seen during pilot studies conducted at the case study site).
5. RO was the technology used in 1995 to calculate the value of the lost resource.6. There was an existing and functional disposal facility for the concentrate (or
waste water) resulting from this groundwater treatment option.

85
85
Using Case Studies to Refine the Selection
Each case study includes• Contact information
• Performance data
• Costs data (if available)
• Regulatory challenges
• Stakeholder challenges
• Reference Information
PDMS tech overview includes 2 case studies:• Bingham Canyon Water
Treatment Plant (BCWTP); Copperton, Utah
• Coal mine; Southwestern, Pennsylvania
Speaker points advocating the use of the case studies:• Reviewers can find useful information in the case studies, including:
1. Performance data on the use of the technology at real world sites,2. Site specific conditions where the technology has been successfully or
unsuccessfully used. • As it pertains to unsuccessful sites, information is provide on why the
technology did not work.3. Contact information is provided so a user of the guidance can get more
information from site managers or regulators.4. Costs data (if provided) on the development & operational aspects of the
technologies application.5. Information about the challenges posed by the application of the technology at a
real world site.
• Each technology overview includes case studies documenting the practical application of the technology at a mine site.
1. The PDMS tech overview includes two case studies from Pennsylvania and Utah.
• Some case studies are more detailed than others.
• Over the next slides we will document some of the available performance data and significant limitations information that is documented in the case studies.
1. This portion of the training will document said performance information presented in the Bingham Canyon Water Treatment Plant case study.

86
86
Bingham Canyon Water Treatment Plant
1
2
3
Images From:http://www.itrcweb.org/miningwaste-guidance/cs48_kennecott_south.htm
Speaker points providing general information about the BCWTP (Photo No. 1):• The BCWTP is located south of the town of Copperton, Utah in the eastern foothills of the Oquirrh Mountains. • The plant took two years to construct (2004 to 2006) and became operational in May 2006.• The BCWTP is approximately 14,600 square feet in size. • The BCWTP is one of the largest RO facilities in the interior United States & west of the Mississippi River.
Speaker notes on the BCWTP systems:• The BCWTP houses a pretreatment system, reverse osmosis system, and a post treatment system.• The pretreatment system (Photo No. 3) consist of:
1. A UV disinfection unit located on the feed water line which is used to kill micro-organisms in the feed water prior to entering the plant. • This helps to prevent bio-fouling of the membranes.• No picture
2. Bag and cartridge filters (Photo No. 3) that in series are used to remove particulates down to a 0.45 micron level. • This filtration step prevents clogging of the pore spaces by suspended solids and abrasion of the membrane surfaces by these
solids.
3. Anti-scalant injection system (lg white carboys background Photo No. 3) which is used to inject a proprietary anti-scalant compound into the feed water prior to the reverse osmosis system.
• This prevents gypsum from scaling onto the membrane surfaces and piping, because gypsum is at its saturation point in the feed water.
• Protection of the membranes (more specifically maintaining their structural integrity) can increase the “life span” of each individual membrane unit and maintain removal efficiencies.
• The reverse osmosis (RO) treatment system (Photo No. 2) consists of:1. Two RO racks (#3 & #4) each of which contain two treatment stages, where the concentrate of the first stage is treated a second time to
recover more permeate.• Each long white (horizontally arranged) PVC pipe houses seven spiral wound RO membrane units.
• The post treatment system consists of a remineralization system, a pH adjustment system and a chlorine injection system.1. Permeate produced by the RO treatment system has a very low mineral content and thus can be corrosive on older pipes of the downstream
municipal distribution systems.• To remineralize the permeate, a bypass system takes a small volume of feed water (that is disinfected by UV) and mixes it with
permeate to increase the mineral content to approximately 250 mg/L TDS.
2. Once re-mineralized, a weak solution of sodium hypochlorite (about 0.05%) is injected into the product water to introduce a residual chlorine content in compliance with the drinking water permit requirements.

87
87
Removal Performance
TDS removal efficiencies averaged 98.7%over the operational period June 2009 to May 2010
Comparison of Feed and Permeate Water QualityC
once
ntra
tion,
mg/
L
Feed WaterPermeate Water
Average Total Dissolved Solids (TDS)
Average Sulfate
Speaker points on the feed water being delivered to the BCWTP:• Three groundwater extraction wells are used to provide feed water to the BCWTP (for June 2009 to May 2010 the volume
of feed water was approx. 2,993 GPM).
• The quality of the feed water can be adjusted by Kennecott to increase or decrease the TDS and Sulfate concentrations.1. Currently the feed water blend is 41% from B2G1193, 41% from BFG1200 and 18% from LTG1147.2. Average TDS and Sulfate concentration (for June 2009 to May 2010) for these three wells:
• B2G1193 – ave. TDS = 3101 mg/L, ave. Sulfate = 1901 mg/L• BFG1200 – ave. TDS = 1472 mg/L, ave. Sulfate = 716 mg/L• LTG1147 – ave. TDS = 1485 mg/L, ave. Sulfate = 565 mg/L
3. Wells B2G1193 and BFG1200 are in the Zone A Sulfate plume along the predominant migration pathway (absent containment).
4. Adjusting the quality of the feed water can optimize the permeate recovery efficiency observed at the BCWTP.5. To manipulate the quality of the feed water Kennecott can change the blend ratio (i.e. volumes) from the three
extraction wells (since the quality of the extracted groundwater is slightly different from the three wells).
Speaker points on the permeate water produced by the BCWTP:• The volume of permeate produced from June 2009 to May 2010 was approx. 2,194 GPM.• The RO membranes used at the BCWTP are capable of producing a permeate (clean water) that has a very low mineral
quality (TDS is a measure of the mineral quality).1. Rack 3 (June 2009 to May 2010) – ave. TDS = 22 mg/L, ave. Sulfate = 5 mg/L2. Rack 4 (June 2009 to May 2010) – ave. TDS = 25 mg/L, ave. Sulfate = 7 mg/L3. The specific conductance (another measurement of the mineralization of water) for the permeate produced from
June 2009 to May 2010 averaged 36 µS/cm.
Background information of TDS removal efficiency:• Removal efficiency is calculated by taken the yearly average Specific Conductance for the feed water and subtracting the
yearly average Specific Conductance for the permeate. The result is divided by the yearly average Specific Conductance for the feed water and multiplied by 100.
• Specific conductance data is used as a surrogate for the measurement/calculation of the TDS removal efficiency of the membranes because of the lower variability in the analysis of Specific Conductance.
• Data for operating years 2006 to 2007, 2007 to 2008, 2008 to 2009 is provided in Table 3.4 of the BCWTP (http://www.itrcweb.org/miningwaste-guidance/cs48_kennecott_south.htm)
• Performance data presented over this and the next slides reference approximate water stream volumes which were

88
88 Lesson Learned – Limitations on RO Concentrate Disposal
Magna, Utah
KUC South Tailings Impoundment - Not
Active
KUC North Tailings Impoundment - Active
Gilbert Bay of the Great Salt Lake
I-80
Northern Front of the OquirrhMountains
Image from: Google Earth
Concentrate Water Quality
0
2000
4000
6000
8000
Average TDS Average Sulfate
mg/
L
Rack 3Rack 4
Speaker points on the concentrate produced at the BCWTP:• RO membranes used at the BCWTP produce a concentrate or brine stream that has the majority
of the ions (or salts, hence the term “brine stream”) in the original feed water.1. Rack 3 (June 2009 to May 2010) – ave. TDS = 8,392 mg/L, ave. Sulfate = 4,733 mg/L2. Rack 4 (June 2009 to May 2010) – ave. TDS = 8,564 mg/L, ave. Sulfate = 4,782 mg/L
• The concentrate volume produced by the BCWTP for June 2009 to 2010 was approx. 798 GPM (or approx. 1 MGD), which represents approx. 27% of the original feed water volume.
• The metal ions and other anions in the BCWTP concentrate limit the discharge of the concentrate to freshwater/surface water bodies, absent pre-treatment.
• At the BCWTP, the concentrate is disposed of in Kennecott’s mill tailings pipeline and disposal facility (impoundment), for permanent sequestration.
1. The tailings impoundment at Kennecott manages other mining-influenced waters and general mill tailings, with similar metal ions and other ions as seen in the RO concentrate.
2. The RO concentrate represents approximately 2% of the overall flow of material in the Kennecott tailings pipeline which then goes to the North Tailings Impoundment.
3. The North Tailings Impoundment system is able to operate in compliance with the State of Utah groundwater and surface water discharge permit limitations.
4. This disposal option for the RO concentrate works while the mining company is still mining and milling, afterwards an alternative will need to be proposed.
• Possible alternative – direct discharge to the Great Salt Lake which comparatively has a higher TDS concentration than the BCWTP concentrate (limiting factor may be selenium).
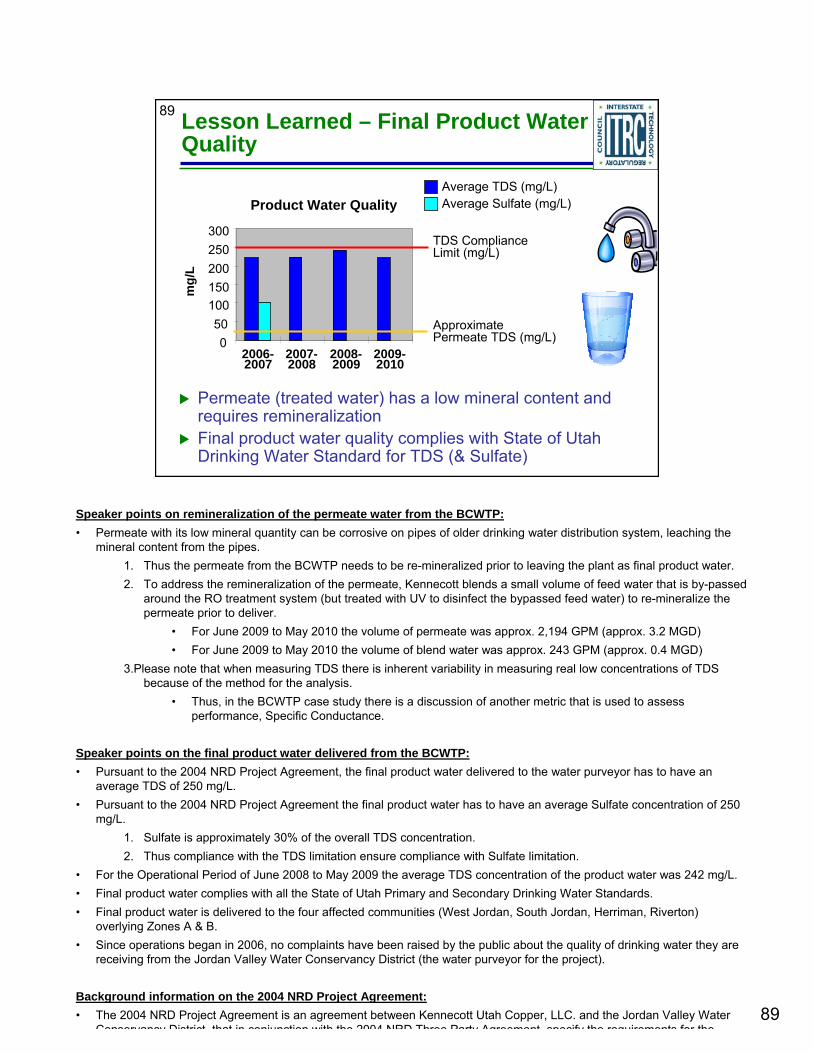
89
89 Lesson Learned – Final Product Water Quality
Permeate (treated water) has a low mineral content and requires remineralizationFinal product water quality complies with State of Utah Drinking Water Standard for TDS (& Sulfate)
Product Water Quality
050
100150200250300
2006-2007
2007-2008
2008-2009
2009-2010
mg/
L
Approximate Permeate TDS (mg/L)
TDS Compliance Limit (mg/L)
Average TDS (mg/L)Average Sulfate (mg/L)
Speaker points on remineralization of the permeate water from the BCWTP:• Permeate with its low mineral quantity can be corrosive on pipes of older drinking water distribution system, leaching the
mineral content from the pipes. 1. Thus the permeate from the BCWTP needs to be re-mineralized prior to leaving the plant as final product water.2. To address the remineralization of the permeate, Kennecott blends a small volume of feed water that is by-passed
around the RO treatment system (but treated with UV to disinfect the bypassed feed water) to re-mineralize the permeate prior to deliver.
• For June 2009 to May 2010 the volume of permeate was approx. 2,194 GPM (approx. 3.2 MGD)• For June 2009 to May 2010 the volume of blend water was approx. 243 GPM (approx. 0.4 MGD)
3.Please note that when measuring TDS there is inherent variability in measuring real low concentrations of TDS because of the method for the analysis.
• Thus, in the BCWTP case study there is a discussion of another metric that is used to assess performance, Specific Conductance.
Speaker points on the final product water delivered from the BCWTP:• Pursuant to the 2004 NRD Project Agreement, the final product water delivered to the water purveyor has to have an
average TDS of 250 mg/L. • Pursuant to the 2004 NRD Project Agreement the final product water has to have an average Sulfate concentration of 250
mg/L. 1. Sulfate is approximately 30% of the overall TDS concentration. 2. Thus compliance with the TDS limitation ensure compliance with Sulfate limitation.
• For the Operational Period of June 2008 to May 2009 the average TDS concentration of the product water was 242 mg/L.• Final product water complies with all the State of Utah Primary and Secondary Drinking Water Standards.• Final product water is delivered to the four affected communities (West Jordan, South Jordan, Herriman, Riverton)
overlying Zones A & B.• Since operations began in 2006, no complaints have been raised by the public about the quality of drinking water they are
receiving from the Jordan Valley Water Conservancy District (the water purveyor for the project).
Background information on the 2004 NRD Project Agreement:• The 2004 NRD Project Agreement is an agreement between Kennecott Utah Copper, LLC. and the Jordan Valley Water
Conservancy District that in conjunction with the 2004 NRD Three Party Agreement specify the requirements for the

90
90 Product Volume –“Bang for the Buck”
Cost $15 Million in capital and $1.2 Million annually for O&M
Average product water recovery rate has been 73.8%
Will average 3500 acre-feet per year over the first five years of operations• 1 acre-foot is approximate
volume of water used by a family of four in 1 year
Production Totals For Operational Years
0
1000
2000
3000
4000
2006-2007
2007-2008
2008-2009
2009-2010
Prod
uctio
n Vo
lum
e
Acre-Feet per Year
Gallons per Minute
Rolling Average (ac- feet)
Speaker points on the costs for the BCWTP:• The capital and yearly Operation & Maintenance (O&M) costs are presented in the above table as total costs.
• The capital costs do not reflect the additional costs associated with the capital and O&M costs for the extraction wells, feed pipelines, and disposal facilities.
• Forty percent of the yearly total O&M costs is spent on labor and 24 hour maintenance of the BCWTP.1. Though the facility could be operated remotely, Kennecott has decided to man the facility to ensure operations are
ongoing.
Speaker points on the cost benefits observed at the BCWTP:• For $1.2 Million annually the BCWTP:
1. Has operated with an average product water recovery rate of 73.8%.• For June 2006 to May 2007 – 73.2%• For June 2007 to May 2008 – 73.8%• For June 2008 to May 2009 – 73.3%• For June 2009 to May 2010 – 74.9%
2. The BCWTP is on track to comply with the Five Year Rolling Average of 3500 Acre-Feet Per Year of product water:• 3500 Acre-Feet of water is enough water for 3500 single family of four households in the affected area per
year.1. 3500 Acre-Feet Per Year equates to:
2169.87 (US) Gallons Per Minute 3.13 (US) Million Gallons Per Day1.14 (US) Billion Gallons Per Year
2. For June 2009 to May 2010 the BCWTP produced 3414 Acre-Feet Per Year of final product waterApprox. 2,431 (US) Gallons Per MinuteApprox. 3.5 (US) Million Gallons Per Day

91
91
In Summary…
Provided overview of how to select a technology
Described information in technology overviews and case studies• Acknowledging those sections that can help select one
technology over another
Demonstrated the decision path for picking one technology over another and why• Described why Pressure Driven Membrane Separation
(PDMS) (and more specifically Reverse Osmosis (RO)) was selected over Administrative/Engineering Controls (AECs) or Ion Exchange for the Bingham Canyon Water Treatment Plant (BCWTP) site
Exemplified the types of performance information that is available in the case studies to refine selection
No associated notes.

9292
92
Overall Course Summary
Background to mining issues
Overview of guidance• Decision trees
• Technologies
• Case studies
• Regulatory issues
Case study: Dunka Mine, Minnesota
Case study: Bingham Mine, Utah
See also: Biochemical Reactors for Mining-Influenced Water at http://www.itrcweb.org/bcr-1/
•Thank you again for your attention and comments.
•This course has hopefully provided you an understanding about the Mine Waste Team’s guidance document on solid and aqueous mine waste.
•Today we have covered a general overview of the realm of mining related impacts that exist and how our technology guidance document can assist with the selection of a particular technology to address your site.
•As part of this presentation we demonstrated the use of the guidance, through exemplifying two of our case study sites.
•We remind you that our guidance document is not a “how to build” document, but an extensive overview of where these technologies have been used and how successful the technology was at the site.
•In 2011 members of the Mine Waste Team will begin a new team in ITRC, Biochemical Reactors for Mining-Influenced Water.
•Please go to the ITRC Home Page, http://www.itrcweb.org/, for further information about this new team and to register your interest in becoming a member.
•If you have any additional questions or comments, please feel free to contact any one of the instructors
•Thank you and have a great afternoon.

9393
93
Thank You for Participating
Question and answer break Links to additional resources• http://www.cluin.org/conf/itrc/mwtts/resource.cfm
Feedback form – please complete• http://www.cluin.org/conf/itrc/mwtts/feedback.cfm
Need confirmation of your participation today?
Fill out the feedback form and check box for confirmation email.
Links to additional resources: http://www.cluin.org/conf/itrc/mwtts/resource.cfm
Your feedback is important – please fill out the form at: http://www.cluin.org/conf/itrc/mwtts/feedback.cfm
The benefits that ITRC offers to state regulators and technology developers, vendors, and consultants include:
Helping regulators build their knowledge base and raise their confidence about new environmental technologies
Helping regulators save time and money when evaluating environmental technologiesGuiding technology developers in the collection of performance data to satisfy the
requirements of multiple statesHelping technology vendors avoid the time and expense of conducting duplicative and
costly demonstrationsProviding a reliable network among members of the environmental community to focus on
innovative environmental technologies
How you can get involved with ITRC:Join an ITRC Team – with just 10% of your time you can have a positive impact on the
regulatory process and acceptance of innovative technologies and approachesSponsor ITRC’s technical team and other activitiesUse ITRC products and attend training coursesSubmit proposals for new technical teams and projects