mining software repair models for reasoning on the search space of
TRANSCRIPT

HAL Id: hal-00903808https://hal.inria.fr/hal-00903808
Submitted on 13 Nov 2013
HAL is a multi-disciplinary open accessarchive for the deposit and dissemination of sci-entific research documents, whether they are pub-lished or not. The documents may come fromteaching and research institutions in France orabroad, or from public or private research centers.
L’archive ouverte pluridisciplinaire HAL, estdestinée au dépôt et à la diffusion de documentsscientifiques de niveau recherche, publiés ou non,émanant des établissements d’enseignement et derecherche français ou étrangers, des laboratoirespublics ou privés.
Mining Software Repair Models for Reasoning on theSearch Space of Automated Program Fixing
Matias Martinez, Martin Monperrus
To cite this version:Matias Martinez, Martin Monperrus. Mining Software Repair Models for Reasoning on the SearchSpace of Automated Program Fixing. Empirical Software Engineering, Springer Verlag, 2015, 20 (1),pp.176-205. <10.1007/s10664-013-9282-8>. <hal-00903808>

Mining Software Repair Models for Reasoning on
the Search Space of Automated Program Fixing
Matias Martinez
University of Lille & INRIA
Martin Monperrus
University of Lille & INRIA
Empirical Software Engineering, Springer, 2013 (accepted for publication on Sep. 11, 2013).
Abstract—This paper is about understanding the nature of bugfixing by analyzing thousands of bug fix transactions of softwarerepositories. It then places this learned knowledge in the contextof automated program repair. We give extensive empirical resultson the nature of human bug fixes at a large scale and a finegranularity with abstract syntax tree differencing. We set upmathematical reasoning on the search space of automated repairand the time to navigate through it. By applying our method on 14repositories of Java software and 89,993 versioning transactions,we show that not all probabilistic repair models are equivalent.
I. INTRODUCTION
Automated program fixing consists of generating source
code in order to fix bugs in an automated manner [1], [2], [3],
[4], [5]. The generated fix is often an incremental modification
(a “patch” or “diff”) over the software version exhibiting the
bug. The previous contributions in this new research field make
different assumptions on what is required as input (e.g. good
test suites [2], pre- and post-conditions [3], policy models
[1]). The repair strategies also vary significantly. Examples
of radically different models include genetic algorithms [2]
and satisfiability models (SAT) [6].
In this paper, we take a step back and look at the problem
from an empirical perspective. What are real bug fixes made
of? The kind of results we extensively discuss later are for
instance: in bug-fixes of open source software projects, the
most common source code change consists of inserting a
method invocation. Can we reuse the knowledge for reasoning
on automated program repair? We propose a framework to do
so, by reasoning on the kind of bug fixes. This framework
enables us to show that the granularity of the analysis of real
commits (which we call “repair models”) has a big impact
on the navigation into the search space of program repair.
We further show that the heuristics used to build probability
distributions on top the repair models also make a significant
difference: not all repair actions are equals!
Let us now make precise what we mean with repair actions
and repair models. A software repair action is a kind of
modification on source code that is made to fix bugs. We
can cite as examples: changing the initialization of a variable;
adding a condition in an “if” statement; adding a method call,
etc. In this paper, we use the term “repair model” to refer to a
set of repair actions. For instance, the repair model of Weimer
et al. [2] has three repair actions: deleting a statement, inserting
a statement taken from another part of the software, swapping
two statements
There is a key difference between a repair action and a
repair: a repair action is a kind of repair, a repair is a concrete
patch. In object-oriented terminology, a repair is an instance
of a repair action. For instance, “adding a method call” is a
repair action, “adding x.foo()” is a repair. A repair action
is program- and domain-independent, it contains no domain-
specific data such as variable names or literal values.
First we present an approach to mine repair actions from
patches written by developers. We find traces of human-
based program fixing in software repositories (e.g. CVS,
SVN or Git), where there are versioning transactions (a.k.a
commits) that only fix bugs. We use those “fix transactions”
to mine AST-level repair actions such as adding a method call,
changing the condition of a “if”, deleting a catch block. Repair
actions are extracted with the abstract differencing algorithm
of Fluri et al. [7]. This results in repair models that are much
bigger (41 and 173 repair actions) compared to related work
which considers at most a handful of repair actions.
Second, we propose to decorate the repair models with a
probability distribution. Our intuition is that not all repair ac-
tions are equal and certain repair actions are more likely to fix
bugs than others. We also take an empirical viewpoint to define
those probability distributions: we learn them from software
repositories. We show that those probability distributions are
independent of the application domain.
Third, we demonstrate that our probabilistic repair models
enable us to reason on the search space of automated program
repair. The multinomial theorem [8, p.73] comes into play to
analyze the time to navigate into the search space of automated
repair from a theoretical viewpoint.
To sum up, our contributions are:
• An extensive analysis of the content of software version-
ing transactions: our analysis is novel both with respect of
size (89,993 transactions of 14 open-source Java projects)
and granularity (173 repair actions at the level of the
AST).
• A probabilistic mathematical reasoning on automated
repair showing that depending on the viewpoint one may
quickly navigate – or not – into the search space of
automated repair. Despite being theoretical, our results
highlight an important property of the deep structure of
this search space: the likely-correct repairs are highly
concentrated in some parts of the search space, as stars
are concentrated into galaxies in our universe.
This article is a revised version of a technical report [9]. It
reads as follows. Section II describes how we map concrete
versioning transactions to change actions. Section III discusses
how to only select bug fix transactions. Section IV then
shows that those change actions are actually repair actions
under certain assumptions. Section V presents our theoretical
analysis on the time to navigate in the search space of
automated repair. Finally, we compare our results with the
related work (in Section VII) and concludes.
II. DESCRIBING VERSIONING TRANSACTIONS WITH A
CHANGE MODEL
In this section, we describe the contents of versioning
transactions of 14 repositories of Java software. Previous
empirical studies on versioning transactions [10], [11], [12],
[13], [14] focus on metadata (e.g., authorship, commit text) or
size metrics (number of changed files, number of hunks, etc.).
On the contrary, we aim at describing versioning transactions
in terms of contents: what kind of source code change they
contain: addition of method calls; modification of conditional
statements; etc. There is previous work on the evolution of
source code (e.g. [15], [16], [17]). However, to our knowledge,
they are all at a coarser granularity compared to what we
describe in this paper.
Note that other terms exist for referring to versioning trans-
actions: “commits”, “changesets”, “revisions”. Those terms
reflect the competition between versioning tools (e.g. Git
uses “changeset” while SVN “revision”) and the difference
between technical documentation and academic publications
which often use “transaction”. In this paper, we equate those
terms and generally use the term “transaction”, as previous
research does.
Software versioning repositories (managed by version con-
trol systems such as CVS, SVN or Git) store the source code
changes made by developers during the software lifecycle.
Version control systems (VCS) enables developers to query
versioning transactions based on revision number, authorship,
etc. For a given transaction, VCS can produce a difference
(“diff”) view that is a line-based difference view of source
code. For instance, let us consider the following diff:
1 while(i < MAX_VALUE)
2 op.createPanel(i);
3 - i=i+1;
4 + i=i+2;
5
The difference shows one line replaced by another one.
However, one could also observe the changes at the abstract
syntax tree (AST) level, rather than at the line level. In this
case, the AST diff is an update of an assignment statement
within a for loop. In this section, our research question is: what
are versioning transactions made of at the abstract syntax tree
level?.
To answer this question, we have followed the following
methodology. First, we have chosen an AST differencing al-
gorithm from the literature. Then, we have constituted a dataset
of software repositories to run the AST differencing algorithm
on a large number of transactions. Finally, we have computed
descriptive statistics on those AST-based differences. Let us
first discuss the dataset.
A. Dataset
CVS-Vintage is a dataset of 14 repositories of open-
source Java software [18]. The inclusion criterion of CVS-
Vintage is that the repository mostly contains Java code
and has been used in previous published academic work
on mining software repositories and software evolution. This
dataset covers different domains: desktop applications, server
applications, libraries such as logging, compilation, etc. It
includes the repositories of the following projects: ArgoUML,
Columba, JBoss, JHotdraw, Log4j, org.eclipse.ui.workbench,
Struts, Carol, Dnsjava, Jedit, Junit, org.eclipse.jdt.core, Scarab
and Tomcat. In all, the dataset contains 89,993 versioning
transactions, 62,179 of them have at least one modified Java
file. Overtime, 259,264 Java files have been revised (which
makes a mean number of 4.2 Java files modified per transac-
tion).
B. Abstract Syntax Tree Differencing
There are different propositions of AST differencing algo-
rithms in the literature. Important ones include Raghavan et
al.’s Dex [19], Neamtiu et al’s AST matcher [20] and Fluri
et al’s ChangeDistiller [7]. For our empirical study on the
contents of versioning transactions, we have selected the latter.
ChangeDistiller [7] is a fine-grain AST differencing tool for
Java. It expresses fine granularity source code changes using
a taxonomy of 41 source changes types, such as “statement
insertion” of “if conditional change”. ChangeDistiller handles
changes that are specific to object-oriented elements such as
“field addition”. Fluri and colleagues have published an open-
source stable and reusable implementation of their algorithm
for analyzing AST changes of Java code.
ChangeDistiller produces a set of “source code changes”
for each pair of Java files from versioning transactions. For
a source code change, the main output of ChangeDistiller
is a “change type” (from the taxonomy aforementioned).
However, for our analysis, we also consider two other pieces
of information. We reformulate the output of ChangeDistiller,
each AST source code change is represented as a 2-value
tuple: scc = (ct, et) where ct is one of the 41 change types,
et (for entity type) refers to the source code entity related
to the change (for instance, a statement update may change
a method call or an assignment). Since ChangeDistiller is an
AST differencer, formatting transactions (such as changing the
indentation) produce no AST-level change at all. The short
listing above would be represented as one single AST change
that is a statement update (ct) of an assignment (et).
C. Change Models
All versioning transactions can be expressed within a
“change model”. We define a change model as a set of “change
actions”. For instance, the change model of standard Unix diff
is composed of two change actions: line addition and line
deletion. A change model represents a kind of feature space,
2

and observations in that space can be valued. For instance, a
standard Unix diff produces two integer values: the number of
added lines and the number of deleted lines. ChangeDistiller
enables us to define the following change models.
CT (Change Type) is composed of 41 features, the 41
change types of ChangeDistiller. For instance, one of this
feature is “Statement Insertion” (we may use the shortened
name “Stmt_Insert”). CTET (Change Type Entity Type) is
made of all valid combinations of the Cartesian product
between change types and entity types. CTET is a refinement
of CT. Each repair action of CT is mapped to [1 . . . n] repair
actions of CTET. Hence the labels of the repair actions
of CTET always contain the label of CT. There are 104
entity types and 41 change types but many combinations
are impossible by construction, as a result CTET contains
173 features. For instance, since there is one entity type
representing assignments, one feature of CTET is “statement
insertion of an assignment”.
In the rest of this paper, we express versioning transactions
within those two change models. There is no better change
model per se: they describe versioning transactions at different
granularity. We will see later that, depending on the perspec-
tive, both change models have pros and cons.
D. Measures for Change Actions
We define two measures for a change action i: αi is the
absolute number of change action i in a dataset; χi is the
probability of observing a change action i as given by its
frequency over all changes (χi = αi/∑
αi). For instance,
let us consider feature space CT and the change action
“statement insertion” (StmtIns). If there is αStmtIns = 12source code changes related to statement insertion among
100, the probability of observing a statement insertion is
χStmtIns = 12%.
E. Empirical Results
We have run ChangeDistiller over the 62,179 Java transac-
tions of our dataset, resulting in 1,196,385 AST-level changes
for both change models. For change model CT, which is
rather coarse-granularity, the three most common changes are
“statement insert” (28% of all changes), “statement delete”
(23% of all changes) and “statement update” (14% of all
changes). Certain changes are rare, for instance, “addition
of class derivability” (adding keyword final to the class
declaration) only appears 99 times (0.0008% of all changes).
The complete results are given in the companion technical
report [21].
Table I presents the top 20 change actions and the associated
measures for change model CTET. The comprehensive table
for all 173 change actions is given in the companion tech-
nical report [21]. In Table I, one sees that inserting method
invocations as statement is the most common change, which
makes sense for open-source object-oriented software that is
growing.
Let us now compare the results over change models CT
and CTET. One can see that statement insertion is mostly
Change Action αi Prob. χi
Statement insert of method invocation 83,046 6.9%
Statement insert of if statement 79,166 6.6%
Statement update of method invocation 76,023 6.4%
Statement delete of method invocation 65,357 5.5%
Statement delete of if statement 59,336 5%
Statement insert of variable declaration statement 54,951 4.6%
Statement insert of assignment 49,222 4.1%
Additional functionality of method 49,192 4.1%
Statement delete of variable declaration statement 44,519 3.7%
Statement update of variable declaration statement 41,838 3.5%
Statement delete of assignment 41,281 3.5%
Condition expression change of if statement 40,415 3.4%
Statement update of assignment 34,802 2.9%
Addition of attribute 29,328 2.5%
Removal of method 26,172 2.2%
Statement insert of return statement 24,184 2%
Statement parent change of method invocation 21,010 1.8%
Statement delete of return statement 20,880 1.7%
Insert of else statement 20,227 1.7%
Deletion of else statement 17,197 1.4%
Total 1,196,385
Table ITHE ABUNDANCE OF AST-LEVEL CHANGES OF CHANGE MODEL CTET
OVER 62,179 VERSIONING TRANSACTIONS. THE PROBABILITY χi IS THE
RELATIVE FREQUENCY OVER ALL CHANGES (E.G. 6.9% OF SOURCE CODE
CHANGES ARE INSERTIONS OF METHOD INVOCATION).
composed of inserting a method invocation (6.9%), insert an
“if” conditionals (6.6%), and insert a new variable (4.6%).
Since change model CTET is at a finer granularity, there are
less observations: both αi and χi are lower. The probability
distribution (χi) over the change model is less sharp (smaller
values) since the feature space is bigger. High value of χi
means that we have a change action that can frequently be
found in real data: those change actions have of a high
“coverage” of data. CTET features describe modifications
of software at a finer granularity. The differences between
those two change models illustrate the tension between a high
coverage and the analysis granularity.
F. Project-independence of Change Models
An important question is whether the probability distribu-
tion (composed of all χi) of Table I is generalizable to Java
software or not. That is, do developers evolve software in a
similar manner over different projects? To answer this ques-
tion, we have computed the metric values not for the whole
dataset, but per project. In other words, we have computed
the frequency of change actions in 14 software repositories.
We would like to see that the values do not vary between
projects, which would mean that the probability distributions
over change actions are project-independent. Since our dataset
covers many different domains, having high correlation values
would be a strong point towards generalization.
As correlation metric, we use Spearman’s ρ. We choose
Spearman’s ρ because it is non-parametric. In our case, what
matters is to know whether the importance of change actions is
similar (for instance that “statement update” is more common
than“condition expression change”). Contrary to parametric
correlation metric (e.g. Pearson), Spearman’s ρ only focuses
on the ordering between change actions, which is what we are
interested in.
We compute the Spearman correlation values between the
3

0
5
10
15
20
25
30
35
40
0.75 0.80 0.85 0.90 0.95 1.00
Spearman correlation value
# of
pro
ject
pai
rs
Figure 1. Histogram of the Spearman Correlation between Changes ActionFrequencies of Change Model CT Mined on Different Projects. There is nooutlier, there are all higher than 0.75, meaning that the importance of changeactions is project-independent.
probability distributions of all pairs of project of our datasets
(i.e. 14∗132 = 91 combinations). One correlation value takes
as input two vectors representing the probability distributions
(of size 41 for change model CT and 173 for change model
CTET).
The critical value of Spearman’s ρ depends on size of the
vectors being compared and on the required confidence level.
At confidence level α = 0.01, the critical value for change
model CT (41 features) is 0.364 and is 0.3011 for change
model CTET (values from statistical tables, we used [22]).
If the correlation is higher than the critical value, the null
hypothesis (a random distribution) is rejected.
For instance, in change model CT, the Spearman correlation
between Columba and ArgoUML is 0.94 which is much
higher than the critical value (0.364). This means that the
correlation is statistically significant at α = 0.01 confidence
level. The high value shows that those two projects were
evolved in a very similar manner. All values are given in the
companion technical report [21]. Figure 1 gives the distribution
of Spearman correlation values for change model CT. 75%
of the pairs of projects have a Spearman correlation higher
than 0.852. For all pairs of projects, in change model CT,
Spearman’s ρ is much higher that the critical value. This shows
that the likelihood of observing a change action is globally
independent of the project used for computing it.
To understand the meaning of those correlation values, let
us now analyze in detail the lowest and highest correlation
values. The highest correlation value is 0.98 and it corresponds
to the project pair Eclipse-Workbench and Log4j. In this case,
33 out of 41 change actions have a rank difference between 0
1Most statistical tables of Spearman’s ρ stop at N=60, however since thecritical values decreases with N, if ρ > 0.301 the null hypothesis is stillrejected.
2 Spearman correlation is based on ranks, a value of 0.85 means either thatmost change actions are ranked similarly or that a single change action has areally different rank.
and 3. The lowest correlation value is 0.80 and it corresponds
to Spearman correlation values between projects Tomcat and
Carol. In this case, the maximum rank change is 23 (for change
action “Removing Method Overridability” — removing final
for methods). In total, between Tomcat and Carol, there are
six change actions for which the importance changes of at
least 10 ranks. Those high values trigger the 0.80 Spearman
correlation. However, for common changes, it turns out that
their ranks do not change at all (e.g. for “Statement Insert”,
“Statement Update”, etc.).
We have also computed the correlation between projects
within change model CTET (see the companion technical
report [21]). They are all above 0.301, the critical value for
vectors of size 173 at α = 0.01 confidence level, showing
that in change model CTET, the change action importance
is project-independent as well, in a statistically significant
manner. Despite being high, we note that they are slightly
lower than for change model CT, this is due to the fact that
Spearman’s ρ generally decreases with the vector size (as
shown by the statistical table).
G. Recapitulation
To sum up, we provide the empirical importance of 173
source code change actions; we show that the importance
of change actions are project independent; we show that the
probability distribution of change actions is very unbalanced.
Our results are based on the analysis of 62,179 transactions.
To our knowledge, those results have never been published
before, given this analysis granularity and the scale of the
empirical study.
The threats to the validity of our results are of two kinds.
From the internal validity viewpoint, a bug somewhere in the
implementation may invalidate our results. From the external
validity viewpoint, there is risk that our dataset of 14 projects
is not representative of Java software as a whole, even if they
are written by different persons from different organizations
in different application domains. Also, our results may not
generalize to other programming languages.
III. SLICING TRANSACTIONS TO FOCUS ON BUG FIXES
In Section II, we have defined and discussed two measures
per change action i: αi and χi. For instance, χStmtInsert
gives the frequency of a statement insertion. Those measures
implicitly depend on a transaction bag to be computed. So
far we have considered all versioning transactions of the
repository. For defining a repair space, we need to apply those
two measures on a transaction bag representative of software
repair. How should we slice transactions to focus on bug fixes?
An intuitive method, that we will use as baseline, is to rely
on the commit message (by slicing only those transactions that
contain a given word or expression related to bug fixing). Be-
fore going further, let us clarify the goal of the classification:
the goal is to have a good approximation of the probability
distribution of change actions for software repair3. Later is the
3Note that our goal is not to have a good classification in terms of precisionor recall.
4
paper, we will define a mathematical criterion to tell whether
one approximation is better than another.
A. Slicing Based on the Commit Message
When committing source code changes, developers may
write a comment/message explaining the changes they have
made. For instance when a transaction is related to a bug
fix, they may write a comment referencing the bug report or
describing the fix.
To identify transaction bags related to bug fix, previous work
focused on the content of the commit text: whether it contains
a bug identifier, or whether it contains some keywords such
as “fix” (see [23] for a discussion on those approaches). To
identify bug fix patterns, Pan et al. [24] select transactions
containing at least one occurrence of “bug”, “fix” or “patch”.
We call this transaction bag BFP. We will compute αi and χi
based on this definition.
Such a transaction bag makes a strong assumption on the
development process and the developer’s behavior: it assumes
that developers generally put syntactic features in commit texts
enabling to recognize repair transactions, which is not really
true in practice [23], [25], [26].
B. Slicing Based on the Change Size in Terms of Number of
AST Changes
We may also define fixing transaction bags based on their
“AST diffs”, i.e.; based on the type and numbers of change
actions that a versioning transaction contains. This transaction
bag is called N-SC (for N Abstract Syntactic Changes), e.g.
5-SC represents the bag of transactions containing five AST-
level source code change.
In particular, we assume that small transactions are very
likely to only contain a bug fix and unlikely to contain a new
feature. Repair actions may be those that appear atomically in
transactions (i.e. the transaction only contains one AST-level
source code change). “1-SC” (composed of all transactions of
one single AST change) is the transaction bag that embodies
this assumption. Let us verify this assumption.
C. Do Small Versioning Transactions Fix Bugs?
1) Experiment: We set up a study to determine whether
small transactions correspond to bug fixes changes. We define
small as those transactions that introduce only one AST
change.
2) Overview: The study consists in manual inspection and
evaluation of source code changes of versioning transactions.
First, we randomly take a sample set of transactions from
our dataset (see II-A). Then, we create an “evaluation item”
for each pair of files of the sample set (the file before and
after the revision). An evaluation item contains data to help
the raters to decide whether a transaction is a bug fix or
not: the syntactic line-based differencing between the revision
pair of the transaction (it helps to visualize the changes), the
AST change between them (type and location – e.g. insertion
of method invocation at line 42) and the commit message
associated with the transaction.
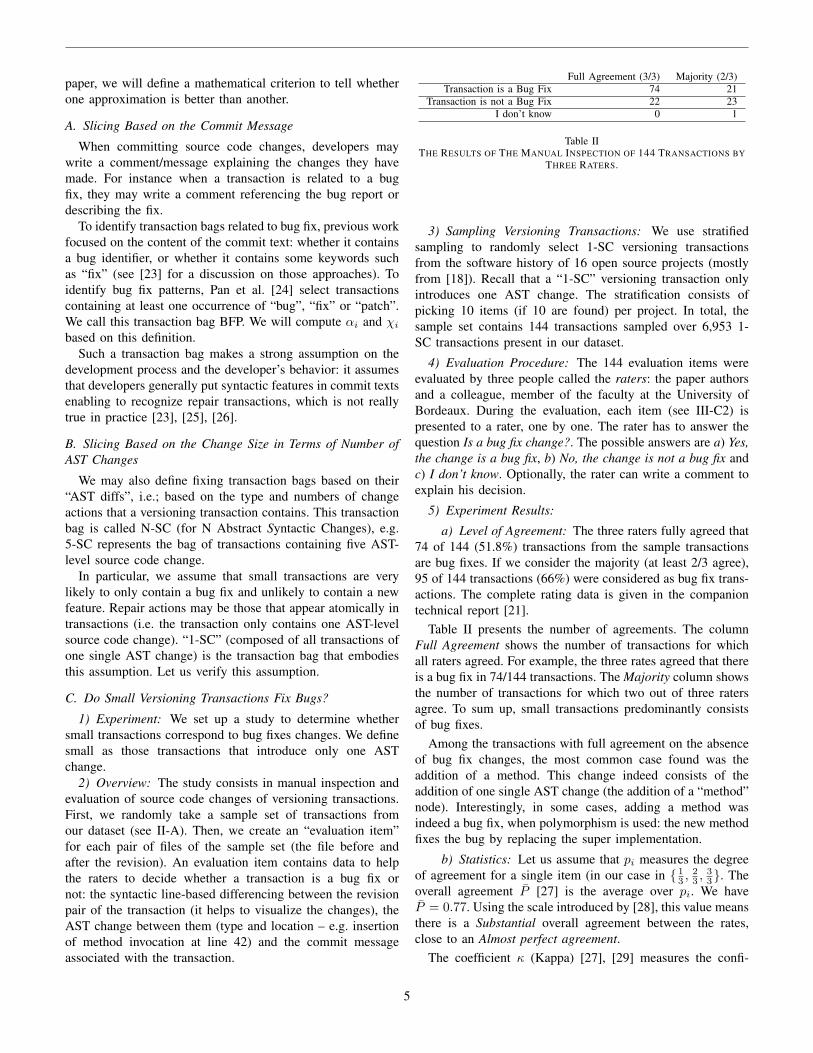
Full Agreement (3/3) Majority (2/3)
Transaction is a Bug Fix 74 21
Transaction is not a Bug Fix 22 23
I don’t know 0 1
Table IITHE RESULTS OF THE MANUAL INSPECTION OF 144 TRANSACTIONS BY
THREE RATERS.
3) Sampling Versioning Transactions: We use stratified
sampling to randomly select 1-SC versioning transactions
from the software history of 16 open source projects (mostly
from [18]). Recall that a “1-SC” versioning transaction only
introduces one AST change. The stratification consists of
picking 10 items (if 10 are found) per project. In total, the
sample set contains 144 transactions sampled over 6,953 1-
SC transactions present in our dataset.
4) Evaluation Procedure: The 144 evaluation items were
evaluated by three people called the raters: the paper authors
and a colleague, member of the faculty at the University of
Bordeaux. During the evaluation, each item (see III-C2) is
presented to a rater, one by one. The rater has to answer the
question Is a bug fix change?. The possible answers are a) Yes,
the change is a bug fix, b) No, the change is not a bug fix and
c) I don’t know. Optionally, the rater can write a comment to
explain his decision.
5) Experiment Results:
a) Level of Agreement: The three raters fully agreed that
74 of 144 (51.8%) transactions from the sample transactions
are bug fixes. If we consider the majority (at least 2/3 agree),
95 of 144 transactions (66%) were considered as bug fix trans-
actions. The complete rating data is given in the companion
technical report [21].
Table II presents the number of agreements. The column
Full Agreement shows the number of transactions for which
all raters agreed. For example, the three rates agreed that there
is a bug fix in 74/144 transactions. The Majority column shows
the number of transactions for which two out of three raters
agree. To sum up, small transactions predominantly consists
of bug fixes.
Among the transactions with full agreement on the absence
of bug fix changes, the most common case found was the
addition of a method. This change indeed consists of the
addition of one single AST change (the addition of a “method”
node). Interestingly, in some cases, adding a method was
indeed a bug fix, when polymorphism is used: the new method
fixes the bug by replacing the super implementation.
b) Statistics: Let us assume that pi measures the degree
of agreement for a single item (in our case in 13 ,23 ,
33. The
overall agreement P [27] is the average over pi. We have
P = 0.77. Using the scale introduced by [28], this value means
there is a Substantial overall agreement between the rates,
close to an Almost perfect agreement.
The coefficient κ (Kappa) [27], [29] measures the confi-
5

dence in the agreement level by removing the chance factor4.
The κ degree of agreement in our study is 0.517, a value
distant from the critical value (it is 0). The null hypothesis is
rejected, the observed agreement was not due to chance.
6) Conclusion: The manual inspection of 144 versioning
transaction shows that there is a relation between the one AST
change transactions and bug fixing. Consequently, we can use
the 1-SC transaction bag to estimate the probability of change
actions for software repair.
IV. FROM CHANGE MODELS TO REPAIR MODELS
This section presents how we can transform a “change
model” into a “repair model” usable for automated software
repair. As discussed in Section II, a change model describes
all types of source code change that occur during software
evolution. On the contrary, we define a “repair action” as a
change action that often occurs for repairing software, i.e.
often used for fixing bugs.
By construction, a repair model is equal to a subset of a
change model in terms of features. But more than the number
of features, our intuition is that the probability distribution
over the feature space would vary between change models and
repair models. For instance, one might expect that changing
the initialization of a variable has a higher probability in a
repair model. Hence, the difference between a change model
and a repair model is matter of perspective. Since we are
interested in automated program repair, we now concentrate
on the “repair” perspective hence use the terms “repair model”
and “repair action” in the rest of the paper.
A. Methodology
We have applied the same methodology as in II. We have
computed the probability distributions of repair model CT and
CTET based on different definitions of fix transactions, i.e.
we have computed αi and χi based on the transactions bags
discussed in III: ALL transactions, N-SC and BFP. For N-SC,
we choose four values of N: 1-SC, 5-SC, 10-SC and 20-SC.
Transactions larger than 20-SC have almost the same topology
of changes as ALL, as we will show later (see section IV-C2).
The main question we ask is whether those different defi-
nitions of “repair transactions” yield different topologies for
repair models.
B. Empirical Results
Table III presents the top 10 change types of repair model
CT associated with their probability χi for different versioning
transaction bags. The complete table for all repair actions is
given in the companion technical report [21]. Overall, the
distribution of repair actions over real bug fix data is very
unbalanced, the probability of observing a single repair action
goes from more than 30% to 0.000x%. We observe the Pareto
effect: the top 10 repair actions account for more than 92%
of the cumulative probability distribution.
4Some degree of agreement is expected when the ratings are purelyrandom[27], [29].
Furthermore, we have made the following observations from
the experiment results:
First, the order of repair actions (i.e. their likelihood of con-
tributing to bug repair) varies significantly depending on the
transaction bag used for computing the probability distribution.
For instance: a statement insertion is #1 when we consider
all transactions (column ALL), but only #4 when considering
transactions with a single AST change (column 1-SC). In this
case, the probability of observing a statement insertion varies
from 29% to 12%.
Second, even when the orders obtained from two different
transaction bags resemble such as for ALL and 20-SC, the
probability distribution still varies: for instance χStmt_Upd is
29% for transaction bag ALL, but jumps to 33% for transaction
bag 20-SC.
Third, the probability distributions for transaction bags ALL
and BFP are close: repair action has similar probability values.
As consequence, transaction bag BFP maybe is a random
subset of ALL transactions. All those observations also hold
for repair model CTET, the complete table is given in the
companion technical report [21].
Those results are a first answer to our question: different
definitions of “repair transactions” yield different probability
distribution over a repair model.
C. Discussion
We have shown that one can base repair models on different
methods to extract repair transaction bags. There are certain
analytical arguments against or for those different repair space
topologies. For instance, selecting transactions based on the
commit text makes a very strong assumption on the quality of
software repository data, but ensures that the selected trans-
actions contain at least one actual repair. Alternatively, small
transactions indicate that they focus on to a single concern,
they are likely to be a repair. However, small transactions
may only see the tip of the fix iceberg (large transactions
may be bug fixing as well), resulting in a distorted probability
distribution over the repair space. At the experimental level,
the threats to validity are the same as for Section II.
1-SC 5-SC 10-SC 20-SC BFP
ALL 0.68 0.95 0.97 0.98 0.99
Table IVTHE SPEARMAN CORRELATION VALUES BETWEEN REPAIR ACTIONS OF
TRANSACTION BAG “ALL” AND THOSE FROM THE TRANSACTION BAGS
BUILT WITH 5 DIFFERENT HEURISTICS.
1) Correlation between Transaction Bags: To what extent
are the 6 transactions bags different? We have calculated
the Spearman correlation values between the probabilities
over repairs actions between all pairs of distributions. In
particular, we would like to know whether the heuristics
yield significantly different results compared to all transactions
(transaction bag ALL). Table IV presents these correlation
values.
6

ALL BFP 1-SC 5-SC 10-SC 20-SC
Stmt_Insert-29% Stmt_Insert-32% Stmt_Upd-38% Stmt_Insert-28% Stmt_Insert-31% Stmt_Insert-33%
Stmt_Del-23% Stmt_Del-23% Add_Funct-14% Stmt_Upd-24% Stmt_Upd-19% Stmt_Del-16%
Stmt_Upd-15% Stmt_Upd-12% Cond_Change-13% Stmt_Del-11% Stmt_Del-14% Stmt_Upd-16%
Param_Change-6% Param_Change-7% Stmt_Insert-12% Add_Funct-10% Add_Funct-8% Param_Change-7%
Order_Change-5% Order_Change-6% Stmt_Del-6% Cond_Change-7% Param_Change-7% Add_Funct-7%
Add_Funct-4% Add_Funct-4% Rem_Funct-5% Param_Change-5% Cond_Change-6% Cond_Change-5%
Cond_Change-4% Cond_Change-3% Add_Obj_St-3% Add_Obj_St-3% Add_Obj_St-3% Add_Obj_St-3%
Add_Obj_St-2% Add_Obj_St-2% Order_Change-2% Rem_Funct-3% Rem_Funct-2% Order_Change-3%
Rem_Funct-2% Alt_Part_Insert-2% Rem_Obj_St-2% Order_Change-1% Order_Change-2% Rem_Funct-2%
Alt_Part_Insert-2% Rem_Funct-2% Inc_Access_Change-1% Rem_Obj_St-1% Alt_Part_Insert-1% Alt_Part_Insert-2%
Table IIITOP 10 CHANGE TYPES OF CHANGE MODEL CT AND THEIR PROBABILITY χi FOR DIFFERENT TRANSACTION BAGS. THE DIFFERENT HEURISTICS USED
TO COMPUTE THE FIX TRANSACTIONS BAGS HAS A SIGNIFICANT IMPACT ON BOTH THE RANKING AND THE PROBABILITIES.
For instance, the Spearman correlation value between ALL
and 1-SC is 0.68. This value shows, as we have noted before,
that there is not a strong correlation between the order of their
repair actions of both transaction bags. In other words, heuris-
tic 1-SC indeed focuses on a specific kind of transactions.
On the contrary, the value between ALL and BFP is 0.99.
This means the order of the frequency of repair actions are
almost identical. Moreover, Table IV shows the correlation
values between N-SC (N = 1, 5, 10 and 20) and ALL tend
to 1 (i.e. perfect alignment) when N grows. This validates
the intuition that the size of transactions (in number of AST
changes) is a good predictor to focus on transactions that
are different in nature from the normal software evolution.
Crossing this result with the results of our empirical study
of 144 -SC transactions, there is some evidence that by
concentrating on small transactions, we probably have a good
approximation of repair transactions.
2) Skewness of Probability Distributions: Figure 2 shows
the probability for the most frequent repair actions of repair
model CTET according to the transaction size (in number
of AST changes). For instance, the probability of updating
a method invocation decreases from 15% in 1-SC transactions
to 7% in all transactions. In particular, we observe that: a) for
transaction with 1 AST change, the change probabilities are
more unbalanced (i.e. less uniform than for all transactions).
There are 5 changes that are much more frequent than the
rest. b) for transactions with more than 10 AST changes, the
probabilities of top changes are less dispersed and all smaller
than 0.9% c) the probabilities of those 5 most frequent changes
decrease when the transaction size grows. This is a further
piece of evidence that heuristics N-SC provide a focus on
transactions that are of specific nature, different from the bulk
of software evolution.
3) Conclusion: Those results on repair actions are espe-
cially important for automated software repair: we think it
would be fruitful to devise automated repair approaches that
“imitate” how human developers fix programs. To us, using
the probabilistic repair models as described in this section is
a first step in that direction.
Stmt update of method invocationAdd funct of methodCondition change of IfStmt update of variable declarationStmt Insert of method invocationStmt update of assignmentStmt update of returnRemove funct of methodStmt delete of method invocationAdd Object State of attributeStmt Insert of assignmentRemove obj State of attribute
0.00
0.02
0.04
0.06
0.08
0.10
0.12
0.14
0.16
2 4 6 8 10 ALL...1 3 5 7 9
AS
T ch
ange
pro
babi
lity
Transaction size (In AST changes)
Figure 2. Probabilities of the 12 most frequent AST changes for 11 differenttransaction bags: 10 that include transactions with i AST changes, with i =1...10, and the ALL transaction bag.
V. AUTOMATED ANALYSIS OF THE TIME TO NAVIGATE
INTO THE SEARCH SPACE OF AUTOMATED PROGRAM
REPAIR
This section discusses the nature of the search space size of
automated program repair. We show that the two repair models
defined in IV allow mathematical reasoning. We present a way
of comparing repair models and their probability distribution
based on data from software repositories.
A. Decomposing The Repair Search Space
The search space of automated program repair consists of
all explorable bug fixes for a given program and a given bug
(whether compilable, executable or correct). If one bounds
the size of the repair (e.g. all patched of at most 40 lines),
the search space size is finite. A naive search space is huge,
because even in a bounded size scenario, there are a myriad
of elements to be added, removed or modified: statements,
variables, operators, literals.
A key point of automated program repair research consists
of decreasing the time to navigate the repair search space.
There are many ways to decrease this time. For instance,
fault localization enables the search to first focus on places
where fixes are likely to be successful. This one and other
components of a repair process may participate in an efficient
navigation. One of them is the “shaping” of fixes.
7

Informally, the shape of a bug fix is a kind of patch.
For instance, the repair shape of adding an “if” throwing an
exception for signaling an incorrect input consists of inserting
an if and inserting a throw. The concept of “repair shape”
is equivalent to what Wei et al. [3] call a “fix schema”, and
Weimer et al [2] a “mutation operator”.
In this paper, we define a “repair shape” as an unordered
tuple of repair actions (from a set of repair actions called R)5.
In the if/throw example aforementioned, in repair space CTET,
the repair shape of this bug fix consists of two repair actions:
statement insertion of “if” and statement insertion of “throw”.
The shaping space consists of all possible combinations of
repair actions.
The instantiation of a repair shape is what we call fix
synthesis. The complexity of the synthesis depends on the
repair actions of the shaping space. For instance, the repair
actions of Weimer et al. [2] (insertion, deletion, replace) have
an “easy” and bounded synthesis space (random picking in the
code base).
To sum up, we consider that the repair search space can
be viewed as the combination of the fault localization space
(where the repair is likely to be successful), the shaping space
(which kind of repair may be applied) and the synthesis space
(assigning concrete statements and values to the chosen repair
actions). The search space can then be loosely defined as the
Cartesian product of those spaces and its size then reads:
|FAULT LOCALIZATION| × |SHAPE| × |SYNTHESIS|
In this paper, we concentrate on the shaping part of the
space. If one can find efficient strategies to navigate through
this shaping space, this would contribute to efficiently navi-
gating through the repair search space as a whole, thanks to
the combination.
B. Mathematical Analysis Over Repair Models
To analyze the shaping space, we now present a mathemati-
cal analysis of our probabilistic repair models. So far, we have
two repair models CT and CTET (see IV) and different ways
to parametrize them.
According to our probabilistic repair model, a good naviga-
tion strategy consists on concentrating on likely repairs first:
the repair shape is more likely to be composed of frequent
repair actions. That is a repair shape of size n is predicted by
drawing n repair actions according to the probability distribu-
tion over the repair model. Under the pessimistic assumption
that repair actions are independent6, our repair model makes
it possible to know the exact median number of attempts N
5Since a bug fix may contain several instances of the same repair actions(e.g. several statement insertions), the repair shape may contain several timesthe same repair action.
6 Equation (1) holds if and only if we consider them as independent. Ifthey are not, it means that we under-estimate the deep structure of the repairspace, hence we over-approximate the time to navigate in the space to find thecorrect shape. In other words, even if the repair actions are not independent(which is likely for some of them) our conclusions are sound.
that is needed to find a given repair shape R (demonstration
given in the companion technical report [21]):
N = k such that
k∑
i=1
p(1− p)i−1 ≥ 0.5 (1)
with p =n!
Πj(ej !)×Πr∈RPP(r)
where ej is the number of occurrences of rj inside R
For instance, the repair of revision 1.2 of Eclipse’s
CheckedTreeSelectionDialog7 consists of two inserted state-
ments. Equation 1 tells us that in repair model CT, we would
need in average 12 attempts to find the correct repair shape
for this real bug.
Having only a repair shape is far from having a real fix.
However, the concept of repair shape associated with the
mathematical formula analyzing the time to navigate the repair
space is key to compare ways to build a probability distribution
over repair models.
C. Comparing Probability Distributions Over Repair Actions
From Versioning History
We have seen in Section V-B that the time for finding
correct repair shapes depends on a probability distribution over
repair actions. The probability distribution P is crucial for
minimizing the search space traversal: a good distribution P
results in concentrating on likely repairs first, i.e. the repair
space is traversed in a guided way, by first exploring the parts
of the space that are likely to be more fruitful. This poses
two important questions: first, how to set up a probability
distribution over repair actions; second, how to compare the
efficiency of different probability distributions to find good
repair shapes.
To compute a probability distribution over repair actions,
we propose to learn them from software repositories. For
instance, if many bug fixes are made of inserted method
calls, the probability of applying such a repair action should
be high. Despite our single method (learning the probability
distributions from software repositories), we have shown in IV
that there is no single way to compute them (they depend on
different heuristics). To compare different distributions against
each other, we set up the following process.
One first selects bug repair transactions in the versioning
history. Then, for each bug repair transaction, one extracts its
repair shape (as a set of repair actions of a repair model). Then
one computes the average time that a maximum likelihood
approach would need to find this repair shape using equation 1.
Let us assume two probability distributions P1 and P2
over a repair model and four fixes (F1 . . . F4) consisting
of two repair actions and observed in a repository. Let us
assume that the time (in number of attempts) to find the
exact shape of F1 . . . F4 according to P1 is (5, 26, 9, 12) and
according to P2 (25, 137, 31, 45). In this case, it’s clear that the
7“Fix for 19346 integrating changes from Sebastian Davids” http://goo.gl/d4OSi
8

Input: C ⊲ A bag of transactions
Output: The median number of attempts to find good repair shapes
beginΩ← ⊲ Result set
T,E ← split(C) ⊲ Cross-validation: split C into Training and Evaluation data
M ← train_model(T ) ⊲ Train a repair model (e.g. compute a probability distribution over repair actions)
for s ∈ E ⊲ For all repairs observed in the repository
don← compute_repairability(s,M) ⊲ How long to find this repair according to the repair model
Ω← R ∪ n ⊲ Store the “repairability” value of s
return median(Ω) ⊲ Returning the median number of attempts to find the repair shapes
Figure 3. An Algorithm to Compare Fix Shaping Strategies. There may be different flavors of functions split, f and computeRepairability.
Repair /Repair Size 1 2 3 4 5 6 7 8
ArgoUML 6 (996) 13 (638) 86 (386) 267 (362) 1394 (254) 5977 (234) 16748 (197) 73430 (166)Carol 7 (30) 13 (15) 121 (10) 466 (10) 494 (7) 24117 (13) 14019 (6) 30631 (9)
Columba 3 (382) 13 (255) 68 (144) 552 (146) 940 (113) 2111 (108) 10908 (73) 64606 (94)Dnsjava 6 (165) 13 (139) 101 (71) 218 (82) 1553 (54) 5063 (50) 16363 (33) ∞(44)
jEdit 3 (115) 13 (84) 58 (53) 251 (48) 2906 (32) 3189 (30) 5648 (29) 23395 (32)jBoss 6 (514) 15 (353) 88 (208) 272 (189) 1057 (147) 6034 (150) 13148 (86) 38485 (113)
jHotdraw6 7 (21) 13 (21) 159 (9) 187 (10) 1779 (10) 611 (3) ∞(5) 56391 (2)jUnit 3 (40) 42 (39) 596 (18) ∞(11) 49345 (7) ∞(11) 31634 (9) ∞(6)
Log4j 6 (223) 15 (134) 146 (68) 665 (70) 6459 (64) 16879 (42) 55582 (41) ∞(48)org.eclipse.jdt.core 6 (1606) 26 (1025) 93 (657) 291 (631) 1704 (392) 4639 (416) 18344 (314) 74863 (309)
org.eclipse.ui.workbench 3 (1184) 13 (783) 74 (414) 311 (464) 1023 (326) 6035 (305) 22864 (215) 77532 (192)Scarab 6 (653) 16 (346) 113 (202) 420 (159) 764 (113) 3914 (137) 13104 (89) 59232 (77)Struts 3 (221) 17 (133) 100 (86) 222 (103) 675 (61) 4785 (77) 16796 (39) 95588 (34)
Tomcat 3 (281) 13 (167) 135 (111) 431 (120) 1068 (84) 3497 (87) 7407 (61) 34240 (51)
Table VTHE MEDIAN NUMBER OF ATTEMPTS (IN BOLD) REQUIRED TO FIND THE CORRECT REPAIR SHAPE OF FIX TRANSACTIONS. THE VALUES IN BRACKETS
INDICATE THE NUMBER OF FIX TRANSACTIONS TESTED PER PROJECT AND PER TRANSACTION SIZE FOR REPAIR MODEL CT. THE REPAIR MODEL CT IS
MADE FROM THE DISTRIBUTION PROBABILITY OF CHANGES INCLUDED IN 5-SC TRANSACTION BAGS. FOR SMALL TRANSACTIONS, FINDING THE
CORRECT REPAIR SHAPE IN THE SEARCH SPACE IS DONE IN LESS THAN 100 ATTEMPTS.
probability distribution P1 enables us to find the correct repair
shapes faster (the shaping time for P1 are lower). Beyond this
example, by applying the same process over real bug repairs
found in a software repository, our process enables us to select
the best probability distributions for a given a repair model.
Since equation 1 is parametrized by a number of repair ac-
tions, we instantiate this process for all bug repair transactions
of a certain size (in terms of AST changes). This means that
our process determines the best probability distribution for a
given bug fix shape size.
D. Cross-Validation
We compute different probability distributions Px from
transaction bags found in repositories. We evaluate the time to
find the shape of real fixes that are also found in repositories,
which may bias the results. To overcome this problem, we use
cross-validation: we always use different sets of transactions
to estimate P and to calculate the average number of attempts
required to find a correct repair shape. Using cross-validation
reduces the risk of overfitting.
Since we have a dataset of 14 independent software repos-
itories, we use this dataset structure for cross-validation.
We take one repository for extracting repair shapes and the
remaining 13 projects to calibrate the repair model (i.e. to
compute the probability distributions). We repeat the process
14 times, by testing each of the 14 projects separately. In
other words, we try to predict real repair shapes found in one
repository from data learned on other software projects.
Figure 3 sums up this algorithm to compare fix shaping
strategies. From a bag of transactions C, function split creates
a set of testing transactions and a set of evaluation transactions.
Then, one trains a repair model (with function trainModel),for repair models CT and CTET it means computing a proba-
bility distribution on a specific bag of transactions. Finally, for
each repair of the testing data, one computes its “repairability”
according to the repair model (with Equation 1). The algorithm
returns the median repairability, i.e. the median number of
attempts required to repair the test data.
E. Empirical Results
We run our fix shaping process on our dataset of 14
repositories of Java software considering two repair models:
CT and CTET (see Section II-C). We remind that CT consists
of 41 repair actions and CTET of 173 repair actions. For both
repair models, we have tested the different heuristics of IV-A
to compute the median repair time: all transactions (ALL); one
AST change (1-SC); 5 AST changes (5-SC); 10 AST changes
(10-SC); 20 AST changes (20-SC); transactions with commit
9

EQ1-SC5-SC10-SC20-SCBFPALL
0
5000
10000
15000
20000
0 1 2 3 4 5 6 7 8 9
0
100
200
300
400
500
1.0 2.0 3.0 4.0
Med
ian
# re
pair
atte
mpt
s
Repair size (in # AST changes)
Figure 4. The repairability of small transactions in repair model CT. Certainprobability distributions yield a median repair time that is much lower thanothers.
text containing “bug”, “fix”, “patch” (BFP); a baseline of a
uniform distribution over the repair model (EQP for equally-
distributed probability).
We extracted all bug fix transactions with less than 8
AST changes from our dataset. For instance, the versioning
repository of DNSJava contains 165 transactions of 1 repair
action, 139 transactions of size 2, 71 transactions of size 3,
etc. The biggest number of available repair tests are in jdt.core
(1,605 fixes consist of one AST change), while Jhotdraw has
only 2 transactions of 8 AST changes. We then computed
the median number of attempts to find the correct shape
of those 23,048 fix transactions. Since this number highly
depends on the probability distributions Px, we computed the
median repair time for all combinations of fix size transactions,
projects, and heuristics discussed above (8× 14× 6).
Table V presents the results of this evaluation for repair
space CT and transaction bag 5-SC. For each project, the
bold values give the median repairability in terms of number
of attempts required to find the correct repair shape with a
maximum likelihood approach. Then, the bracketed values
give the number of transactions per transaction size (size in
number of AST changes) and per project. For instance, over
996 fix transactions of size 1 in the ArgoUML repository,
it takes an average of 6 attempts to find the correct repair
shape. On the contrary, for the 51 transactions of size 8 in the
Tomcat repository, it takes an average of 34,240 attempts to
find the correct repair shape. Those results are encouraging:
for small transactions, it takes a handful of attempts to find
the correct repair shape. The probability distribution over the
repair model seems to drive the search efficiently. The other
heuristics yield similar results – the complete results (6 tables
– one per heuristic) are given in [21].
About cross-validation, one can see that the performance
over the 14 runs (one per project) is similar (all columns
of Table V contain numbers that are of similar order of
magnitude). Given our cross-validation procedure, this means
that for all projects, we are able to predict the correct shapes
using only knowledge mined in the other projects. This gives
EQ1-SC5-SC10-SC20-SCBFPALL
0
5000
10000
15000
20000
0 1 2 3 4 5 6 7 8 9
0
100
200
300
400
500
1.0 2.0 3.0 4.0
Repair size (In abstract syntactic changes)
Med
ian
# re
pair
atte
mpt
s
EQ1-SC5-SC10-SC20-SCBFPALL
0
20000
40000
60000
80000
100000
120000
1 2 3 4
Med
ian
# re
pair
atte
mpt
s
Repair size (in # AST changes)
Figure 5. The repairability of small transactions in repair space CTET. Thereis no way to find the repair shapes of transactions larger than 4 AST codechanges.
us confidence that one could apply our approach to any new
project using the probability distributions mined in our dataset.
Furthermore, finding the correct repair shapes of larger
transactions (up to 8 AST changes) has an order of magnitude
of 104 and not more. Theoretically, for a given fix shape
of n AST changes, the size of the repair model is the
number of repair actions of the model at the power of n(e.g. |CT |n). For CT and n = 4, this results in a space of
414 = 2,825,761 possible shapes (approx 106). In practice,
overall all projects, for small shapes (i.e. less or equal than 3
changes), a well-defined probability distribution can guide to
the correct shape in a median time lower than 200 attempts.
This again show that the probability distribution over the repair
model is so unbalanced that the likelihood of possible shapes
is concentrated on less than 104 shapes (i.e. that the probability
density over |CT |n is really sparse).
Now, what is the best heuristic, with respect to shaping, to
train our probabilistic repair models? For each repair shape
size of Table V and heuristic, we computed the median
repairability over all projects of the dataset (a median of
median number of attempts). We also compute the median
repairability for a baseline of a uniform distribution (EQP)
over the repair model (i.e. ∀i, P (ri) = 1/|CT |)). Figure 4
presents this data for repair model CT. It shows the median
number of attempts required to identify correct repair shapes as
Y-axis. The X-axis is the number of repair actions in the repair
test (the size). Each line represents probability estimation
heuristics.
Figure 4 gives us important pieces of information. First, the
heuristics yield different repair time. For instance, the repair
time for heuristic 1-SC is generally higher than for 20-SC.
Overall, there is a clear order between the repairability time:
for transactions with less than 5 repair actions heuristic 5-SC
gives the best results, while for bigger transactions 20-SC is
the best. Interestingly, certain heuristics are inappropriate for
maximum-likelihood shaping of real bug fixes: the resulting
distributions of probability results in a repair time that ex-
plodes even for small shape (this is the case for a uniform
10

distribution EQP even for shape of size 3). Also, all median
repair times tend toward infinity for shape of size larger than
9. Finally, although 1-SC is not good over many shape size,
we note that that for small shape of size 1 is better. This is
explained by the empirical setup (where we also decompose
transactions by shape size).
1) On The Best Heuristics for Computing Probability Dis-
tributions over Repair Actions: To sum up, for small repair
shapes heuristic 1-SC is the best with respect to probabilistic
repair shaping, but it is not efficient for shapes of size greater
than two AST-level changes. Heuristics 5-SC and 20-SC are
the best for changes of size greater than 2. An important point
is that some probability distributions (in particular built from
heuristics EQP and 1-SC) are really suboptimal for quickly
navigating into the search space.
Do those findings hold for repair model CTET, which has
a finer granularity?
2) On The Difference between Repair Models CT and
CTET: We have also run the whole evaluation with the repair
model CTET (see II-C). The empirical results are given in the
companion technical report [21](in the same form as Table V).
Figure 5 is the sibling of figure 4 for repair model CTET.
They look rather different. The main striking point is that with
repair model CTET, we are able to find the correct repair shape
for fixes that are no larger than 4 AST changes. After that, the
arithmetic of very low probabilities results in virtually infinite
time to find the correct repair shape. On the contrary, in the
repair model CT, even for fixes of 7 changes, one could find
the correct shape in a finite number of attempts. Finally, in this
repair model the average time to find a correct repair shape is
several times larger than in CT (in CT, the shape of fixes of
size 3 can be find in approx. 200 attempts, in CTET, it’s more
around 6,000).
For a given repair shape, the synthesis consists of finding
concrete instances of repair actions. For instance, if the pre-
dicted repair action in CTET consists of inserting a method
call, it remains to predict the target object, the method and its
parameters. We can assume that the more precise the repair
action, the smaller the “synthesis space”. For instance, in
CTET, the synthesis space is smaller compared to CT, because
it only composed of enriched versions of basic repair actions
of repair model CT (for instance inserting an “if” instead of
inserting a statement).
Our results illustrate the tension between the richness of the
repair model and the ease of fixing bugs automatically. When
we consider CT, we find likely repair shapes quickly (less
than 5,000 attempts), even for large repair, but to the price
of a larger synthesis space. In other words, there is a balance
between finding correct repair actions and finding concrete
repair actions. When the repair actions are more abstract, it
results in a larger synthesis space, when repair actions are more
concrete, it hampers the likelihood of being able to concentrate
on likely repair shapes first. We conjecture that the profile
based on CT is better because of the following two points:
it enables us to find bigger correct repair shapes (good) in a
smaller amount of time (good).
Finally, we think that our results empirically explore some
of the foundations of “repairing”: there is a difference between
prescribing aspirin (it has a high likelihood to contribute to
healing, but only partially) and prescribing a specific medicine
(one can try many medicines before finding the perfect one).
VI. ACTIONABLE GUIDELINES FOR AUTOMATED
SOFTWARE REPAIR
Our results blend empirical findings with theoretical in-
sights. How can they be used within a approach for automated
software repair? This section presents actionable guidelines
arising from our results. We apply those guidelines in a case
study that consists of reasoning on a simplified version of
GenProg within our probabilistic framework.
A. Consider Using a Probability Distribution over Repair
Actions
Automated software repair embed a set of repair actions,
either explicitly or implicitly. On two different repair models,
we have shown that the importance of each repair action
greatly varies. Furthermore, our mathematical analysis has
proved that considering a uniform distribution over repair
actions is extremely suboptimal.
Hence, from the viewpoint of the time to fix a bug, we rec-
ommend to set up a probability distribution over the considered
repair actions. This probability distribution can be learned on
past data as we do in this paper or simply tuned with an
incremental evaluation process. For instance, Le Goues et al.
[30] have done similar probabilistic tuning over their three
repair actions. Overall, using a probability distribution over
repair actions could significantly fasten the repair process.
B. Be Aware of the Interplay between Shaping and Synthesis
We have shown that having more precise shapes has a real
impact on shaping time. In repair model CT, for fix shapes of
size 3, the logical shaping time is approximately 150 attempts.
In repair model CTET, for shapes of the same size, the average
logical time jumps around 4,000, which represents more than
a ten-fold increase. Our work quantitatively highlights the
impact of consider more precise repair actions. By being aware
of the interplay between shaping and synthesis, the research
community will be able to create a disciplined catalog of
repair actions and to identify where the biggest synthesis
challenges lie.
C. Analyze the Repairability depending on The Fix Size
We have shown that certain repair shapes are impossible to
find because of their size. In repair model CT, the shapes of
more than 10 repair actions are not found in a finite time. In
repair model CTET, the repair shapes of more than 5 actions
are not found either. Given that a repair shape is an abstraction
over a concrete bug fix, if one can not find the abstraction,
there is no chance to find the concrete bug fix.
Our analysis for identifying this limit is agnostic of the re-
pair actions. Hence one can use our methodology and equation
to analyze the size of the “findable” fixes. Our probabilistic
11
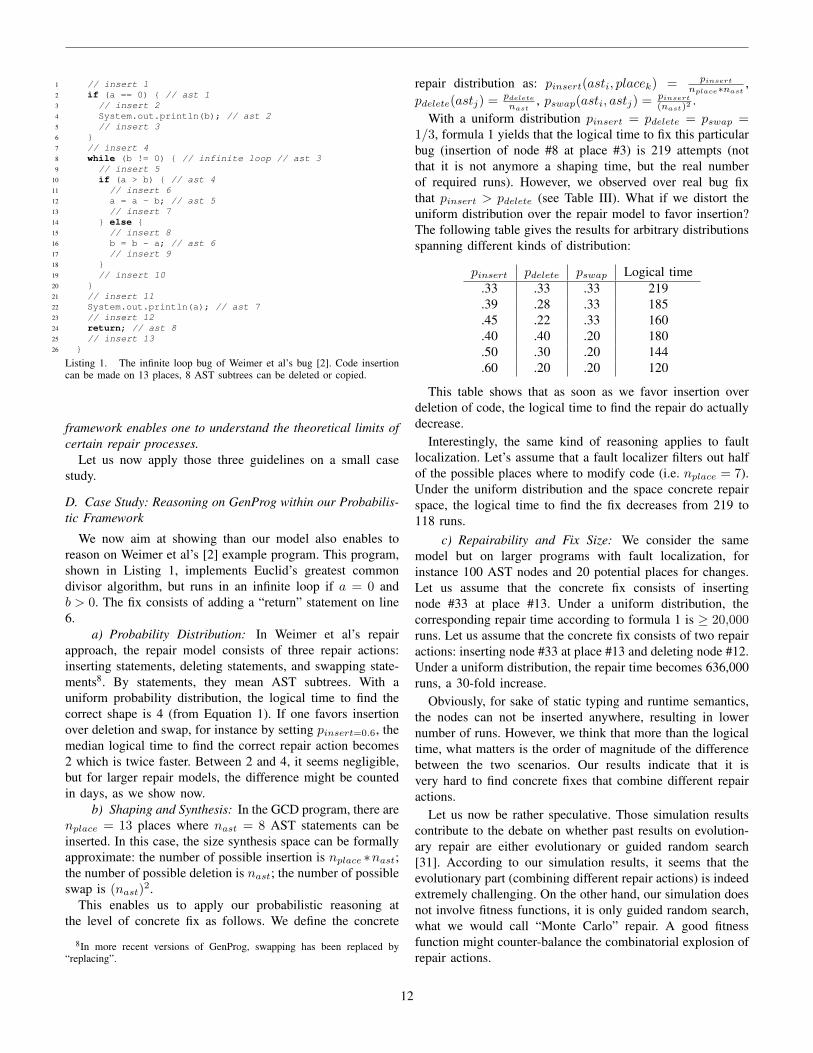
1 // insert 1
2 if (a == 0) // ast 1
3 // insert 2
4 System.out.println(b); // ast 2
5 // insert 3
6
7 // insert 4
8 while (b != 0) // infinite loop // ast 3
9 // insert 5
10 if (a > b) // ast 4
11 // insert 6
12 a = a - b; // ast 5
13 // insert 7
14 else
15 // insert 8
16 b = b - a; // ast 6
17 // insert 9
18
19 // insert 10
20
21 // insert 11
22 System.out.println(a); // ast 7
23 // insert 12
24 return; // ast 8
25 // insert 13
26
Listing 1. The infinite loop bug of Weimer et al’s bug [2]. Code insertioncan be made on 13 places, 8 AST subtrees can be deleted or copied.
framework enables one to understand the theoretical limits of
certain repair processes.
Let us now apply those three guidelines on a small case
study.
D. Case Study: Reasoning on GenProg within our Probabilis-
tic Framework
We now aim at showing than our model also enables to
reason on Weimer et al’s [2] example program. This program,
shown in Listing 1, implements Euclid’s greatest common
divisor algorithm, but runs in an infinite loop if a = 0 and
b > 0. The fix consists of adding a “return” statement on line
6.
a) Probability Distribution: In Weimer et al’s repair
approach, the repair model consists of three repair actions:
inserting statements, deleting statements, and swapping state-
ments8. By statements, they mean AST subtrees. With a
uniform probability distribution, the logical time to find the
correct shape is 4 (from Equation 1). If one favors insertion
over deletion and swap, for instance by setting pinsert=0.6, the
median logical time to find the correct repair action becomes
2 which is twice faster. Between 2 and 4, it seems negligible,
but for larger repair models, the difference might be counted
in days, as we show now.
b) Shaping and Synthesis: In the GCD program, there are
nplace = 13 places where nast = 8 AST statements can be
inserted. In this case, the size synthesis space can be formally
approximate: the number of possible insertion is nplace ∗nast;
the number of possible deletion is nast; the number of possible
swap is (nast)2.
This enables us to apply our probabilistic reasoning at
the level of concrete fix as follows. We define the concrete
8In more recent versions of GenProg, swapping has been replaced by“replacing”.
repair distribution as: pinsert(asti, placek) = pinsert
nplace∗nast,
pdelete(astj) =pdelete
nast, pswap(asti, astj) =
pinsert
(nast)2.
With a uniform distribution pinsert = pdelete = pswap =1/3, formula 1 yields that the logical time to fix this particular
bug (insertion of node #8 at place #3) is 219 attempts (not
that it is not anymore a shaping time, but the real number
of required runs). However, we observed over real bug fix
that pinsert > pdelete (see Table III). What if we distort the
uniform distribution over the repair model to favor insertion?
The following table gives the results for arbitrary distributions
spanning different kinds of distribution:
pinsert pdelete pswap Logical time
.33 .33 .33 219
.39 .28 .33 185
.45 .22 .33 160
.40 .40 .20 180
.50 .30 .20 144
.60 .20 .20 120
This table shows that as soon as we favor insertion over
deletion of code, the logical time to find the repair do actually
decrease.
Interestingly, the same kind of reasoning applies to fault
localization. Let’s assume that a fault localizer filters out half
of the possible places where to modify code (i.e. nplace = 7).
Under the uniform distribution and the space concrete repair
space, the logical time to find the fix decreases from 219 to
118 runs.
c) Repairability and Fix Size: We consider the same
model but on larger programs with fault localization, for
instance 100 AST nodes and 20 potential places for changes.
Let us assume that the concrete fix consists of inserting
node #33 at place #13. Under a uniform distribution, the
corresponding repair time according to formula 1 is ≥ 20,000runs. Let us assume that the concrete fix consists of two repair
actions: inserting node #33 at place #13 and deleting node #12.
Under a uniform distribution, the repair time becomes 636,000
runs, a 30-fold increase.
Obviously, for sake of static typing and runtime semantics,
the nodes can not be inserted anywhere, resulting in lower
number of runs. However, we think that more than the logical
time, what matters is the order of magnitude of the difference
between the two scenarios. Our results indicate that it is
very hard to find concrete fixes that combine different repair
actions.
Let us now be rather speculative. Those simulation results
contribute to the debate on whether past results on evolution-
ary repair are either evolutionary or guided random search
[31]. According to our simulation results, it seems that the
evolutionary part (combining different repair actions) is indeed
extremely challenging. On the other hand, our simulation does
not involve fitness functions, it is only guided random search,
what we would call “Monte Carlo” repair. A good fitness
function might counter-balance the combinatorial explosion of
repair actions.
12
VII. RELATED WORK
d) Empirical Studies of Versioning Transactions: Pu-
rushothaman and Perry [14] studied small commits (in terms
of number of lines of code) of proprietary software at Lucent
Technology. They showed the impact of small commits with
respect to introducing new bugs, and whether they are oriented
toward corrective, perfective or adaptive maintenance. German
[11] asked different research questions on what he calls
“modification requests” (small improvements or bug fix), in
particular with respect to authorship and change coupling
(files that are often changed together). Alali and colleagues
[13] discussed the relations between different size metrics for
commits (# of files, LOC and # of hunks), along the same line
as Hattori and Lanza [12] who also consider the relationship
between commit keywords and engineering activities. Finally,
Hindle et al. [10], [32] focus on large commits, to determine
whether they reflect specific engineering activities such as
license modifications. Compared to these studies on commits
that mostly focus, on metadata (e.g. authorship, commit text)
or size metrics (number of changer files, number of hunks,
etc.), we discuss the content of commits and the kind of source
code change they contain. Fluri et al. [33] and Vaucher et al.
[34] studied the versioning history to find patterns of change,
i.e. groups of similar versioning transactions.
Pan et al. [24] manually identified 27 bug fix patterns on
Java software. Those patterns are precise enough to be auto-
matically extractable from software repositories. They provide
and discuss the frequencies of the occurrence of those patterns
in 7 open source projects. This work is closely related to
ours: we both identify automatically extractable repair actions
of software. The main difference is that our repair actions
are discovered fully automatically based on AST differencing
(there is no prior manual analysis to find them). Furthermore,
since our repair actions are meant to be used in an automated
program repair setup, they are smaller and more atomic.
Kim and et al. [35] use versioning history to mine project-
specific bug fix patterns. Williams and Hollingsworth [36] also
learn some repair knowledge from versioning history. They
mine how to statically recognize where checks on return values
should be inserted. Livshits and Zimmermann [15] mine co-
changed method calls. The difference with those close pieces
of research is that we enlarge the scope of mined knowledge:
from project-specific knowledge [35] to domain-independant
repair actions, and from one single repair action [36], [15] to
41 and 173 repair actions.
e) Abstract Syntax Tree Differencing: The evaluation of
AST differencing tools often gives hints about common change
actions of software. For instance, Raghavan et al. [19] showed
the six most common types of changes for the Apache web
server and the GCC compiler, the number one being “Altering
existing function bodies”. This example clearly shows the
difference with our work: we provide change and repair actions
at a very fine granularity. Similarly, Neamtiu et al. [20] gives
interesting numerical findings about software evolution such
as the evolution of added functions and global variables of C
code. It also remains at granularity that is coarser compared
to our analysis. Fluri et al. [7] gives some frequency numbers
of their change types in order to validate the accuracy and
the runtime performance of their distilling algorithm. Those
numbers were not — and not meant to be — representative of
the overall abundance of change types. Giger et al. [37] discuss
the relations between 7 categories of change types and not the
detailed change actions as we do.
f) Automated Software Repair: We have already men-
tioned many pieces of work on automated software repair (incl.
[1], [2], [3], [4], [5], [38]). We have discussed in details the
relationship of our work with GenProg. Let us now compare
with the other close papers.
Wei et al. [3] presented AutoFix-E, an automated repair
tool which works with contracts. In our perspective, AutoFix-
E is based on two repair actions: adding sequences of state-
changing statements (called “mutators”) and adding a precon-
dition (of the form of an “if” conditional). Their fix schemas
are combinations of those two elementary repair actions. In
contrast, we have 173 basic repair actions and we are able
to predict repair shapes that consist of combinations of 4
repair actions. However, our approach is more theoretical
than theirs. Our probabilistic view on repair may fasten their
repair approach: it is likely that not all “fix schemas” are
equivalent. For instance, according to our experience, adding
a precondition is a very common kind of fix in real bugs.
Debroy et al. [39] invented an approach to repair bugs
using mutations inspired from the field of mutation testing.
The approach uses a fault localization technique to obtain
the candidate faulty locations. For a given location, it applies
mutations, producing mutants of the program. Eventually, a
mutant is classified as “fixed” if it passes the test suite of
the program. Their repair actions are composed of mutations
of arithmetic, relational, logical, and assignment operators.
Compared to our work, mutating a program is a special kind
of fix synthesis where no explicit high-level repair shapes
are manipulated. Also, in the light of our results, we assume
that a mutation-based repair process would be faster using
probabilities on top of the mutation operators.
Kim et al. [40] introduced PAR, an algorithm that generates
program patches using a set of 10 manually written fix
templates. As GenProg, the approach leverages evolutionary
computing techniques to generate program patches. We share
with PAR the idea of extracting repair knowledge from human-
written patches. Beyond this high-level point in common,
there are three important differences. First, they do a manual
extraction of fix patterns (by reading 62,656 patches) while
we automatically mine them from the past commits. Second,
PAR patterns and our repair actions are expressed at a different
granularity. PAR patterns contain a specification of the context
that matches a piece of AST, a specification of analysis (e.g.
to collect compatible expressions in the current scope), and a
specification of change. Our repair actions correspond to this
last part. While their patterns are operational, their change
specifications are ad hoc (due to the process of manually
specifying templates). On the contrary, our specification of
13

repair actions are systematic and automatically extracted, but
our approach is more theoretical and we do not fix concrete
bugs. This shows again that the foundations of their approach
contains more manual work than ours: a PAR pattern is a
manually identified repair schema where all the synthesis rules
are manually encoded. Finally, we think it is possible to marry
our approaches by decorating their templates with probability
distributions (whether mined or not) so as to speed up the
repair.
VIII. CONCLUSION
In this paper, we have presented the idea that one can
mine repair actions from software repositories. In other words,
one can learn from past bug fixes the main repair actions
(e.g. adding a method call). Those repair actions are meant
to be generic enough to be independent of the kinds of bug
and the software domains. We have discussed and applied a
methodology to mine the repair actions of 62,179 versioning
transactions extracted from 14 repositories of 14 open-source
projects. We have largely discussed the rationales and conse-
quences of adding a probability distribution on top of a repair
model. We have shown that certain distributions over repair
actions can result in an infinite time (in average) to find a
repair shape while other fine-tuned distributions enable us to
find a repair shape in hundreds of repair attempts.
The main direction of future work consists of going be-
yond empirical results and theoretical analysis. We are now
exploring how to use this learned knowledge (of the form
of probabilistic repair models) to fix real bugs. In particular,
we are planning to work on using probabilistic models to see
whether one can faster repair the bugs of PAR’s and GenProg’s
datasets. The latter involves having a Java implementation
of GenProg and would advance our knowledge on whether
GenProg’s efficiency is really language-independent (Segfaults
and buffer overruns do not exists in Java).
REFERENCES
[1] W. Weimer, “Patches as better bug reports,” in Proceedings of the
International Conference on Generative Programming and Component
Engineering, 2006.[2] W. Weimer, T. Nguyen, C. L. Goues, and S. Forrest, “Automatically
finding patches using genetic programming,” in Proceedings of the
International Conference on Software Engineering, 2009.[3] Y. Wei, Y. Pei, C. A. Furia, L. S. Silva, S. Buchholz, B. Meyer, and
A. Zeller, “Automated fixing of programs with contracts,” in Proceedings
of the International Symposium on Software Testing and Analysis, AC,2010.
[4] V. Dallmeier, A. Zeller, and B. Meyer, “Generating fixes from objectbehavior anomalies,” in Proceedings of the International Conference on
Automated Software Engineering, 2009.[5] A. Arcuri, “Evolutionary repair of faulty software,” Applied Soft Com-
puting, vol. 11, no. 4, pp. 3494–3514, 2011.[6] D. Gopinath, M. Z. Malik, and S. Khurshid, “Specification-based pro-
gram repair using sat,” in Proceedings of the International Conference
on Tools and Algorithms for the Construction and Analysis of Systems,2011.
[7] B. Fluri, M. Wursch, M. Pinzger, and H. Gall, “Change distilling:Tree differencing for fine-grained source code change extraction,” IEEE
Transactions on Software Engineering, vol. 33, pp. 725 –743, nov. 2007.[8] M. Bóna, A Walk Through Combinatorics: An Introduction to Enumer-
ation and Graph Theory. World Scientific, 2011.[9] M. Martinez and M. Monperrus, “Mining repair actions for guiding
automated program fixing,” tech. rep., INRIA, 2012.
[10] A. Hindle, D. M. German, and R. Holt, “What do large commits tellus?: a taxonomical study of large commits,” in Proceedings of the
International Working Conference on Mining Software Repositories,2008.
[11] D. M. German, “An empirical study of fine-grained software modifica-tions,” Empirical Softw. Engineering, vol. 11, no. 3, pp. 369–393, 2006.
[12] L. Hattori and M. Lanza, “On the nature of commits,” in Proceedings
of 4th International ERCIM Workshop on Software Evolution and
Evolvabillity (EVOL), pp. 63 –71, 2008.[13] A. Alali, H. Kagdi, and J. Maletic, “What’s a typical commit? a
characterization of open source software repositories,” in Proceedings of
the IEEE International Conference on Program Comprehension, 2008.[14] R. Purushothaman and D. Perry, “Toward understanding the rhetoric of
small source code changes,” IEEE Transactions on Software Engineer-
ing, vol. 31, pp. 511 – 526, june 2005.[15] B. Livshits and T. Zimmermann, “Dynamine: finding common error
patterns by mining software revision histories,” in Proceedings of the
European software engineering conference held jointly with Interna-
tional Symposium on Foundations of Software Engineering, 2005.[16] R. Robbes, Of Change and Software. PhD thesis, University of Lugano,
2008.[17] E. Giger, M. Pinzger, H. Gall, T. Xie, and T. Zimmermann, “Comparing
fine-grained source code changes and code churn for bug prediction,”in Working Conference on Mining Software Repositories, 2011.
[18] M. Monperrus and M. Martinez, “Cvs-vintage: A dataset of 14 cvsrepositories of java software,” Tech. Rep. hal-00769121, INRIA, 2012.
[19] S. Raghavan, R. Rohana, D. Leon, A. Podgurski, and V. Augustine,“Dex: a semantic-graph differencing tool for studying changes in largecode bases,” in Proceedings of the 20th IEEE International Conference
on Software Maintenance, 2004.[20] I. Neamtiu, J. S. Foster, and M. Hicks, “Understanding source code
evolution using abstract syntax tree matching,” in Proceedings of the
International Workshop on Mining Software Repositories, 2005.[21] M. Martinez and M. Monperrus, “Appendix of "On Mining Software
Repair Models and their Relations to the Search Space of AutomatedProgram Fixing",” Tech. Rep. hal-00903804, INRIA, 2013.
[22] D. of Mathematics of the University of York, “Statistical tables.” http://www.york.ac.uk/depts/maths/tables/, Last visited: April 9 2013.
[23] A. Murgia, G. Concas, M. Marchesi, and R. Tonelli, “A machine learningapproach for text categorization of fixing-issue commits on CVS,” inProceedings of the International Symposium on Empirical Software
Engineering and Measurement, 2010.[24] K. Pan, S. Kim, and E. J. Whitehead, “Toward an understanding of bug
fix patterns,” Empirical Software Engineering, vol. 14, no. 3, pp. 286–315, 2008.
[25] R. Wu, H. Zhang, S. Kim, and S.-C. Cheung, “Relink: recovering linksbetween bugs and changes,” in Proceedings of the 2011 Foundations of
Software Engineering Conference, pp. 15–25, 2011.[26] C. Bird, A. Bachmann, E. Aune, J. Duffy, A. Bernstein, V. Filkov, and
P. Devanbu, “Fair and balanced?: bias in bug-fix datasets,” in Proceed-
ings of the 7th joint meeting of the European Software Engineering
Conference and the ACM SIGSOFT Symposium on the Foundations of
Software Engineering, ESEC/FSE ’09, pp. 121–130, ACM, 2009.[27] J. Cohen et al., “A coefficient of agreement for nominal scales,”
Educational and psychological measurement, vol. 20, no. 1, pp. 37–46,1960.
[28] J. R. Landis and G. G. Koch, “The measurement of observer agreementfor categorical data.,” Biometrics, vol. 33, no. 1, pp. 159–174, 1977.
[29] F. L. Joseph, “Measuring nominal scale agreement among many raters,”Psychological bulletin, vol. 76, no. 5, pp. 378–382, 1971.
[30] C. L. Goues, W. Weimer, and S. Forrest, “Representations and operatorsfor improving evolutionary software repair,” in Proceedings of GECCO,pp. 959–966, 2012.
[31] A. Arcuri and L. Briand, “A practical guide for using statistical tests toassess randomized algorithms in software engineering,” in Proceedings
of the 33rd International Conference on Software Engineering, pp. 1–10,ACM, 2011.
[32] A. Hindle, D. German, M. Godfrey, and R. Holt, “Automatic classicationof large changes into maintenance categories,” in Proceedings of the
debroInternational Conference on Program Comprehension, 2009.[33] B. Fluri, E. Giger, and H. C. Gall, “Discovering patterns of change
types,” in Proceedings of the International Conference on Automated
Software Engineering, 2008.
14

[34] S. Vaucher, H. Sahraoui, and J. Vaucher, “Discovering new changepatterns in object-oriented systems,” in Proceedings of the Working
Conference on Reverse Engineering, 2008.[35] S. Kim, K. Pan, and E. J. Whitehead, “Memories of bug fixes,” in
Proceedings of the 14th ACM SIGSOFT International Symposium on
Foundations of Software Engineering, 2006.[36] C. C. Williams and J. K. Hollingsworth, “Automatic mining of source
code repositories to improve bug finding techniques,” IEEE Transactions
on Software Engineering, vol. 31, no. 6, pp. 466–480, 2005.[37] E. Giger, M. Pinzger, and H. C. Gall, “Can we predict types of
code changes? an empirical analysis,” in Proceedings of the Working
Conference on Mining Software Repositories, pp. 217–226, 2012.
[38] A. Carzaniga, A. Gorla, N. Perino, and M. Pezzè, “Automaticworkarounds for web applications,” in Proceedings of the 2010 Foun-
dations of Software Engineering Conference, pp. 237–246, ACM, 2010.[39] V. Debroy and W. Wong, “Using mutation to automatically suggest fixes
for faulty programs,” in Proceedings of the International Conference on
Software Testing, Verification and Validation (ICST), pp. 65–74, IEEE,2010.
[40] D. Kim, J. Nam, J. Song, and S. Kim, “Automatic patch generationlearned from human-written patches,” in Proceedings of the 2013
International Conference on Software Engineering, pp. 802–811, IEEEPress, 2013.
15