mining rock mass models: 3-d evaluation of the geotechnical
TRANSCRIPT

Page 1 of 7
Mining Rock Mass Models: 3-D evaluation of the geotechnical environment for optimal project design and planning
by Peter Jenkins, Gary Dempers & Dr Clive Seymour, Dempers & Seymour Pty Ltd Perth Australia
INTRODUCTION At the scale of mining projects, rock masses are inhomogenous and often extremely variable. A large volume of data is usually collected during geotechnical feasibility studies but rarely is the rock mass variability effectively established and viewed spatially in an adequate three dimensional model.
The concept of the Mining Rock Mass Model (MRMM) has been specifically developed to improve the appreciation of rock mass conditions across the mine project area. A MRMM comprises various 3-D models of logged values or calc-ulated rock mass parameters that are analogous to a resource block model in the way that they are viewed and incorporated into the mine feasibility study and planning process. These models facilitate a robust understanding of rock mass conditions and their variation across the project area, as the example in Figure 1 shows.
An initial MRMM can be created using data collected from exploration drill core, providing early indications of the geotechnical environment and justification for decisions that shape project development. Additional data collection from infill drilling, geo-technical drill holes and other sources are used to update and re-evaluate the MRMM as project studies progress. Therefore, these models can add value throughout the project and mine life.
This article outlines the MRMM methodology and illustrates the application of the 3-D models created with examples from both underground and open pit projects.
MRMM METHODOLOGY Establishing a MRMM can be broken down into the following steps:
• Data collection
• Data validation
• MRMM construction
• MRMM interrogation
This process has been detailed previously by Seymour et al (2007), hence only an overview of the
methodology is presented here with more emphasis placed on the potential of the MRMM to add value in project development.
Although primarily consisting of geotechnical drill core logging, other forms of data may be used in the MRMM database. For example, underground geotechnical mapping and structural data can also be incorporated into the database and viewed against the logged data to assist in the modelling and interrogation process.
Domain Logging
Drill hole logging uses the domain logging technique as described by Dempers (1991). Selecting the geotechnical intervals or domains is the first step in the logging process. The domains can be many metres in length or less than a metre and they are determined by major lithological boundaries, which are then further subdivided according to significant changes in geotechnical character-istics such as strength, RQD (Rock Quality Designation), the condition of discontinuities, their frequency and
orientation, etc.
The logging method highlights weak, broken zones, structures and other features that are geotechnically significant. Correlation of these in the modelling process is facilitated by the use of a specific code that is recorded during logging for different types of features, such as faults, shears or intense zones of fracturing, vuggy or deformable ground, discing and other project specific mineral or rock mass alteration types.
Importantly, the logging scheme ensures that sufficient data is collected within each domain (logged interval) to allow a rating deter-mination or ranking for all of the major rock mass classification systems, i.e. Rock Mass Rating (RMR) and its derivatives, Geological Strength Index (GSI) and Rock Tunnelling Quality Index (Q). As such, the codes used for data collection are based on Barton et al (1974) and Laubscher (1990).
Data validation ensures consistency of interpretation between different logging personnel and is vital, as poor data input would lead to an
Figure 1
Figure 1 Plan and section views through the MRMM for a proposed block cave infrastructure below existing mine workings (blue); shows the trace of some of the logged
boreholes used to build the model with calculated Rock Mass Rating (RMR) values
RMR<20 Very Poor
20 - 40 Poor40 - 50 Poor to Fair50 - 60 Fair to Good60 - 80 Good
>80 Very Good

Page 2 of 7
unreliable model output. Core photographs of the logged holes are retained for this purpose and the validation process may also require some check logging.
Model Construction
The logged data, calculated para-meters and rock mass rating values are converted into block models using the resource estimation routines in standard mining software packages with geological modelling capabilities e.g. Datamine, Surpac and Gemcom. Data is loaded into the software application as a drillhole “assay” table and then composited into regular intervals within each logged domain.
Overall model dimensions and block sizes are project specific and dependent on the main geotechnical controls (lithology, structure, etc.). A massive deposit could have a larger block size compared to a thin vein deposit. The composited data is then used to estimate block values using the resource evaluation modules (kriging, inverse distance, etc.) within the software package.
The block model estimation process should be constrained by the likely controls on the rock mass. These constraints are project specific and may include weathering profiles, lithology, foliation, bedding, major structural orientation or other features. This part of the process requires the development of an understanding of the controls on rock mass quality for the project and may involve a number of iterations. Weathering profiles and lithology are usually the primary constraints, as illustrated in the first pass model for an open pit project, Figure 2, before the geotechnical data is introduced.
Model Interrogation
Variable rock mass conditions may be due to major geological structures, large fault zones, areas of closely spaced jointing, geological structures that carry water, weak rock, intense alteration or many other conceivable reasons. The nature of this variability can be identified and visualised in the MRMM and each distinct zone or rock mass domain may be characterised independently using only the composited data for that particular unit.
In Figure 3, the composited borehole data has been interpolated to populate the model using estimation envelopes elongated in the dip and strike direction of the lithology.
Further interrogation of the model often reveals unique features that may require separate additional domains to refine the block estimates, as illustrated in Figure 4. Hence, it is an iterative process that is used to develop the model and at the same time increase the understanding of the rock mass quality and its variation across the project. At each pass of the interrogation process, additional domains were added to the model reflecting both structure and rock units. However, the structure indicated in Figure 4 was flagged for additional data collection to confirm its persistence.
The rock mass domains or units established during model cons-truction are generally larger than the core log intervals, i.e. they may correspond with a logged domain but more often embrace a range of
different logged domains that define the variability within a broadly similar rock mass domain.
A benefit of this technique is that rock testing can then be based on the true rock mass domain variability, rather than just testing according to rock type. Hence, test samples are picked from the domains, major structures and joint sets identified that are relevant to the engineering structure and its scale. After testing has been completed, the domains can be calibrated against test data and observation, then directly exported to two dimensional limit equilibrium and three dimensional numerical models.
The value of the interrogation process has been realised in several studies where the presence of major structures, variable rock units or zones of extremely soft rock caused by alteration have been identified,
Figure 3 Second pass cross section through the model with lithological control from estimation envelopes
Possible structure or
rock unit
Zone of Poor quality
rock
Zone of Poor quality
rock due to a different
lithological unit
RMR0 - 2020 - 4040 - 6060 - 80
80 - 100
Hangingwall Felsic
Footwall Felsic
Talc
Ultramafic (between
the Talc units)
Oxide
Figure 2 Initial lithological model and conceptual pit outline

Page 3 of 7
where previously only one rock type was thought to be present. Figure 5 illustrates the variable make up of a single lithological unit for another pit project where four distinct design rock mass domains were identified within the unit.
Critical Parameters
Understanding the cause of the variation in rock mass quality is very important and the MRMM can be used to evaluate the variable zones. In addition to the classification ratings (RMR, MRMR, GSI, Q etc.), other geotechnical parameters are also modelled and interrogation of these models often helps in understanding the rock mass var-iability. The ranges of the “critical” parameters that are routinely inter-rogated in the modelling process are given in Table 1, these being:
o Joint intensity, calculated from RQD/Jn this represents the structure of the rock mass and gives a measure of block size (McCracken and Stacey, 1989).
o Discontinuity shear strength, as determined from micro roughness and joint infill, representing the frictional characteristics of the joint wall and infill material. (McCracken and Stacey, 1989).
o Fracture frequency (Seymour et al, 2007)
o Rock strength (Seymour et al, 2007)
Models of these parameters are compared with each other and the different rock mass ratings, so that their likely influence on ground conditions and behaviour is appreciated and can be accounted for in project design.
An example of the variation in two of these critical parameters in an underground project setting are given in the circled areas of Figures 6 and 7, which are plan views at a central location through the proposed cave block shown in Figure 1. The rock strength is classified as Very Good (UCS > 160MPa) in Figure 7 but is Poor to Fair (Jr/Ja < 2) in terms of joint shear strength (Figure 8). This information from the MRMM for the project had significance for the likely cavability and fragmentation of the resource.
MRMM APPLICATIONS Mining Rock Mass Models have been created for more than fifty different projects at various stages and for both open pit and under-
ground minesites or where there is interaction of both at a site. The methodology discussed has been refined through this experience and is extremely robust. Sometimes the models are created for specific problem areas at mature sites but undoubtedly they can add greatest value where created early in the project life at the concept or feasibility stage. In this respect they
help to minimise the potential for ‘latent’ or unexpected conditions to arise that can impact project progression or operational viability.
However, the key attribute of the MRMM is its ability to provide detailed information at key locations for project design and planning, whilst being a repository for geotechnical information and the visualisation of this data. Further
Table 1 Classification of critical geotechnical parameters
Parameter Very Poor Poor Fair Good Very Good
Joint Intensity (RQD/Jn) < 4 4 - 8 8 - 15 15 - 25 > 25
Joint shear strength (Jr/Ja) < 0.5 0.5 – 0.75 0.75 - 2 2 - 3 > 3
Fracture Frequency (FF/m) > 15 3 - 15 1 - 3 0.3 - 1 < 0.3
Rock Strength (MPa) < 25 25 - 50 50 - 100 100 - 160 > 160
Figure 5 Variation in rock mass quality within a single lithological unit
Additional design units
added to account for poor
quality “stripes” within the
hangingwall unit
Figure 4 Final estimate with additional rock mass domains, lithologies, weathering profiles and major structure oriented to the dip of these features
Additional domains
RMR
0 - 20
20 - 40
40 - 60
60 - 80
80 - 100
Figure 4 Final estimate with additional rock mass domains, lithologies, weathering profiles and major structure oriented to the dip of these features
Additional domains
Structure?

Page 4 of 7
discussion and examples of MRMM applications follow.
Open Pit Assessment
Conceptual open pit slopes and infrastructure such as haul ramps can be planned with some justification during the early design stages by interrogating the MRMM; and before rigorous analyses are performed. The preliminary pit slope angles, derived from MRMR after Laubscher (1990), as well as other parameters can be visualised in three-dimensions so that the position and design of initial pit slopes take cognisance of poor quality zones within the rock mass.
It must be remembered that proposed slopes assessed in this manner must still be rigorously analysed. Although zones of poor quality rock are significant, structure is generally more important in controlling the behaviour of a rock mass and is usually responsible or contributes to the majority of pit wall failures. The location and nature of
structure in terms of persistence, dip, surface conditions and integrity strongly influence pit slope stability and hence design configurations.
Identifying structural features early in stages of a project can be very beneficial in that design consider-ations can be made that account for structure. It is often evident in the exploration phase of a project that the presence of geological structures which may impact pit design are not well recorded (if at all), because the focus of data collection has been targeted towards the ore body and not the surrounding rock mass or pit walls.
The MRMM can be used to identify potential structures very early on so that they can be targeted for further investigation. The modelling of discrete major structures is helped by the specific feature codes used as well as the fracture characteristics recorded in the geotechnical domain logging. The MRMM database is then interrogated to evaluate major structures, by applying search
criteria for specific characteristics or combinations of these, to identify significant geotechnical structures. Figure 8 illustrates this search and interpretation process. The char-acteristics that met the search criteria in this example were intensely fractured core lengths greater than 1m with highly polished fracture surfaces. These were features associated with existing known structures at this prefeasibility stage project and they were used to interpolate and extrapolate other similar structures and their orientations. The interpretation in this case was carried out in tandem with stereographic analysis of structural measurements taken from traditional core structure orientation methods or, where the rock was too heavily fractured to orientate the core, from downhole televiewer surveys.
Data from the MRMM can be exported to limit equilibrium and numerical models for rigorous or deterministic slope stability analysis purposes, when these are undertaken.
Rock Bridge
Failure through the intact rock bridges between structures has been recognised as a contributing mech-anism in many slope failures. Slope
Hangingwall
rock mass
Strength MPa<25
25 - 5050 - 100100 - 160
> 160
Figure 6 MRMM showing rock strength, plan view through a proposed block cave ore body
Poor to Fair joint shear
strength (Jr/Ja < 2)
Jr/Ja0 - 0.5
0.5 - 0.750.75 - 2
2 - 33 - 4
Figure 7 MRMM showing joint shear strength
High strength zone
in resource
Interpolated structure 1
Interpolated structure 2
Features associated with
known structure
Figure 8 Isometric view showing interpolated structures from a search for specific fracture characteristics
Page 5 of 7
stability analysis methods tend to use different criteria for failure along structure (e.g. Mohr-Coulomb) or through intact rock (e.g. Hoek-Brown) and and their respective strengths are usually arbitrarily adjusted, either up or down, to allow for rock bridge or structure. However, a new approach has been developed that uses fracture frequency to determine the ratio of structure to rock bridge expressed as a percentage of rock bridge. This allows a specific model for rock bridge (rather than a generalised approximation) to be interpreted from the MRMM.
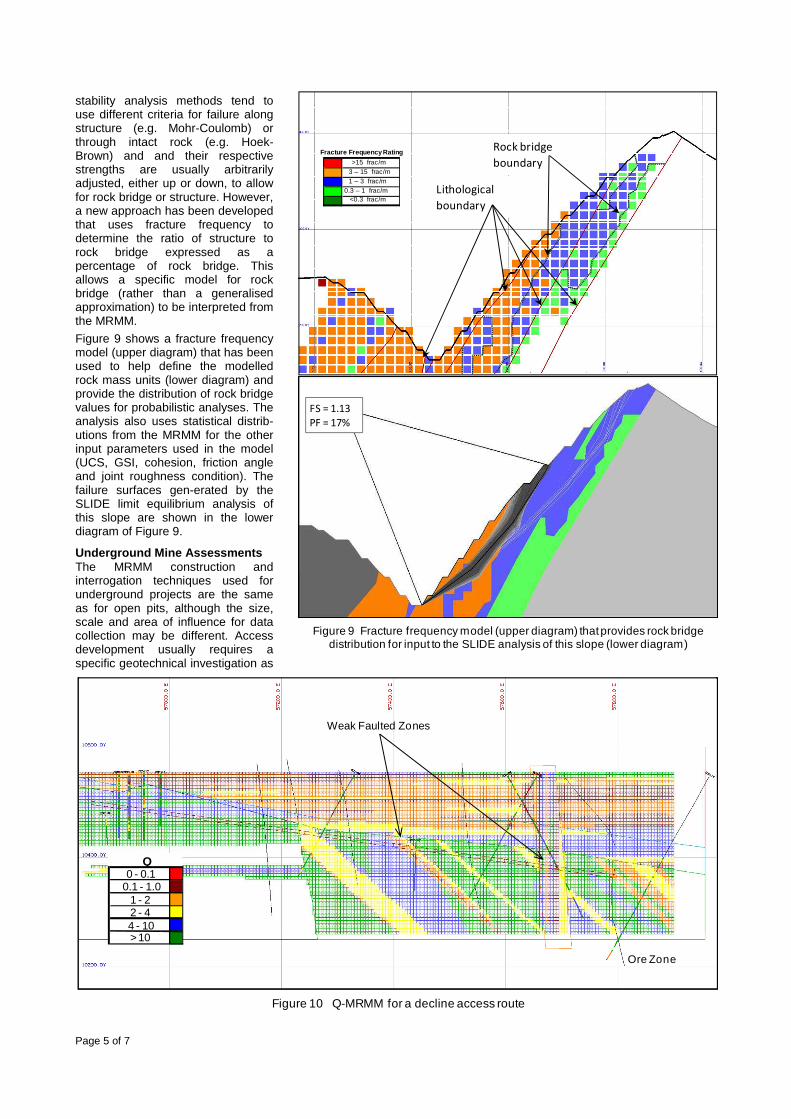
Figure 9 shows a fracture frequency model (upper diagram) that has been used to help define the modelled rock mass units (lower diagram) and provide the distribution of rock bridge values for probabilistic analyses. The analysis also uses statistical distrib-utions from the MRMM for the other input parameters used in the model (UCS, GSI, cohesion, friction angle and joint roughness condition). The failure surfaces gen-erated by the SLIDE limit equilibrium analysis of this slope are shown in the lower diagram of Figure 9.
Underground Mine Assessments The MRMM construction and interrogation techniques used for underground projects are the same as for open pits, although the size, scale and area of influence for data collection may be different. Access development usually requires a specific geotechnical investigation as
Fracture Frequency Rating
>15 frac/m3 – 15 frac/m1 – 3 frac/m
0.3 – 1 frac/m<0.3 frac/m
Lithological
boundary
Rock bridge
boundary
FS = 1.13
PF = 17%
Figure 9 Fracture frequency model (upper diagram) that provides rock bridge distribution for input to the SLIDE analysis of this slope (lower diagram)
Q0 - 0.1
0.1 - 1.01 - 22 - 44 - 10> 10
Section looking North
Q0 - 0.1
0.1 - 1.01 - 22 - 44 - 10> 10
Weak Faulted Zones
Ore Zone
Figure 10 Q-MRMM for a decline access route
Page 6 of 7
it is generally outside the area of interest for resource definition.
Figure 10 shows a series of geotechnical boreholes along the line of a proposed decline to access a narrow vein orebody beneath a deep weathering profile. In this case a long section MRMM was created through these boreholes to provide a detailed synthesis of the expected develop-ment conditions, the nature and extent of weak faulted zones and support requirements.
Long section MRMMs are also created to characterise geotechnical data for the selection of underground stoping methods, stope sizing and support design. These models are typically created for the ore zone and immediate hangingwall and footwall. After constructing the MRMM for the project, the data within the ore zone and in the zones 10m either of this are then modelled as separate entities to create domain models for each.
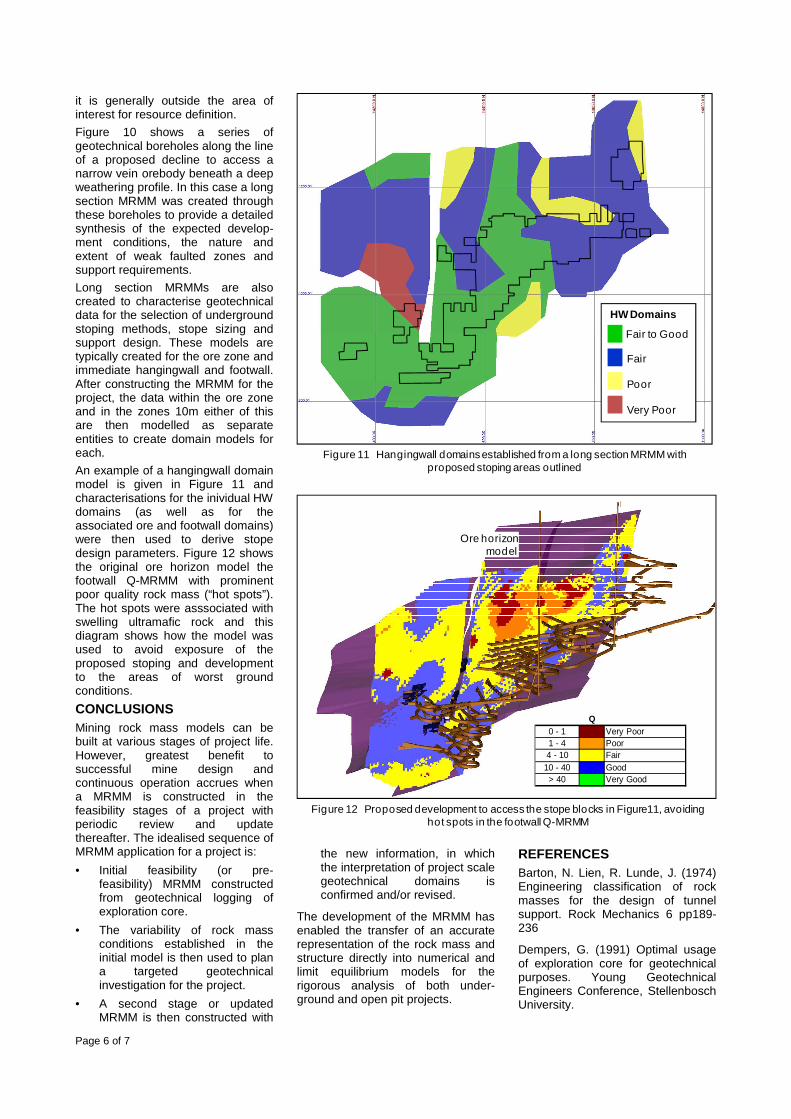
An example of a hangingwall domain model is given in Figure 11 and characterisations for the inividual HW domains (as well as for the associated ore and footwall domains) were then used to derive stope design parameters. Figure 12 shows the original ore horizon model the footwall Q-MRMM with prominent poor quality rock mass (“hot spots”). The hot spots were asssociated with swelling ultramafic rock and this diagram shows how the model was used to avoid exposure of the proposed stoping and development to the areas of worst ground conditions.
CONCLUSIONS Mining rock mass models can be built at various stages of project life. However, greatest benefit to successful mine design and continuous operation accrues when a MRMM is constructed in the feasibility stages of a project with periodic review and update thereafter. The idealised sequence of MRMM application for a project is:
• Initial feasibility (or pre-feasibility) MRMM constructed from geotechnical logging of exploration core.
• The variability of rock mass conditions established in the initial model is then used to plan a targeted geotechnical investigation for the project.
• A second stage or updated MRMM is then constructed with
the new information, in which the interpretation of project scale geotechnical domains is confirmed and/or revised.
The development of the MRMM has enabled the transfer of an accurate representation of the rock mass and structure directly into numerical and limit equilibrium models for the rigorous analysis of both under-ground and open pit projects.
REFERENCES Barton, N. Lien, R. Lunde, J. (1974) Engineering classification of rock masses for the design of tunnel support. Rock Mechanics 6 pp189-236
Dempers, G. (1991) Optimal usage of exploration core for geotechnical purposes. Young Geotechnical Engineers Conference, Stellenbosch University.
HW Domains
Fair to Good
Fair
Poor
Very Poor
Figure 12 Proposed development to access the stope blocks in Figure11, avoiding hot spots in the footwall Q-MRMM
Figure 11 Hangingwall domains established from a long section MRMM with proposed stoping areas outlined
Q0 - 1 Very Poor1 - 4 Poor4 - 10 Fair
10 - 40 Good> 40 Very Good
Ore horizon model

Page 7 of 7
Laubscher, D.H. (1990) A geo-mechanics classification system for the rating of rock mass in mine design. Journal of the South African Institute of Mining and Metallurgy. Vol 90, No 10, pp 257-273 October.
McCracken, A. Stacey, TR. (1989) Geotechnical risk assessment for large diameter raise bored shafts, Trans IMM, Section A, v 98, pp A145-A150.
Seymour, C.R.W., Dempers, G. and Jenkins, P.A. (2007) Mining Rock Mass Models – A Methodology for Collecting, Processing and Pre-senting Geotechnical Data in Three Dimensions. Proc. Int. Symp. on Rock Slope Stability in Open Pit Mining and Civil Engineering, 12-14 Sept., Perth.