mining claim activity on federal land in the united states
TRANSCRIPT

Mining Claim Activity on Federal Land in the United States
By J. Douglas Causey
2007
Data Series 290
U.S. Department of the Interior
U.S. Geological Survey

U.S. Department of the Interior DIRK KEMPTHORNE, Secretary
U.S. Geological Survey Mark D. Myers, Acting Director
U.S. Geological Survey, Reston, Virginia 2007
For product and ordering information: World Wide Web: http://www.usgs.gov/pubprod Telephone: 1-888-ASK-USGS
For more information on the USGS—the Federal source for science about the Earth, its natural and living resources, natural hazards, and the environment: World Wide Web: http://www.usgs.gov Telephone: 1-888-ASK-USGS
Suggested Citation: Causey, J.D., 2007, Mining claim activity on Federal land in the United States: U.S. Geological Survey Data Series Report DS-290,
Any use of trade, product, or firm names is for descriptive purposes only and does not imply endorsement by the U.S. Government. The names of companies and products herein are trademarks or registered trademarks of their respective trademark owners.
Although this report is in the public domain, permission must be secured from the individual copyright owners to reproduce any copyrighted material contained within this report.
ii
iii
Contents Abstract............................................................................................................................................................... 1 Introduction ........................................................................................................................................................ 1 Acknowledgments ............................................................................................................................................ 4 Overview of Data Files...................................................................................................................................... 4 Data Sources and Processing ...................................................................................................................... 10
Data Sources................................................................................................................................................ 10 Mining Claim Data ................................................................................................................................... 10 Spatial Data .............................................................................................................................................. 12
Processing Procedures.................................................................................................................................. 12 Mining Claim Data ....................................................................................................................................... 12 Public Land Surveys.................................................................................................................................... 12
User procedures.............................................................................................................................................. 14 Data Discussion............................................................................................................................................... 16 Obtaining Digital Data..................................................................................................................................... 21 References Cited............................................................................................................................................. 21 Appendix A – Table Design SQL (Structured Query Language) ............................................................. 23 Appendix B – Access 2000 Table Design.................................................................................................... 25 Figures Figure 1. Public Land Survey sections (shown in green) that contained an active claim in 2005......3 Figure 2. Public Land Survey sections (shown in green) in Alaska in which a mining claim was recorded with U.S. Bureau of Land Management. .....................................................................................4 Figure 3. Relationships between mining claim statistical tables (XX_claim, XX_lode, XX_placr, and XX_total) and Public Land Survey polygon attribute tables (xx_pls_YY). .............................................15 Tables Table 1: List of digital files provided in this data release. ..........................................................................5 Table 2. Number of mining claim records, by state, on January 15, 2004 (Causey, 2005), May 25, 2005 (Causey and Frank, 2006), and May 4, 2006. ......................................................................................11 Table 3. Comparison of claim records in LR2000 database CASE_TBL table on January 15, 2004, May 25, 2005, and May 4, 2006 that do not have a MTRS value in the CASE_LAND table. ...............12 Table 4. Discrepancies in claim locations between U.S Bureau of Land Management claim records and Public Land Survey spatial databases. ................................................................................13 Table 5. Comparison of the number of new claims, by state, between 2004 and 2005.......................18 Table 6. Number of Public Land Survey sections containing claims in each state and number of sections with active claims in 2005..............................................................................................................19 Table 7. Maximum area that could potentially be covered by lode mining claims in 2005................20 Table B-1. CASE_TBL table structure..........................................................................................................25 Table B-2. CASE_LAND table structure ......................................................................................................27

Mining Claim Activity on Federal Land in the United States
By J. Douglas Causey
Abstract Several statistical compilations of mining claim activity on Federal land derived from the
Bureau of Land Management’s LR2000 database have previously been published by the U.S Geological Survey (USGS). The work in the 1990s did not include Arkansas or Florida. None of the previous reports included Alaska because it is stored in a separate database (Alaska Land Information System) and is in a different format. This report includes data for all states for which there are Federal mining claim records, beginning in 1976 and continuing to the present. The intent is to update the spatial and statistical data associated with this report on an annual basis, beginning with 2005 data. The statistics compiled from the databases are counts of the number of active mining claims in a section of land each year from 1976 to the present for all states within the United States. Claim statistics are subset by lode and placer types, as well as a dataset summarizing all claims including mill site and tunnel site claims. One table presents data by case type, case status, and number of claims in a section. This report includes a spatial database for each state in which mining claims were recorded, except North Dakota, which only has had two claims. A field is present that allows the statistical data to be joined to the spatial databases so that spatial displays and analysis can be done by using appropriate geographic information system (GIS) software. The data show how mining claim activity has changed in intensity, space, and time. Variations can be examined on a state, as well as a national level. The data are tied to a section of land, approximately 640 acres, which allows it to be used at regional, as well as local scale. The data only pertain to Federal land and mineral estate that was open to mining claim location at the time the claims were staked.
Introduction Federal land management agencies need to predict trends in activity on land they manage
in order to design mechanisms to minimize conflicts created by competing uses. By examining where mining claims have been located and changes brought about by technical, economic, and political factors, it is possible to construct predictive models for areas of future activity. This set of data provides the user with a view of the spatial and temporal variations, and the intensity of mining claim activity on public land since national recordation was required in 1976. In conjunction with other data, these trends can be used to create predictive models of future mineral activity.
Mining claim activity on Federal land has been recorded with the U.S. Bureau of Land Management (BLM) since it was required by the Federal Land Policy and Management Act of
1

1976 (Public Law 94-579), Sec. 314. Within the United States, mining claims have been recorded in 17 states: Alaska, Arkansas, Arizona, California, Colorado, Florida, Idaho, Montana, Nebraska, New Mexico, Nevada, North Dakota, Oregon, South Dakota, Utah, Washington, and Wyoming.
Previous statistical compilations of mining claim activity by Campbell and Hyndman (1996) and Hyndman and Campbell (1999a, 1999b, 1999c, 1999d, 1999e, 1999f, 1999g, 1999h, 1999i, 1999j, 1999k, 1999l) provided a density statistic (Campbell, 1996) for the western United States. Causey (2005) provided a statistical analysis of the data for the continental United States, except Alaska and North Dakota. Causey and Frank (2006) recompiled BLM mining claim data through 2004. This report updates Causey (2005) and Causey and Frank (2006) by adding mining claim statistics from Alaska. A complete new extraction of data from the BLM’s LR2000 (http://www.blm.gov/lr2000/, last accessed Nov. 8, 2006) database was used to generate most of these statistics. Alaska data are stored in the BLM’s Alaska Land Information System (ALIS) database by using a different database design for information than the LR2000 database and, as such, is not directly comparable.
The statistical data in Causey (2005), Causey and Frank (2006), and this report are not the same as that done by Campbell and Hyndman in their publications. The main modification used by Causey (2005) was to attach a value (claim count) to each PLSS (Public Land Survey System) section in which a claim occurred. The previous work of Hyndman and Campbell assigned a claim entirely to one section, even when it was listed as being in two or more sections. Hyndman and Campbell also provided counts for mill site and tunnel site claims. Yearly mill site and tunnel site statistics are not provided in this study.
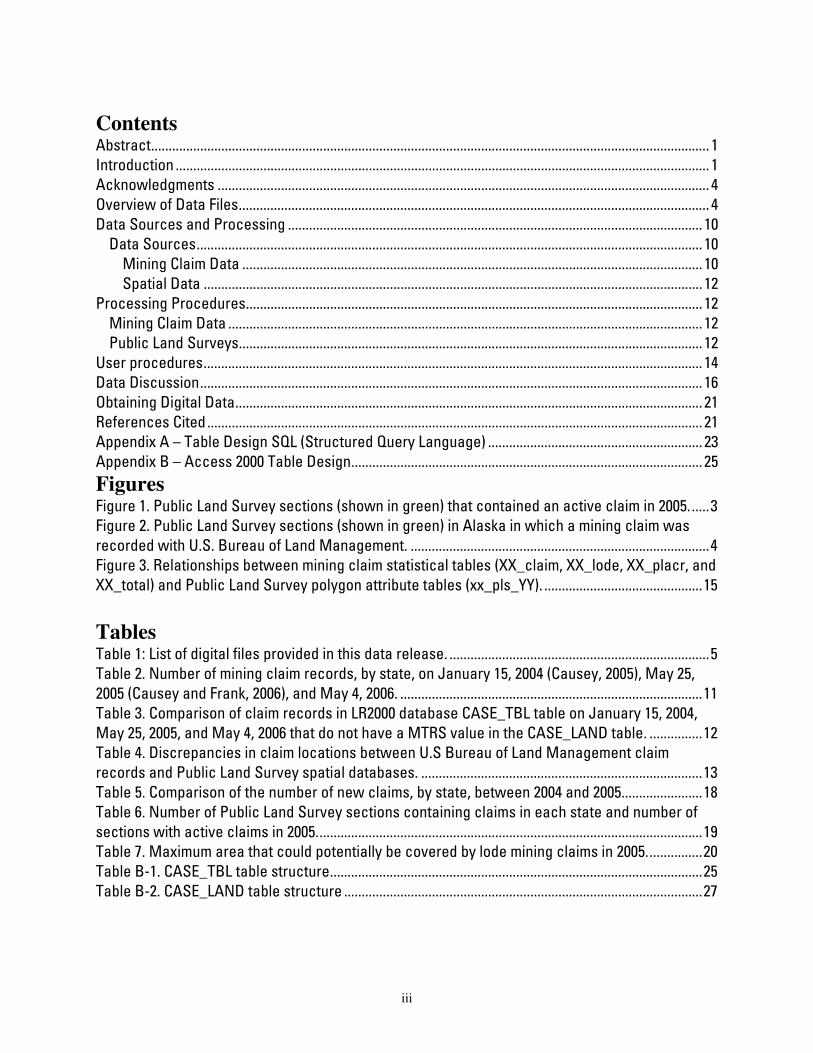
There were 19 fewer claim records in 2005 that did not have a PLSS record in the conterminous U.S. data than were reported in Causey and Frank (2006). Minor improvements were made in some of the PLSS spatial databases to improve joining statistical data to the spatial data in the files provided with this report. New PLSS spatial datasets covering Alaska, Arkansas, South Dakota, and Utah were obtained in 2006 and are used in this report. No spatial database is provided for North Dakota as there have been only two claims (placer) filed in that state, both of which were active for only one year. Figure 1 shows the PLSS sections in which at least part of a mining claim was listed as being active by BLM in 2005 for all other states in the conterminous United States. (Note that the areas containing active claims are too small in Arkansas and Florida to show at the scale of figure 1.)
2

Figure 1. Public Land Survey sections (shown in green) that contained an active claim in 2005.
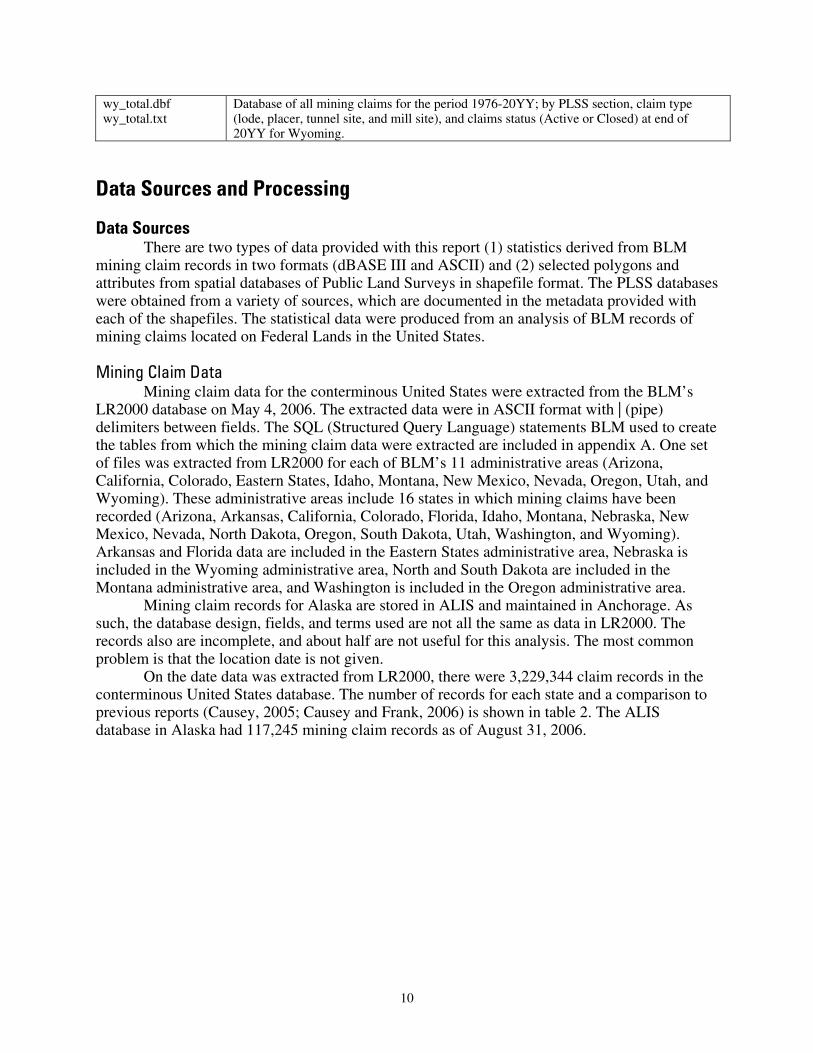
Alaska mining claim records are in poorer shape than those for the rest of the country and, therefore, the data should not be used for more than the most cursory examination of location. Figure 2 only shows sections in Alaska where claims have been recorded by BLM. It is not possible to determine the status of all the claims in 2005 from information provided by BLM.
3

Figure 2. Public Land Survey sections (shown in green) in Alaska in which a mining claim was recorded with the U.S. Bureau of Land Management.
Acknowledgments I would like to thank Alex Rodriguez, State of South Dakota, for supplying a PLSS
database of South Dakota. Carolyn Abeyta, Cheryl Laudenbach, and Leslie Cone, BLM, Denver, provided the LR2000 data and information on the database. Sonda Juliussen, BLM, Alaska, provided BLM mining claim information for Alaska. I also thank Dave Frank and Anna Wilson for their technical review of the report and Lorre Moyer for metadata review.
Overview of Data Files The data for mining claim activity are organized by state and provided in several files
that are listed and briefly described in table 1. The dBASE (.dbf) and ASCII (.txt) files provide two versions of the same statistical-summary data in a proprietary and non-proprietary format, respectively.
The statistical-summary data files for each state include: • number of all claims (sum of lode, placer, tunnel site, and mill site) in each PLSS section, by
year (for example, az_claim.dbf and az_claim.txt), • number of lode claims in each PLSS section, by year (for example, az_lode.dbf and
az_lode.txt),
4

• number of placer claims in each PLSS section, by year (for example, az_placr.dbf and az_placr.txt), and
• total number of claims in each PLSS section by status (active or closed) at the end of the most current year and type of claim (lode, placer, mill site, tunnel site; for example, az_total.dbf and az_total.txt).
While the data was processed using Microsoft’s Access database program, neither the original data nor the Access databases used for this analysis are supplied with this report. There are two practical reasons not to include the source data. First, the data is time stamped. It is a snapshot of the BLM databases, which is only valid for the date the data was extracted. Another extraction of data will produce different statistics. Second, the database is massive. The files provided by BLM exceeded 750 MB (megabytes), compressed. The Access databases created from this data total 4.5 gigabytes (GB) in size; the largest, Nevada, being more than 1.3 GB.
State spatial databases provide PLSS-section polygons to which a user can attach data from the summary tables. The spatial databases are in shapefile (.shp) format. Federal Geographic Data Committee (FGDC; http://fgdc.gov, last accessed Nov. 8, 2006) compliant metadata provides information about the spatial databases and includes information about data sources, data quality, projection, and how to obtain the data on the World Wide Web, in addition to providing a data dictionary (metadata) for the information in the database tables. All the spatial databases contain metadata that can be read in ESRI’s (http://www.esri.com, last accessed Nov. 8, 2006) ArcCatalog module (ArcGIS, ver. 9.x).
Table 1. List of digital files provided in this data release. File Name File Description
Spatial Databases Shapefile filenames are listed as they are displayed and viewed in ArcCatalog (for example, az_pls_YY.shp, where YY stands for the last two digits in the twenty-first century year). ESRI shapefiles consist of a collection of files with the extensions dbf, prj, sbn, shp, shp.xml, and shx. ArcCatalog only displays the shp extension (and hides all the others) in a directory listing, whereas the operating-system directory listings will show the complete collection of files. AK_pls_YY.shp Public Land Survey System sections in which mining claims have been recorded with BLM
in Alaska (ESRI shapefile format) AZ_pls_YY.shp Public Land Survey System sections in which mining claims have been recorded with BLM
in Arizona (ESRI shapefile format) AR_pls_YY.shp Public Land Survey System sections in which mining claims have been recorded with BLM
in Arkansas (ESRI shapefile format) CA_pls_YY.shp Public Land Survey System sections in which mining claims have been recorded with BLM
in California (ESRI shapefile format) CO_pls_YY.shp Public Land Survey System sections in which mining claims have been recorded with BLM
in Colorado (ESRI shapefile format) FL_pls_YY.shp Public Land Survey System sections in which mining claims have been recorded with BLM
in Florida (ESRI shapefile format) ID_pls_YY.shp Public Land Survey System sections in which mining claims have been recorded with BLM
in Idaho (ESRI shapefile format) MT_pls_YY.shp Public Land Survey System sections in which mining claims have been recorded with BLM
in Montana (ESRI shapefile format) NE_pls_YY.shp Public Land Survey System sections in which mining claims have been recorded with BLM
in Nebraska (ESRI shapefile format) NM_pls_YY.shp Public Land Survey System sections in which mining claims have been recorded with BLM
in New Mexico (ESRI shapefile format) NV_pls_YY.shp Public Land Survey System sections in which mining claims have been recorded with BLM
in Nevada (ESRI shapefile format)
5

OR_pls_YY.shp Public Land Survey System sections in which mining claims have been recorded with BLM in Oregon (ESRI shapefile format)
SD_pls_YY.shp Public Land Survey System sections in which mining claims have been recorded with BLM in South Dakota (ESRI shapefile format)
UT_pls_YY.shp Public Land Survey System sections in which mining claims have been recorded with BLM in Utah (ESRI shapefile format)
WA_pls_YY.shp Public Land Survey System sections in which mining claims have been recorded with BLM in Washington (ESRI shapefile format)
WY_pls_YY.shp Public Land Survey System sections in which mining claims have been recorded with BLM in Wyoming (ESRI shapefile format)
Metadata State-specific metadata files are provided in XML format (file with .shp.xml filename extension in Spatial directories). Images are provided in PDF (Portable Document Format) format. Metadata.txt General description of information in the spatial mining claim databases (shapefiles) in an
FGDC compliant, parseable ASCII text format. (Information specific to each state’s spatial data base is provided in separate metadata files for each state.)
AK_pls_YY.shp.xml Description of information specific to the Alaska spatial database (ak_pls_YY.shp). AK_claims.pdf Graphic image, created in ArcGIS, showing sections in Alaska where claims have been
active from 1976 through 20YY. AZ_pls_YY.shp.xml Description of information specific to the Arizona spatial database (az_pls_YY.shp). AZ_claims.pdf Graphic image, created in ArcGIS, showing sections in Arizona where claims have been
active from 1976 through 20YY. AR_pls_YY.shp.xml Description of information specific to the Arkansas spatial database (ar_pls_YY.shp). AR_claims.pdf Graphic image, created in ArcGIS, showing sections in Arkansas where claims have been
active from 1976 through 20YY. CA_pls_YY.shp.xml Description of information specific to the California spatial database (ca_pls_YY.shp). CA_claims.pdf Graphic image, created in ArcGIS, showing sections in California where claims have been
active from 1976 through 20YY. CO_pls_YY.shp.xml Description of information specific to the Colorado spatial database (az_pls_YY.shp). CO_claims.pdf Graphic image, created in ArcGIS, showing sections in Colorado where claims have been
active from 1976 through 20YY. FL_pls_YY.shp.xml Description of information specific to the Florida spatial database (fl_pls_YY.shp). FL_claims.pdf Graphic image, created in ArcGIS, showing sections in Florida where claims have been
active from 1976 through 20YY. ID_pls_YY.shp.xml Description of information specific to the Idaho spatial database (id_pls_YY.shp). ID_claims.pdf Graphic image, created in ArcGIS, showing sections in Idaho where claims have been
active from 1976 through 20YY. MT_pls_YY.shp.xml Description of information specific to the Montana spatial database (mt_pls_YY.shp). MT_claims.pdf Graphic image, created in ArcGIS, showing sections in Montana where claims have been
active from 1976 through 20YY. NE_pls_YY.shp.xml Description of information specific to the Nebraska spatial database (ne_pls_YY.shp). NE_claims.pdf Graphic image, created in ArcGIS, showing sections in Nebraska where claims have been
active from 1976 through 20YY. NM_pls_YY.shp.xml Description of information specific to the New Mexico spatial database (nm_pls_YY.shp). NM_claims.pdf Graphic image, created in ArcGIS, showing sections in New Mexico where claims have
been active from 1976 through 20YY. NV_pls_YY.shp.xml Description of information specific to the Nevada spatial database (nv_pls_YY.shp). NV_claims.pdf Graphic image, created in ArcGIS, showing sections in Nevada where claims have been
active from 1976 through 20YY. OR_pls_YY.shp.xml Description of information specific to the Oregon spatial database (or_pls_YY.shp). OR_claims.pdf Graphic image, created in ArcGIS, showing sections in Oregon where claims have been
active from 1976 through 20YY. SD_pls_YY.shp.xml Description of information specific to the South Dakota spatial database (sd_pls_YY.shp). SD_claims.pdf Graphic image, created in ArcGIS, showing sections in South Dakota where claims have
been active from 1976 through 20YY. UT_pls_YY.shp.xml Description of information specific to the Utah spatial database (ut_pls_YY.shp).
6

UT_claims.pdf Graphic image, created in ArcGIS, showing sections in Utah where claims have been active from 1976 through 20YY.
WA_pls_YY.shp.xml Description of information specific to the Washington spatial database (wa_pls_YY.shp). WA_claims.pdf Graphic image, created in ArcGIS, showing sections in Washington where claims have
been active from 1976 through 20YY. WY_pls_YY.shp.xml Description of information specific to the Wyoming spatial database (wy_pls_YY.shp). WY_claims.pdf Graphic image, created in ArcGIS, showing sections in Wyoming where claims have been
active from 1976 through 20YY. Non-Spatial Data Files
Each database is provided in two different file formats: dBASE III format (.dbf file name extension) and ASCII text format (.txt file name extension). ak_claim.dbf ak_claim.txt
Database of mining claim intensity: total for all claim types (lode, placer, tunnel site, and mill site), by PLSS section and year for Alaska, 1976-20YY. (Note: source dataset is incomplete.)
ak_lode.dbf ak_lode.txt
Database of mining claim intensity totaled for lode claims, by PLSS section and year for Alaska, 1976-20YY. (Note: source dataset is incomplete.)
ak_placr.dbf ak_placr.txt
Database of mining claim intensity totaled for placer claims, by PLSS section and year for Alaska, 1976-20YY. (Note: source dataset is incomplete.)
ak_total.dbf ak_total.txt
Database of all mining claims for the period 1976-20YY; by PLSS section, claim type (lode, lode-np, placer, placer-np, mill site, tunnel site), and claims status (Active or Closed) at end of 20YY for Alaska. (Note: source dataset is incomplete.)
az_claim.dbf az_claim.txt
Database of mining claim intensity: total for all claim types (lode, placer, tunnel site, and mill site), by PLSS section and year for Arizona, 1976-20YY.
az_lode.dbf az_lode.txt
Database of mining claim intensity totaled for lode claims, by PLSS section and year for Arizona, 1976-20YY.
az_placr.dbf az_placr.txt
Database of mining claim intensity totaled for placer claims, by PLSS section and year for Arizona, 1976-20YY.
az_total.dbf az_total.txt
Database of all mining claims for the period 1976-20YY; by PLSS section, claim type (lode, placer, mill site, tunnel site), and claims status (Active or Closed) at end of 20YY for Arizona.
ar_claim.dbf ar_claim.txt
Database of mining claim intensity: total for all claim types (lode, placer, tunnel site, and mill site), by PLSS section and year for Arkansas, 1976-20YY.
ar_lode.dbf ar_lode.txt
Database of mining claim intensity totaled for lode claims, by PLSS section and year for Arkansas, 1976-20YY.
ar_placr.dbf ar_placr.txt
Database of mining claim intensity totaled for placer claims, by PLSS section and year for Arkansas, 1976-20YY.
ar_total.dbf ar_total.txt
Database of all mining claims for the period 1976-20YY; by PLSS section, claim type (lode, placer, mill site, tunnel site), and claims status (Active or Closed) at end of 20YY for Arkansas.
ca_claim.dbf ca_claim.txt
Database of mining claim intensity: total for all claim types (lode, placer, tunnel site, and mill site), by PLSS section and year for California, 1976-20YY.
ca_lode.dbf ca_lode.txt
Database of mining claim intensity totaled for lode claims, by PLSS section and year for California, 1976-20YY.
ca_placr.dbf ca_placr.txt
Database of mining claim intensity totaled for placer claims, by PLSS section and year for California, 1976-20YY.
ca_total.dbf ca_total.txt
Database of all mining claims for the period 1976-20YY; by PLSS section, claim type (lode, placer, tunnel site, and mill site), and claims status (Active or Closed) at end of 20YY for California.
co_claim.dbf co_claim.txt
Database of mining claim intensity: total for all claim types (lode, placer, tunnel site, and mill site), by PLSS section and year for Colorado, 1976-20YY.
co_lode.dbf co_lode.txt
Database of mining claim intensity totaled for lode claims, by PLSS section and year for Colorado, 1976-20YY.
7

co_placr.dbf co_placr.txt
Database of mining claim intensity totaled for placer claims, by PLSS section and year for Colorado, 1976-20YY.
co_total.dbf co_total.txt
Database of all mining claims for the period 1976-20YY; by PLSS section, claim type (lode, placer, tunnel site, and mill site), and claims status (Active or Closed) at end of 20YY for Colorado.
fl_claim.dbf fl_claim.txt
Database of mining claim intensity: total for all claim types (lode, placer, tunnel site, and mill site), by PLSS section and year for Florida, 1976-20YY.
fl_lode.dbf fl_lode.txt
Database of mining claim intensity totaled for lode claims, by PLSS section and year for Florida, 1976-20YY.
fl_placr.dbf fl_placr.txt
Database of mining claim intensity totaled for placer claims, by PLSS section and year for Florida, 1976-20YY.
fl_total.dbf fl_total.txt
Database of all mining claims for the period 1976-20YY; by PLSS section, claim type (lode, placer, tunnel site, and mill site), and claims status (Active or Closed) at end of 20YY for Florida.
id_claim.dbf id_claim.txt
Database of mining claim intensity: total for all claim types (lode, placer, tunnel site, and mill site), by PLSS section and year for Idaho, 1976-20YY.
id_lode.dbf id_lode.txt
Database of mining claim intensity totaled for lode claims, by PLSS section and year for Idaho, 1976-20YY.
id_placr.dbf id_placr.txt
Database of mining claim intensity totaled for placer claims, by PLSS section and year for Idaho, 1976-20YY.
id_total.dbf id_total.txt
Database of all mining claims for the period 1976-20YY; by PLSS section, claim type (lode, placer, tunnel site, and mill site), and claims status (Active or Closed) at end of 20YY for Idaho.
mt_claim.dbf mt_claim.txt
Database of mining claim intensity: total for all claim types (lode, placer, tunnel site, and mill site), by PLSS section and year for Montana, 1976-20YY.
mt_lode.dbf mt_lode.txt
Database of mining claim intensity totaled for lode claims, by PLSS section and year for Montana, 1976-20YY.
mt_placr.dbf mt_placr.txt
Database of mining claim intensity totaled for placer claims, by PLSS section and year for Montana, 1976-20YY.
mt_total.dbf mt_total.txt
Database of all mining claims for the period 1976-20YY; by PLSS section, claim type (lode, placer, tunnel site, and mill site), and claims status (Active or Closed) at end of 20YY for Montana.
ne_claim.dbf ne_claim.txt
Database of mining claim intensity: total for all claim types (lode, placer, tunnel site, and mill site), by PLSS section and year for Nebraska, 1976-20YY.
ne_lode.dbf ne_lode.txt
Database of mining claim intensity totaled for lode claims, by PLSS section and year for Nebraska, 1976-20YY.
ne_placr.dbf ne_placr.txt
Database of mining claim intensity totaled for placer claims, by PLSS section and year for Nebraska, 1976-20YY.
ne_total.dbf ne_total.txt
Database of all mining claims for the period 1976-20YY; by PLSS section, claim type (lode, placer, tunnel site, and mill site), and claims status (Active or Closed) at end of 20YY for Nebraska.
nm_claim.dbf nm_claim.txt
Database of mining claim intensity: total for all claim types (lode, placer, tunnel site, and mill site), by PLSS section and year for New Mexico, 1976-20YY.
nm_lode.dbf nm_lode.txt
Database of mining claim intensity totaled for lode claims, by PLSS section and year for New Mexico, 1976-20YY.
nm_placr.dbf nm_placr.txt
Database of mining claim intensity totaled for placer claims, by PLSS section and year for New Mexico, 1976-20YY.
nm_total.dbf nm_total.txt
Database of all mining claims for the period 1976-20YY; by PLSS section, claim type (lode, placer, tunnel site, and mill site), and claims status (Active or Closed) at end of 20YY for New Mexico.
8

nv_claim.dbf nv_claim.txt
Database of mining claim intensity: total for all claim types (lode, placer, tunnel site, and mill site), by PLSS section and year for Nevada, 1976-20YY.
nv_lode.dbf nv_lode.txt
Database of mining claim intensity totaled for lode claims, by PLSS section and year for Nevada, 1976-20YY.
nv_placr.dbf nv_placr.txt
Database of mining claim intensity totaled for placer claims, by PLSS section and year for Nevada, 1976-20YY.
nv_total.dbf nv_total.txt
Database of all mining claims for the period 1976-20YY; by PLSS section, claim type (lode, placer, tunnel site, and mill site), and claims status (Active or Closed) at end of 20YY for Nevada.
or_claim.dbf or_claim.txt
Database of mining claim intensity: total for all claim types (lode, placer, tunnel site, and mill site), by PLSS section and year for Oregon, 1976-20YY.
or_lode.dbf or_lode.txt
Database of mining claim intensity totaled for lode claims, by PLSS section and year for Oregon, 1976-20YY.
or_placr.dbf or_placr.txt
Database of mining claim intensity totaled for placer claims, by PLSS section and year for Oregon, 1976-20YY.
or_total.dbf or_total.txt
Database of all mining claims for the period 1976-20YY; by PLSS section, claim type (lode, placer, tunnel site, and mill site), and claims status (Active or Closed) at end of 20YY for Oregon.
sd_claim.dbf sd_claim.txt
Database of mining claim intensity: total for all claim types (lode, placer, tunnel site, and mill site), by PLSS section and year for South Dakota, 1976-20YY.
sd_lode.dbf sd_lode.txt
Database of mining claim intensity totaled for lode claims, by PLSS section and year for South Dakota, 1976-20YY.
sd_placr.dbf sd_placr.txt
Database of mining claim intensity totaled for placer claims, by PLSS section and year for South Dakota, 1976-20YY.
sd_total.dbf sd_total.txt
Database of all mining claims for the period 1976-20YY; by PLSS section, claim type (lode, placer, tunnel site, and mill site), and claims status (Active or Closed) at end of 20YY for South Dakota.
ut_claim.dbf ut_claim.txt
Database of mining claim intensity: total for all claim types (lode, placer, tunnel site, and mill site), by PLSS section and year for Utah, 1976-20YY.
ut_lode.dbf ut_lode.txt
Database of mining claim intensity totaled for lode claims, by PLSS section and year for Utah, 1976-20YY.
ut_placr.dbf ut_placr.txt
Database of mining claim intensity totaled for placer claims, by PLSS section and year for Utah, 1976-20YY.
ut_total.dbf ut_total.txt
Database of all mining claims for the period 1976-20YY; by PLSS section, claim type (lode, placer, tunnel site, and mill site), and claims status (Active or Closed) at end of 20YY for Utah.
wa_claim.dbf wa_claim.txt
Database of mining claim intensity: total for all claim types (lode, placer, tunnel site, and mill site), by PLSS section and year for Washington, 1976-20YY.
wa_lode.dbf wa_lode.txt
Database of mining claim intensity totaled for lode claims, by PLSS section and year for Washington, 1976-20YY.
wa_placr.dbf wa_placr.txt
Database of mining claim intensity totaled for placer claims, by PLSS section and year for Washington, 1976-20YY.
wa_total.dbf wa_total.txt
Database of all mining claims for the period 1976-20YY; by PLSS section, claim type (lode, placer, tunnel site, and mill site), and claims status (Active or Closed) at end of 20YY for Washington.
wy_claim.dbf wy_claim.txt
Database of mining claim intensity: total for all claim types (lode, placer, tunnel site, and mill site), by PLSS section and year for Wyoming, 1976-20YY.
wy_lode.dbf wy_lode.txt
Database of mining claim intensity totaled for lode claims, by PLSS section and year for Wyoming, 1976-20YY.
wy_placr.dbf wy_placr.txt
Database of mining claim intensity totaled for placer claims, by PLSS section and year for Wyoming, 1976-20YY.
9
wy_total.dbf wy_total.txt
Database of all mining claims for the period 1976-20YY; by PLSS section, claim type (lode, placer, tunnel site, and mill site), and claims status (Active or Closed) at end of 20YY for Wyoming.
Data Sources and Processing
Data Sources There are two types of data provided with this report (1) statistics derived from BLM
mining claim records in two formats (dBASE III and ASCII) and (2) selected polygons and attributes from spatial databases of Public Land Surveys in shapefile format. The PLSS databases were obtained from a variety of sources, which are documented in the metadata provided with each of the shapefiles. The statistical data were produced from an analysis of BLM records of mining claims located on Federal Lands in the United States.
Mining Claim Data Mining claim data for the conterminous United States were extracted from the BLM’s
LR2000 database on May 4, 2006. The extracted data were in ASCII format with | (pipe) delimiters between fields. The SQL (Structured Query Language) statements BLM used to create the tables from which the mining claim data were extracted are included in appendix A. One set of files was extracted from LR2000 for each of BLM’s 11 administrative areas (Arizona, California, Colorado, Eastern States, Idaho, Montana, New Mexico, Nevada, Oregon, Utah, and Wyoming). These administrative areas include 16 states in which mining claims have been recorded (Arizona, Arkansas, California, Colorado, Florida, Idaho, Montana, Nebraska, New Mexico, Nevada, North Dakota, Oregon, South Dakota, Utah, Washington, and Wyoming). Arkansas and Florida data are included in the Eastern States administrative area, Nebraska is included in the Wyoming administrative area, North and South Dakota are included in the Montana administrative area, and Washington is included in the Oregon administrative area.
Mining claim records for Alaska are stored in ALIS and maintained in Anchorage. As such, the database design, fields, and terms used are not all the same as data in LR2000. The records also are incomplete, and about half are not useful for this analysis. The most common problem is that the location date is not given.
On the date data was extracted from LR2000, there were 3,229,344 claim records in the conterminous United States database. The number of records for each state and a comparison to previous reports (Causey, 2005; Causey and Frank, 2006) is shown in table 2. The ALIS database in Alaska had 117,245 mining claim records as of August 31, 2006.
10

Table 2. Number of mining claim records, by state, on January 15, 2004 (Causey, 2005), May 25, 2005 (Causey and Frank, 2006), and May 4, 2006.
State Number of Mining Claim records, Jan. 15, 2004
Number of Mining Claim records, May 26, 2005
Number of Mining Claim records, May 4, 2006
Alaska Not determined Not determined 117,245 Arizona 358,438 364,995 371,275 Arkansas 11,571 11,571 11,577 California 280,494 280,677 284,189 Colorado 251,486 253,315 257,030 Florida 439 439 439 Idaho 184,673 186,138 187,248 Montana 167,213 168,424 170,121 Nebraska1 787 787 787 Nevada 852,463 891,625 920,027 New Mexico 168,678 169,950 172,065 North Dakota 2 2 2 Oregon 104,946 106,057 106,499 South Dakota 40,730 40,838 41,599 Utah 369,430 374,398 381,834 Washington 52,581 53,108 53,411 Wyoming 258,506 263,146 271,237 Unknown2 4 4 TOTAL 3,102,437 3,165,474 3,346,589 1Nebraska claims were determined using the geo_state codes in the CASE_LAND table because the geo_state field in the CASE_TBL contains many errors. 2Four claims in the Eastern States Office records do not have a location, but conversations with BLM indicate these probably are in Arkansas.
There were 17 mining claim records in the May 4, 2006, LR2000 data that did not have a PLSS location; this was the lowest level to date. Table 3 compares the number of claims in this report without a location with numbers in Causey (2005) and Causey and Frank (2006). These records are an insignificant part of the total claim record. (These data are listed in table 3 by administrative area because some of the claims are in administrative areas that include multiple states and the records do not identify which state the claim is in.)
11

Table 3. Comparison of claim records in LR2000 database CASE_TBL table on January 15, 2004, May 25, 2005, and May 4, 2006 that do not have a MTRS value in the CASE_LAND table.
BLM Administrative
Area
Number of claims in LR2000
without a location in
Causey (2005)
Number of claims in LR2000
without a location in Causey and Frank (2006)
Number of claims in LR2000
without a location in this
report
Arizona 5 1 0 California 2 3 0 Colorado 8 8 7 Eastern States 1 9 4 Idaho 0 0 0 Montana 2 2 0 Nevada 5 10 3 New Mexico 1 1 1 Oregon 1 0 0 Utah 1 0 0 Wyoming 2 1 2
TOTAL 28 35 17
It should be noted that not all claim records in the dataset obtained from BLM are used in
creating the statistics in this report. Since the statistics represent a complete year, any claims located or dropped in the calendar year from which the data was extracted were not counted. In addition, for Alaska, only claim records for which a location and closure date could be determined were used.
Spatial Data Spatial datasets were obtained from a variety of sources, which are described in the
associated metadata. All fields, except the required spatial data attributes and a meridian-township-range-section code field (mtrs), were stripped out of the spatial data sets and all polygons that did not have claims were deleted.
Processing Procedures
Mining Claim Data Procedures used to process the LR2000 mining record data used in this analysis were
documented in Causey (2005). Alaska data were processed the same way, but preparation of the data to do the statistical analysis required a slight modification. It was necessary to substitute case status information for case disposition information, which was used in the LR2000 data to determine if a claim was still active. The case-status coding in the Alaska dataset was void, pending, recorded, authorized, inactive, interim, or closed. The values used in this analysis to determine if a claim was active in a year are pending=active, recorded=active, and authorized=active. The other terms, equated with closed claims, are void, inactive, and closed.
Public Land Surveys Improved spatial Public Land Survey databases for Arkansas, Nebraska, South Dakota,
and Utah were acquired in 2006. A spatial PLSS dataset for Alaska was acquired from BLM’s
12

Geocommunicator website (http://www.geocommunicator.gov/GeoComm/index.shtm, downloaded December 7, 2005). The quality of public-domain PLSS spatial databases is highly variable. Errors in polygon labels and shapes, or data in less than optimum format for this project, are present in all the spatial databases acquired. Some corrections to polygon labels were made in order to produce a reasonably accurate depiction of the spatial distribution of mining claims, but these datasets are still not perfect. BLM’s Cadastral Survey is currently developing high-quality PLSS databases, but has not yet completed any states. The other spatial Public Land Survey databases used for this report are those used in Causey (2005) and Causey and Frank (2006). Table 4 shows the relationship between the statistical data and the spatial data. The PLSS datasets of California and New Mexico are the poorest quality for this work.
Table 4. Discrepancies in claim locations between U.S Bureau of Land Management claim records and Public Land Survey spatial databases.
State Number of sections
containing claims, May 4,
2006 LR2000
Number of matching
sections in PLSS spatial
database
Number of claim sections
not in PLSS spatial
database
Percent of claim
sections without
polygons Alaska 12,831 12,697 134 1.04 Arizona 19,587 19,560 27 0.14 Arkansas 541 538 3 0.55 California 23,405 22,091 1,314 5.61 Colorado 15,025 15,020 5 0.03 Florida 22 22 0 0.00 Idaho 12,290 12,290 0 0.00 Montana 9,689 9,680 9 0.09 Nebraska 58 58 0 0.00 Nevada 35,982 35,890 92 0.26 New Mexico 9,273 8,933 340 3.67 North Dakota 1 NA NA NA Oregon 7,818 7,747 71 0.91 South Dakota 1,648 1,633 15 0.06 Utah 20,275 20,176 99 0.49 Washington 3,751 3,749 2 0.03 Wyoming 13,833 13,709 124 0.90
TOTAL 186,029 183,793 2,235
Sections with the same Meridian, township, and range along the California-Nevada
border make it impractical to combine statistical and spatial data for all the states. There are also duplicate townships within some states. No solution to providing one-to-one relationships between polygons and statistical data is possible until the BLM databases provide unique designators for all sections as is being done by the Cadastral Survey in their spatial databases.
North Dakota only had two placer claims, which are no longer active. No spatial or statistical data is provided for North Dakota.
Discrepancies between the LR2000 data and state PLSS files are due to several factors: 1. Errors and omissions in the PLSS spatial databases. For example, some townships in the
New Mexico spatial database are not subdivided into sections and some National Forest lands in California were not gridded with PLSS section polygons.
13
2. Data entry errors in the BLM records. For example, a mtrs value for 3 claims in Nevada did not include a section number, and the range direction for those claims was incorrect.
3. Location errors by the mining claimants. Many parts of the National Forests are unsurveyed and no sections lines are shown on U.S. Geological Survey topographic maps, so claimants have to guess what the township, range, and section might be. Claimants are required to enter a PLSS value, which may have been based on a projection they made that might not correspond to a Cadastral Survey projection. Note that the shapefiles included with this report are only for use with the associated
statistical data. BLM data are continually being updated and new claims may be located in areas where BLM did not previously have a record of activity. New shapefiles must be created for any analysis involving another extraction of mining claim data from BLM’s mining claim databases.
User procedures In order to use the data in a spatial context, the statistical data should be joined to the
spatial databases in a geographic information system (GIS). There are two ways to connect the databases -- join or relate/link. Data can be joined or relate/linked, by using either the dBASE format or ASCII (text) format files, to the appropriate spatial database on the common field (mtrs). All of the files with names like XX_claim, XX_lode, and XX_placr should be connected by using a join. The files XX_total should be connected to a GIS database by using link or relate since they have a one-to-many relationship. The relationships between the statistics tables and the spatial-database feature-attribute table are shown in figure 3.
14

Figure 3. Relationships between mining claim statistical tables (XX_claim, XX_lode, XX_placr, and XX_total) and Public Land Survey polygon attribute tables (xx_pls_YY).
15

Each statistics field in the XX_claim, XX_lode, and XX_placr files represents data for a single year with the two-digit suffix indicating the year (for example, LC_CT_81 is count of lode claims in 1981 and PC_CT_02 is count of placer claims in 2002). The three fields in XX_total are CASE_DISP (disposition of the case – A = Active, C = Closed), CASETYPE (type of mining claim – LODE CLAIM, LODE CLAIM-NP, PLACER CLAIM, PLACER CLAIM-NP, TUNNEL SITE, TUNNEL SITE-NP, MILLSITE CLAIM, MILLSITE-NP), and COUNT (number of claims in a section meeting the CASE_DISP and CASETYPE criteria).
The CASETYPE –NP indicates the claims are in a National Park. These claim types do not occur in all states. The CASETYPEs LODE CLAIM-NP, PLACER CLAIM-NP, TUNNEL SITE-NP, and MILLSITE-NP are used in California, Nevada, and Utah. The CASETYPEs LODE CLAIM-NP and PLACER CLAIM-NP are used in Alaska and Oregon. The CASETYPE LODE CLAIM-NP is used in Arizona and Idaho. The CASETYPE PLACER CLAIM-NP is used in Wyoming.
Data Discussion It is important to understand the limits of the data developed in this process. The data
only pertains to Federal land or patented land with mineral rights reserved to the Federal Government and is open to mineral entry at the time the claim is located. Another consideration is that although BLM mining claim recordation began in 1976, the data between 1976 and 1979 are incomplete. While any new claims staked from1976 on had to be recorded with the BLM, older claims did not have to be recorded until 1979. During that 3-year window, older claims could have been dropped and no record of them would have been entered into the BLM system. For this reason, 1979 is considered the first year of complete data. Also, some of the information in the LR2000 database was incomplete making it necessary to interpret the actual date a claim was finally abandoned or closed. Lastly, the Alaska statistics are included to show the potential to include them if the records in the ALIS database can be cleaned up, but at this time the statistics only include about half the records.
The data show that the total number of active mining claims in the United States was relatively stable between1979 and 1988 (fig. 4). After 1988, there was an extended period where the number of active claims in the United States decreased. Between 1988 and 1993, there was a decline of about 63 percent in the number of active claims. The decrease in number of active claims between 1993 and 2002 was more gradual. Since 2002, there has been a steady increase in active mining claims as more claims are being located than dropped.
0
200,000
400,000
600,000
800,000
1,000,000
1,200,000
1979
1980
1981
1982
1983
1984
1985
1986
1987
1988
1989
1990
1991
1992
1993
1994
1995
1996
1997
1998
1999
2000
2001
2002
2003
2004
2005
Year
Num
ber o
f Cla
ims
Active Claims
Figure 4. Number of active claims in the United States each year from 1979 to 2005.
16

While the trend in active mining claims in the United States shows some uniformity, there are major differences between the states. Figure 5 shows the difference between California and Wyoming between 1979 and 2005. From 1982 to 1988, California was experiencing a rise in the number of active claims while in Wyoming it was declining. Nationwide, this averaged out to a fairly steady number of active claims (fig. 4) during that same period.
0
50,000
100,000
150,000
200,00019
79
1980
1981
1982
1983
1984
1985
1986
1987
1988
1989
1990
1991
1992
1993
1994
1995
1996
1997
1998
1999
2000
2001
2002
2003
2004
2005
Year
Num
ber o
f Cla
ims
Wyoming Active ClaimsCalifornia Active Claims
Figure 5. Number of active claims in California and Wyoming for each year from 1979 to 2005. In 2005, there were more than 65,404 new claims recorded in the conterminous United
States, more than 45 percent of which were in Nevada (table 5). Wyoming had the second-most new claim activity in 2005, followed by Utah and Arizona. The records show that the change from year-to-year can be highly variable. For example, in Colorado there was a 10-fold increase in the number of new claims recorded between 2004 and 2005, while in Idaho there was a decrease in new claim recordation for the same period (table 5). Much of this new activity is probably due to a significant increase in precious metal, copper, and uranium prices since 2002; shortfalls of global inventories; and forecasts of shortages in the near future. (U.S. Geological Survey, 2006; Cameco, 2006; The Uranium Committee, 2006; The UX Consulting Company, LLC, 2006).
17

Table 5. Comparison of the number of new claims, by state, between 2004 and 2005. State Number of new
claims in 20041 Number of new claims in 2005
Arizona 4,525 5,926 Arkansas 0 1 California 1,438 1,810 Colorado 464 4,456 Florida 0 0 Idaho 1,304 987 Nebraska 0 0 Montana 1,022 1,734 Nevada 28,183 29,846 New Mexico 1,056 2,123 North Dakota 0 0 Oregon 516 433 South Dakota 102 759 Utah 2,997 7,743 Washington 227 509 Wyoming 3,540 9,076 Total 45,374 65,403
1 Corrections in data by U.S. Bureau of Land Management resulted in some of these numbers being different than those reported in Causey and Frank (2006).
In general, the pattern of claim activity in individual states varies from that of the U.S. as
a whole. It is possible to examine the activity in the individual states and correlate that with the known mineral endowment, market price fluctuation of commodities, favorable political climate, and other factors. For example, significant price increases for gold, uranium, and copper during the last three years can be correlated with new claim locations in states containing large areas of potentially favorable geologic environment and resources in those commodities. Nevada, which has largest known gold and silver resources in the United States, had the most new mining claim activity in 2005 of any state. Favorable areas for uranium resources in Utah, Wyoming, Colorado, and New Mexico, and copper in Arizona, are undoubtedly factors in the large increase in activity in those states.
In 2005, the spatial extent of mining claims was a fraction of the maximum area covered in the past. Overall, the number of sections in which there were active claims in 2005 is significantly less than the number of sections in which claims have been recorded in the past 30 years (table 6). Only 21 percent of all sections in which claims were recorded since 1976, had active claims in 2005.
18

Table 6. Number of Public Land Survey sections containing claims in each state and number of sections with active claims in 2005.
State Number of PLSS sections in which a
claim has been recorded since
1976
Number of PLSS sections in which
there was an active claim in
2005 Arizona 19,475 4,247 Arkansas 537 9 California 23,267 4,935 Colorado 14,990 1,495 Florida 22 4 Idaho 12,271 2,278 Montana 9,668 1,825 Nebraska 58 1 Nevada 35,642 12,025 New Mexico 9,223 1,186 North Dakota 1 0 Oregon 7,799 1,641 South Dakota 1,638 295 Utah 20,211 2,513 Washington 3,743 527 Wyoming 13,745 2,731
Total 172,290 35,712
The pattern of locating claims is variable over time and space; this is also true for the
relinquishment of claims. In general though, claim activity after 1992 has been relatively stable, while in the years prior to 1992, the pattern of locating new claims and dropping claims was more volatile (fig. 6).
050,000
100,000150,000200,000250,000300,000350,000400,000450,000
1979
1980
1981
1982
1983
1984
1985
1986
1987
1988
1989
1990
1991
1992
1993
1994
1995
1996
1997
1998
1999
2000
2001
2002
2003
2004
2005
Year
Num
ber o
f Cla
ims
New ClaimsClosed Claims
Figure 6. Number of new and closed claims each year from 1979 to 2005 in the conterminous United States.
Mining claim activity had a watershed year in 1992, and there was a marked decrease in
the number of mining claims throughout the United States. However, it has been noted that a decrease in mineral-exploration activity between 1988 and 1992 was not unique to the U.S. (Minerals and Metals Sector, 1997; Cranstone, 2002). Although Public Law 102-381 (October 1992) imposed a $100 annual assessment fee for each claim on holders of large blocks of claims,
19

it was not the only factor affecting activity at that time. Base and precious metal prices also had been falling. Several global activities around this time probably also had a profound affect on mining claim activity. The USSR broke up in December 1991, resulting in changes from a centrally-planned economy to market or mixed economy in the Soviet-block nations. This situation allowed foreign investors to consider projects in a part of the world formerly denied them. The Tiananmen Square protests in 1989 presaged the conversion of China in the early 1990s from a socialist market economy to one that contained special economic zones with few government restrictions. Also in the 1990s the stock market boom provided a means to make better profits than did the risky mining sector.
Other factors, such as increased government regulation and environmental activism created long delays in mineral development, which negatively affected the time-value of money, and hence dampened interest in investment in mining exploration. The United States is a well-explored country. Most of the significant deposits that have surface expression have probably been discovered, and their general extents are known. New technology needed to discover buried deposits, especially in virgin terrain, was not available.
The claim count can be used to estimate the maximum area that could be covered by lode mining claims. Assuming each lode claim was the maximum size allowed (600 feet by 1,500 feet) and that there were no overlapping claims, the maximum area encompassed by the claims can be estimated (table 7). Since many claims are smaller than the maximum size, the area covered by claims in 2005 is less than the maximum. For reference, the total area covered by active lode mining claims in the conterminous United States is less than the area of either of the two largest national parks (Wrangell-St. Elias National Park and Gates of the Arctic National Park). Because placer claims can be any size up to 160 acres, but most are 20 acres or less; it is not as reasonable to estimate the amount of land encompassed by this type of claim.
Table 7. Maximum area that could potentially be covered by lode mining claims in 2005. State Total Claims Lode Claims Maximum Lode Claim
Area (sq. mi.) Arizona 32,251 24,250 789 Arkansas 24 8 0.3 California 20,838 9,386 303 Colorado 9,452 7,797 252 Florida 3 3 0.1 Idaho 12,273 9,548 308 Montana 11,766 8,839 285 Nebraska 3 3 0.1 Nevada 162,663 149,348 4,821 New Mexico 9,458 7,943 256 Oregon 5,785 2,972 96 South Dakota 1,797 1,326 43 Utah 19,483 15,960 515 Washington 2,781 2,388 77 Wyoming 24,302 18,689 603 Total 312,879 258,460 8,349
Barring another major action, such as changing from a mining claim location system to a
leasing system for mineral rights, the pattern of the last decade of a small but sub-equal number of claims being located and dropped in any year may continue. Commodity prices will likely be the most influential factor in determining whether staking or dropping claims is more dominant
20

in any given year. Technological advances in metal recovery, or demand for previously unimportant commodities, could also spur activity in some areas of the country.
Obtaining Digital Data The spatial databases are available in shapefile format with associated data files. The
spatial data is maintained in: Projection: Geographic
Units: Decimal Degrees
Datum: NAD27
Spheroid: Clarke1866
To obtain copies of the digital data:
Download from the USGS World Wide Web site: URL = http://pubs.usgs.gov/ds/2007/290 Note that the uncompressed files take more than 400 megabytes of space. The Internet site contains the spatial data, associated .dbf and .txt format tables, and
metadata for the state PLSS spatial databases (see listing of files in table 1). Formatted metadata (Federal Geographic Data Committee-compliant) is included with each spatial database.
To manipulate the spatial databases, you must have software that is capable of reading shapefile format.
References Cited Cameco, 2006, Uranium spot price history:
[http://www.cameco.com/investor_relations/ux_history/historical_ux.php, last accessed Jan. 1, 2006].
Campbell, H.W., 1996, Procedure for making a mining claim density map from BLM claim recordation digital data: U.S. Geological Survey Open-File Report 96-736, 13 p. [http://pubs.usgs.gov/of/1996/of96-736/, last accessed Feb. 9, 2007].
Campbell, H.W., and Hyndman, P.C., 1996, Digital mining claim density map for Federal lands in the Pacific Northwest: U.S. Geological Survey Open-File Report 96-737, 12 p. [http://pubs.usgs.gov/of/1996/of96-737/, last accessed Feb. 9, 2007].
Causey, J.D., 2005, Mining claim activity on Federal Land for the period 1976 through 2003: U.S. Geological Survey Digital Series 124 [http://pubs.usgs.gov/ds/124/, last accessed Nov. 2, 2006].
Causey, J.D. and Frank, D.G., 2006, Mining claim activity on Federal Land for the period 1976 through 2004: U.S. Geological Survey Digital Series 228 [http://pubs.usgs.gov/ds/2006/228, last accessed Dec. 5, 2006].
Cranstone, D.A., 2002, A history of mining and mineral exploration in Canada and outlook for the future: Natural Resources of Canada, 51 p. [http://www.nrcan.gc.ca/ms/pdf/hist_e.pdf, last accessed Dec. 15, 2006].
Hyndman, P.C., and Campbell, H.W., 1999a, Digital databases containing mining claim density information for Arizona, California, Colorado, Idaho, Montana, Nebraska, New Mexico, Nevada, Oregon, South Dakota, Utah, Washington, and Wyoming created from the BLM mining claim recordation system, 1996: U.S. Geological Survey Open-File Report 99-325, 13 datasets, 21 p. [http://pubs.usgs.gov/of/1999/of99-325/, last accessed Feb 9, 2007].
21

Hyndman, P.C., and Campbell, H.W., 1999b, Digital mining claim density map for federal lands in Arizona: 1996: U.S. Geological Survey Open-File Report 99-406, 23 p. [http://geopubs.wr.usgs.gov/open-file/of99-406/, last accessed Feb. 9, 2007].
Hyndman, P.C., and Campbell, H.W., 1999c, Digital mining claim density map for federal lands in Idaho: 1996: U.S. Geological Survey Open-File Report 99-543, 21 p. [http://geopubs.wr.usgs.gov/open-file/of99-543/, last accessed Feb. 9, 2007].
Hyndman, P.C., and Campbell, H.W., 1999d, Digital mining claim density map for federal lands in Utah: 1996: U.S. Geological Survey Open-File Report 99-407, 18 p. [http://geopubs.wr.usgs.gov/open-file/of99-407/, last accessed Feb. 9, 2007].
Hyndman, P.C., and Campbell, H.W., 1999e, Digital mining claim density map for federal lands in Washington: 1996: U.S. Geological Survey Open-File Report 99-408, 18 p. [http://geopubs.wr.usgs.gov/open-file/of99-408/, last accessed Feb. 9, 2007].
Hyndman, P.C., and Campbell, H.W., 1999f, Digital mining claim density map for federal lands in California: 1996: U.S. Geological Survey Open-File Report 99-409, 21 p. [http://geopubs.wr.usgs.gov/open-file/of99-409/, last accessed Feb. 9, 2007].
Hyndman, P.C., and Campbell, H.W., 1999g, Digital mining claim density map for federal lands in Colorado: 1996: U.S. Geological Survey Open-File Report 99-410, 21 p. [http://geopubs.wr.usgs.gov/open-file/of99-410/, last accessed Feb. 9, 2007].
Hyndman, P.C., and Campbell, H.W., 1999h, Digital mining claim density map for federal lands in New Mexico: 1996: U.S. Geological Survey Open-File Report 99-411, 20 p. [http://geopubs.wr.usgs.gov/open-file/of99-411/, last accessed Feb. 9, 2007].
Hyndman, P.C., and Campbell, H.W., 1999i, Digital mining claim density map for federal lands in Nevada: 1996: U.S. Geological Survey Open-File Report 99-540, 20 p. [http://geopubs.wr.usgs.gov/open-file/of99-540/, last accessed Feb. 9, 2007].
Hyndman, P.C., and Campbell, H.W., 1999j, Digital mining claim density map for federal lands in Oregon: 1996: U.S. Geological Survey Open-File Report 99-541, 21 p. [http://geopubs.wr.usgs.gov/open-file/of99-541/, last accessed Feb. 9, 2007].
Hyndman, P.C., and Campbell, H.W., 1999k, Digital mining claim density map for federal lands in Wyoming: 1996: U.S. Geological Survey Open-File Report 99-542, 18 p. [http://geopubs.wr.usgs.gov/open-file/of99-542/, last accessed Feb. 9, 2007].
Hyndman, P.C., and Campbell, H.W., 199l, Digital mining claim density map for federal lands in Idaho: 1996: U.S. Geological Survey Open-File Report 99-543, 21 p. [http://geopubs.wr.usgs.gov/open-file/of99-543/, last accessed Feb. 9, 2007].
Minerals and Metals Sector, 1997, Mineral exploration activity in Canada, in Canadian Minerals Yearbook: Natural Resources of Canada 1997 Yearbook, 22 p. [http://www.nrcan.gc.ca/ms/cmy/content/1997/04.pdf, last accessed Dec. 15, 2006].
The Uranium Committee, 2006, Uranium, recent uranium industry developments, exploration, mining and environmental programs in the U.S. and overseas: Energy Minerals Division, American Association of Petroleum Geologists. [http://emd.aapg.org/technical_areas/uranium.cfm, last accessed June 12, 2006].
U.S. Geological Survey, 2006, Mineral commodity summaries 2005: U.S. Geological Survey, 202 p. [http://minerals.usgs.gov/minerals/pubs/mcs/2006/mcs2006.pdf, last accessed Dec. 5, 2006].
The UX Consulting Company, LLC, 2006, Historical UX month-end spot prices: The UX Consulting Company, LLC [http://www.uxc.com/review/uxc_prices_mth-end.html, last accessed June 12, 2006].
22

Appendix A – Table Design SQL (Structured Query Language) The following SQL statement provided by BLM shows how the case_tbl and case_land
tables were created in LR2000 and the table structure as it existed on May 4, 2006. This SQL is Oracle specific. The SQL language may have to be modified to create the same tables in other relational database programs.
create table case_tbl ( case_id DECIMAL(16) not null, system_id CHAR(2) , serial_nr_full CHAR(17) , serial_nr_prefix CHAR(4) , number_prefix CHAR(1) , serial_nr CHAR(6) , serial_nr_num_part INTEGER , serial_nr_suf CHAR(2) , st_case_part CHAR(2) , admin_state CHAR(2) , geo_state CHAR(2) , last_assess_yr CHAR(4) , last_assess_cd CHAR(3) , ttl_case_acres DECIMAL(12,3) , commodity CHAR(3) , commodity_txt VARCHAR(25) , case_disp CHAR(1) , case_disp_txt VARCHAR(25) , case_disp_gp VARCHAR(25) , disp_act_cd CHAR(3) , disp_act_txt VARCHAR(25) , disp_dt TIMESTAMP , case_modif_dt TIMESTAMP , casetype CHAR(6) , casetype_txt VARCHAR(25) , last_action_cd CHAR(3) , last_action_txt VARCHAR(25) , last_action_dt TIMESTAMP , mc_claim_nm VARCHAR(20) , cr_legal_ref VARCHAR(40) , mc_lead_case_ser_nr VARCHAR(17) , mc_county_bk_pg VARCHAR(30) , mc_loc_dt TIMESTAMP , mc_cert_issue_dt TIMESTAMP , mc_cert_canc_dt TIMESTAMP , chargeable_acres_flg CHAR(1) , case_group CHAR(2) , lease_auth_dt TIMESTAMP , action_669_flg CHAR(1) , reinstatement_flg CHAR(1) , hi_reference_nr CHAR(25) , hi_kind_of_entry CHAR(50) , loadts_dt TIMESTAMP ); create table case_land (
23

case_id DECIMAL(16) not null, blm_adm_st CHAR(2) not null, geo_state CHAR(2) , land_id DECIMAL(16) not null, cty_dist_ra_id DECIMAL(16) not null, system_id CHAR(2) , ser_nr_full CHAR(17) , withdrawal_flg CHAR(1) , meridian_cd CHAR(2) , meridian_txt VARCHAR(25) , mer_twp_rng CHAR(14) , township CHAR(5) , range CHAR(5) , twp_rng_dir CHAR(2) , entire_twp_flg CHAR(1) , st_entire_twp_exc_flg CHAR(1) , st_indemn_lands_flg CHAR(1) , st_twp_loc_unkn_flg CHAR(1) , section CHAR(3) , entire_sec_flg CHAR(1) , st_sec_loc_unkn_flg CHAR(1) , mtrs CHAR(18) , geost_county_cd CHAR(5) , county_txt VARCHAR(25) , admst_dist_ra_cd CHAR(6) , district_txt VARCHAR(25) , ra_txt VARCHAR(25) , adm_agency CHAR(8) , adm_agency_txt VARCHAR(25) , aliquot_part CHAR(25) , cong_dist CHAR(4) , ls_inc CHAR(1) , sur_nr CHAR(5) , sur_suffix CHAR(2) , survey_type CHAR(1) , sur_type_txt VARCHAR(25) , sur_sort CHAR(2) , case_land_acres DECIMAL(8,3) , st_sur_note CHAR(1) , es_pol_twnshp VARCHAR(2) , es_map_ref VARCHAR(6) , es_quad VARCHAR(4) , es_set_id smallint , es_sortkey smallint );
24

Appendix B – Access 2000 Table Design ASCII text files supplied by BLM were imported into a Microsoft Access 2000 database.
By using the names and data types provided in the table creation SQL supplied by BLM (Appendix A), a similar data design was created in Access. Additional fields necessary for statistical processing were also added to the design. The Access table design is provided in tables B-1 and B-2. BLM provided definitions for most of the LR2000 fields. It is noted in the tables where a definition was not supplied, or the definition is from this report (non-BLM field). Questions concerning metadata and definitions for the tables and fields in LR2000 should be directed to the BLM (http://www.blm.gov/lr2000/).
The following tables can be used to reconstruct the Access 2000 database used to create the information provided with this report. Since BLM is constantly updating their data and correcting errors in older data, new downloads of the database may provide slightly different yearly results from those included in this data release.
Table B-1. CASE_TBL table structure Field Name Type Size Description
Case_id Number Long Integer A numeric identifier assigned to each case. System_id Text 2 The system by which the data element is referenced.
Case system Id’s = MCR, CR, ST. Serial_nr_full Text 17 The entire serial number, including suffix and case part
for Status. Serial_nr_prefix Text 4 The second 4 character string of a serial number (land
office). Number_prefix Text 1 The preceding zero portion of the serial number. Serial_nr Text 6 BLM field, no definitions supplied. Serial_nr_num_part Number Long Integer The number portion of the serial number that is currently
only populated for MCR and is used in MCR reports to sort numbers.
Serial_nr_suf Text 2 Suffix portion of the serial number use in CR and Status only.
St_case_part Text 2 BLM field, no definitions supplied. Admin_state Text 2 The administrative state code. Geo_state Text 2 The two character geo-state code portion of the serial
number. Last_assess_yr Text 4 The last assessment year for a mining claim. (MCR
only). Last_assess_cd Text 3 The latest maintenance fee or waiver action code on a
mining claim (MCR only). Ttl_case_acres Number Double Shows the total case acres in a case. (CR only). Commodity Text 3 3-digit commodity code used in (CR and MCR only). Commodity_txt Text 25 The text description of the commodity code. Case_disp Text 1 1-character code field indicating the disposition of a
MCR or CR case. For CR the codes are 1 = Void, 2 = Pending, 3 = Rejected, 4 = withdrawn, 5 = authorized, 6 = cancelled, 7 = expired, 8 = Relinquished, 9 = Closed. For MCR the codes are A = Active, C = Closed, and V = Void.
Case_disp_txt Text 25 The text value of the code (void, expired) CR & MCR only.
Case_disp_gp Text 25 Same as the Case_disp_txt. Disp_act_cd Text 3 The action code that set the case disposition. Disp_act_txt Text 25 The textual description of the action code that set the case
25

Field Name Type Size Description disposition.
Disp_dt Text 25 The date of the action code that set the case disposition. Case_modif_dt Text 25 The last date that anything concerning the case was
updated. Casetype Text 6 The coded value for a specific casetype. Casetype_txt Text 25 The textual description for a casetype. Last_action_cd Text 3 The most recent action taken on a case. Last_action_txt Text 25 The textual description of the last action code. Last_action_dt Text 25 The date of the most recent action on a case. Mc_claim_nm Text 20 The mining claim name (MCR only). Cr_legal_ref Text 40 For CR system only: Some casetypes have legal
information that must appear on the top of the report. Mc_lead_case_ser_nr Text 17 The lead-case serial number for a mining claim and is
generated from the action remarks field for action codes 500 or 501 (MCR only).
Mc_county_bk_pg Text 30 This field contains the county documentation reference information, book and page, for a mining claim. This information was retrieved from the action remarks field for action code 404 (MCR only).
Mc_loc_dt Text 25 This field contains the location date for the mining claim. This information was retrieved from the action-remarks field for action code 403 (MCR only).
Mc_cert_issue_dt Text 25 This is the date that the certification was issued regarding the mining claim, Action codes 630 or 212. This data is used to determine if the yearly assessment is missing for the mining claim. If a certification has been issued, the assessment is not missing (MCR only).
Mc_cert_canc_dt Text 25 This the date that the certification was canceled regarding the mining claim, Action code 359. This data is used to determine if the yearly assessment is missing for the mining claim. If a certification has been issued, the assessment is not missing; but if the certification was canceled, the assessment is missing if other criteria such as payment of maintenance fee was not met (MCR only).
Chargeable_acres_flg Text 1 This field is used for acreage hold reporting for oil and gas leases. A "Y" in the field means the acres are chargeable (CR only).
Case_group Text 2 This field contains the first pair of digits in the casetype field. For example, 27 is Land Sales.
Lease_auth_dt Text 25 The date that a lease was authorized, action_dt for action code 237 in the action table. Only applicable for case rec cases of certain casetypes.
Action_669_flg Text 1 This is the date associated with the action code 669 (Land Status Checked) A Y value indicates the land status has been checked. Use only for MCR.
Reinstatement_flg Text 1 This field applies only to CR cases, with casetypes 312011, 311111, 311211, 312012, 311112, 311212, 322000, or 321000. If there is an action date (action.act_dt) with an attached action code (action.act_cd) of 666 or 970 or 199 or 234 or 244 or 310, and that same record has an action code of 282 with an action date greater than the action date of the action codes previously mentioned, then this reinstatement flag is set to "Y". Otherwise this field is NULL.
Hi_reference_nr Text 25 BLM field, no definitions supplied.
26

Field Name Type Size Description Hi_kind_of_entry Text 50 BLM field, no definitions supplied. load_dt Text 25 BLM field, no definitions supplied. location_yr Number Integer Year (four-digit form) mining claim was located (non-
BLM field). disposal_yr Number Integer Last year (four-digit form) mining claim was active (non-
BLM field). no_sec Number Integer Number of sections in which the claim is situated. (non-
BLM field). fraction Number Double 1/no_sec (non-BLM field).
Table B-2. CASE_LAND table structure Field Name Type Size Description
Case_id Number Long Integer A numeric identifier assigned to each case. Blm_adm_state Text 2 The administrative state code. Geo_state Text 2 The geographic state where the land in the case is
located. Land_id Number 16 A numeric ID assigned to each piece of land within a
case. Cty_dist_ra_id Number 16 A numeric ID assigned to the county/district/resource
area codes attached to the land description. System_id Text 2 The system that the data element is referenced by.
Case system IDs = MCR, CR, ST. Ser_nr_full Text 15 The entire serial number including suffix and case part
for Status. Withdrawal_flg Text 1 Currently (as of 8/23/99) set to null; originally
intended to indicate that the land specified was withdrawn, which is usually indicated with a “7” in the first digit of the section field, in the CR system.
Meridian_cd Text 2 The two digit meridian code used for land descriptions.
Meridian_txt Text 25 The textual description of the meridian code. Mer_twp_rng Text 14 The concatenation of the meridian, township & range
fields, in that order. Used for easy selection for reporting.
Township Text 5 Contains township data (number and direction). Range Text 5 Contains range data (number and direction). Twp_rng_dir Text 2 The direction component from both the township and
range fields. Example: SW, NE. Entire_twp_flg Text 1 A field that was created to indicate that the land
description is for the entire township. This Flag has not been populated and is currently not used.
St_entire_twp_exc_flg Text 1 A field that was created to indicate that the land description is for an entire township excluding certain descriptions. This flag has not been populated and is currently not used (Status Only).
St_indemn_lands_flg Text 1 Indemnity lands indicate an acreage assigned to that township for purposes of computing acreage to determine the lands owed to the state under various grants. This flag applies only to data from the Status system. This information is also stored as section 888.
St_twp_loc_unkn_flg Text 1 A field that was created to indicate that the location in the township is unknown. This flag has not been populated, and the lands are currently identified with
27

28
Field Name Type Size Description the number of 777 in the section field (Status Only).
Section Text 1 The field where section number is stored. Entire_sec_flg Text 3 A field that was created to indicate that all the land
descriptions with a section are included. St_sec_loc_unkn_flg Text 1 This flag applies only to data from the Status system,
and is not used in CR or MC. It indicates that the section’s exact location is unknown. It was not populated for LR20000.
Mtrs Text 18 The concatenation of the meridian, township, range, and section fields, in that order. Used for easy selection for reporting.
Geostate_county_cd Text 5 The concatenation of the geographic state (2 characters) with the county code.
County_txt Text 25 The decoded textual description/name of the county code. It does not include the geo_state name.
Admst_dist_ra_cd Text 6 The concatenation of the BLM admin state with BLM district and BLM resource area.
District_txt Text 25 The textual description of the BLM District Office or Field Office.
Ra_txt Text 25 The textual description of the BLM Resource Area Office.
Adm_agency Text 8 The code of the administrative agency for the land. Adm_agency_txt Text 25 The textual description of the administrative agency. Aliquot_part Text 25 The aliquot part portion of the land description
(NE,NE etc.). Cong_dist Text 4 Status data only and is the congressional where the
land is located. Ls_inc Text 1 Incomplete indicator; calculated by the system, not
directly entered. Brought over from CR only. Sur_nr Text 5 The survey number field from caseland. Sur_suffix Text 2 The survey suffix field from caseland. Survey_type Text 1 The survey type field from case land. Sur_type_txt Text 25 The textual description of the survey type. Sur_sort Number 2 Case rec report Location Index sorts based on this;
COBOL program pads it with another character, so we will do this in the transforms.
Case_land_acres Number Double This field is populated for status cases only, and its source is st_acreage in the ltp_case_land table. It is the number of acres for this parcel represented in the case_land table row.
St_sur_note Text 1 BLM field, no definitions supplied. Es_pol_twnshp Text 2 BLM field, no definitions supplied. Es_map_ref Text 6 BLM field, no definitions supplied. Es_quad Text 4 BLM field, no definitions supplied. Es_set_id Number Integer BLM field, no definitions supplied. Es_sortkey Number Integer BLM field, no definitions supplied.