minimizing the impact and cost of inefficient o.r. utilization michael monea [email protected] joe...
TRANSCRIPT

Minimizing the Impact and Cost of Inefficient O.R. Utilization
Michael Monea
Joe Laden

Take Home Message
Anesthesia Billing Data can be used to:
Analyze OR Utilization
Suggest Alternative Scenarios:Obtain Financial SupportChange OR Allocation

The OR Utilization Spreadsheet
ASA NewsletterASA Newsletter
Practice Management DepartmentPractice Management Department
June 2004June 2004
““How Many Rooms Do We Need”How Many Rooms Do We Need”
September 2004September 2004
““The Cost of Inefficient O.R. Utilization”The Cost of Inefficient O.R. Utilization”
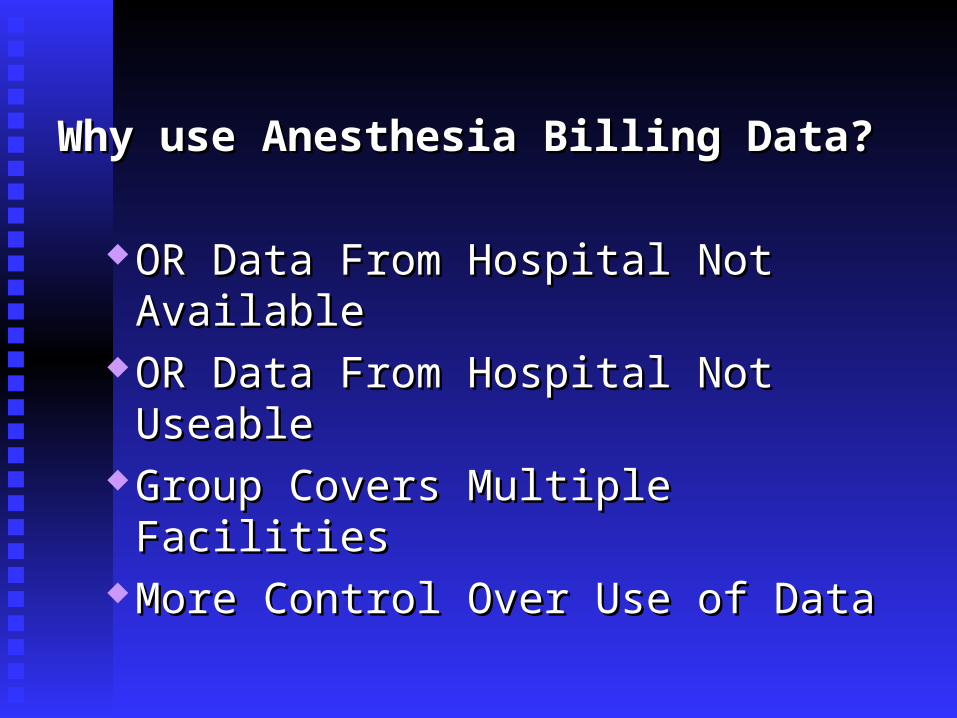
Why use Anesthesia Billing Data?Why use Anesthesia Billing Data?
OR Data From Hospital Not AvailableOR Data From Hospital Not Available OR Data From Hospital Not UseableOR Data From Hospital Not Useable Group Covers Multiple FacilitiesGroup Covers Multiple Facilities More Control Over Use of DataMore Control Over Use of Data
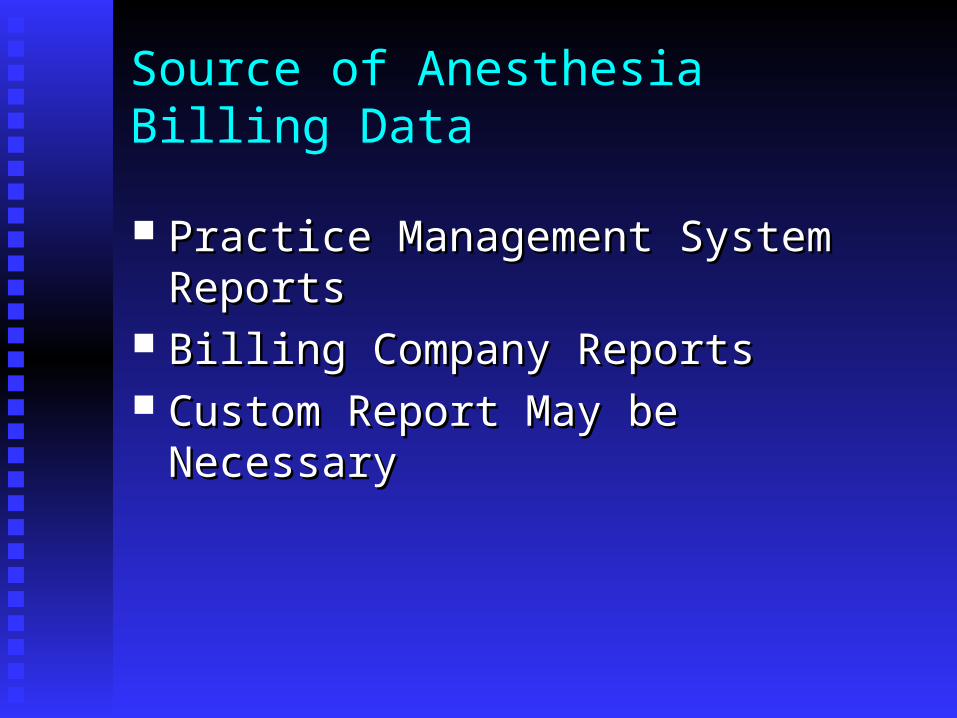
Source of Anesthesia Billing Data
Practice Management System ReportsPractice Management System Reports Billing Company Reports Billing Company Reports Custom Report May be NecessaryCustom Report May be Necessary
Sample Reports FromSample Reports From
Anesthesia Billing Data Anesthesia Billing Data
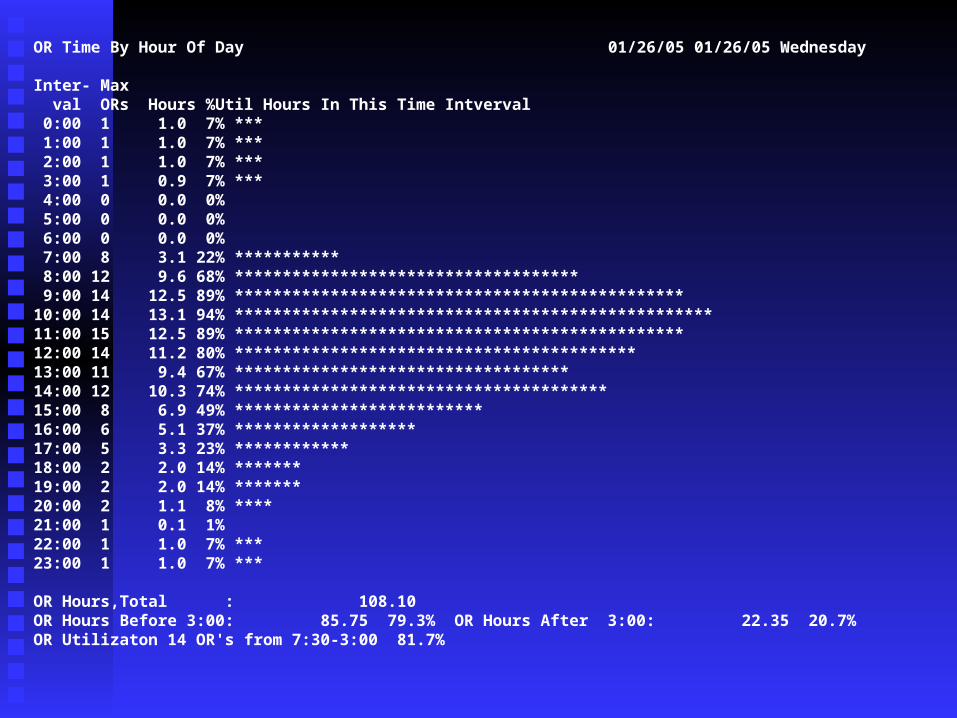
OR Time By Hour Of Day 01/26/05 01/26/05 Wednesday
Inter- Max val ORs Hours %Util Hours In This Time Intverval 0:00 1 1.0 7% *** 1:00 1 1.0 7% *** 2:00 1 1.0 7% *** 3:00 1 0.9 7% *** 4:00 0 0.0 0% 5:00 0 0.0 0% 6:00 0 0.0 0% 7:00 8 3.1 22% *********** 8:00 12 9.6 68% ************************************ 9:00 14 12.5 89% ***********************************************10:00 14 13.1 94% **************************************************11:00 15 12.5 89% ***********************************************12:00 14 11.2 80% ******************************************13:00 11 9.4 67% ***********************************14:00 12 10.3 74% ***************************************15:00 8 6.9 49% **************************16:00 6 5.1 37% *******************17:00 5 3.3 23% ************18:00 2 2.0 14% *******19:00 2 2.0 14% *******20:00 2 1.1 8% ****21:00 1 0.1 1% 22:00 1 1.0 7% ***23:00 1 1.0 7% ***
OR Hours,Total : 108.10OR Hours Before 3:00: 85.75 79.3% OR Hours After 3:00: 22.35 20.7%OR Utilizaton 14 OR's from 7:30-3:00 81.7%

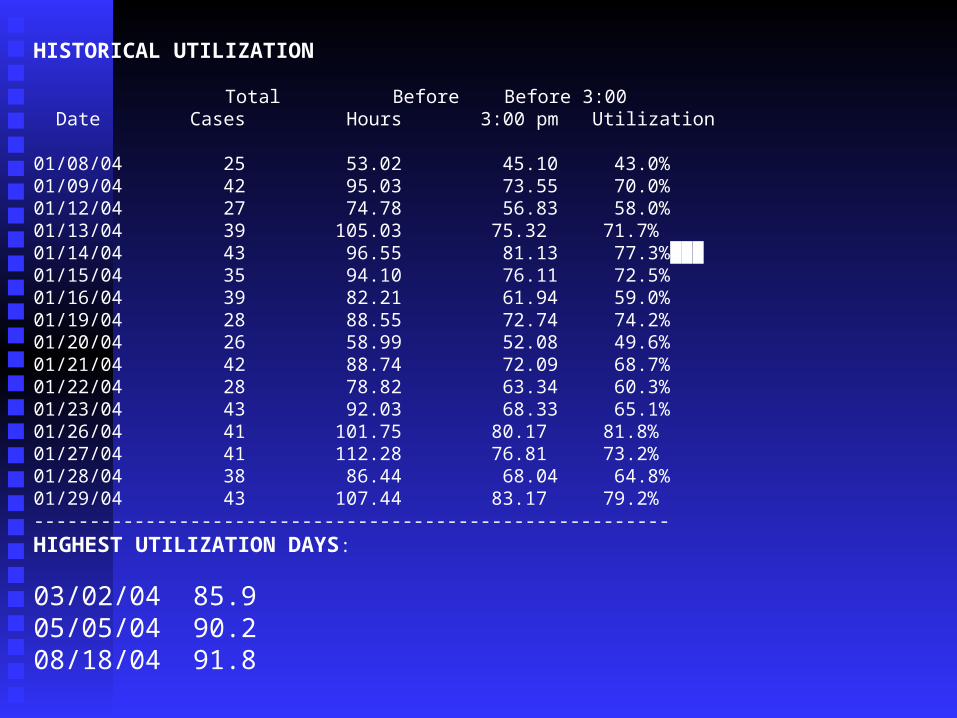
HISTORICAL UTILIZATION
Total Before Before 3:00 Date Cases Hours 3:00 pm Utilization
01/08/04 25 53.02 45.10 43.0%01/09/04 42 95.03 73.55 70.0%01/12/04 27 74.78 56.83 58.0%01/13/04 39 105.03 75.32 71.7%01/14/04 43 96.55 81.13 77.3%███01/15/04 35 94.10 76.11 72.5%01/16/04 39 82.21 61.94 59.0%01/19/04 28 88.55 72.74 74.2%01/20/04 26 58.99 52.08 49.6%01/21/04 42 88.74 72.09 68.7%01/22/04 28 78.82 63.34 60.3%01/23/04 43 92.03 68.33 65.1%01/26/04 41 101.75 80.17 81.8%01/27/04 41 112.28 76.81 73.2%01/28/04 38 86.44 68.04 64.8%01/29/04 43 107.44 83.17 79.2%---------------------------------------------------------HIGHEST UTILIZATION DAYS:
03/02/04 85.9 05/05/04 90.2 08/18/04 91.8
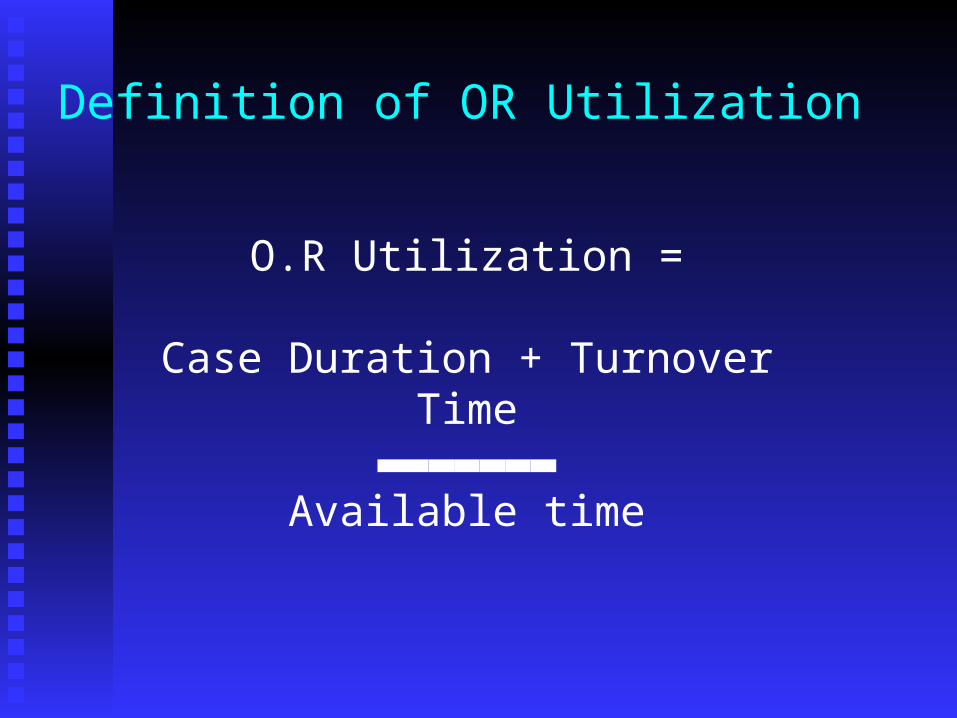
O.R Utilization =
Case Duration + Turnover Time▬▬▬▬▬▬▬Available time
Definition of OR Utilization

Case Duration
Anesthesia Stop End Time –Anesthesia Start Time
( ≈ Surgical time)
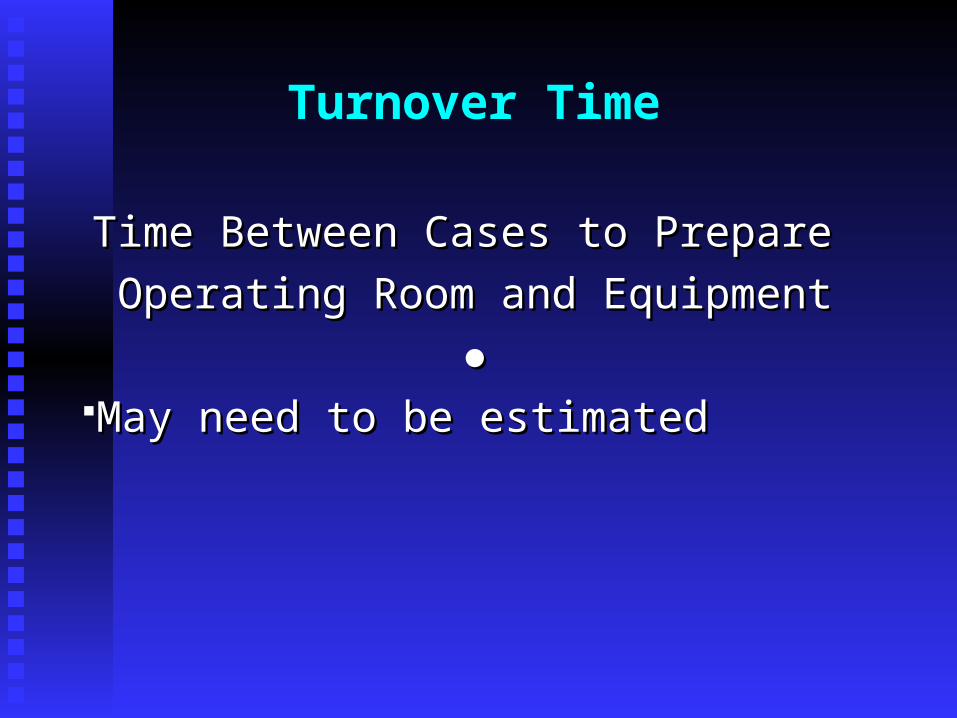
Turnover Time
Time Between Cases to Prepare Time Between Cases to Prepare
Operating Room and EquipmentOperating Room and Equipment
●●May need to be estimatedMay need to be estimated

Available TimeAvailable Time
Normally Scheduled Prime Shift HoursNormally Scheduled Prime Shift Hours
Example:Example:
8 O.R.’s – 7:00 a.m. – 3:00 p.m.8 O.R.’s – 7:00 a.m. – 3:00 p.m.
2 O.R.’s - 7:00 a.m. – 5:00 p.m.2 O.R.’s - 7:00 a.m. – 5:00 p.m.
Total = 84 Hours Avaliable TimeTotal = 84 Hours Avaliable Time

Utilization Example, 1 OR
OR Available 7:00 – 3:00OR Available 7:00 – 3:00
Case 1: Case 1: 7:00-9:007:00-9:00
TurnoverTurnover 9:00-9:309:00-9:30
Case 2: Case 2: 9:30-12:309:30-12:30
Turnover Turnover 12:30-1:0012:30-1:00
Case 3: Case 3: 2:00-2:302:00-2:30
Total Turnover: Total Turnover: 1.01.0
Total Case Time:Total Case Time: 4.54.5

Example -Utilization Calculation, 1 OR
(Case Time + Turnover) / Available Time(Case Time + Turnover) / Available Time
(4.5 + 1.0) / 8 = (4.5 + 1.0) / 8 = 68.85%68.85%
4.5/8 = 56.25% without turnover4.5/8 = 56.25% without turnover

Annual Utilization at Facility
Total Annual Prime Shift OR Hours Billed Total Annual Prime Shift OR Hours Billed
minus minus
Total Turnover TimeTotal Turnover Time
divided bydivided by
Total Available OR HoursTotal Available OR Hours

Example
20 OR’s covered20 OR’s covered Prime Shift – 8 hours/day; 7:00-3:00 Prime Shift – 8 hours/day; 7:00-3:00 12,500 cases / year12,500 cases / year Anesthesia bills 20,000 hours / year Anesthesia bills 20,000 hours / year
during Prime Shiftduring Prime Shift Anesthesia bills 25,000 total hours /yearAnesthesia bills 25,000 total hours /year Turnover time averages 30 minutesTurnover time averages 30 minutes Total OR Revenue - $7,500,000Total OR Revenue - $7,500,000

Example – 20 OR’s - Available Hours
20 OR’s 20 OR’s
x x
8 hrs/day 8 hrs/day
x x
250 days250 days
==
40,000 Available Hours40,000 Available Hours

Example – 20 OR’s Cases/Day10,417 Prime Shift Cases 10,417 Prime Shift Cases
/ /
250 days250 days
/ /
20 OR/s20 OR/s
==
2.08 Cases / OR / Day2.08 Cases / OR / Day
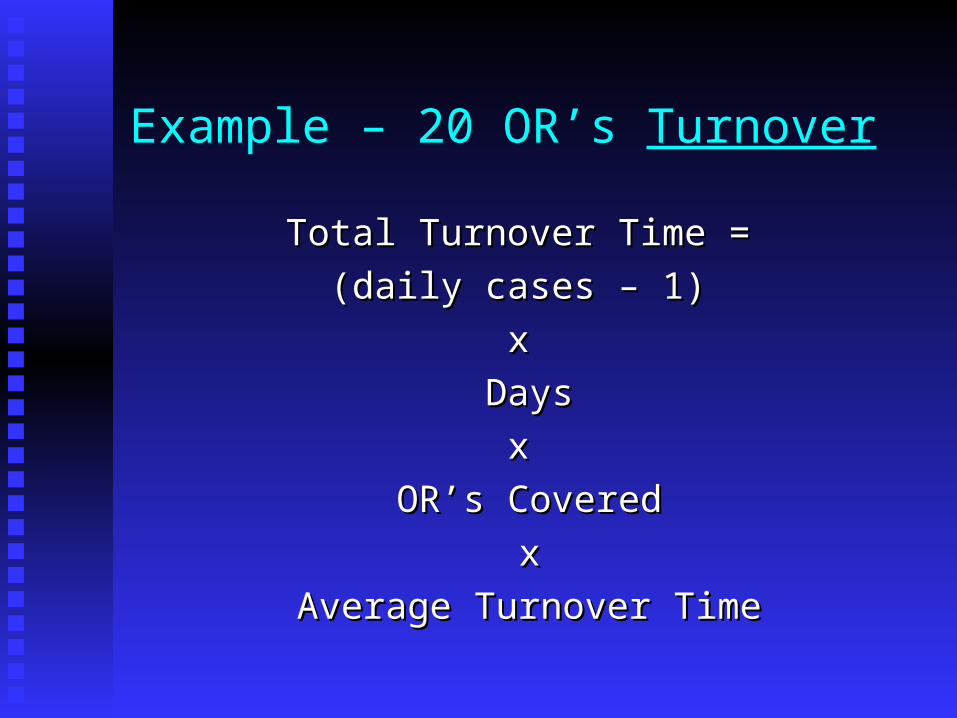
Example – 20 OR’s Turnover
Total Turnover Time = Total Turnover Time =
(daily cases – 1) (daily cases – 1)
x x
DaysDays
x x
OR’s CoveredOR’s Covered
xx
Average Turnover TimeAverage Turnover Time

Example – 20 OR’s Turnover
(2.08 cases/day – 1) (2.08 cases/day – 1) x x
250 days250 daysX X
30 minutes30 minutesXX
20 OR’s20 OR’s= =
2,700 hours Turnover Time2,700 hours Turnover Time

Example – 20 OR’s Utilization
(20,000 Annual OR Hours(20,000 Annual OR Hours
++
2,70 0 Turnover Hours) 2,70 0 Turnover Hours)
//
40,000 Available Hours40,000 Available Hours
==
56.75% Average Annual Utilization56.75% Average Annual Utilization

Hourly OR RevenueExample
Hourly Revenue = OR Revenue / OR HoursHourly Revenue = OR Revenue / OR Hours
$7,500,000 / 25,000 OR Hours Billed$7,500,000 / 25,000 OR Hours Billed
= =
$300/hr. $300/hr.
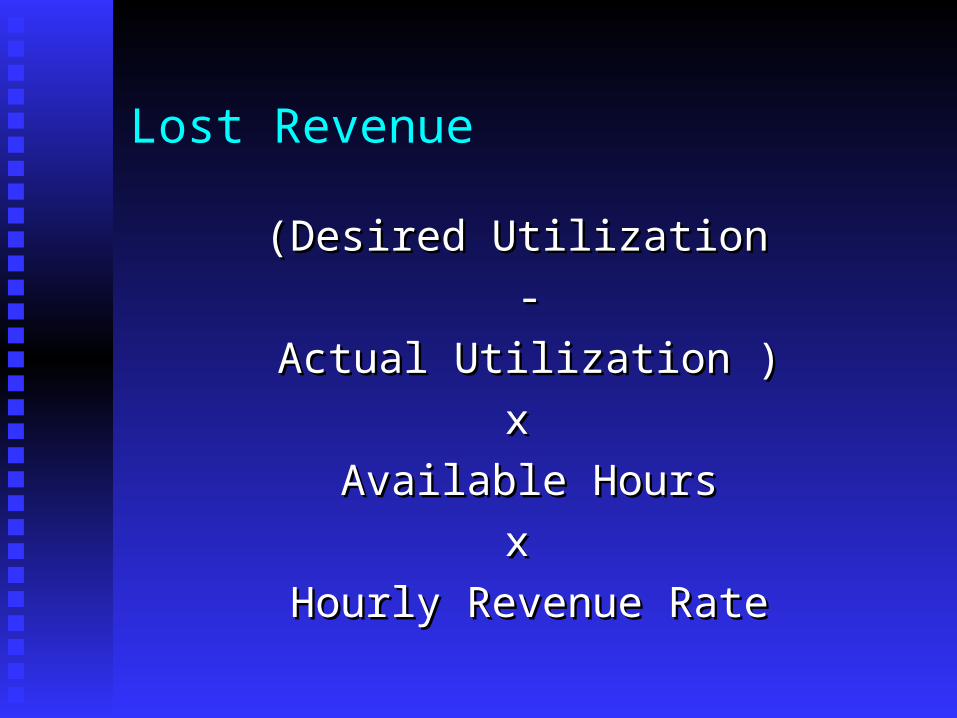
Lost Revenue
(Desired Utilization (Desired Utilization
--
Actual Utilization )Actual Utilization )
x x
Available HoursAvailable Hours
x x
Hourly Revenue RateHourly Revenue Rate

Lost Revenue- Example
(80% - 58.75%) (80% - 58.75%) xx
40,000 Available Hours40,000 Available Hoursxx
$300/hr.$300/hr.==
$2,544,000 Lost$2,544,000 Lost
21.25%21.25%
8,480 hours8,480 hours
Actually $2,248,436 Actually $2,248,436 when accounting for when accounting for turnover between turnover between additional casesadditional cases
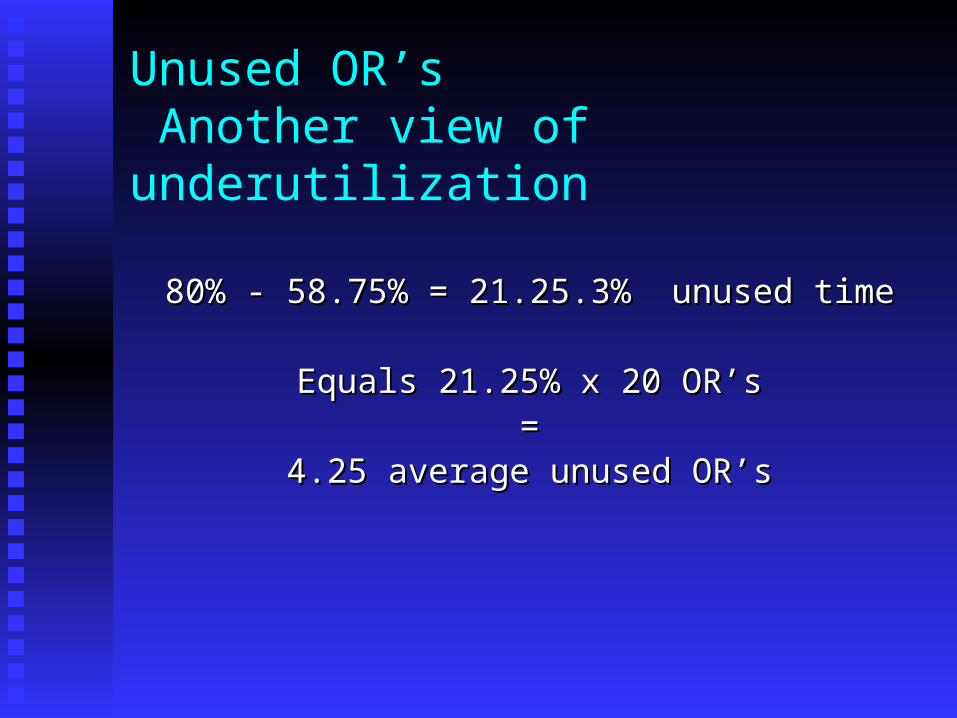
Unused OR’s Another view of underutilization
80% - 58.75% = 21.25.3% unused time80% - 58.75% = 21.25.3% unused time
Equals 21.25% x 20 OR’sEquals 21.25% x 20 OR’s==
4.25 average unused OR’s4.25 average unused OR’s

Desired Utilization
Literature = 75%-85% possibleLiterature = 75%-85% possible
Analyze Busiest DaysAnalyze Busiest Days 10 days of year with largest number of 10 days of year with largest number of
casescases
Analyze Busiest OR’sAnalyze Busiest OR’s
HISTORICAL UTILIZATION
Total Before Before 3:00 Date Cases Hours 3:00 pm Utilization
01/08/04 25 53.02 45.10 43.0%01/09/04 42 95.03 73.55 70.0%01/12/04 27 74.78 56.83 58.0%01/13/04 39 105.03 75.32 71.7%01/14/04 43 96.55 81.13 77.3%███01/15/04 35 94.10 76.11 72.5%01/16/04 39 82.21 61.94 59.0%01/19/04 28 88.55 72.74 74.2%01/20/04 26 58.99 52.08 49.6%01/21/04 42 88.74 72.09 68.7%01/22/04 28 78.82 63.34 60.3%01/23/04 43 92.03 68.33 65.1%01/26/04 41 101.75 80.17 81.8%01/27/04 41 112.28 76.81 73.2%01/28/04 38 86.44 68.04 64.8%01/29/04 43 107.44 83.17 79.2%---------------------------------------------------------HIGHEST UTILIZATION DAYS:
03/02/04 85.9 05/05/04 90.2 08/18/04 91.8

Problem
Suboptimal Utilization RepresentsSuboptimal Utilization RepresentsLost Opportunity for Anesthesiologists to Work and Lost Opportunity for Anesthesiologists to Work and
Bill. Bill.
Because . . . . Because . . . .

Problem
. . . . Anesthesia personnel costs are directly . . . . Anesthesia personnel costs are directly related to number of operating rooms related to number of operating rooms
covered, covered,
notnot
number of hours billed. number of hours billed.
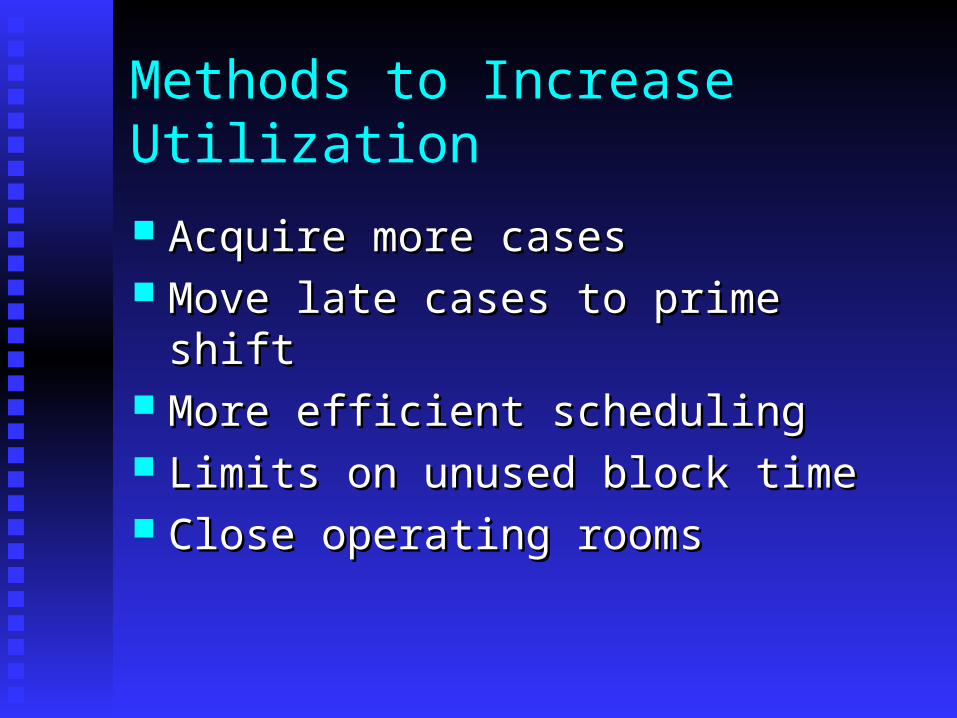
Methods to Increase Utilization
Acquire more casesAcquire more cases Move late cases to prime shiftMove late cases to prime shift More efficient schedulingMore efficient scheduling Limits on unused block timeLimits on unused block time Close operating roomsClose operating rooms
Some Reasons for Low Utilization
Surgeon PreferenceSurgeon Preference Hospital Policy/ProblemsHospital Policy/Problems

Reasons for Low Utilization- Surgeon Preference
Block Time that is underused and not Block Time that is underused and not releasedreleased
Ability to Schedule without delayAbility to Schedule without delay Want to work lateWant to work late Want to work earlyWant to work early Habitually lateHabitually late
Reasons for Low Utilization-Hospital Policy
Hospitals should want high utilization to Hospitals should want high utilization to minimize personnel and other costs. minimize personnel and other costs.
But . . . . . .But . . . . . .

Reasons for Low Utilization-Hospital Policy
In a competitive local environmentIn a competitive local environment:: Attract Surgeons with:Attract Surgeons with:
Plenty of available OR timePlenty of available OR time Liberal Block SchedulingLiberal Block Scheduling Early and Late StartsEarly and Late Starts
Concern with Market Share and Loss of Concern with Market Share and Loss of Surgeons to Other FacilitiesSurgeons to Other Facilities

Reasons for Low Utilization-Other Hospital Reasons
Some procedures are so profitable that low Some procedures are so profitable that low utilization is irrelevant to hospital.utilization is irrelevant to hospital.
Poor OR Management Poor OR Management Personnel Problems Personnel Problems Bad Scheduling/Information Management Bad Scheduling/Information Management
SystemsSystems

Bottom Line for Anesthesiologists
OR Utilization is largely not controllable by OR Utilization is largely not controllable by anesthesiologists. anesthesiologists.
But, anesthesiologists suffer financially for But, anesthesiologists suffer financially for low OR utilizationlow OR utilization

Bottom Line for Anesthesiologists
Because the costs to staff the OR suite during Because the costs to staff the OR suite during the prime shift is fixed,the prime shift is fixed,
revenue lost by OR underutilization comes revenue lost by OR underutilization comes directly from the anesthesiologists’directly from the anesthesiologists’
W-2 compensation. W-2 compensation.

If Underutilization is a Financial Problem,
The Next Steps . . .

Present the situation to members of the Present the situation to members of the
anesthesiology group. anesthesiology group.
Present the case to hospital administration. Present the case to hospital administration.
Analyze Alternative Scenarios:Analyze Alternative Scenarios:
Obtain Financial SupportObtain Financial SupportChange OR AllocationChange OR Allocation

The OR Utilization Spreadsheet
ASA NewsletterASA NewsletterPractice Management DepartmentPractice Management Department
June 2004June 2004 September 2004September 2004
Download Spreadsheet from ASA Web Site:Download Spreadsheet from ASA Web Site:
http://www.asahq.org/Newsletters/2004/09_04/pracMgmt09_04.htmlhttp://www.asahq.org/Newsletters/2004/09_04/pracMgmt09_04.html