minimizing energy for wireless web access with bounded
TRANSCRIPT
Minimizing Energy for Wireless Web Access withBounded Slowdown
Ronny Krashinsky and Hari BalakrishnanMIT Laboratory for Computer Science
200 Technology Square, Cambridge, MA 02139� ronny, hari � @lcs.mit.edu
AbstractOn many battery-powered mobile computing devices, thewireless network is a significant contributor to the total en-ergy consumption. In this paper, we investigate the in-teraction between energy-saving protocols and TCP perfor-mance for Web-like transfers. We show that the popularIEEE 802.11 power-saving mode (PSM), a “static” protocol,can harm performance by increasing fast round trip times(RTTs) to 100 ms; and that under typical Web browsing work-loads, current implementations will unnecessarily spend en-ergy waking up during long idle periods.
To overcome these problems, we present the Bounded-Slowdown (BSD) protocol, a PSM that dynamically adapts tonetwork activity. BSD is an optimal solution to the prob-lem of minimizing energy consumption while guaranteeingthat a connection’s RTT does not increase by more than afactor � over its base RTT, where � is a protocol parameterthat exposes the trade-off between minimizing energy andreducing latency. We present several trace-driven simula-tion results that show that, compared to a static PSM, theBounded-Slowdown protocol reduces average Web page re-trieval times by 5–64%, while simultaneously reducing energyconsumption by 1–14% (and by ����� compared to no powermanagement).
Categories and Subject DescriptorsC.2.1 [Computer-Communication Networks]: NetworkArchitecture and Design—Wireless communication; C.2.5[Computer-Communication Networks]: Local and Wide-Area Networks—Internet
General TermsAlgorithms, Design, Measurement, Performance.
KeywordsWireless, protocols, energy saving, power saving, boundedslowdown, IEEE 802.11, TCP, HTTP, Web.
Permission to make digital or hard copies of all or part of this work forpersonal or classroom use is granted without fee provided that copies arenot made or distributed for profit or commercial advantage and that copiesbear this notice and the full citation on the first page. To copy otherwise, torepublish, to post on servers or to redistribute to lists, requires prior specificpermission and/or a fee.MOBICOM’02, September 23–28, 2002, Atlanta, Georgia, USA.Copyright 2002 ACM 1-58113-486-X/02/0009 ...$5.00.
1. IntroductionThe capabilities of mobile computing devices are often lim-
ited by the size and lifetime of the batteries that power them.As a result, minimizing the energy usage of every compo-nent in a mobile system is an important design goal. Wirelessnetwork access is a fundamental enabling feature for manyportable computers, but if not optimized for power con-sumption, the wireless network interface can quickly draina device’s batteries. This paper seeks to minimize the energyconsumed by the wireless network interface for a mobile de-vice generating request/response traffic (e.g., while brows-ing the Web) over a reliable transport protocol such as TCP.We investigate several interactions between energy-savingmechanisms and network performance, and show that un-derstanding these interactions enables better energy-savingprotocols to be designed that have provable performance-energy trade-offs.
Many wireless network interfaces, especially wirelessLAN cards, consume a significant amount of energy not onlywhile sending and receiving data, but also when they are idlewith their radios powered up and able to communicate [3, 5,7, 11, 15]. However, because wireless applications typicallyuse the network in bursts, wireless interfaces are designed sothey can be disabled when not in use to save energy. In thissleep mode, the radio is turned off, and the device has no wayto determine when data is being sent to it over the wirelessnetwork link. This breaks the “always on” abstraction con-venient for transport protocols such as TCP, where a nodeshould be able to receive data from the network at any time.Therefore, any energy-saving protocol that puts the networkinterface in sleep mode must have a mechanism to handlethe resulting communication outage.
As an example, consider the popular IEEE 802.11 wirelessLAN specification, which describes a power-saving mode(PSM) that periodically turns the network interface off tosave energy, and on to communicate [9]. In the so-called in-frastructure mode (as opposed to the ad hoc network mode),a mobile device communicates with a wired access point(AP). When 802.11 PSM is enabled, the AP buffers datadestined for the device. Once every BeaconPeriod, typically100 ms, the AP sends a beacon containing a traffic indicationmap (TIM) that indicates whether or not the mobile devicehas any data waiting for it. The mobile device wakes up tolisten to beacons at a fixed frequency and polls the AP to re-ceive any buffered data. Typically, it listens to every bea-con, but the mobile device can also be configured to skip Lis-tenInterval beacons between listen times. Whenever the APsends data to the mobile device, it indicates whether or not
1

there is more data outstanding, and the mobile device goesto sleep only when it has retrieved all pending data from theAP. When the mobile device itself has data to send, it canwake up to send the data without waiting for a beacon.
The 802.11 PSM is an example of a static power-saving al-gorithm, since it does not adapt the sleep and awake dura-tions to the degree of network activity; we will refer to itas PSM-static in this paper. We find that while PSM-staticdoes quite well in saving energy, it does so at significant per-formance cost. In Section 2, we demonstrate that the roundtrip time (RTT) of a TCP connection can increase substan-tially with PSM-static, since the effect is to round up the RTTto the nearest 100 ms. This has an especially adverse impacton short TCP connections, whose performance is dominatedby the connection RTT. We also find that an interesting inver-sion effect can occur, where under some conditions, the timeto transfer a file over a wireless network running PSM-staticincreases when the bandwidth of the wireless link increases!Furthermore, with PSM-static, the power consumed whilesleeping and listening for beacons dominates the total en-ergy consumption if the network is accessed only sporadi-cally. Section 3 shows that for Web workloads, the long (butrandomly distributed) idle periods (“think time”) end up be-ing most important in terms of energy usage, and that PSM-static does not handle this situation well.
A PSM protocol addresses the following fundamentalquestion: When should a wireless interface go to sleep, and whenshould it be awake? Based on our observations of the adverseand unexpected interactions that occur when a TCP connec-tion is superimposed on PSM-static, we consider the prob-lem of optimizing energy consumption under the constraintthat interactive request/response performance does not de-grade by more than a known amount. Specifically, we ad-dress the following problem: Find an algorithm that minimizesenergy consumption using the sleep and wake-up primitives suchthat any RTT does not exceed � ��� ������� , where � is the origi-nal RTT and � is a tunable parameter that controls the maximumpercentage slowdown.
Our solution to this problem results in the Bounded-Slowdown (BSD) protocol, described in Section 4. The idea is toadapt the sleep durations depending on past activity, so thatno RTT is lengthened by more than a factor � , which exposesthe performance-energy trade-off in a provable manner. Thisalso allows the network interface to sleep for longer periodsof time when there is no activity, thereby reducing the energyconsumed while listening to beacons. In fact, for future net-work cards, this method could allow the network interface togo into a deeper sleep mode and save more energy.
Section 5 presents trace-driven simulations, using powerparameters from a commercially available 802.11b card, toevaluate the effectiveness of the BSD protocol as a functionof � and compare it to PSM-static for real-world Web traffic.We find that BSD tightly bounds the performance slowdownof Web retrieval times in all cases, and also often beats PSM-static in terms of energy consumption. For example, PSM-static reduces energy by � � � compared to no PSM, but doesthis at the cost of increasing average Web page retrieval timesby 16–232% for network round trip times of 80 ms down to10 ms. When � ��� , BSD increases average Web page re-trieval times by only 11–19% over the base performance withno PSM, and simultaneously uses 1–14% less energy thanPSM-static (and up to � � � less than no PSM)—both its per-formance and energy usage are always better than the 802.11
PSM. When ��� �� � , the BSD protocol essentially eliminatesthe slowdown in Web page retrieval times while only usingup to 13% more energy than PSM-static.
The performance benefits of BSD over PSM-static are mostsignificant when the TCP connection RTT is much smallerthan 100 ms (the beacon period). We note that with the in-creasing deployment of Web content distribution networks(CDNs), server replication systems, Web proxies, and caches,the RTT for Web TCP connections is often small, especiallyfor popular sites where CDNs and replica abound. For exam-ple, from both MIT on the east coast of the U.S., and Berke-ley on the west coast, RTTs to several popular sites such asGoogle, Yahoo, CNN, etc. are less than 30 ms most of thetime. In another common wireless network scenario, usersoften transfer or synchronize files (e.g., email) between a mo-bile device and a local server, and the base connection RTT isa few milliseconds. Although the performance of PSM-staticcould be improved by reducing the 100 ms beacon period,this would lead to significantly higher energy consumption(we discuss this in Section 5.3). We therefore believe that be-cause of the trend toward smaller connection RTTs, the BSDprotocol will be especially useful in bounding performanceslowdown while saving considerable energy.
We discuss related work in Section 6 and conclude with asummary of our results in Section 7.
2. TCP Performance over PSM-staticTCP is the transport layer of choice for the majority of In-
ternet applications. Its performance is therefore a critical con-sideration in the design of any network component. This sec-tion evaluates the impact of PSM-static on TCP performance.
During the initial slow-start phase of a TCP connection,the RTT dominates the overall transfer time for data. Sincemost TCP connections on the Internet are smaller than a fewtens of kilobytes [8, 13], RTTs are a critical determinant ofWeb browsing performance. In this section, we analyze theimpact that PSM-static has on the first RTT of a connection,then investigate the impact of PSM-static on RTTs for subse-quent packets in a TCP transfer, then present experimentalmeasurements of TCP transfers, and finally discuss an emer-gent performance inversion effect caused by PSM-static.
2.1 PSM-static Impact on RTTWith PSM-static enabled, the network interface enters a
sleep state whenever it is not sending or receiving data.When the mobile device has data to send (e.g., a TCP SYNor ACK packet, a TCP data packet containing a Web request,etc.), it can wake the network interface up at any time. How-ever, the network interface will go to sleep as soon as thisdata has been transmitted to the AP. When the response dataarrives from the server after some delay, it must be bufferedat the AP until the next beacon occurs. This delay increasesthe observed RTT for the connection.
If the mobile device initiates a request/response transac-tion, the observed RTT depends on when it sends the requestdata relative to the beacon period. For example, with an ac-tual RTT of 20 ms and a beacon period of 100 ms, if the mobiledevice sends the request immediately after a beacon, the re-sponse will be buffered at the AP and received after the nextbeacon; thus the observed RTT will be 100 ms. If the mobiledevice sends the request 79 ms after a beacon, the AP willreceive the response just before the next beacon and the ob-served RTT will be just over 20 ms. However, if the mobile
2
0 50 1000
50
100
150
200
250
obse
rved
RT
T (
ms)
actual RTT = 20 ms
0 50 1000
50
100
150
200
250
request time after beacon (ms)
actual RTT = 80 ms
0 50 1000
50
100
150
200
250actual RTT = 120 ms
0 50 1001
2
3
4
5
6
RT
T s
low
dow
n
0 50 1001
2
3
4
5
6
request time after beacon (ms)0 50 100
1
2
3
4
5
6
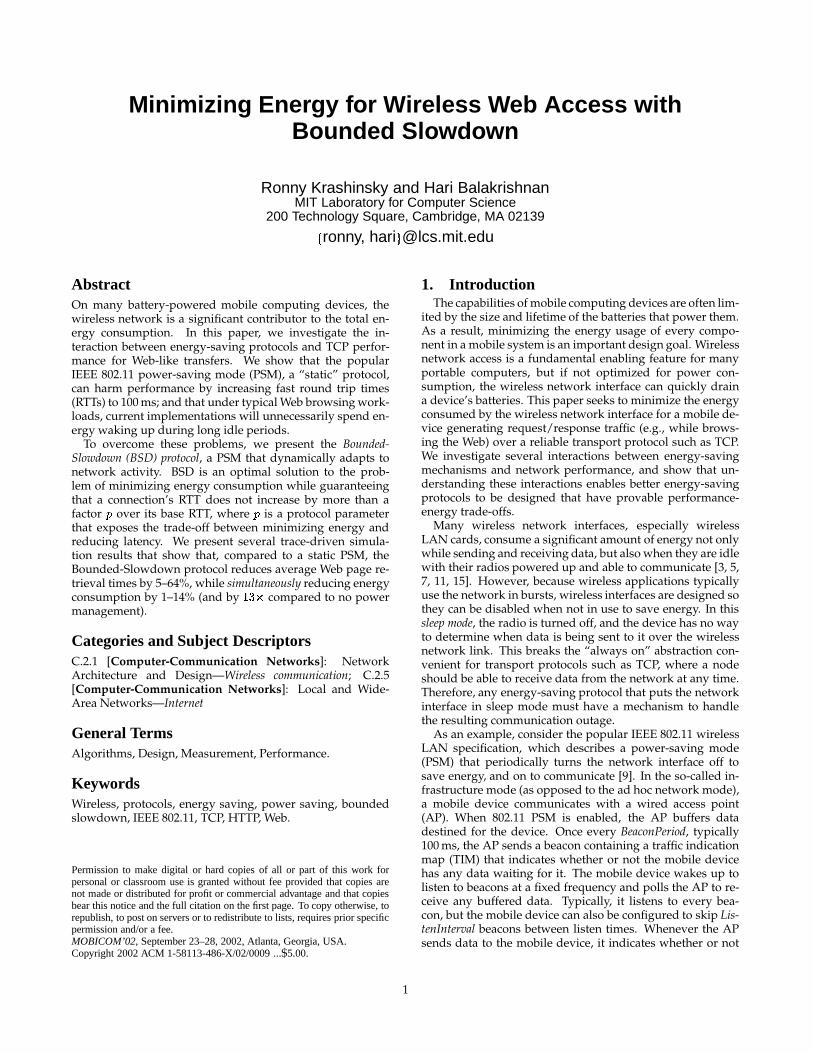
Figure 1: Slowdown due to PSM-static (the 802.11 PSM)for the first RTT of a TCP connection. The upper graphsshow how the observed RTTs vary with how long after abeacon the request is sent. The lower graphs show the RTTslowdown (the observed RTT divided by the actual RTT).
0 50 100 150 200 250 3000
100
200
300
actual RTT (ms)
obse
rved
RT
T (
ms)
0 50 100 150 200 250 3001
10
100
actual RTT (ms)
RT
T s
low
dow
n
5ms 80ms50ms
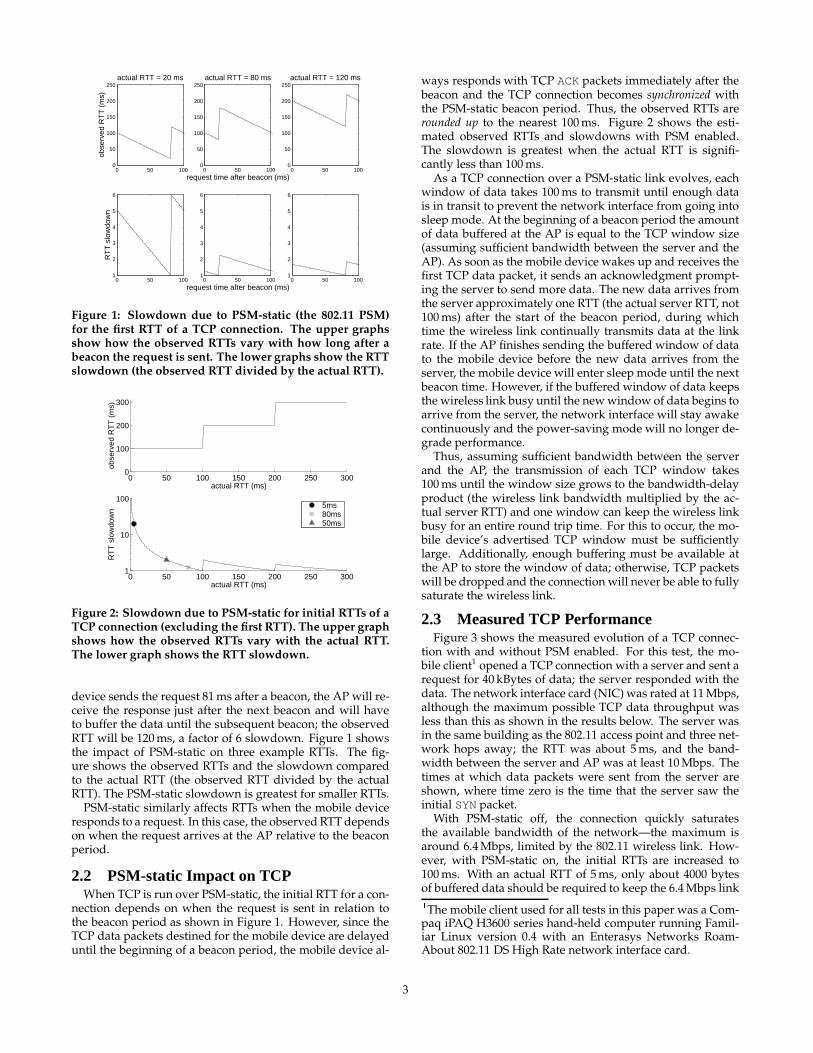
Figure 2: Slowdown due to PSM-static for initial RTTs of aTCP connection (excluding the first RTT). The upper graphshows how the observed RTTs vary with the actual RTT.The lower graph shows the RTT slowdown.
device sends the request 81 ms after a beacon, the AP will re-ceive the response just after the next beacon and will haveto buffer the data until the subsequent beacon; the observedRTT will be 120 ms, a factor of 6 slowdown. Figure 1 showsthe impact of PSM-static on three example RTTs. The fig-ure shows the observed RTTs and the slowdown comparedto the actual RTT (the observed RTT divided by the actualRTT). The PSM-static slowdown is greatest for smaller RTTs.
PSM-static similarly affects RTTs when the mobile deviceresponds to a request. In this case, the observed RTT dependson when the request arrives at the AP relative to the beaconperiod.
2.2 PSM-static Impact on TCPWhen TCP is run over PSM-static, the initial RTT for a con-
nection depends on when the request is sent in relation tothe beacon period as shown in Figure 1. However, since theTCP data packets destined for the mobile device are delayeduntil the beginning of a beacon period, the mobile device al-
ways responds with TCP ACK packets immediately after thebeacon and the TCP connection becomes synchronized withthe PSM-static beacon period. Thus, the observed RTTs arerounded up to the nearest 100 ms. Figure 2 shows the esti-mated observed RTTs and slowdowns with PSM enabled.The slowdown is greatest when the actual RTT is signifi-cantly less than 100 ms.
As a TCP connection over a PSM-static link evolves, eachwindow of data takes 100 ms to transmit until enough datais in transit to prevent the network interface from going intosleep mode. At the beginning of a beacon period the amountof data buffered at the AP is equal to the TCP window size(assuming sufficient bandwidth between the server and theAP). As soon as the mobile device wakes up and receives thefirst TCP data packet, it sends an acknowledgment prompt-ing the server to send more data. The new data arrives fromthe server approximately one RTT (the actual server RTT, not100 ms) after the start of the beacon period, during whichtime the wireless link continually transmits data at the linkrate. If the AP finishes sending the buffered window of datato the mobile device before the new data arrives from theserver, the mobile device will enter sleep mode until the nextbeacon time. However, if the buffered window of data keepsthe wireless link busy until the new window of data begins toarrive from the server, the network interface will stay awakecontinuously and the power-saving mode will no longer de-grade performance.
Thus, assuming sufficient bandwidth between the serverand the AP, the transmission of each TCP window takes100 ms until the window size grows to the bandwidth-delayproduct (the wireless link bandwidth multiplied by the ac-tual server RTT) and one window can keep the wireless linkbusy for an entire round trip time. For this to occur, the mo-bile device’s advertised TCP window must be sufficientlylarge. Additionally, enough buffering must be available atthe AP to store the window of data; otherwise, TCP packetswill be dropped and the connection will never be able to fullysaturate the wireless link.
2.3 Measured TCP PerformanceFigure 3 shows the measured evolution of a TCP connec-
tion with and without PSM enabled. For this test, the mo-bile client1 opened a TCP connection with a server and sent arequest for 40 kBytes of data; the server responded with thedata. The network interface card (NIC) was rated at 11 Mbps,although the maximum possible TCP data throughput wasless than this as shown in the results below. The server wasin the same building as the 802.11 access point and three net-work hops away; the RTT was about 5 ms, and the band-width between the server and AP was at least 10 Mbps. Thetimes at which data packets were sent from the server areshown, where time zero is the time that the server saw theinitial SYN packet.
With PSM-static off, the connection quickly saturatesthe available bandwidth of the network—the maximum isaround 6.4 Mbps, limited by the 802.11 wireless link. How-ever, with PSM-static on, the initial RTTs are increased to100 ms. With an actual RTT of 5 ms, only about 4000 bytesof buffered data should be required to keep the 6.4 Mbps link
�
The mobile client used for all tests in this paper was a Com-paq iPAQ H3600 series hand-held computer running Famil-iar Linux version 0.4 with an Enterasys Networks Roam-About 802.11 DS High Rate network interface card.
3

0 0.1 0.2 0.3 0.40
10
20
30
40
time (s)
sequ
ence
num
ber
(kB
)
PSM offPSM on
Figure 3: Measured evolution of aTCP connection with and withoutPSM enabled.
1B 8B 64B 1KB 8KB 64KB 1MB
10ms
100ms
1s
10s
transfer size
tran
sfer
tim
e
5ms, 10Mbps, PSM off 5ms, 10Mbps, PSM on 80ms, 10Mbps, PSM off80ms, 10Mbps, PSM on 50ms, 70Kbps, PSM off50ms, 70Kbps, PSM on
Figure 4: Measured data transfer sizevs. transfer time for request/responsetransactions over TCP with variousservers and PSM on and off. Bothaxes use log scale.
1B 8B 64B 1KB 8KB 64KB 1MB1
2
4
6
810
20
transfer size
PS
M s
low
dow
n
5ms, 10Mbps 80ms, 10Mbps50ms, 70Kbps
Figure 5: PSM slowdown from Fig-ure 4. Both axes use log scale.
busy for long enough to allow the next window of data to be-gin arriving from the server and prevent the network inter-face from going to sleep. As shown in Figure 3, this happensafter the third 100 ms RTT when the TCP window grows to 4packets (about 6000 bytes). Since this connection has a shortserver RTT and small bandwidth-delay product, it is close tothe best-case scenario for PSM-static in terms of saturatingthe link in the fewest number of 100 ms RTTs.
In another test of PSM-static, the mobile client opens a TCPconnection to a server and sends a request for some numberof bytes; the server responds by sending the requested blockof data. By doing this for power-of-two data transfer sizesbetween 1 Byte and 4 MBytes, we determined the relation-ship between data transfer size and transfer time. The clientused was the same iPAQ device. The server was run on var-ious machines to evaluate different network characteristics.The first server was in the same building and three networkhops away from the AP; the RTT was 5 ms, and the band-width was at least 10 Mbps. The second server was locatedaround 3000 miles and 20 network hops away and had a highbandwidth network path to the AP; the RTT was 80 ms andthe bandwidth was at least 10 Mbps. The third server was lo-cated around 3 miles and 8 network hops away and behinda DSL network connection; it had a 50 ms RTT and outgoingbandwidth of 70 Kbps. Each performance test was run tentimes alternating between PSM on and PSM off (five testseach). The results showed no significant variations betweenruns, and the mean values are presented.
Figure 4 shows the total transfer time (including the re-quest and response) as a function of data transfer size foreach server with both PSM on and PSM off. Figure 5 presentsanother view of the same data; it shows the slowdown in-curred using PSM. For small data transfer sizes the entire re-sponse fits in one or two TCP data packets, and the total timefor the transaction is equal to two RTTs—during the first RTTthe client sends a SYN packet to the server, and the server re-sponds with a SYN+ACK packet; during the second RTT theclient sends the request to the server and it responds withup to two data packets. With PSM off, the transfer time isdetermined by the RTT to each server; however, with PSMon, the transfer times are 200 ms regardless of the server. Theobserved slowdowns match those predicted by Figure 2.
The transfer times for the low-bandwidth (70 Kbps) server
become bandwidth-limited even before the transfer requiresmore than one RTT. For the high-bandwidth servers, thetransfer times begin to take multiple RTTs as the data trans-fer size increases and eventually become bandwidth-limited;the maximum bandwidth achieved was about 4.9 Mbps.With PSM on, the maximum bandwidth achieved was about3.4 Mbps. Apparently, the maximum bandwidth is limitedby the overhead incurred by the PSM signaling; a close lookat Figure 3 reveals that the data packet spacing in steady stateis slightly higher with PSM on.
In some cases, the mobile device sends data to a remotemachine rather than vice-versa; for example, this occurs if amobile user is uploading a file, serving data in a peer-to-peerapplication, running a Web server, etc. In this case, PSM-static causes the TCP ACKs to be delayed instead of the datapackets. We ran the same performance test with the mobiledevice configured as the server, and a machine on the 5 ms,10 Mbps network configured as the client. The results wereessentially identical to those obtained when the mobile de-vice was the client.
The main finding from these measurements is that the100 ms sleep interval used in PSM-static is too coarse-grainedto maintain good performance, especially for short TCP datatransfers that are dominated by RTTs.
2.4 Performance InversionSomewhat paradoxically, TCP may achieve higher through-
put over a lower bandwidth PSM-static link, resulting in per-formance inversion! As discussed in Section 2.2 and shownin Figure 3, PSM-static causes the transmission of each TCPwindow to take 100 ms until the window size grows to theproduct of the wireless link bandwidth and the network RTTdelay between the mobile device and the server. Therefore,a lower bandwidth PSM-static link will become saturatedsooner and prevent the network interface from entering sleepmode. Figure 6 shows simulation data that demonstrates thisbehavior.2 The figure shows the transfer times versus thewireless link bandwidth for various server RTTs, both withand without PSM and for data transfers of 10 KBytes and1 MByte. The AP to server bandwidth was set to 100 Mbps.
Figure 6 shows that a 1 Mbps wireless link is faster than�
The simulation methodology is described in Section 5.1.
4

0 5 10 15 200
0.1
0.2
0.3
0.4
0.5
0.610 KB, PSM off
time
(s)
0 5 10 15 200
2
4
6
8
101 MB, PSM off
80ms40ms20ms10ms
0 5 10 15 200
0.1
0.2
0.3
0.4
0.5
0.610 KB, PSM on
bandwidth (Mbps)
time
(s)
0 5 10 15 200
2
4
6
8
101 MB, PSM on
bandwidth (Mbps)
Figure 6: TCP request/response transfer times versus wire-less link bandwidth for various server RTTs. The leftgraphs represent a 10 KB data transfer, and the right graphsrepresent a 1 MB data transfer. The upper graphs showtransfers with PSM off, and the lower graphs show trans-fers with PSM on. Paradoxically, in some cases the transfertimes are shorter with a lower bandwidth PSM-static link.
higher bandwidth links for a 10 KB data transfer. With a10 ms server RTT, the connection has a bandwidth-delayproduct of 1,250 bytes (10,000 bits). Therefore, it becomessaturated during the initial TCP round trips, and the PSMstops putting the network interface into sleep mode; the re-quest/response transaction takes just over 3 round trip times(300 ms). For wireless link bandwidths greater than 3 Mbps,or for server RTTs greater than 20 ms, the TCP window nevergrows to the bandwidth-delay product (or does so only onthe last round-trip), and the request/response transaction al-ways takes about 5 round trip times (500 ms).
The 1 MByte transfer size demonstrates an interesting in-teraction between TCP and PSM-static. Whenever the re-ceiver’s advertised maximum TCP window size is not largeenough to keep the wireless link busy for an entire RTT, thethroughput is limited to one maximum TCP window perbeacon period. For the simulations, the mobile device’s ad-vertised window is 20 TCP packets (1,500 bytes each), orabout 240 kbits, and one maximum window per 100 ms bea-con period is equivalent to 2.4 Mbps. The bandwidth-delayproduct for a 20 ms server RTT crosses the 240 kbits thresholdwhen the wireless link bandwidth increases from 11 Mbpsto 12 Mbps, and for a 40 ms server RTT when the wirelesslink bandwidth increases from 5 Mbps to 6 Mbps. Once theycross this threshold, the transfer times increase sharply to4.1 s, an average throughput of 2.05 Mbps. This shows anunexpected, emergent interaction between TCP and PSM-static. With long server RTTs, the receiver’s advertised TCPwindow limits performance even with PSM off (e.g., thethroughput saturates at about 2.5 Mbps for an 80 ms serverRTT), but it does not lead to the performance inversion.
These results also demonstrate that, if PSM-static is used,absolute performance may degrade if the wireless link band-width increases (e.g., with 802.11a).
3. Client Network Usage CharacteristicsIn optimizing a network access protocol to minimize
power consumption, it is important to consider how clientsuse the network. Since there is a trade-off between the extentto which power consumption is minimized in sleep modeand how long it takes to wake up (and also how much en-ergy the transition takes) [1, 14], the sleep duration deter-mines how low the power consumption can be. In addition,waking up to listen to beacons consumes energy; the listeninterval determines the significance of this overhead.
To evaluate the characteristics of client network usage, weanalyzed client Web traffic from the UC Berkeley Home IP di-alup service traces [8]. The network activity for these tracesis dominated by long transfer times over the slow modemlinks, but certain aspects are relevant to general client usagepatterns. In particular, the time that clients spend idle (pre-sumably due to user “think time”) or waiting for responsesfrom servers present opportunities for the network interfaceto enter a sleep mode, and these times are probably not crit-ically dependent on the bandwidth of the client’s networklink.
In analyzing the traces, we tracked each client’s state asone of:
wait-for-server: the client has one or more out-standing requests, but is not receiving anyresponses
receive-response: the client is receiving one ormore responses
inactive: the client has no outstanding requestsand is not receiving any responses (this in-cludes both user “think time” and browserprocessing time)
Figure 7 shows the cumulative distribution function (CDF)for the client wait-for-server times. The solid line shows thepercentage of wait-for-server events that last for less than agiven elapsed time. The dashed line shows the percentageof the total wait-for-server time that is spent in these events.For example, 88% of all wait-for-server events take less than1 s, and these events account for 19% of the total time spentin all wait-for-server events.
Figure 8 shows the CDF for the client inactive times. Thesolid and dashed lines are as in Figure 7. However, in thetraces many clients have no activity over a period of severaldays; if this data is included these inactive times completelydominate the total inactive time (as shown by the dotted linewhich is barely visible above the x-axis). Therefore, inactiveevents longer than 1000 s (around 2% of all inactive events)were excluded from the total inactive time represented bythe dashed line. The figure indicates that 26% of all inactiveevents take less than 1 s, and these events account for 0.5% ofthe total inactive time. If only inactive events less than 100 sare included (versus 1000 s as shown in Figure 8), the inactiveevents less than 1 s account for 1.1% of the total; and if onlyinactive events less than 10 s are included, the inactive eventsless than 1 s account for 6.8% of the total.
For completeness, Figure 9 shows the CDF for the clientreceive-response times. Since the clients use slow modemlinks, long transfer times are the norm. The prevalence ofreceive-response times less than 0.1 s is presumably due toresponses that fit in one TCP packet.
The important point about these results is that althoughmost wait-for-server and inactive events are of short dura-
5

0.1 1 10 100 10000
10
20
30
40
50
60
70
80
90
100
elapsed time (s)
CD
F
all wait−for−server eventstotal wait−for−server time
Figure 7: CDF for client wait-for-server events and total wait-for-server time.
0.1 1 10 100 10000
10
20
30
40
50
60
70
80
90
100
elapsed time (s)
CD
F
all inactive events total inactive time (< 1000s)total inactive time
Figure 8: CDF for client inactiveevents and total inactive time.
0.1 1 10 100 10000
10
20
30
40
50
60
70
80
90
100
elapsed time (s)
CD
F
all recv events total recv time (< 1000s)total recv time
Figure 9: CDF for client receive-response events and total receive-response time.
tion, long latency events account for most of the total wait-for-server and inactive times. For example, over 80% of thetotal wait-for-server time and virtually all of the total inac-tive time is spent in events longer than 1 s. This holds trueeven when inactive times longer than 100 s or even 10 s areexcluded. Since the energy spent by a network interface in itspower-saving sleep mode is directly proportional to the sleepduration, this finding indicates that wait-for-server and inac-tive periods longer than 1 s account for most of the networkinterface sleep energy. Thus, considering that it requires thenetwork interface to perform the energy-consuming oper-ation of waking up to receive a beacon every 100 ms, the802.11 PSM seems too fine-grained to minimize energy con-sumption effectively.
4. Bounded-Slowdown (BSD) ProtocolSection 2 demonstrated that a static PSM protocol such
as that used by 802.11 can be too coarse-grained to givegood Web performance, while Section 3 demonstrated thatthe same protocol can be too fine-grained to minimize en-ergy. This section presents the BSD protocol that employs anadaptive algorithm to maintain performance while minimiz-ing the energy consumed by a wireless network interface.
In the context of request/response network traffic, a staticPSM protocol guarantees that RTTs are not delayed by morethan one beacon period. We claim that this guarantee is in-adequate both in terms of performance and energy consump-tion. Our basic assumption is that, for request/response net-work traffic, the percentage increase in round trip times ismore important than the absolute increase from the perspec-tive of higher-layer protocols and human users. For exam-ple, PSM-static might increase a 40 ms RTT to 100 ms and a9,940 ms RTT to 10,000 ms; the first situation is far worse thanthe second. Although, one might think that keeping roundtrip times under 100 ms is good enough for human percep-tion, the important point is that request/response transac-tions involve multiple additive RTTs. For example, in Section5.2 we show that by increasing a 40 ms RTT to 100 ms, PSM-static more than doubles the time to retrieve many Web pagesthat originally had download times as long as one second.In terms of energy, PSM-static will wake up to listen to 100beacons during a 10 s idle period, in the end ensuring thata 10 s RTT is not increased by more than 1%. If a 10% slow-down is acceptable, the energy spent listening to beacons canbe reduced by an order of magnitude.
Motivated by these observations, we seek a protocol that
consumes the minimum possible energy while guaranteeingthat round trip times do not increase by more than a givenpercentage. In contrast to a static protocol, our algorithmmust dynamically adapt to network activity. To avoid delay-ing very fast RTTs, the network interface can stay awake for ashort period of time after the link is active. Then, to consumeless energy listening to beacons, it can back off and listen tofewer beacons when there is no network activity.
A constraint on our power-saving protocol is that it mustoperate completely at the link layer with no higher-layerknowledge. Since it does not know whether particular blocksof data actually comprise a request or response, it shouldconservatively assume that any data sent from the mobile de-vice is a request and it should not assume a correspondencebetween any particular blocks of send and receive data. Aresult of designing a low-level protocol is that its guaranteesare valid even when different connections share the samenetwork interface; e.g., RTT slowdowns will be boundedeven when the mobile device has multiple TCP connectionsto different servers with different network delays.
Formally, if the base RTT in the absence of PSM is � , thenthe goal is to minimize energy while limiting the observedRTT to � � � ��� � � ; for a specified parameter � � , this limitsthe RTT increase to � � ��� percent. We present an optimalalgorithm that meets this goal. We start with an observationabout sleep durations:
LEMMA 1. If, after sending a request at time ������������� , themobile device has received no response at time �� ����������� , thenthe network interface can go to sleep for a duration up to��� ������������ � ������������ � � � while bounding the RTT slowdownto � � � � � .This is true because for the greatest slowdown, the actualRTT, ���� �������� ��� �������������� � ������������ � , and the observed RTT,����� ��������! � �� �������� � � �� �������� � � ; therefore ����� ��������� #"� � � ��� � ���� �������� .
To minimize energy, an optimal algorithm must clearly al-ways put the network interface into the sleep state as soon aspossible and for as long as possible. However, to bound theslowdown, the mobile device must periodically check withthe AP for buffered data as governed by Lemma 1. Therefore,if (for the moment) we neglect synchronization constraintsbetween the wireless network interface and the AP, we canstate the following theorem:
THEOREM 1. To minimize energy while bounding RTT slow-down to a factor � � � ��� , a network interface should go to sleep
6

20 30
max = 0.9s
0 10
1 second
request
beacon period:
Bounded−Slowdown−100%:
Bounded−Slowdown−50%:
Bounded−Slowdown−20%:
Bounded−Slowdown−10%:
PSM−static:
Figure 11: Schematic representation of PSM-static (the 802.11 PSM) and various Bounded-Slowdown alternatives (labeledas � � � percent). The arrow indicates a request sent by the mobile device, the initial shaded area indicates when BSD staysawake for a set time � ��� ��� � after the request, and the shaded bars indicate when the network interface wakes up to listen tobeacons.
( )awakeAWAKE T
T t − t )(= pcurrent requestsleep
currenttrequestt =
)sleepT(SLEEP
check for andreceive buffered data
upon any send
Figure 10: The BSD Algorithm. After the mobile devicesends any data, the network interface initially stays awakefor � ��� ����� . Then it sleeps for � ��� ����� � � before waking upto check for and receive any buffered data. It repeats thispattern, each time sleeping for the duration since the re-quest was sent multiplied by � . The algorithm is not af-fected by data being received, but it restarts whenever themobile device sends any data (e.g., a TCP ack for data re-ceived). Note that �� ����������� continuously changes to reflectthe current time.
an infinitesimally short period of time after it sends any requestdata, and only wake up to check for response data as governed byLemma 1.
The Bounded-Slowdown algorithm is summarized in Fig-ure 10. For the ideal case with no synchronization con-straints, � ��� ����� is an infinitesimally small positive value. Thealgorithm restarts whenever the mobile device sends newdata; this can never cause Lemma 1 to be violated for a previ-ous request because BSD will check for data more frequentlythan if it did not restart.
Although the ideal algorithm minimizes energy, it resultsin sleep and wake intervals that are of arbitrary length andinfinitesimally small. To use the protocol in a realistic im-plementation, we assume the mobile device and AP are syn-chronized with a fixed beacon period � ��� , as in 802.11 PSM.
Then, � �� ��� � must always be rounded down to a multiple of� ��� . Under these constraints, the mobile device might delayan RTT by up to � ��� the first time it goes to sleep. There-fore, � ��� ����� �� ��� � , so that the mobile device initially staysawake for �� � beacon periods; if the response arrives duringthis time it will be delivered without delay.
Figure 11 shows the behavior of PSM-static and the BSDprotocol for various values of � (these are labeled as � � � �percent). To allow direct comparisons with the 802.11 PSM,we set � ��� to 100 ms. Additionally, in our implementationthe BSD protocol sets the maximum sleep duration to 0.9 s toavoid TCP timeouts.3 Considering one example in Figure 11,when � � � (20%), � ��� ����� �� ��� � �� � ���� , so the net-work interface stays awake for half a second after the mobiledevice sends a request. Then, it begins sleeping and wakingup to listen to every beacon while � �� ��� � is rounded down to100 ms. After a second has elapsed since the request, � �� ��� �is 200 ms, so it sleeps for two beacon periods, and so on.
We note that this algorithm is slightly conservative in itsassumption that an RTT might be delayed by � ��� the firsttime the mobile device goes to sleep. The maximum de-lay will actually be less than this if the mobile device goesto sleep in the middle of a beacon period, but it would bedifficult for a practical implementation to calculate the exactrelationship between ������������� and the beacon period. There-fore, our algorithm conservatively assumes that � ����������� oc-curs just after a beacon and always stays awake for a set pe-riod of time. This assumption does not alter the correctness(in terms of the RTT bound) of the algorithm since it neverviolates Lemma 1.
Updating the existing 802.11 MAC to support the BSD pro-tocol should be fairly straightforward. One difference is thatinstead of going to sleep immediately after sending data to�Increasing the maximum sleep duration would only serve
to further reduce the energy spent listening to beacons. How-ever, as shown in Section 5.1, this would not lead to worth-while overall energy reduction with current 802.11 networkcards since the sleep energy dominates the listen energy fora 0.9 s sleep interval.
7
the AP, the mobile device stays awake for a set period of time.To ensure that the AP forwards data to the mobile devicewithout delay, it could be informed of this time period. Or, itcould always notify the device as soon as data arrives fromthe network instead of waiting for the next beacon; in thiscase the device could retrieve the data if awake. The otherdifference under the BSD protocol is that the mobile devicedoes not listen to beacons at a set interval. The 802.11 speci-fication already allows for a ListenInterval which is differentthan the BeaconPeriod; the only enhancement is to enable theListenInterval to change more dynamically. A potential con-cern is that the amount of buffering required at the AP is nowlarger, since the mobile device listens to fewer beacons; how-ever, since the mobile device stays awake after sending data,it will usually receive responses immediately and thereby re-duce the AP’s overall buffering load. The reduced frequencyof listening to beacons typically occurs when there is littlenetworks activity to the mobile device.
In summary, with the BSD protocol, fast response timesare not delayed, while longer ones are increased by up to aparametrized maximum factor, � � � . Compared to PSM-static, the active energy is increased since the transition tosleep mode is delayed, but the energy spent listening to bea-cons is decreased due to the longer sleep intervals. We notethat the BSD protocol is designed for a mobile device thatinitiates request/response network traffic. As such, it is notappropriate for real-time communication, or for a mobile de-vice that acts as a server and responds to external requests.
5. EvaluationTo analyze the performance and energy impact of PSM-
static, and to evaluate the proposed PSM enhancements, wesimulated a mobile client browsing the Web over a wirelessnetwork link.
5.1 Simulation MethodologyUsing the network simulator ns-2 [17], we modeled a mo-
bile client communicating with an access point over a wire-less link with PSM. Since we were not concerned with manydetails that 802.11 accounts for—such as signal strength,channel contention, node movement, and multicast—wechose not to model the detailed MAC protocol, but insteadmade some simple modifications to the basic link object inns-2. Sleep mode is simulated by deactivating the queue el-ements of a link so that they do not forward any packets, andwaking up simply entails activating the queues. The mobiledevice wakes up whenever it has data to send to the AP. Aftersending the data it stays awake for the duration determinedby the BSD algorithm (this time is restarted if the mobile de-vice sends more data in the interim), and then goes to sleep.The beaconing is implemented using a timer that expires ev-ery 100 ms. We determine whether the mobile device wakesup to listen to each beacon based on the BSD protocol. If itdoes, it receives any data buffered at the AP and then goesback to sleep. Based on the experiments described in Section2, we modeled the AP-to-mobile-device and mobile-device-to-AP links as 5 Mbps with a latency of 100 � s.
To model a client browsing the Web, we used the trace-based HTTP traffic generator in the ns-2 distribution (inns-2.1b8a/tcl/http/). In the model, the retrieval of aWeb page begins with a client opening a TCP connectionwith the server and sending a request. The original modeluses one-way TCP connections, but we updated it to use
0 500 10000
0.2
0.4
0.6
0.8
1Request Length (bytes)
101
102
103
104
105
0
0.2
0.4
0.6
0.8
1Response Length (bytes)
0 10 200
0.2
0.4
0.6
0.8
1Number of Images
10−1
100
101
102
0
0.2
0.4
0.6
0.8
1Server Response Time (seconds)
100
101
102
103
0
0.2
0.4
0.6
0.8
1User Think Time (seconds)
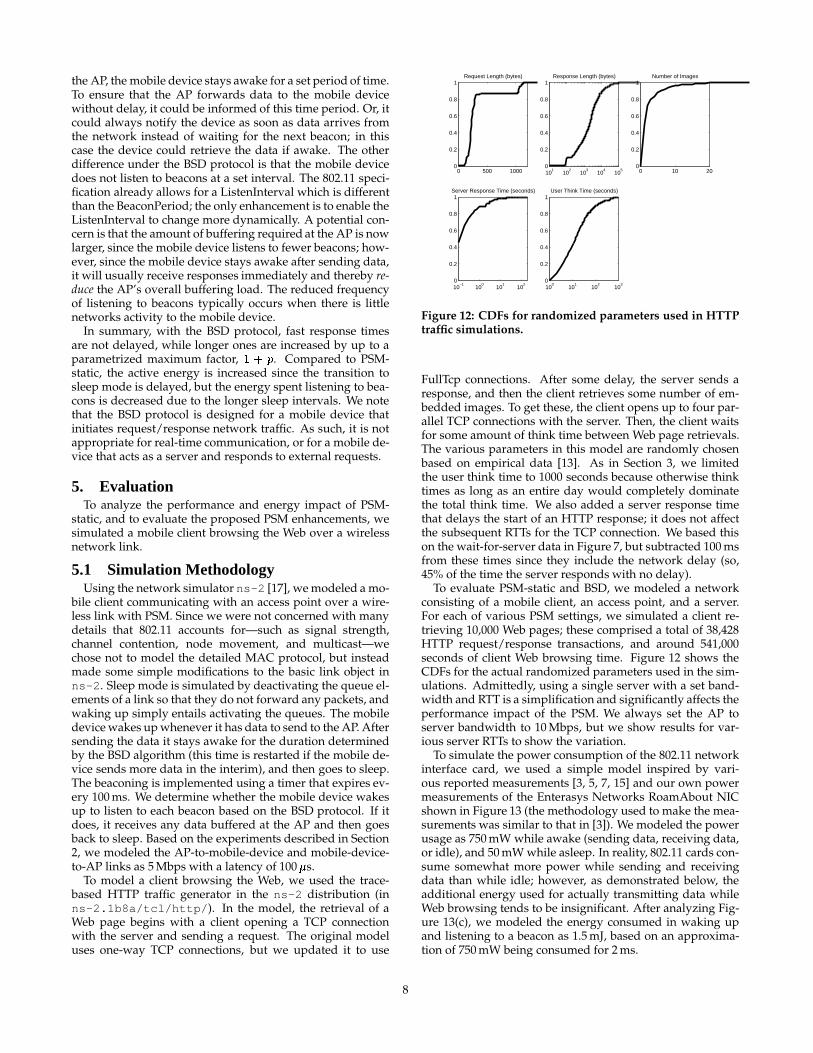
Figure 12: CDFs for randomized parameters used in HTTPtraffic simulations.
FullTcp connections. After some delay, the server sends aresponse, and then the client retrieves some number of em-bedded images. To get these, the client opens up to four par-allel TCP connections with the server. Then, the client waitsfor some amount of think time between Web page retrievals.The various parameters in this model are randomly chosenbased on empirical data [13]. As in Section 3, we limitedthe user think time to 1000 seconds because otherwise thinktimes as long as an entire day would completely dominatethe total think time. We also added a server response timethat delays the start of an HTTP response; it does not affectthe subsequent RTTs for the TCP connection. We based thison the wait-for-server data in Figure 7, but subtracted 100 msfrom these times since they include the network delay (so,45% of the time the server responds with no delay).
To evaluate PSM-static and BSD, we modeled a networkconsisting of a mobile client, an access point, and a server.For each of various PSM settings, we simulated a client re-trieving 10,000 Web pages; these comprised a total of 38,428HTTP request/response transactions, and around 541,000seconds of client Web browsing time. Figure 12 shows theCDFs for the actual randomized parameters used in the sim-ulations. Admittedly, using a single server with a set band-width and RTT is a simplification and significantly affects theperformance impact of the PSM. We always set the AP toserver bandwidth to 10 Mbps, but we show results for var-ious server RTTs to show the variation.
To simulate the power consumption of the 802.11 networkinterface card, we used a simple model inspired by vari-ous reported measurements [3, 5, 7, 15] and our own powermeasurements of the Enterasys Networks RoamAbout NICshown in Figure 13 (the methodology used to make the mea-surements was similar to that in [3]). We modeled the powerusage as 750 mW while awake (sending data, receiving data,or idle), and 50 mW while asleep. In reality, 802.11 cards con-sume somewhat more power while sending and receivingdata than while idle; however, as demonstrated below, theadditional energy used for actually transmitting data whileWeb browsing tends to be insignificant. After analyzing Fig-ure 13(c), we modeled the energy consumed in waking upand listening to a beacon as 1.5 mJ, based on an approxima-tion of 750 mW being consumed for 2 ms.
8
pow
er (
W)
time (ms)
(a) PSM off
0 100 200 300 400
1.56
1.17
0.78
0.39
0
pow
er (
W)
time (ms)
(b) PSM on
0 100 200 300 400
1.56
1.17
0.78
0.39
0
pow
er (
W)
time (ms)
(c) PSM on: close−up
196 198 200 202 204
1.56
1.17
0.78
0.39
0
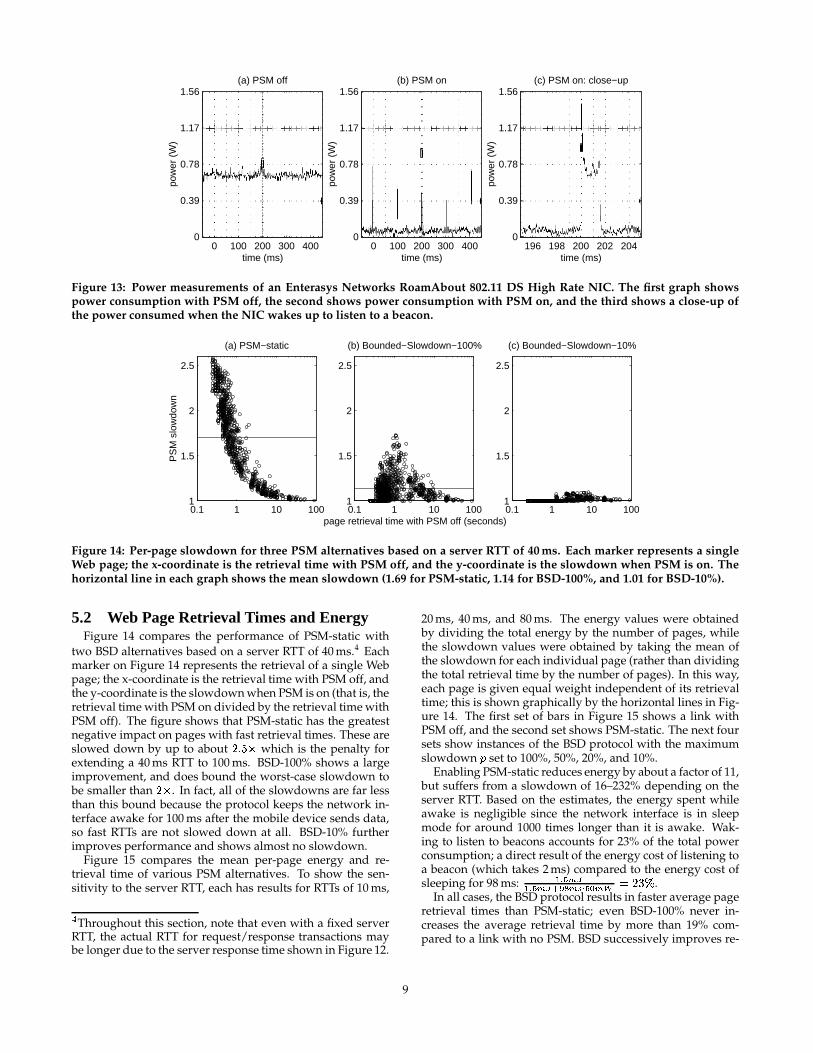
Figure 13: Power measurements of an Enterasys Networks RoamAbout 802.11 DS High Rate NIC. The first graph showspower consumption with PSM off, the second shows power consumption with PSM on, and the third shows a close-up ofthe power consumed when the NIC wakes up to listen to a beacon.
0.1 1 10 1001
1.5
2
2.5
PS
M s
low
dow
n
(a) PSM−static
0.1 1 10 1001
1.5
2
2.5
page retrieval time with PSM off (seconds)
(b) Bounded−Slowdown−100%
0.1 1 10 1001
1.5
2
2.5
(c) Bounded−Slowdown−10%
Figure 14: Per-page slowdown for three PSM alternatives based on a server RTT of 40 ms. Each marker represents a singleWeb page; the x-coordinate is the retrieval time with PSM off, and the y-coordinate is the slowdown when PSM is on. Thehorizontal line in each graph shows the mean slowdown (1.69 for PSM-static, 1.14 for BSD-100%, and 1.01 for BSD-10%).
5.2 Web Page Retrieval Times and EnergyFigure 14 compares the performance of PSM-static with
two BSD alternatives based on a server RTT of 40 ms.4 Eachmarker on Figure 14 represents the retrieval of a single Webpage; the x-coordinate is the retrieval time with PSM off, andthe y-coordinate is the slowdown when PSM is on (that is, theretrieval time with PSM on divided by the retrieval time withPSM off). The figure shows that PSM-static has the greatestnegative impact on pages with fast retrieval times. These areslowed down by up to about ��� � � which is the penalty forextending a 40 ms RTT to 100 ms. BSD-100% shows a largeimprovement, and does bound the worst-case slowdown tobe smaller than � � . In fact, all of the slowdowns are far lessthan this bound because the protocol keeps the network in-terface awake for 100 ms after the mobile device sends data,so fast RTTs are not slowed down at all. BSD-10% furtherimproves performance and shows almost no slowdown.
Figure 15 compares the mean per-page energy and re-trieval time of various PSM alternatives. To show the sen-sitivity to the server RTT, each has results for RTTs of 10 ms,
�Throughout this section, note that even with a fixed server
RTT, the actual RTT for request/response transactions maybe longer due to the server response time shown in Figure 12.
20 ms, 40 ms, and 80 ms. The energy values were obtainedby dividing the total energy by the number of pages, whilethe slowdown values were obtained by taking the mean ofthe slowdown for each individual page (rather than dividingthe total retrieval time by the number of pages). In this way,each page is given equal weight independent of its retrievaltime; this is shown graphically by the horizontal lines in Fig-ure 14. The first set of bars in Figure 15 shows a link withPSM off, and the second set shows PSM-static. The next foursets show instances of the BSD protocol with the maximumslowdown � set to 100%, 50%, 20%, and 10%.
Enabling PSM-static reduces energy by about a factor of 11,but suffers from a slowdown of 16–232% depending on theserver RTT. Based on the estimates, the energy spent whileawake is negligible since the network interface is in sleepmode for around 1000 times longer than it is awake. Wak-ing to listen to beacons accounts for 23% of the total powerconsumption; a direct result of the energy cost of listening toa beacon (which takes 2 ms) compared to the energy cost ofsleeping for 98 ms:
��� �������� ����������� � ������� � � � .
In all cases, the BSD protocol results in faster average pageretrieval times than PSM-static; even BSD-100% never in-creases the average retrieval time by more than 19% com-pared to a link with no PSM. BSD successively improves re-
9

no−PSM PSM−static BSD−100% BSD−50% BSD−20% BSD−10%0
1
2
3
4
5
6
ener
gy (
J)
(offscale)40 40 41 41
listensleep awake
no−PSM PSM−static BSD−100% BSD−50% BSD−20% BSD−10%0
0.5
1
1.5
2
2.5
3
3.5
slow
dow
n
10ms20ms40ms80ms
Figure 15: Mean per-page energy and slowdown compar-isons for various PSM alternatives and various server RTTs.In both graphs, each set of bars show results for serverRTTs of 10 ms, 20 ms, 40 ms, and 80 ms.
1 1.5 20
5
10
15
20
25
30
35
40
45no PSM
PSM−static
slowdown
ener
gy (
J)
1 1.05 1.1 1.15 1.23
3.5
4
4.5
5
100%50%
20%
10%Bounded−Slowdown
Figure 16: Mean per-page energy versus slowdown for var-ious PSM alternatives (for 40 ms server RTT).
trieval times as the slowdown parameter is decreased, andeventually it almost completely eliminates the slowdown.
To improve performance as the slowdown parameter is de-creased, BSD successively increases the awake energy sinceit stays awake for longer after the mobile device sends data.The awake energy also increases with slower server RTTssince BSD typically remains awake for entire TCP data trans-fers, and these become longer. However, BSD also reducesthe energy spent listening to beacons since it adaptively in-creases the listen interval when there is no activity. The lis-ten energy is reduced by ��� ��� with BSD-10% and � � � � withBSD-100%, close to the maximum reduction of ��� that wouldbe achieved by listening every 900 ms (the maximum listeninterval we allow) instead of every 100 ms. Combining thesetwo energy effects, BSD uses even less energy overall thanPSM-static in many cases, and even in the worst case it onlyincreases the energy by 26%. Figure 16 shows the trade-offbetween page retrieval time and energy consumption basedon a 40 ms server RTT. Clearly the parameterized BSD pro-tocol reduces communication latency at the cost of increasedenergy consumption, and vice-versa.
100 ms 50 ms 25 ms 12.5 ms0
0.5
1
1.5
2
ener
gy (
J)
BSD−100%
listenawake
100 ms 50 ms 25 ms 12.5 ms1
1.1
1.2
1.3
1.4
1.5
slow
dow
n
Beacon−Period
10ms20ms40ms80ms
100 ms 50 ms 25 ms 12.5 ms0
0.5
1
1.5
2
ener
gy (
J)
BSD−10%
listenawake
100 ms 50 ms 25 ms 12.5 ms1
1.1
1.2
1.3
1.4
1.5
slow
dow
n
Beacon−Period
10ms20ms40ms80ms
Figure 17: Mean per-page energy and slowdown compar-isons for various beacon periods. The graphs on the leftshow results for BSD-100%, and those on the right for BSD-10%. In all graphs, each set of bars show results for serverRTTs of 10 ms, 20 ms, 40 ms, and 80 ms. The “sleep” energyhas been eliminated for clarity.
5.3 Further Energy ReductionThe results show that the energy remaining after PSM is
enabled is mostly dominated by the power consumed whilethe network interface is sleeping. There is no fundamentallimit that prevents this power from being reduced further,but doing this can result in additional energy and delay over-head when the network interface awakens. For example,Simunic et al. report that the NIC can be turned off so thatit consumes no power, but the transition to the off state takesaround 62 ms and the transition back takes around 34 ms[15]. Clearly this mode cannot be used when the networkinterface must wake up every 100 ms to listen to a beacon,but as Simunic finds, turning off the network interface dur-ing long idle periods can save considerable energy. Thus,by extending the sleep intervals BSD has the potential to usedeeper sleep modes to significantly reduce the sleep energy.
Assuming that hardware advances can reduce the sleepenergy toward zero, the overall energy consumption for BSDwill become dominated by the awake energy. Most of thisenergy is consumed after the link is active and the networkinterface stays awake for a short period of time; this behavioris demonstrated in Figure 11.
To minimize the awake energy while still preserving thebounded slowdown guarantee, we can decrease the beaconperiod. Doing so allows the network interface to go to sleepsooner after the link is active because, � ��� ����� � ��� � ; thisbrings the protocol closer to the ideal algorithm describedby Theorem 1. Figure 17 shows the effect of reducing thebeacon period on BSD-100% and BSD-10%. As expected,the awake energy is reduced with shorter beacon periods.For example reducing the beacon period by a factor of 8 re-duces the awake energy by 56–80% for BSD-100% and 44–75% for BSD-10%. However, at the same time, the energyspent listening to beacons increases since the sleep/listen cy-cle starts sooner. Additionally, performance degrades if thelink does not stay awake for as long as the minimum roundtrip times. For example, with BSD-100%, the network inter-
10

face stays awake for one beacon period before going to sleep;hence, with an 80 ms RTT, the average slowdown increasessubstantially when the beacon period is reduced from 100 msto 50 ms, while with a 40 ms RTT, the average slowdown in-creases substantially when the beacon period is reduced from50 ms to 25 ms. BSD-10% stays awake for 10 beacon periodsinitially, so even reducing the beacon period to 12.5 ms barelyharms its performance.
Even if we do not assume zero sleep energy, reducing thebeacon period can be an important energy saving techniquefor the BSD protocol. For BSD-10%, reducing the beacon pe-riod to 12.5 ms results in it using between 12% less to 2%more energy than PSM-static depending on the server RTT.Thus, it essentially eliminates the page retrieval slowdownwhile simultaneously reducing energy in almost all cases.Although the page retrieval times with PSM-static could alsobe improved by reducing the beacon period to 12.5 ms, thiswould increase the energy spent listening to beacons by afactor of 8, and increase the overall energy by a factor of 2.6.
6. Related WorkThis paper has two main contributions: First, it presents a
detailed analysis of the effect that fine-grained intermittentconnectivity, such as that of the 802.11 power-saving mode,has on TCP throughput and latencies. We believe that thisis the first work to explore this issue in depth. Second, itpresents the BSD protocol to minimize energy consumptionwhile providing a guaranteed bound on RTT slowdown forrequest/response network traffic.
A survey of energy efficient network protocols for wirelessnetworks is provided in [10]. Although many researchershave explored power management strategies, we believe thatours is the first work that also focuses on provably boundingthe performance slowdown.
6.1 Reducing Idle Energy in InfrastructureNetworks
The BSD protocol operates solely at the MAC layer anddoes not require any higher-layer information. Other pro-posals have advocated power management at the system-level [15], the application-level [2], or a hybrid of the two [11].Our view is that, in many cases, this unnecessarily increasesoverall system complexity. Higher-layer protocols may havedifficulties when multiple applications share the same net-work interface, but BSD has no problems with such a situa-tion since it is agnostic to applications. We have shown thata low-level protocol can provide performance guarantees forrequest/response network traffic, thus covering an interest-ing and broad (although not comprehensive) class of net-work applications, while flexibly and dynamically adaptingto network activity in order to eliminate energy during longidle periods. An appropriate system-level or application-level decision could be to choose the BSD protocol for re-quest/response network access (along with an appropriatevalue for � , the slowdown parameter), and to choose a dif-ferent PSM mechanism (e.g., PSM-static) for other kinds ofnetwork applications.
Simunic et al. describe system-level power managementstrategies that turn the network interface off completely dur-ing idle periods to reduce its power consumption by about� � compared to 802.11 without power management [15].5
�The wireless card used in [15] consumes 1.65 W while send-
However, the policy cannot guarantee a bound on the perfor-mance slowdown. BSD is a simpler algorithm than the pro-posed time-indexed semi-Markov decision process model(TISMDP); and, even while providing guaranteed bounds onthe slowdown by taking network performance (RTTs) intoaccount, it can achieve additional energy savings on top ofthe � � � energy reduction of the 802.11 PSM-static protocol.Although not evaluated in our paper, BSD could save evenmore energy by (like TISMDP) transitioning from sleep to offwhen the listen interval becomes sufficiently long. Further-more, BSD is designed to operate at a finer granularity thanTISMDP and they could potentially be used in conjunction.
Chandra investigates an application-specific protocol forreducing the network interface power consumption forstreaming media applications [2]. The proposal uses ahistory-based strategy to set the sleep interval (analogous tothe listen interval). The protocol is only applicable for reg-ular access patterns, in contrast to BSD which dynamicallyresponds to network activity.
Kravets and Krishnan investigate the energy and delay im-pact of a power-aware transport protocol [11]. Ideally, ap-plications inform the protocol when the network interfaceshould be turned off; the paper also discusses using a time-out period (analogous to the initial stay awake time in BSD),but does not evaluate this parameter’s energy and delay im-pact. The paper investigates the sleep duration (analogousto the listen interval), and finds that a 500 ms sleep durationachieves most of the possible energy savings; it reduces Webbrowsing energy by 30–80% compared to no power manage-ment, at the cost of increasing delay by 300–700 ms. Kravetsand Krishnan also present an adaptive implementation oftheir algorithm in which they set the sleep duration to 250 mswhen there is network activity, and adaptively back off to5 minutes by doubling when there is no activity; they findthat this can improve both energy and delay. Ultimately, thepower-saving mechanisms are similar to those used by BSD,but the proposed protocol does not use them to guarantee abound on the performance degradation.
6.2 Other Energy Reduction TechniquesChen et al. evaluate the energy consumption of various
access protocols for wireless infrastructure networks [4]. Incontrast to our work, their study focuses on the active energyconsumption and the impact of contention for the wirelesschannel. These factors are certainly important for some envi-ronments, but with sporadic network activity the idle energyconsumption dominates the active energy.
There have been many studies on the performance and en-ergy consumption of ad hoc wireless networks (e.g. [3, 7, 16,18]). Infrastructure networks have fundamentally differentrequirements than ad hoc networks because the access pointis a centralized controller and is not constrained by powerconsumption. However, the basic concepts behind the BSDprotocol could still potentially improve the performance andenergy consumption of ad hoc networks.
Another area of related work is power management ofhard disks [6, 12]. Like the network interface, hard diskscan be disabled to save energy. Adaptively varying the diskspin-down threshold [6] shares similarities with adaptively
ing, 1.4 W while receiving, and 0.045 W while sleeping, butthe average power consumed during a Web browsing traceis 1.41 W; therefore, we conclude that the card is either con-stantly receiving data or not using its sleep mode while idle.
11

increasing the network interface listen interval. However,hard disks use mechanical components and require ordersof magnitude more time and energy to transition into sleepmodes. Another fundamental difference with the networkinterface is that the information for determining when to re-activate the component may not be local to the mobile device;a packet can arrive from the network (external to the device),and the device must wake up to receive it.
7. ConclusionWe investigated the performance effects of superimpos-
ing a TCP connection on a static PSM protocol (PSM-static)modeled after the popular IEEE 802.11 wireless LAN power-saving mode. Using a combination of analysis, measure-ment, and simulation, we found that while this protocol re-duces the energy consumed during Web access by � � � com-pared to no PSM, the RTTs of a TCP connection get roundedup to the nearest 100 ms until the TCP window size growsto the network bandwidth-delay product. This has an espe-cially adverse impact on the short TCP connections typicalfor Web workloads, whose performance is dominated by theRTT; for a client-side Web trace, we found that the averageWeb page retrieval time increases by 16–232%. We also dis-cussed an emergent interaction between TCP and PSM-staticthat leads to performance inversion in which TCP achieveshigher throughput over a lower bandwidth PSM-static link.Furthermore, for Web workloads characterized by bursts ofactivity interspersed with long idle periods, PSM-static con-sumes most of its energy sleeping and unnecessarily wakingup to listen to beacons during the idle periods.
To overcome these problems, we presented the BSD proto-col that dynamically adapts to network activity. We provedthat BSD uses the minimum possible energy necessary toguarantee that connection round-trip times do not increaseby more than a given factor � compared to the RTT in theabsence of any PSM, where � is a protocol parameter that ex-poses the trade-off between minimizing energy and reduc-ing delay. To accomplish this, BSD stays awake for a shortperiod of time after a request is sent, and adaptively lis-tens to fewer beacons when the link remains idle. Stayingawake reduces communication delay but increases energyconsumption, while listening to fewer beacons saves energybut can increase delay. We evaluated BSD using trace-drivenWeb traffic simulations and parameters from a commerciallyavailable 802.11b wireless LAN card, and found that, com-pared to PSM-static, BSD reduces average Web page retrievaltimes by 5–64%, while simultaneously reducing energy con-sumption by 1–14% (and by up to ����� compared to no powermanagement).
AcknowledgmentsWe gratefully acknowledge Kyle Jamieson for his help andcomments, especially with measuring the network interfacecard power consumption. We also thank Magdalena Balazin-ska, Ken Barr, Chris Batten, Allen Miu, and the Mobicom re-viewers for helpful feedback. This work was funded in partby DARPA PAC/C award F30602-00-2-0562.
8. References[1] C. Andren, T. Bozych, B. Rood, and D. Schultz. Prism
power management modes. Technical Report AN9665,Intersil Corporation, February 1997.
[2] S. Chandra. Wireless network interface energyconsumption implications of popular streamingformats. In Proc. Multimedia Computing and Networking(MMCN), pages 85–99, San Jose, CA, January 2002.
[3] B. Chen, K. Jamieson, H. Balakrishnan, and R. Morris.Span: an energy-efficient coordination algorithm fortopology maintenance in ad hoc wireless networks.ACM Wireless Networks, 8(5), September 2002.
[4] J.-C. Chen, K. M. Sivalingam, and P. Agrawal.Performance comparison of battery powerconsumption in wireless multiple access protocols.ACM Wireless Networks, 5(6):445–460, 1999.
[5] Cisco Systems, Inc. Quick reference guide CiscoAironet 340 series products, January 2001.
[6] F. Douglis and P. Krishnan. Adaptive disk spin-downpolicies for mobile computers. Computing Systems,8(4):381–413, 1995.
[7] L. Feeney and M. Nilsson. Investigating the energyconsumption of a wireless network interface in an adhoc networking environment. In Proc. IEEE INFOCOM,Anchorage, AK, April 2001.
[8] S. D. Gribble and E. A. Brewer. System design issues forInternet middleware services: Deductions from a largeclient trace. In Proc. USENIX Symposium on InternetTechnologies and Systems, Monterey, CA, December 1997.
[9] IEEE Computer Society LAN MAN StandardsCommittee. IEEE Std 802.11: Wireless LAN MediumAccess Control and Physical Layer Specifications, August1999.
[10] C. E. Jones, K. M. Sivalingam, P. Agrawal, and J. C.Chen. A survey of energy efficient network protocolsfor wireless networks. ACM Wireless Networks,7(4):343–358, July 2001.
[11] R. Kravets and P. Krishnan. Application-driven powermanagement for mobile communication. ACM WirelessNetworks, 6(4):263–277, 2000.
[12] K. Li, R. Kumpf, P. Horton, and T. E. Anderson. Aquantitative analysis of disk drive power managementin portable computers. In Proc. Winter USENIX, pages279–291, San Francisco, CA, January 1994.
[13] B. A. Mah. An empirical model of http network traffic.In Proc. IEEE INFOCOM, Kobe, Japan, April 1997.
[14] E. Shih, S.-H. Cho, N. Ickes, R. Min, A. Sinha, A. Wang,and A. Chandrakasan. Physical layer driven algorithmand protocol design for energy-efficient wireless sensornetworks. In Proc. ACM MOBICOM, pages 272–286,Rome, Italy, July 2001.
[15] T. Simunic, L. Benini, P. W. Glynn, and G. D. Micheli.Dynamic power management for portable systems. InProc. ACM MOBICOM, pages 11–19, Boston, MA, 2000.
[16] S. Singh and C. Raghavendra. PAMAS: Power awaremulti-access protocol with signaling for ad hocnetworks. ACM SIGCOMM Computer CommunicationReview, 28(3):5–26, July 1998.
[17] The VINT Project. The ns manual, November 2001.[18] H. Woesner, J.-P. Ebert, M. Schlaeger, and A. Wolisz.
Power-saving mechanisms in emerging standards forwireless LAN’s: The MAC-level perspective. IEEEPersonal Communication Systems, 5(3):40–48, June 1998.
12