mineralogical characterization studies of ancient potteries of...
TRANSCRIPT
ISSN: 0973-4945; CODEN ECJHAO
E-Journal of Chemistry
http://www.e-journals.net 2010, 7(S1), S185-S190
Mineralogical Characterization
Studies of Ancient Potteries of Tamilnadu,
India by FT-IR Spectroscopic Technique
R. RAVISANKAR*, S.KIRUBA
#, P.ESWARAN
¶,
G. SENTHILKUMAR§ and A.CHANDRASEKARAN
*Post Graduate and Research Department of Physics,
Government Arts College, Tiruvanamalai-606603, Tamilnadu, India #Department of Physics, St.Joseph’s College of Engineering, Chennai-119, Tamilnadu, India
¶Department of Physics,
Vel Tech Dr RR & SR Technical University, Chennai-62, India
§Department of Physics, University of College of Engineering
(A Constituent College of Anna University) Chennai, Arani- 632317, Tamilnadu, India
Department of Physics, Sacred Heart College, Thirupattur-635601, Tamilnadu, India
Received 15 March 2010; Accepted 23 May 2010
Abstract: We report the spectroscopic investigation of ancient potteries
excavated in Tamilnadu. Qualitative analyses were carried out to determine the
major and minor constituent minerals present in the samples from the band
position or location of the peaks. From the prominent IR absorption peaks, the
minerals were identified with the available literature are the quartz, orthoclase,
albite, magnetite, hematite, kaolinite, montmorillonite, illite, gypsum and
calcite. The interpretation of results is made from the IR characteristics
absorption bands. Spectroscopic results indicates that these potteries were
refried to a less than 900 °C.
Keywords: Ancient pottery, Archaeometry, FT-IR, Firing temperature, Mineralogical Characterization.
Introduction
Archaeometry is a multidisciplinary research branch which focuses on studying and solving
the problem in the field of cultural heritage. This discipline is geared towards the extraction
of information about the genesis and history of findings through the analysis of the material
and dating techniques. Archaeometry includes studies about dating, authentication,
conservation and restoring, provenance and the achievement of technological information
about hand made articles manufactures as well. One of the most important areas of
S186 R. RAVISANKAR et al.
archeology is the identification of the source and the origin of ancient artifacts. Knowing the
origin is very important for tracking correctly ancient civilization and history. Ancient
potteries are the most common artifacts found during excavation of archeological sites, so
archaeologists are interested in the studies of pottery fragments. Most archaeologists have
classified ancient artifacts (pottery) by their shapes and uses. The main ingredients of pottery
are clays to which tempering materials are some time added during manufacture. The clay,
shell, sand etc. from which pottery were fashioned can have a chemical composition which
unique and thus reviles the local source from which they were taken. Potteries are made of
clay minerals and the common major clay mineral used in making potteries is kaolinte. The
study of thermal transformation of the clay mineral can thus help in determining the firing
temperature of the potteries.
The dehydroxylation of kaolinte minerals was first studied by Ross and Kerr1.
According to their differential thermal analysis (DTA) results dehydroxylation takes place
between 400 ºC and 525 ºC. A small amount of water can however persist up to 750 ºC or
800 ºC at which dehydroxylation is complete. Dehydeoxylation of kaolinte was used by
Prost et al 2
also using infrared spectroscopy. They observed that among the hydroxyl bands
in the 3700-3600 cm-1
region the bands at 3675, 3650 and 3630 cm-1
persist after firing to a
temperature of 327 ºC (600 K). According to Elass and oliver3, on heating kaolinte the
intensity of bands 3700-3600 cm-1
region decreases and at 500 ºC only a weak broad band
remains in the 3600 cm-1
region. The thermal behavior of the bands due to hydroxyl groups
in clay artifacts were studied by Maniatis et al4 also. They observed that clay minerals begin
to lose their crystalline hydroxyl groups and start disorganizing at temperatures in the range
400-600 ºC and for some minerals it can continue up to 800 ºC. According to them the
persistence of a weak band around 3600 cm-1
indicates the presence of the iron hydroxyl still
in the clay body and points to incomplete dehydroxylation.
The transformation of the clay minerals during heating is reflected in the 1100-1000 cm-1
region also. As the temperature is increased there is gradual destruction of the layer
structures of the mineral. The bands at 1105 cm-1
and 915 cm-1
due to Al(OH) vibrations2, 3, 5
in
the octahedral sheet structure begin to disappear with increasing temperatures and at 500 ºC
the band at 925 ºC disappears completely3. This dehydroxylation is followed by crystal
frame work collapse and the tetrahedral sheet disorder can be seen from the broadening of
the Si-O stretching bands in this 1100-100 cm-1
region.
The weak shoulder band observed at 875 cm-1
in the spectra of iron rich clay mineral
has been attributed to Fe(AlOH) group present in the clay mineral6. The presence of this
group indicates the persistence of the octahedral sheet structure in the clay mineral,
indicating incomplete dehydroxylation and thus firing temperatures below 800 ºC as at 800 ºC
the dehydroxylation of kaolinte minerals are completed1,4
. However this band is observed
only in the iron rich clay minerals6.
With these observations regarding the thermal behavior of absorption bands at round
3600 cm-1
region and at 915 cm-1
, an attempt is made to establish the firing temperature of
the archeological potteries in the present study by FT-IR spectroscopic technique.
Infrared spectroscopy of organic substances has been studied extensively, but its
application to the study of inorganic materials, particularly of minerals, is relatively less
attempted. Infrared spectra act as “finger print” technique and yield information about the
atomic groupings present in the sample. Infrared spectroscopy, which acts as a research tool
in mineralogy, is most powerful if used in conjunction with x-ray diffraction and other
Mineralogical Characterization Studies S187
techniques. Using the infrared spectra, unique information about the group of minerals in
which the specimen belongs, the degree of crystalline and non-crystalline impurities and
reactions of minerals with chemicals in their environment can also inferred.
Experimental
The samples were collected from two sites Nilgiri and Perumpor of Tamilnadu, India are
named as PN & PP for identification. The samples were taken at depth from soil surface to
about 6 m. After removal of surface layers, the pottery shards were grounded into fine
powder using agate mortar. They were sieved using a 90 µm mesh. The major and minor
minerals are qualitatively determined by FT-IR technique. The Perkins Elmer -1600 series
available in Indira Gandhi Centre for Atomic Research (IGCAR), Kalpakkam, Tamilnadu is
made use of in the present work for recording IR spectra of the samples at room
temperature. The KBr pellet technique (1:20) pellets were followed for the mineral analysis.
For each samples five to six pellet specimens were prepared and the spectra were taken in
the mid region of 4000-400 cm-1
.
Results and Discussion
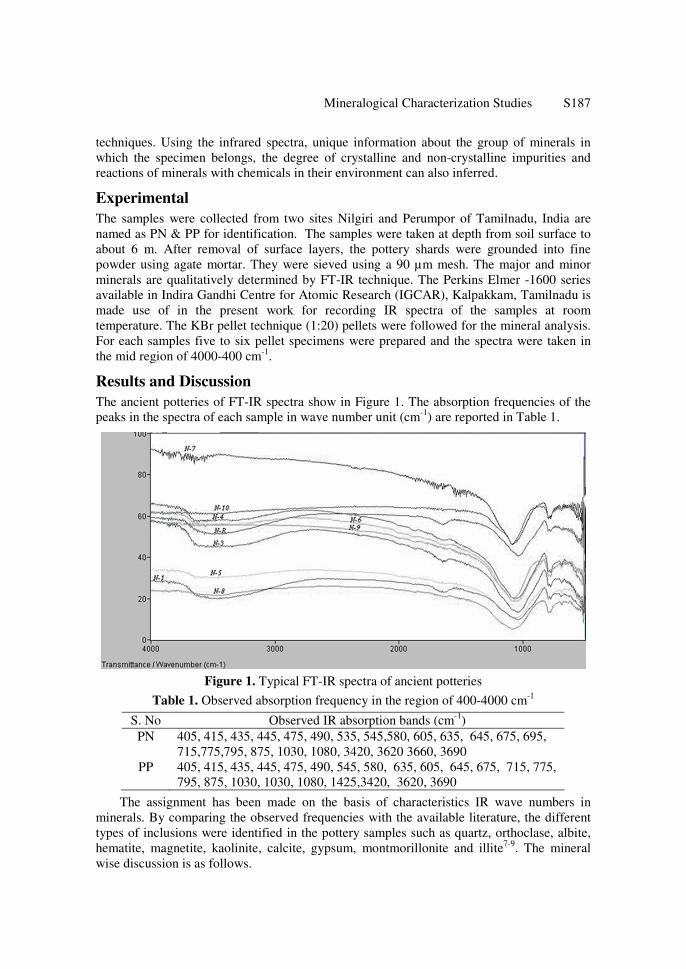
The ancient potteries of FT-IR spectra show in Figure 1. The absorption frequencies of the
peaks in the spectra of each sample in wave number unit (cm-1
) are reported in Table 1.
Figure 1. Typical FT-IR spectra of ancient potteries
Table 1. Observed absorption frequency in the region of 400-4000 cm-1
S. No Observed IR absorption bands (cm-1
)
PN 405, 415, 435, 445, 475, 490, 535, 545,580, 605, 635, 645, 675, 695,
715,775,795, 875, 1030, 1080, 3420, 3620 3660, 3690
PP 405, 415, 435, 445, 475, 490, 545, 580, 635, 605, 645, 675, 715, 775,
795, 875, 1030, 1030, 1080, 1425,3420, 3620, 3690
The assignment has been made on the basis of characteristics IR wave numbers in
minerals. By comparing the observed frequencies with the available literature, the different
types of inclusions were identified in the pottery samples such as quartz, orthoclase, albite,
hematite, magnetite, kaolinite, calcite, gypsum, montmorillonite and illite7-9
. The mineral
wise discussion is as follows.
S188 R. RAVISANKAR et al.
Quartz
Quartz is a silicate mineral. It could be observed from the Table 1. The IR absorption
peaks of quartz are at 445, 695,775 & 795 cm-1
may be due to the presence of quartz
in the samples10-13
. Out of the four peaks observed for quartz, the bands at 795-800
cm-1
and 775-780 cm-1
may be assigned symmetrical stretching modes and those at
695-700 cm-1
and at 445-450 cm-1
may be due to symmetrical bending mode and
asymmetrical bending respectively. Out of these two stretching modes and two
bending modes 795-800 cm-1
and 695-700 cm
-1 are widely used as the diagnostic
peaks for quartz.
The presence of quartz gives information about the origin of the potteries; quartz
was used in piedmont for covering of engobed pottery, while kaolin was used
elsewhere for the same purpose. The presence of quartz may gives information about
the samples comes from piedmont or not. It is not possible to state that findings
showing quartz inclusions do not being piedmont area. But in the present study the
largest parts quartz from the I.R studies may indicates that these samples are
common origin.
Feldspar
From the spectra of the samples in this investigation, the absorption frequencies of the peaks
of feldspar were measured together with the literature values. The IR absorption frequency
of the bands at 405, 435, 535 and 635 cm-1
may suggest the presence of feldspar14, 15
. The
peaks at 435 & 635 cm-1
and 405 & 535 cm-1
are indicating the presence of orthoclase and
albite. Feldspar is a common component of clay minerals. The presence of feldspar, as a
common component of potteries, does not give relevant information about the techniques
used for their production.
Magnetite and hematite
Magnetite (Fe3O4) can be identified by band around 670 and 580 cm-1
which is typical
spined structures. Hematite (Fe2O3) is observed16
by the presence of peaks at 540 and 475 cm-1
.
The presence of magnetite and hematite provides interesting information about the firing
atmosphere. Iron oxides are very influenced by the firing atmosphere; in fact they differ in
colour according to firing conditions. When oxygen is almost absent in the kiln i.e. under
reducing conditions, reduced compounds as magnetite (black colored) form, on the contrary,
under the influence oxidizing conditions, the oxidized form as hematite (reddish) prevail.
The presence of hematite in some findings could give further information about the
provenance of the clay used for the mixture.
Calcite
This mineral is characterized17-19
by the presence of the peaks at 715, 875, 1085 & 1425 cm-1
(Table 1). The presence of calcite (CaCo3) in the findings may occur essentially for two
reasons; a low firing temperature or a post burial deposition processes. Calcite exits up to
800 ºC, when the CaO formation is promoted, followed by the formation of the so-called
“high-temperature crystalline phase” made of Ca-silicates or Ca-Al-silicates such as
gehlenite (CaAl2 SiO7), diopside (CaMgSi2O6) and anorthite (CaAl2-Si2O8). The
simultaneous presence of calcareous clays of calcite and high temperature minerals clearly
rules out any hypothesis of primary calcite, strengthening the assumption of a secondary
origin due to deposition induced by water of the burial soil. Clearly in non-calcareous clays
calcite is not expected.
Mineralogical Characterization Studies S189
Clay minerals
The presence of kaolinte, montmorillonite and illte minerals in the samples are from a
group of clays. The absorption peaks appearing at 3690, 3660, 3620 and 1030 cm-1
in
the samples were attributed to kaolinte16
. The characteristics feature of kaolinte is the
O-H stretching band at about 3690 and 3620 cm-1
which can be diagnostic
distinguishing kaolinte from other clay minerals. The peak appearing at 3690 cm-1
is the
most suitable for both qualitative and quantitative investigation. The absorption band at
3690 and 3620 cm-1
is attributed to the stretching vibrations of inner surface OHs and
inner OH respectively.
The most distinguishing feature of the montmorillonite is the broad absorption bands at
the ranges from 3300 to 3500 cm-1
. This band typically centered around 3400 cm-1
may be
due to H-O-H stretching of water molecules present in the interlayer region of
montmorillonite. From the Table 1, the presence of montmorillonite is shown20
by the
absorption bands at 3420 cm-1
and 470 cm
-1. The IR absorption bands for illite are rarely
diagnostic because they are variable in chemical composition. The presence of peak at 490
and 415 cm-1
is attributed to illite20
.
The gypsum and MnO2 is identified by the absorption peaks (Table 1) at 605 cm-1
and
645 cm-1
respectively21
. Recently De Benedetto et al. reported the mineralogical
compositions of ancient potteries depending upon the IR spectroscopic results. Our results
are agreement with those of De Benedetto et al8.
The IR spectra indicates that all the samples contain calcite in different amounts.
Calcite is present as impurity of local clays. Observation of calcite (CaCo3) bands allows
us to draw conclusion on firing temperature. The processing temperature should be
below22
the decomposition temperature of calcite that is about 700°-900 °C. According to
mendelovici et al.6, the infrared absorption band around 3600 cm
-1 is due to hydroxyl
groups, which persist up to 800 °C. In the received state PP shows absorption band at
3621 cm-1
which indicates that samples might have been fired below 800 °C when other
sample PN did not show an absorption band at 3621 cm-1
indicating that they would have
been fired to temperature 800 °C or above.
The above results can also be confirmed with the bands at 915 cm-1
and 875 cm-1
.
The band at 915 cm-1
is due to Al(OH) vibrations in octahedral sheet structure, which
begins to disappear with increasing temperature and at 500 °C the band disappears
completely. None of the samples taken for the present study showed the band at 915 cm-1
.
This implies that all the samples were fired to the temperature above 500 °C. The broad
absorption bands at 580 and 540 cm-1
have been attributed to magnetite and hematite16
.
The amount of magnetite and hematite indicates atmospheric condition of firing23
. The
FT-IR spectra of PP and PN showed the absorption of hematite indicating that these
samples were fired in the open air or perfectly oxidizing atmosphere at the time of
manufacture.
Conclusion
Application of IR spectroscopy to ancient pottery shows great potential for understanding
technological conditions implemented for production of potteries and found to give useful
information about composition of potteries. Quartz, kaolinte and calcite were detected in all
the samples. Spectroscopic results indicated that the potteries were fired to a temperature
less than 800ºc in oxidizing atmosphere.
S190 R. RAVISANKAR et al.
References
1. Ross C S and Kerr P F, The kaolin Minerals, U.S. Geol.Survey Profess. Paper. 1931,
165E, 151.
2. Prost R, Dameme A, Huard E, Driard J and Leydecker J P, Clays and Clay Minearls,
1989, 37, 464.
3. Elsass F and Oliver D, Clay Minerals, 1978, 13(3), 299-308.
4. Maniatis J, Katsanos A A and Caskey M E, Archaeometry, 1982, 24, 191.
5. Miller J G, J Phys Chem., 1961, 68, 800.
6. Mendelovici E and Yariv S and Villailba R, Clay Minerals, 1979, 14, 323.
7. Ravisankar R, Rajalakshmi A and Manikandan E, Acta Ciencia Indica, 2006, XXXIIP(3),
341-346.
8. De Benedetto G E, Fabbri B, Gualtieri S, Sabbatini L and Zambonin P G, J Cult
Heritage, 2002, 3, 177.
9. Ravisankar R, EARFAM. 2009, 19, 272-276.
10. Hajjaji M, Kacim S, Alami A, El Bouadili A and El-Mountassir M, Appl Clay Sci.,
2001, 20, 1-12.
11. Nikolai V Bodoev, Guet J M, Gruber R, Dolgopolov N I, Wishelm J C and Bazarova O,
Fuel, 1996, 75(7), 839-842.
12. Boruah R K, Neog A K, Borah P C and Baruah G D, Indian J Eng Mater Sci., 1999, 6,
338-342.
13. Neog A K, Boruah R K, Sahu O P, Borah P C, Ahmed W and Boruah G D, Asian
Chem Letts., 1999, 3, 172-175.
14. Fieldes M, Furkert R J and Wells N, New Zealand J Sci., 1972, 15, 615-627.
15. Robert A, Shepherd, Walter S, Kiefert and Graham W R M, Fuel, 1986, 65, 1261.
16. Russell J D, Infrared methods, A Hand Book of Determinative Methods in Clay
Mineralogy, (Ed., Wilson, M J,) Blackie & Son Ltd., 1987.
17. Bottcher M E, Gehlken P L and Steele D F, Solid State Ionics, 1997, 101, 1379-1385.
18. Lopez M C B, Martinez-Alono and Tascon J M D, Appl Spectroscopy, 2000, 54, 1712.
19. SenthilKumar P, Parthasarathy G, Sharma D S, Srinivasan R and Krishnamurthy P, J
Geol Soc India, 2001, 58, 15-20.
20. Summer M E, Hand Book of Soil Science, University of Georgia, Boca Raton
Hondor Press, New York, 1995.
21. Ghosh S N, J Mater Sci., 1978, 13, 1877.
22. Han R, Shimamotto T, Hirose T, Ree J H and Ando J, Science, 2007, 316, 678.
23. Akyuz S, Akyuz T, Basaran S, Bolcal C and Gillee A, J Molecular Strucuture. 2007,
834, 150-153.

Submit your manuscripts athttp://www.hindawi.com
Hindawi Publishing Corporationhttp://www.hindawi.com Volume 2014
Inorganic ChemistryInternational Journal of
Hindawi Publishing Corporation http://www.hindawi.com Volume 2014
International Journal ofPhotoenergy
Hindawi Publishing Corporationhttp://www.hindawi.com Volume 2014
Carbohydrate Chemistry
International Journal of
Hindawi Publishing Corporationhttp://www.hindawi.com Volume 2014
Journal of
Chemistry
Hindawi Publishing Corporationhttp://www.hindawi.com Volume 2014
Advances in
Physical Chemistry
Hindawi Publishing Corporationhttp://www.hindawi.com
Analytical Methods in Chemistry
Journal of
Volume 2014
Bioinorganic Chemistry and ApplicationsHindawi Publishing Corporationhttp://www.hindawi.com Volume 2014
SpectroscopyInternational Journal of
Hindawi Publishing Corporationhttp://www.hindawi.com Volume 2014
The Scientific World JournalHindawi Publishing Corporation http://www.hindawi.com Volume 2014
Medicinal ChemistryInternational Journal of
Hindawi Publishing Corporationhttp://www.hindawi.com Volume 2014
Chromatography Research International
Hindawi Publishing Corporationhttp://www.hindawi.com Volume 2014
Applied ChemistryJournal of
Hindawi Publishing Corporationhttp://www.hindawi.com Volume 2014
Hindawi Publishing Corporationhttp://www.hindawi.com Volume 2014
Theoretical ChemistryJournal of
Hindawi Publishing Corporationhttp://www.hindawi.com Volume 2014
Journal of
Spectroscopy
Analytical ChemistryInternational Journal of
Hindawi Publishing Corporationhttp://www.hindawi.com Volume 2014
Journal of
Hindawi Publishing Corporationhttp://www.hindawi.com Volume 2014
Quantum Chemistry
Hindawi Publishing Corporationhttp://www.hindawi.com Volume 2014
Organic Chemistry International
Hindawi Publishing Corporationhttp://www.hindawi.com Volume 2014
CatalystsJournal of
ElectrochemistryInternational Journal of
Hindawi Publishing Corporation http://www.hindawi.com Volume 2014