mineral variations study of canelobre … · mineral variations study of canelobre cave phosphate...
TRANSCRIPT
MINERAL VARIATIONS STUDY OF CANELOBRE CAVE PHOSPHATE STALACTITES BY RAMAN AND LUMINISCENCE METHODS. García-Antón, E.1, Cuezva, S.2, Fernández-Cortes, A1, Cuevas-González, J.2, Muñoz-Cervera, M.C.2, Benavente, D.2, Sanchez-Moral, S.1, Cañaveras, J.C.2. 1Museo Nacional Ciencias Naturales. CSIC. 28006-Madrid. Spain. 2Laboratorio de Petrología Aplicada, Unidad Asociada UA-CSIC, 08040-Alicante, Spain
Phosphate minerals are relatively abundant in
caves although do not form spectacular free-standing speleothems. Phosphate stalactites found inside Canelobre cave (SE Spain) are here studied by hyperspectral Raman and Cathodoluminescence (CL). Together with XRD and EDS analyses we characterized the complex phosphate paragenesis present in these precipitates.
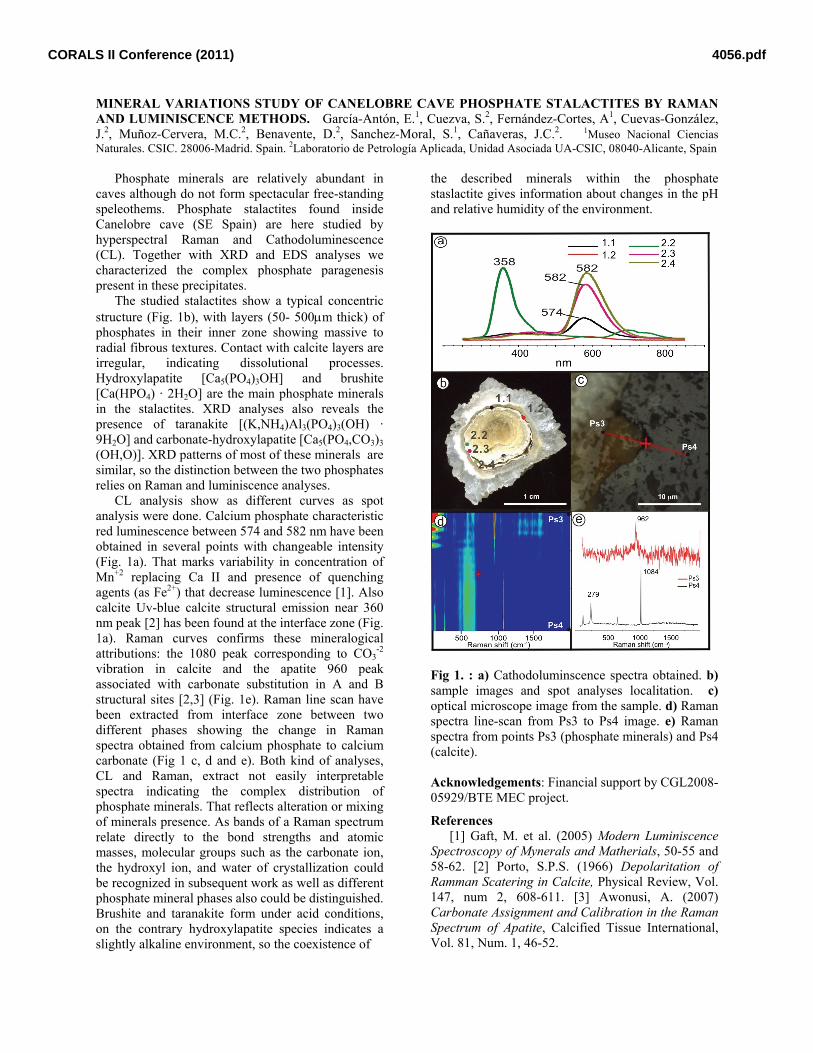
The studied stalactites show a typical concentric structure (Fig. 1b), with layers (50- 500μm thick) of phosphates in their inner zone showing massive to radial fibrous textures. Contact with calcite layers are irregular, indicating dissolutional processes. Hydroxylapatite [Ca5(PO4)3OH] and brushite [Ca(HPO4) · 2H2O] are the main phosphate minerals in the stalactites. XRD analyses also reveals the presence of taranakite [(K,NH4)Al3(PO4)3(OH) · 9H2O] and carbonate-hydroxylapatite [Ca5(PO4,CO3)3 (OH,O)]. XRD patterns of most of these minerals are similar, so the distinction between the two phosphates relies on Raman and luminiscence analyses.
CL analysis show as different curves as spot analysis were done. Calcium phosphate characteristic red luminescence between 574 and 582 nm have been obtained in several points with changeable intensity (Fig. 1a). That marks variability in concentration of Mn+2 replacing Ca II and presence of quenching agents (as Fe2+) that decrease luminescence [1]. Also calcite Uv-blue calcite structural emission near 360 nm peak [2] has been found at the interface zone (Fig. 1a). Raman curves confirms these mineralogical attributions: the 1080 peak corresponding to CO3
-2 vibration in calcite and the apatite 960 peak associated with carbonate substitution in A and B structural sites [2,3] (Fig. 1e). Raman line scan have been extracted from interface zone between two different phases showing the change in Raman spectra obtained from calcium phosphate to calcium carbonate (Fig 1 c, d and e). Both kind of analyses, CL and Raman, extract not easily interpretable spectra indicating the complex distribution of phosphate minerals. That reflects alteration or mixing of minerals presence. As bands of a Raman spectrum relate directly to the bond strengths and atomic masses, molecular groups such as the carbonate ion, the hydroxyl ion, and water of crystallization could be recognized in subsequent work as well as different phosphate mineral phases also could be distinguished. Brushite and taranakite form under acid conditions, on the contrary hydroxylapatite species indicates a slightly alkaline environment, so the coexistence of
the described minerals within the phosphate staslactite gives information about changes in the pH and relative humidity of the environment.
Fig 1. : a) Cathodoluminscence spectra obtained. b) sample images and spot analyses localitation. c) optical microscope image from the sample. d) Raman spectra line-scan from Ps3 to Ps4 image. e) Raman spectra from points Ps3 (phosphate minerals) and Ps4 (calcite). Acknowledgements: Financial support by CGL2008- 05929/BTE MEC project. References
[1] Gaft, M. et al. (2005) Modern Luminiscence Spectroscopy of Mynerals and Matherials, 50-55 and 58-62. [2] Porto, S.P.S. (1966) Depolaritation of Ramman Scatering in Calcite, Physical Review, Vol. 147, num 2, 608-611. [3] Awonusi, A. (2007) Carbonate Assignment and Calibration in the Raman Spectrum of Apatite, Calcified Tissue International, Vol. 81, Num. 1, 46-52.
4056.pdfCORALS II Conference (2011)