mineral physics and seismic constraints on earth’s structure and dynamics earth stucture,...
TRANSCRIPT

Mineral physics and seismic constraints on Earth’s structure and dynamicsEarth stucture, mineralogy, elasticity

Primary source of information about the deep interior structure:
seismological data
Other sources of information, Earth structure and dynamicsGravitational field
Magnetic field
Heat flow, dynamic topography and geoid
Plate movements
Cosmochemistry and geochemistry
High pressure mineralogy and mineral physics: experimental – computational

Other planets: No seismology (except rudimentary Moon seismology)
Planetary mass distribution: determined via simple flyby
Moment of inertia factor (MIF)
MIF = I / R2 M
Homogeneous massive sphere: MIF = 0.4
Planet with high-density core: MIF < 0.4
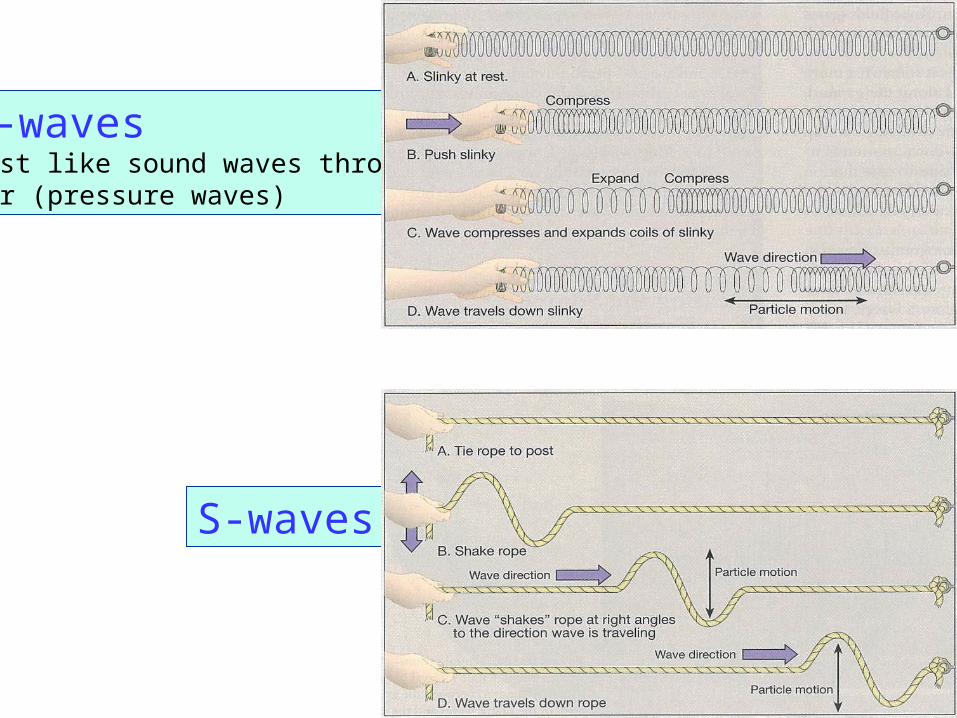
P-wavesJust like sound waves throughair (pressure waves)
S-waves

P-wave
S-wave


Lay & Garnero (2011, Ann Rev Earth Plan Sci)
Seismic phases generated by a 562 km deep source in PREM 1D Reference Earth Model of Dziewonski and Anderson (1981)
Travel time curves. Dashed and dotted curves are upward-radiated P- and S- wave surface reflections (e.g. pPdiff and sPdiff)
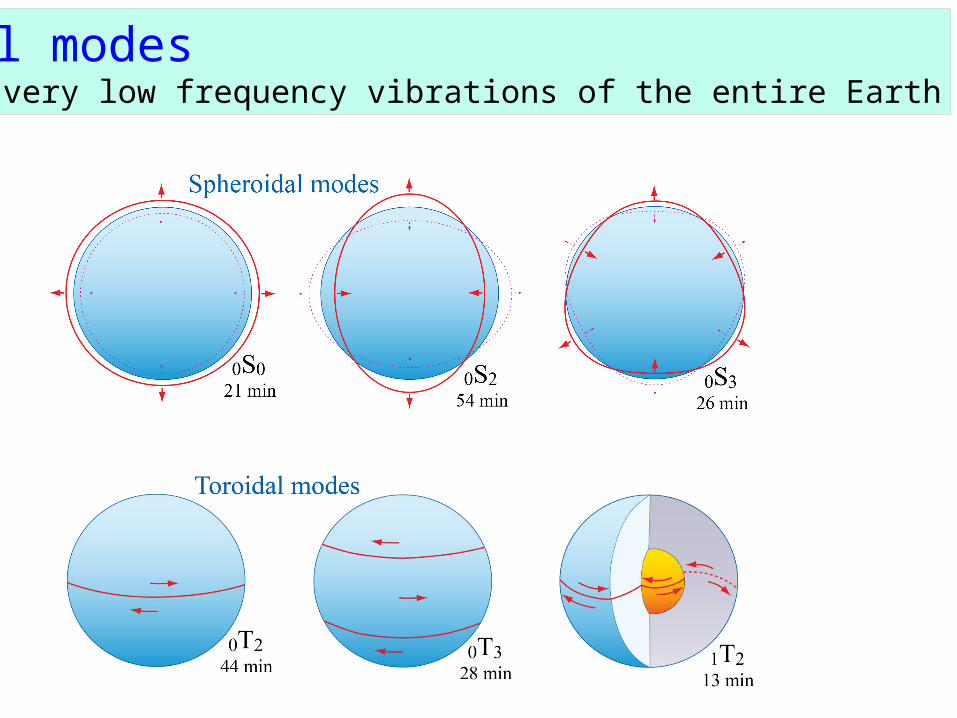
Normal modesGlobal, very low frequency vibrations of the entire Earth


G/r = vs2
K/r = vp2 – 4/3vs
2 = vf2 = F
vf: bulk sound velocity,
F : seismic parameter
Seismic velocities physical properties
Bulk modulus: K (= incompressibility / stiffness)
Shear modulus: G
vs2 = G/r
vp2 = (K + 4/3*G)/r

Bragg's lawpositive interference when nl = 2d sinq
Unit cell V and r as a function of p In-situ high-pT XRD, using high-intensity synchrotron radiation
Angle-dispersive XRDMonochromatic beam, fixed , l variable q
Energy-dispersive XRDPolychromatic (”white”) beam, fixed qd-spacings from the energy peaks
E = hf = hc/l
= l hc/E 2d sinq = nl = nhc/E
gasket

Dziewonski & Anderson (1981, PEPI) 4082 citations, May 28, 2013
ol ga px
wd rw ga
bm fp Ca-pv
pbm fp Ca-pv
liquid FeNi0.1
+ minor Si, O, S
solid FeNi0.1
First-order Earth structurePREM: Preliminary Earth Reference Model
- from seismology (normal modes) and gravity- includes r and p

Mg-pv
Ferro-periclase
garnet
Ca-pvga
garnetfp
FeNiS-metal
Mg-perovskite
BSE-image of subsolidus phase relations, 24 GPa

Simple system Mg2SiO4
Best one-component analogue to peridotite
Phase relations UM, TZ, LM:
Modified from Fei & Bertka (1999, Geochem. Soc. Spec. Publ. 6)

Pyroxene: Mg[6] Si[4] O3
Garnet: Mg3[8] MgSi[6] Si3
[4] O12
Akomotoite (ilmenite): Mg[6] Si[6] O3
Perovskite: Mg[8] Si[6] O3
System MgSiO3
Modified from Fei & Bertka (1999, Geochem. Soc. Spec. Publ. 6)
High-p crystal chemistry- without coordination number (CN) increase: high-p (or low-T) phase transitions: often decreasing symmetry
- CN-increase is common for high-p phase transitions Explanation: large anions are more compressible than small cations → reduced ranion/rcation-ratio

Stixrude and Lithgow-Bertelloni (2011, GJI)

Stixrude and Lithgow-Bertelloni (2011, GJI)pv: Mg-perovskitefp: ferropericlasemw: magnesiowustiteol: olivinewd: wadsleyiterwd: ringwooditest: stishovite
op: orthopyroxenecp: clinopyroxeneak: akimotoitega: garnetcor: corundum

First-order constraints on temperature
Inner-outer core boundary at 330 GPa / 5150 km: melting temperature of FeNi
660 km discontinuity:Reaction rwd = pv+fp at 24 GPa (endothermic transition - small drop in adiabat)
Location of mantle adiabat:below solidi of peridotite and basalt
Location of outer core adiabat:above solidus of FeNi (+ Si, O, S)
CMB: extreme thermal boundary layer ! 2500 - 3800 K ! (DT: 1300K)

Why such a large thermal boundary layer at CMB ?
Density contrast 5500 - 9900 kg/m3
precludes mantle - core mixing
Viscocity of solid rock is quite high, even at very high T near the CMB
peridotite liquid FeNi
T-dependent viscosity models Steinberger and Calderwood (2006, GJI)
CMB

Grand model, Masters and Laske, website
Seismic tomography models Large vS-amplitudes at the top and bottom of the mantle

Montelli et al. (2006, GGG)(finite frequency tomography)
S-wave models 6 depth sections: 900-2800 km

Two large anti-podal, slow provinces - LLSVP Africa – Pacific (near equator - 180º apart)
S-wave models, lowermost mantle (D”-zone)
The degree-2 velocity anomalies, recognized
>30 years ago, coincide with the residual geoid
e.g. Dziewonsky et al. (1977, JGR), Dziewonski & Anderson (1984, Am Sci)
Dziewonski et al. (2010, EPSL)

Dziewonski et al. (2010, EPSL)
L2-norm L1-norm
Cluster analysis of 5 tomographic modelsLekic et al. (2012, EPSL)
Seismic tomography, D"
Note the plume locations: many/most along the LLSVP-margins
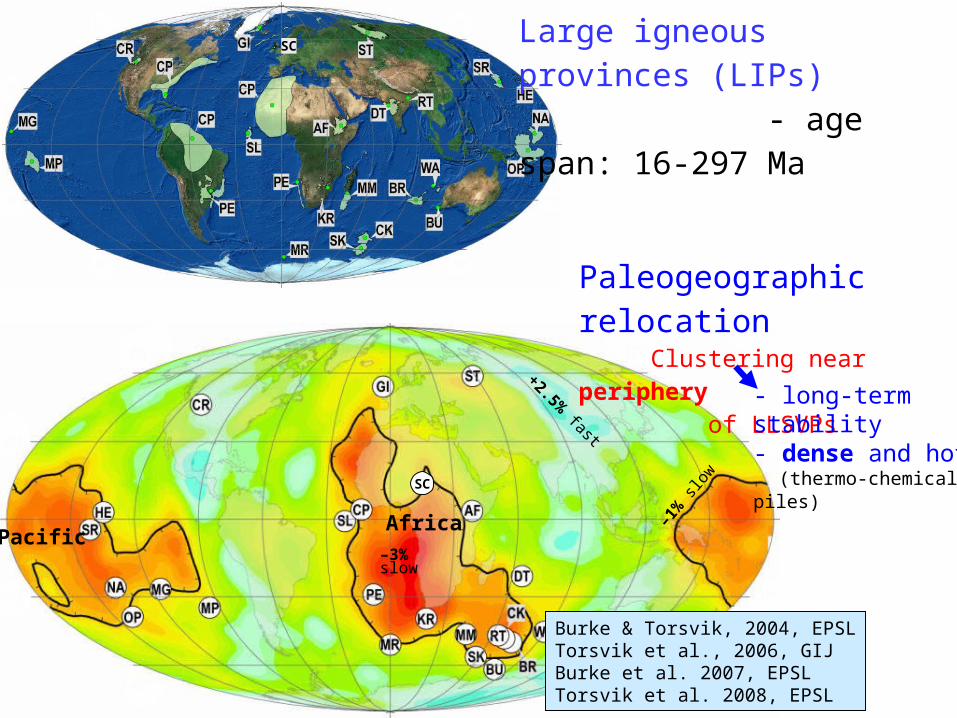
Paleogeographic relocation Clustering near periphery of LLSVPs
- long-term stability- dense and hot (thermo-chemical piles)
Large igneous provinces (LIPs) - age span: 16-297 Ma
SC
–1%
slow
+2.5% fast
–3%slow
AfricaPacific
Burke & Torsvik, 2004, EPSLTorsvik et al., 2006, GIJBurke et al. 2007, EPSLTorsvik et al. 2008, EPSL
SC
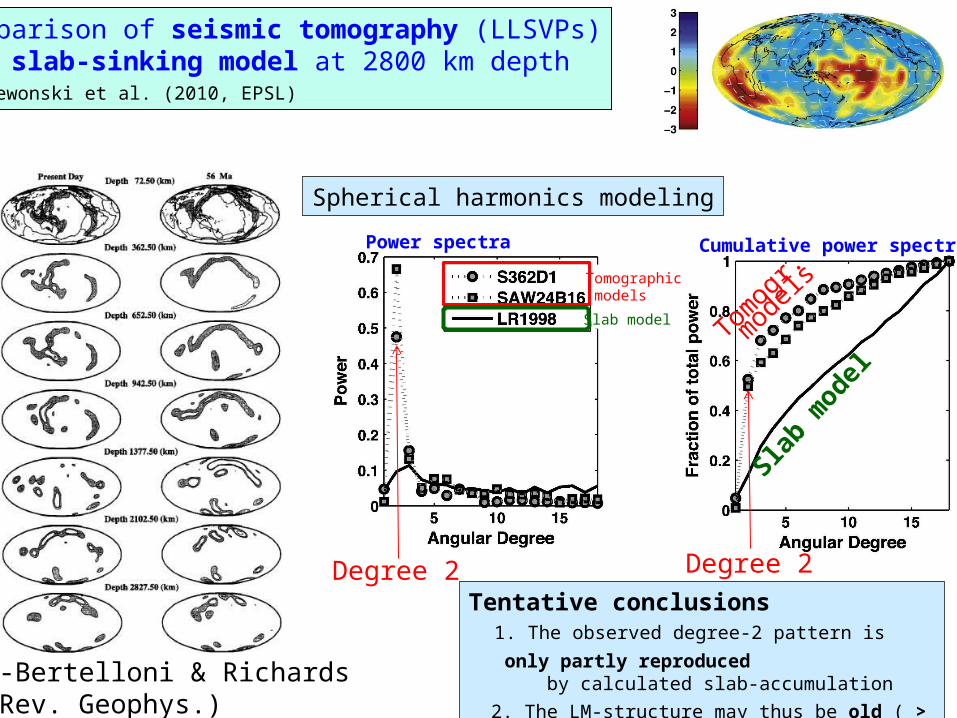
Comparison of seismic tomography (LLSVPs)and slab-sinking model at 2800 km depth Dziewonski et al. (2010, EPSL)
Lithgow-Bertelloni & Richards(1998, Rev. Geophys.)
Degree 2 Degree 2
Spherical harmonics modeling
Power spectra Cumulative power spectra
Slab m
odel
Tomog
r.
mod
elsTomographic models
Slab model
Tentative conclusions 1. The observed degree-2 pattern is only partly reproduced by calculated slab-accumulation
2. The LM-structure may thus be old ( > 300-500 Ma)


Hawaii Iceland
Montelli et al. (2006, GGG): Finite frequency seismic tomography

Red crosses: deep plumes (Montelli et al.)Black crosses: other plumes
Large lateral
vs-gradients

S-wave model
NE part of Pacific LLSVPSamoa quakes, recorded in N-America
S-wave model
Double crossing of thepv-ppv-transition
Large lateral variation Horizontal flow
Lay et al (2006)
Bin 1-3
Mantle flow model

Working model - Earth dynamics
Equatorial section
