mineral nutrition and growth of tropical maize as affected by soil acidity
TRANSCRIPT
Plant and Soil 252: 215–226, 2003.© 2003 Kluwer Academic Publishers. Printed in the Netherlands.
215
Mineral nutrition and growth of tropical maize as affected by soil acidity
J. Sierra1,3, C. Noël1, L. Dufour1, H. Ozier-Lafontaine1, C. Welcker2 & L. Desfontaines1
1Unite Agropedoclimatique de la Zone Caraïbe, and 2Unite de Recherches en Production Vegetale. INRAAntilles-Guyane, Domaine Duclos (Prise d’Eau), 97170 Petit-Bourg, Guadeloupe (French Antilles), France.3Corresponding author∗
Received 12 April 2002. Accepted in revised form 6 November 2002
Key words: leaf area index, nitrogen, oxisol, phosphorus, radiation-use efficiency, Zea mays L
Abstract
Soil constraints linked to low pH reduce grain yield in about 10% of the maize growing area in tropical developingcountries. The aim of this research was to elucidate the reasons for this maize yield reduction on an oxisol ofGuadeloupe. The field experiment had two treatments: the native non-limed soil (NLI, pH 4.5, 2.1 cmol Al kg−1,corresponding to 20% Al saturation), and the same soil limed 6 years prior to the experiment (LI, pH 5.3, 0 cmolAl kg−1). The soils were fertilized with P and N. The above-ground biomass, root biomass at flowering, grain yieldand yield components, leaf area index (LAI), light interception, radiation-use-efficiency (RUE), P and N uptake,soil water storage, and soil mineral N were measured during the maize cycle. The allometric relationships betweenshoot N concentration, LAI and above-ground biomass in LI were similar to those reported for maize croppedin temperate regions, indicating that these relationships are also useful to describe maize growth on tropical soilswithout Al toxicity. In NLI, soil acidity severely affected leaf appearance, leaf size and consequently the LAI,which was reduced by 60% at flowering, although the RUE was not affected. Therefore, the reduction in theabove-ground biomass (30% at flowering) and grain yield (47%) were due to the lower LAI and light interception.At flowering, the root/shoot ratio was 0.25 in NLI and 0.17 in LI, and the root biomass in NLI was reduced by64% compared to LI. Nitrogen uptake was also reduced in NLI in spite of high soil N availability. Nevertheless,shoot N concentration vs aboveground biomass showed a typical decline in both treatments. In NLI, the shootP concentration vs above-ground biomass relationship showed an increase in the early stages, indicating that Puptake and root-shoot competition for the absorbed P in the early plant stages controlled the establishment and thedevelopment of the leaf area.
Introduction
Soil acidity reduces maize yields on about 8 mil-lion hectares, mostly in tropical developing countries(Granados et al., 1993). Aluminium toxicity due tohigh exchangeable Al, reduced P uptake due to lowavailable soil P and a high soil P fixation capacity arethe main factors affecting maize growth and yield onacid soils (Gaume et al., 2001). Aluminium resistanceis the principal aim of maize breeding programmes forthese soils (Bushamuka and Zobel, 1998). Aluminium
∗ FAX No: 590-941663.E-mail: [email protected]
toxicity first affects root growth and then nutrientuptake and consequently aboveground biomass accu-mulation. Several mechanisms can contribute to Alresistance either by exclusion of Al from the roots orby detoxification in the plant (Rout et al., 2001).
The behaviour of maize in the presence of highsoluble Al, such as the decrease in NO3
− uptake (Routet al., 2001), the increase in the root/shoot ratio (Ba-ligar et al., 1997) and the decrease in length of thefirst-order lateral roots (Urrea-Gómez et al., 1996), issimilar to its behaviour when growth is limited by lowP availability in non-acidic soils (de Magalhães et al.,2000; Mollier et Pellerin, 1999). Whilst in non-acidicsoils such behaviour disappears when P is applied at a

216
rate slightly greater than the expected P uptake, mostof the reported studies carried out in acid soils showthat P application alone has no effect in alleviating theeffect of Al toxicity (Lucresio and Duque, 1999).
Most research on the Al effect and tolerance areshort term greenhouse bioassays, often using nutrientsolutions (Urrea-Gomez et al., 1996). However, littleinformation is available on the effect of Al toxicityon the physiology of maize grown to maturity in thefield. Moreover, when experiments were carried outin the field, only a few agronomic variables, suchas yield, above-ground dry matter, plant height andanthesis-silking interval, were measured (Collet andHorst, 2001). To improve breeding programmes formaize as well as models for its growth on tropicalacid soils, there is a need for further knowledge of therelationships between Al toxicity, mineral nutrition,radiation-use-efficiency and leaf growth throughoutmaize growth. Concerning growth models, Bowen etal. (1993) tested the CERES-Maize model for a maizecrop on an oxisol in central Brazil, and suggestedthat some discrepancies between observed and sim-ulated data could be associated with inaccuracies inmodel assumptions related to phenology and growthof tropical maize cultivars.
The present research was carried out in order toanalyze maize growth and mineral nutrition on twoacid tropical soils with 0% and 20% of Al satura-tion. We studied mainly how P and N nutrition affectbiomass accumulation, light interception and the ef-ficiency with which the intercepted light was usedto produce dry matter. These results are comparedwith those obtained in several studies carried out intemperate regions.
Materials and methods
Field experiment
The experiment was carried out in Guadeloupe(French Antilles) at the Duclos Experimental Station(16◦ 15′ N, 61◦ 40′ W) of the Institut National de laRecherche Agronomique. The average annual air tem-perature is 25.5 ◦C (26.7 ◦C for the hottest month and23.4 ◦C for the coldest) and the mean annual rainfallis 3000 mm. The soil is an acid, kaolinitic, dark redoxisol (Typic eutroperox, US Soil Taxonomy). The ex-periment was carried out on two 750 m2 plots, located50 m apart, named NLI (non-limed) and LI (limed).NLI correspond to the natural native soil, and LI is the
same soil but it was limed in 1995. The main differ-ences between soils for the 0–0.2 m soil layer were:exchangeable Al content (2.1 cmol kg−1 for NLI, cor-responding to 20% of Al saturation, and 0 cmol kg−1
for LI), pH (water) (4.5 for NLI and 5.3 for LI), andexchangeable Ca (2.8 cmol kg−1 for NLI and 3.9 cmolkg−1 for LI). Other soil characteristics such as organicC, 22 g kg−1; total N, 1.8 g kg−1; exchangeable K,0.35 cmol kg−1; clay, 80% (dominated by kaoliniteand halloysite); silt, 18%; and sand, 2% were notsignificantly different between plots (P < 0.05).
Land preparation consisted of disking, performedin February and March 2001, and field cultivation 7d before planting. Maize, cultivar Spectral (Al Rifaï,2000), was sown on 19 April 2001 at a plant densityof 50 000 plants ha−1 (0.8 m between rows, 0.25 mwithin rows) which corresponds to that currently usedby farmers in the Caribbean region. This cultivar ismoderately tolerant of soil acidity. Phosphorus and Kwere applied as KH2PO4 7 d before sowing at a rateof 77 kg P ha−1 and 94 kg K ha−1. Nitrogen was ap-plied as urea 7 d after sowing at 90 kg N ha−1, andagain 56 d after sowing (flowering in LI) at 60 kg Nha−1. To ensure uniform nutrient distribution, all thefertilisers were broadcast by hand. Irrigation was ap-plied, as estimated from the soil water profile, to avoidsevere water deficiency. Rainfall, solar radiation, min-imum and maximum air temperature, air humidity andwind speed were recorded daily at a standard weatherstation located 500 m from the plot.
Aerial plant measurements
Numbers of visible, expanded and senescent leaveswere recorded from emergence to grain filling. Afteremergence, 20 plants per plot were regularly selectedand tagged within the four innermost rows (5 plantsper row). A leaf was considered expanded when theligule was visible and senescent when more than halfof its area was chlorotic. The number of visible leavesand the length and width of each expanded leaf wasmeasured every 5 – 7 d. The area of each expanded leafwas calculated as k × length × width with k = 0.75(McKee, 1964). Leaf Area Index (LAI) at each datewas calculated from these measurements by using themethod proposed by Ruget et al. (1996). Senescentleaves were not taken into account in LAI.
Over the same period, above-ground biomass wasmeasured every 7–10 d by sampling 8 plants selec-ted at random in the central rows of each plot. Drymatter of each plant was determined after drying at
217
80 ◦C for 3 d. After flowering, ear dry matter was de-termined separately. After determining the dry matter,the two biggest and the two smallest plants of eachplot were discarded, and the remaining 4 plants wereground (< 0.2 mm) and bulked for N and P analysis.Ears and vegetative organs were analyzed together.Nitrogen was measured using an elemental analyzer(TermoQuest Italia SPA, Italy), and P was determinedcolorimetrically with an autoanalyzer (Technicon In-dustrial Systems, USA) using the method describedby Novozamsky et al. (1983).
Grain yield and yield components were measuredon 31 July 2001 by harvesting 30 plants at randomon each plot. Grain was harvested before maturity (at45% kernal moisture content), high rainfall and air hu-midity at the beginning of the rainy season sometimescausing germination in the ears. For each plant, thenumber of rows per ear, as well as the number andweight of grains per ear, were determined.
Estimation of root biomass
Root biomass was estimated 53 d after sowing (flower-ing in LI) using an electrical capacitance method (vanBeem et al., 1998). In order to minimize the effectof the soil’s own electrical resistance, measurementswere made after a fall of rain restoring the soil tofield capacity; i.e. 0.40 kg kg−1 in the 0–0.2 m layer.A digital portable capacimeter (ELC-131 D, Escort,Française d’Instrumentation, France) was used for alldeterminations. Measurements were performed at a 1kHz frequency. These measurements require two typesof stainless steel rods. The positive rod, 0.8 cm in dia-meter and 30 cm in length, was inserted into the soilat 20 cm depth and at 20 cm from the maize stem. Thenegative rod, 0.2 cm in diameter and 0.13 cm in length,was inserted into the maize stem at 6 cm from the soilsurface. Measurements were made on 8 maize plantsin each plot. The above-ground biomass of these plantswas determined after the root capacitance measure-ments. Another 7 plants (4 plants in LI and 3 plants inNLI) were used to fit the relationship between root dryweight and root electrical capacitance. For this, aftermeasuring the root electrical capacitance as before, the7 root systems were excavated to 0.4 m depth, rootswere carefully collected and then root dry weight wasmeasured. A good correlation (R2 = 0.88, P < 0.05)was obtained between both variables.
Soil measurements
The soil profile was sampled with a 0.06 m-diameterauger in 0.2 m increments to a depth of 0.6 m in or-der to determine mineral N and water content. Themeasurements were made every 10 d. For each plotsoil samples were collected in duplicate. Water contentwas determined by oven drying at 105 ◦C. Nitrate-Nand NH4-N in the samples were extracted by shak-ing 20 g of moist soil for 2 h with 100 mL of 0.5M KCl. Mineral N analysis was performed colori-metrically with an autoanalyzer (Technicon IndustrialSystems, USA) using the hydrazine reduction methodfor NO3-N (Kampshake et al. 1967) and the nitro-prusside method for NH4-N (Kaplan, 1965). In bothplots, P was extracted using the Olsen and the Truogmethods (Dabin, 1967) on soil samples of the 0–0.2m layer taken one month prior to the application of Pfertilizer and at the end of the experiment.
Calculations
Thermal time after sowing was calculated on a dailybasis using a base temperature (Tb) of 6 ◦C (Bon-homme et al., 1994):
T Tn =∑
{[(T maxn + T minn)/2] − T b}, (1)
where Tmaxn and Tminn (◦C) are the maximum andthe minimum daily air temperatures, respectively.
The daily incoming photosynthetically active radi-ation absorbed by the canopy PARan (MJ m−2) wascalculated according to Bonhomme et al. (1982):
PARan = 0.95
× PARin[1 − exp(−0.70 × LAIn)], (2)
where 0.95 is the coefficient which accounts for thereflection of the incoming radiation by the canopy, and0.70 is the coefficient which accounts for radiation ex-tinction in the canopy. LAIn (m2 m−2) between twoconsecutive measurements was calculated by linearinterpolation. PARin was calculated from the dailyincoming global solar radiation Rgn (MJ m−2) asproposed by Varlet-Grancher et al. (1982):
PARin = 0.48 × Rgn (3)
For each sampling date, the radiation-use-efficiency RUE (g MJ−1) for the above-ground bio-mass production was calculated as:
RUE = (Wn − Wn−1)/
(cPARan − cPARan−1),(4)
218
where Wn and Wn−1 (g m−2) are the aboveground bio-mass measured on dates n and n-1, respectively, andcPARan and cPARan−1 are cumulative PARa on datesn and n-1, respectively.
The N nutrition index (NNI) of the crop wascalculated as proposed by Lemaire et al. (1989):
NNI = Nn/Nc, (5)
where Nn (%) is the N concentration of the above-ground biomass measured at date n, and Nc(%) is thecritical N concentration for the above-ground biomassat the same date (i.e. N concentration to achieve themaximum growth rate); Nc was estimated as proposedby Plénet and Lemaire (2000) for maize crops:
Nc = 3.40 for Wn ≤ 100 g m−2
Nc = 3.40 × W−0.37n for Wn > 100 g m−2 (6)
Statistical analysis
For all the variables, differences between means ofplots were analyzed using classical t-test. The analysiswas made date by date for the variables changing withtime. The relationships obtained for LAI vs above-ground biomass were linearized prior to the analysis ofthe differences between parameters, performed usingt-tests.
Results
Plant growth and stages
Figure 1a shows the LAI as a function of thermal timeafter sowing for the two plots. Differences between LIand NLI were significant (P < 0.05) for the entiremaize cycle. Differences between plots were greaterduring the period of exponential growth. In both plotsthe maximum LAI (3.3 in LI and 1.3 in NLI) wasreached near the flowering stage, which correspondedto 1100 ◦C days for LI and 1400 ◦C days for NLI (i.e.14 days of delay in NLI). The appearance of leaveswas markedly delayed in NLI (Figure 1b), and differ-ences between plots for the number of visible leaveswere significant throughout the entire growth period(P < 0.05). The delay was greater during the ex-ponential period of growth; i.e. 5 d for leaf 8 and13 d for leaf 12. The final number of leaves was18.8 ± 1.0 for LI and 15.4 ± 1.5 for NLI (mean ±standard error). The number of leaves considered as
senescent at a given thermal time was not differentbetween plots (P < 0.05) (Figure 1b). However, for agiven thermal time the senescent/visible leaf ratio wasgreater in NLI. The final leaf area was also smallerin NLI (P < 0.05) (Figure 1c), and the differenceswere relatively greater in the exponential period of leafgrowth. Since the number of plants per unit area wasnot affected in NLI (5 plant m−2), the reduction of LAIin this plot was due to the delay in leaf appearance, thesmaller leaf area and the high senescent/visible leafratio. As a consequence of the reduction of LAI, thecalculated amount of PARa was always lower in NLI(Figure 1d). For example, at 1100 ◦C days (floweringin LI), the PARa was 110 MJ m−2 in NLI and 230 MJm−2 in LI; the PARa was 200 MJ m−2 at flowering inNLI (i.e. 68 d after sowing).
Above-ground biomass and yield components
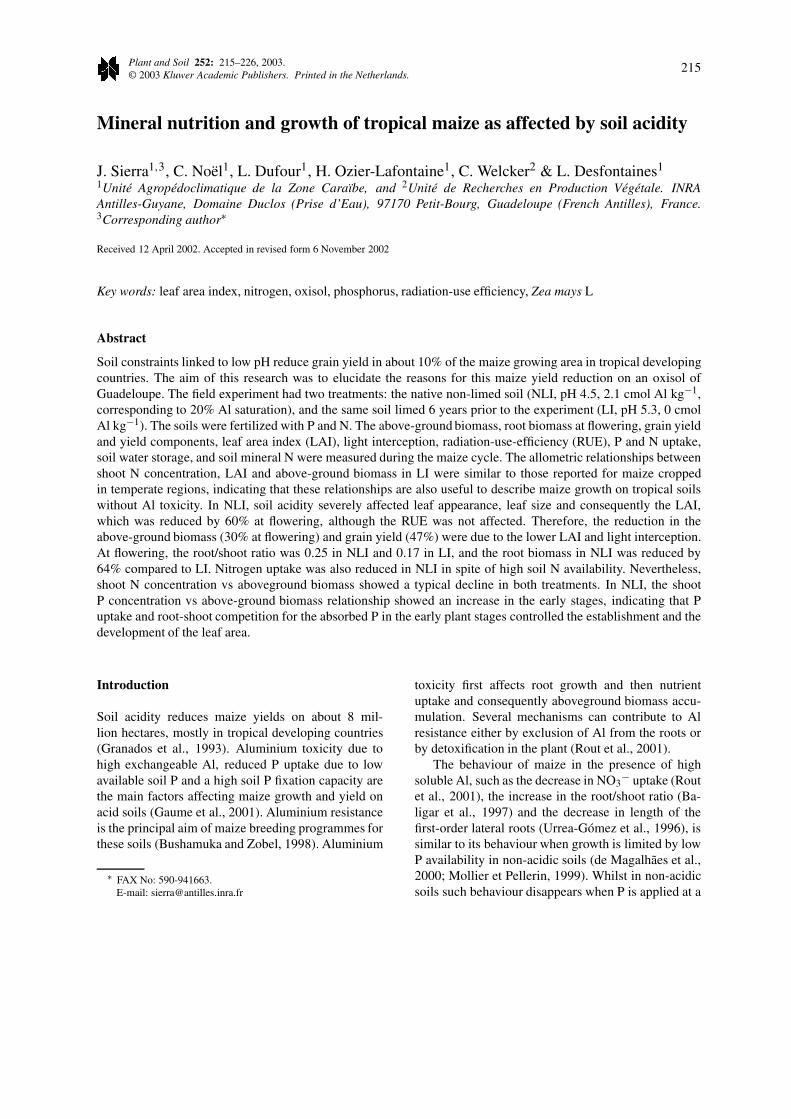
Figure 2a shows the total aerial dry matter for thetwo plots as a function of thermal time after sowing.Above-ground biomass was lower in NLI (P < 0.05)throughout the entire growing period. As for LAI, thelargest differences between plots were observed dur-ing the exponential period of growth. In this periodabove-ground biomass in NLI was only 20–22% ofthat in LI. The differences were less when the plotswere compared at the same stage. For example, atflowering, the above-ground biomass in NLI represen-ted 71% of that observed in LI. Differences betweenplots for the vegetative organs after flowering (i.e.excluding dry weight of ears) were also significant(P < 0.05). In Figure 2b we present the relation-ships between LAI and above-ground biomass for bothplots. As found previously by Plénet and Lemaire(2000) in temperate regions of France with non-N lim-ited maize crops, this relationship is not linear and maybe fitted to a power function:
LAIn = a × Wnb, (7)
where a and b are empirical coefficients. Equation[7] is valid up to maximum LAI (in our study: 6data points for LI and 7 data points for NLI). Therelationship obtained for LI was very similar to thatproposed by Plénet and Lemaire (2000) and the fittedb-values (0.676 in LI and 0.679 in Plénet and Lemaire,2000) were not significantly different (P < 0.05). ForNLI, the value of b (0.617) was significantly lower(P < 0.05) than that obtained in LI indicating thatLAI in this plot was relatively more affected than plantbiomass.

219
Figure 1. Development of (a) leaf area index (LAI) and (b) number of leaves as a function of thermal time; (c) leaf area as a function of the leafnumber; (d) cumulative PAR as a function of the thermal time, for the maize crop in the non-limed (NLI) and the limed (LI) plots from sowingto grain filling. Vertical bars indicate the standard error.
For both plots, a non-linear relationship was ob-served between the above-ground biomass and thecumulated PARa (Figure 2c). The calculated RUEdecreased between the first and the second samplingdates, probably due to the effect of the grain reserve atthe first sampling date. After this, the RUE increasedin both plots and was higher in LI. Figure 2d repres-ents the calculated RUE in the pre-flowering period asa function of LAI: RUE varied with time but it wassimilar in both plots for a given leaf area.
Table 1 gives the grain yields and yield compon-ents for the two plots. All of the yield componentswere significantly higher in LI, the largest differencebeing for the number of grains per m2. As mentionedabove, the maize was harvested before maturity andthis could have affected the weight of 1000 grains,especially in NLI, by reducing the grain filling period.
Table 1. Maize yield components measured in the non-limed (NLI)and limed (LI) plots. Plant density was 5 plants m−2 in both plots.The weight of 1000 grains and grain yields are expressed on a drymatter basis
NLI LI NLI/LI ratio
Grain yield (g m−2) 309 ± 143 a† 576 ± 185 b 0.54Number of grains m−2 1570 ± 564 a 2324 ± 722 b 0.68Weight 1000 grains (g) 196 ± 48 a 240 ± 34 b 0.82Number of rows per ear 12.8 ± 1.4 a 13.5 ± 1.8 b 0.95
† Mean ± standard error (n = 30). Within lines, means followed bydifferent letter are significantly different (P < 0.05).
Table 2. Shoot and root biomass in the non-limed (NLI) and thelimed (LI) plots, at 53 d after sowing (flowering in LI)
Shoot biomass Root biomass Root/Shoot ratio
g plant−1
LI 22.7 ± 4.9 a† 4.8 ± 0.8 a 0.25 ± 0.06 a
LI 80.0 ± 8.0 b 13.0 ± 1.1 b 0.17 ± 0.01 a
† Mean ± standard error (n = 8). Within rows, means followed bydifferent letter are significantly different (P < 0.05).
220
Figure 2. Maize growth and radiation-use-efficiency in the non-limed (NLI) and the limed (LI) plots: (a) above-ground biomass as a functionof thermal time; (b) relationship between the leaf area index (LAI) and the above-ground biomass; (c) above-ground biomass as a function ofPAR; (d) RUE as a function of LAI. Data correspond to the sowing-grain filling period and sowing-flowering period for (a) and (c), and (b) and(d), respectively. In (b), the relationship of Plenet and Lemaire (2000) was obtained from non-N-limited maize field crops. Vertical bars in (a)and (c), and horizontal bars in (b) indicate the standard error.
Root biomass
Root biomass estimated 53 d after sowing was sig-nificantly greater in LI (P < 0.05) (Table 2). Theroot/shoot biomass ratio was higher in NLI but dif-ferences were not significant because of the largevariation of the ratio in this plot; i.e. the coefficientof variation was 62% in NLI and 19% in LI.
N and P concentration in shoots
Nitrogen concentration decreased with the increase ofaerial biomass even at the younger plant stages (Figure3a). We estimated NNI (Equation [5]) only for above-ground biomass >100 g m−2 (4 data points for NLIand 5 data points for LI). For these values of above-ground biomass, N concentration in LI was close to thecritical level proposed by Plénet and Lemaire (2000).The calculated NNI was 1.06 ± 0.04 indicating that
the crop was not limited by N. In NLI, N concentra-tion as a function of the above-ground biomass wasalways lower than that in LI, and the calculated NNI(0.82 ± 0.04) was significantly lower (P < 0.05). Itis interesting to note that up to 41 d after sowing the Nconcentration was higher in LI; after this, N concen-tration was higher in NLI. At the last sampling date,at 78 d after sowing, the amount of N in the above-ground biomass was 70 kg N ha−1 in NLI and 170 kgN ha−1 in LI. At flowering, the values were 65 kg Nha−1 for NLI and 95 kg N ha−1 for LI.
The relationship between P concentration andabove-ground biomass was very different from thatobserved for N (Figure 3b). For LI, P concentrationremained relatively constant and around 0.30% for anaerial biomass <100 g m−2; after this, P concentra-tion decreased with the increase in aerial biomass.For NLI, P concentration increased from 0.15% to0.30% for the period with an aerial biomass <100 g

221
Figure 3. Relationship between (a) shoot N concentration and (b) shoot P concentration, and the above-ground biomass of maize for thenon-limed (NLI) and the limed (LI) plots; (c) idem (b) for above-ground biomass < 100 g m−2; (d) N/P ratio as a function of the above-groundbiomass. In (a), the relationship of Plenet and Lemaire (2000) was obtained from non-N-limited maize field crops.
m−2 (Figure 3b,c) and then it decreased as in LI. Theend of the period with a constant P concentration inLI and with an increase in P concentration in NLIcorresponded approximately to the beginning of theexponential period of plant growth in each plot. Atthe last sampling date, P in the above-ground biomasswas 9 kg P ha−1 in NLI and 27 kg P ha−1 in LI. Atflowering, the values were 8 kg N ha−1 for NLI and11 kg N ha−1 for LI.
The N/P concentration ratio decreased abruptly inthe first stages of the maize crop, after which it de-creased slightly; it was approximately constant afterflowering (Figure 3d). In the exponential period ofgrowth, the ratio was lower in NLI which suggests thatN nutrition of the above-ground biomass was morerestricted than P nutrition.
Available N and P in soil and water storage
Soil mineral N content was significantly higher in NLI(P < 0.05) except at the first three sampling dates
(Figure 4a). The decrease in mineral N from day 20 today 60 in LI and from day 30 to day 60 in NLI, cor-responded to the exponential period of maize growth.The higher N content in NLI was due to the lowerplant uptake in this plot. At the end of this period, theamount of mineral N was 60 kg N ha−1 in LI and 120kg N ha−1 in NLI, and more than 75% of the mineralN was present in the top 0.4 m layer.
Water storage increased from 300 mm to about 360mm in the first 20 d of the experiment due to rainfalland irrigation (Figure 4b). It then decreased slightlydue to plant uptake. Differences between plots weresignificant (P < 0.05) only at the end of the exper-iment. In that period water storage was less in NLIprobably due to soil evaporation because of less soilshading by the crop. In spite of this, the values of waterstorage throughout maize growth indicate that wateravailability did not limit plant growth either in NLI orin LI.
The results of soil P measured using either theOlsen or the Truog methods were not conclusive con-

222
Figure 4. Changes in mineral N in soil (a), and in water storage(b) with time for the non-limed (NLI) and the limed (LI) plots forthe sowing-grain filling period. Data correspond to the 0–0.6 m soillayer. Vertical bars indicate the standard error.
cerning its availability to the plant. For example, forthe Olsen method, prior to the beginning of the exper-iment, available P was 6 mg kg−1 in NLI and 2 mgkg−1 in LI; at the end of the experiment, the valueswere 6 mg kg−1 in NLI and 4 mg kg−1 in LI. The val-ues were extremely low and the effect of P applicationwas not noticeable either for the Olsen or the Truogmethods.
Discussion
N and P nutrition
In spite of the considerable amount of P fertilizer ap-plied in both plots, the available P as measured bythe Olsen and the Truog methods did not indicate anysignificant increase. It is well known that the interpret-ation of soil P analysis is difficult to perform in acidsoils (Compaoré et al., 2001). Therefore, we do not
really know whether the level of available P in NLIactually limited growth. Hence we cannot distinguishbetween the effect of Al toxicity and the possible ef-fect of P deficiency on plant growth, and we will usethe term ‘soil acidity’ to describe these effects. How-ever, from the results found in this study, it seemsthat available P did not limit maize growth in LI. Thisis supported by two facts. Firstly, P concentration inshoots was similar to those reported in non-P limitedmaize crops (e.g. Plénet et al., 2000a). Secondly, therelationship between LAI and above-ground biomassand between N concentration and above-ground bio-mass (Figures 2b and 3a), were close to those reportedby other authors for non P-limited maize crops. Ifavailable P, or another factor, limited growth in LIthese relationships should have been affected. Thismay be verified by the relationship between shoot Nconcentration and above-ground biomass in NLI (Fig-ure 3a). In this plot, maize growth was limited by soilacidity but not by N availability (Figure 4a), howeverthat relationship suggested N deficiency. For thesereasons, we consider than neither P nor N availabilitylimited maize growth in LI.
The data for root biomass indicated that soil acidityseverely affected root growth in NLI, and this is inagreement with the results reported by other authors(e.g. Baligar et al., 1997). Soil acidity could also af-fect root physiology and nutrient uptake, and this mayexplain why shoot N concentration was lower in NLIin spite of higher soil N availability and the fact thatmost of mineral N was concentrated in the first 0.4 mdepth. To investigate this, we made some observationsof root profiles in both plots and verified that most ofthe root systems were within the first 0.4 m depth, andonly few secondary roots went down to 0.6–0.7 m.
The decrease in N concentration with the increasein above-ground biomass (Figure 3a) is usually at-tributed to an increase in plant structural tissues witha lower N concentration, and self-shading of leaves,inducing a low N concentration in the shaded leaves(Plénet and Lemaire, 2000). These authors proposedthat this relationship may be used as a diagnostic toolfor N status in maize, and our results suggested thatsuch proposal is also suitable for tropical maize grow-ing on acid soils. However, soil pH has to be taken intoaccount in order to use this relationship or the calcu-lated NNI properly. Whilst for acid soils without Altoxicity the NNI will reflect N availability in soil, NNIin very acid soils will depend mainly on the effect ofAl toxicity on nutrient uptake. In this way, NNI could
223
be used to test the tolerance of different cultivars for agiven soil and N availability.
It is interesting to note that Plénet and Lemaire(2000) found that, up to 50 d after sowing, shootN concentration in N-limited maize crops was lowerthan, and aerial biomass was equal to those observedin non-N-limited maize crops. After that period, Nconcentration and above-ground biomass in N limitedcrops were lower than those observed in non-N- lim-ited crops. In our study, N concentration and above-ground biomass were lower in NLI throughout themaize cycle. This confirms that the pattern in the de-crease of N concentration observed in NLI was not atypical response of maize to N limitation in soil but aneffect of the reduction of N uptake.
The initial increase in P concentration in NLI wasan unexpected result. Plénet et al. (2000a) also repor-ted an increase in shoot P concentration of maize butit was observed later in growth, namely from 8 to 12visible leaves. In addition, they observed that the in-crease was more noticeable in P-limited plants thanin non-limited ones, and attributed it to the growthof the root system and the subsequent higher P up-take. This could be the case for NLI in our study.Because P fixation in acid soils diminishes P diffusiontowards plant roots, P uptake depends strongly uponroot growth. Moreover, if as suggested by the valuesof the root biomass, the root/shoot ratio was higher inNLI, this should contribute to a progressive increase inthe P supply/demand ratio and the P concentration inyoung plants (Plénet et al., 2000a). This effect was notnoticeable for N, probably due to its higher mobilityin soil. In addition, Mollier and Pellerin (1999) foundthat P accumulates in roots of young maize plants asa response to P deficiency, and Gaume et al. (2001)observed that a part of the P absorbed by maize con-tributes to Al-detoxification by inducing the formationof insoluble Al-P compounds in roots. Therefore, Pdeficiency and Al toxicity together could induce com-petition between roots and shoots for the absorbed P,which could explain the extremely low P concentra-tion in shoots in the early plant stages in NLI. Thesame hypothesis could explain the surprising findingthat N deficiency was more severe than P deficiencyon the very acid NLI soil during the exponential periodof growth (Figure 3d). Mollier and Pellerin (1999)observed that the root P/shoot P ratio decreased withtime as more P was progressively transferred towardthe aerial parts of the plant. Therefore, P accumulatedin roots could play a major role in the nutrition of theabove-ground biomass after the first stages of growth.
An alternative hypothesis to explain the increase inP concentration deals with the different resistance ofroots to Al toxicity. Bushamuka and Zobel (1998) ob-served that although tap and seminal roots of somemaize cultivars were not acid soil tolerant, nodal andlateral roots were resistant to Al toxicity. This couldresult in increased P uptake as the later two types ofroots begin to develop.
Some authors used the Nutrient Efficiency Ratio(NER) in order to analyze the effect of soil acid-ity on maize growth (e.g. Baligar et al., 1997). TheNER for a given element was calculated as the ratiobetween the shoot biomass and the amount of the ele-ment contained in it, both variables were measured onthe same date, generally in greenhouse studies. Theresults of the present study showed that a such in-dex is not suitable because measurements made at asingle date in short-term experiments do not representthe behaviour of a given nutrient over the course ofplant growth. Hence, NER may vary between treat-ments during growth. For example, in our study, thecalculated NER for N was 29 for NLI and 26 for LIat 27 d after sowing, and 39 for NLI and 42 for LI at53 d after sowing. It is evident that the use of NERas estimated at a single date will introduce a bias intothe analysis because the index varies with plant growthand the pattern of nutrient dilution.
Yield and dry matter production
Soil acidity reduced grain yield in NLI by affectingmainly the number of grains per m2. The reductionin this component was 32% (Table 1) which was sim-ilar to that observed in the above-ground biomass atflowering (29%) (Figure 2a). This was not surpris-ing because yield components such as the number ofovules per row is determined at that time (Otegui andBonhomme, 1998).
Plant development in LI expressed as a functionof thermal time was the same as that observed in othertropical and temperate maize cultivars without nutrientlimitation or water stress (Bonhomme et al., 1994).As mentioned above, Bowen et al. (1993) suggestedthat discrepancies between their observed data andthat simulated using the CERES-Maize model mightbe due to the assumptions about made phenology in-cluded in the model. From our results, it seems thatdifferences between theoretical and experimental datafor tropical maize cultivars may be due to the para-meter values for a particular cultivar (e.g. thermaltime needed to reach a given developmental stage).

224
The allometric relationships between LAI and above-ground biomass and between N concentration andabove-ground biomass in LI, which were very similarto those found for temperate maize, suggest that theyare useful for describing maize behaviour independ-ently of the climate. However, the absolute values ofLAI and above-ground biomass in LI were lower thanreported in other studies. This was primarily due tothe relatively low plant density used in tropical maizecrops: 50 000 plants ha−1 in our study, 80 000–90 000plants ha−1 in Plénet and Lemaire (2000) and Plénetet al. (2000a,b).
In NLI, soil acidity affected aerial growth in twoways: (i) the appearance of leaves was delayed, and(ii) the individual leaf area and LAI were reduced.Because soil acidity did not affect RUE, it seems thatother effects such as the reduction in the above-groundbiomass were a direct consequence of the lower LAIand PARa. The greatest differences between LI andNLI occurred between 600 ◦C days and 1000 ◦C days,which was within the period of increase in P concen-tration in NLI. Later, the differences between plotswere smaller and this corresponded to the period ofP dilution in shoots (Figure 3b). This behaviour wasdifferent of that reported by Plénet et al. (2000a,b)studying the effect of P deficiency on maize growth.They found that the maximum differences in LAIand above-ground biomass between limited and non-limited- P maize crops expressed between 400 and600 ◦C days, just after a decrease in P concentration inshoots. Thereafter, these authors observed a temporalincrease in P concentration, with a subsequent de-crease in the relative differences between treatments.This confirms that the effect of soil acidity on maizegrowth in NLI cannot be described simply in terms ofP availability in the soil. Further research is necessaryto separate the effects of Al toxicity and P availability,and to identify the role of P nutrition in the early stagesof growth.
The estimated RUE was within the range of val-ues reported by maize by other authors (Kiniry etal., 1989; Plénet et al., 2000b). However, as RUEwas estimated from the above-ground biomass, its in-crease with time could be the consequence of morebiomass being allocated to the root system early ingrowth (Mollier and Pellerin, 1999). Although theabove-ground biomass was severely reduced by soilacidity, the RUE estimated in NLI was similar to thatof LI. This implies that, for a given period, the aerialbiomass was reduced in NLI to the same extent as theabsorbed PAR. Considering that the root/shoot ratio
was probably higher in NLI, this reinforces the ideathat soil acidity did not affect the transformation of theabsorbed PAR into dry matter.
Whilst for a given LAI the RUE was similar in bothplots (Figure 2d), N and P concentrations in shootswere lower in NLI. For example, for LAI = 1, the RUEwas 1.47 g MJ−1 in LI and 1.33 g MJ−1 in NLI (a10% reduction), N concentration was 3.6% in LI and2.6% in NLI (a 28% reduction), and P concentrationwas 0.34% in LI and 0.27% in NLI (a 13% reduction).Muchow and Sinclair (1994) observed that in maizeRUE increased strongly for leaf N concentrations upto 1.5 g N m−2 leaf, after which it remained constant.We did not measure leaf N content and we do not knowwhether the shoot N concentration measured here cor-responded to the threshold value proposed by Muchowand Sinclair (1994). To test this, we performed somecalculations in order to estimate leaf N from our meas-urements of N shoot and LAI. For this, we used theresults of N partitioning between stem and leaf presen-ted by Girardin (1998) for maize, and assumed thatN partitioning did not vary due to soil acidity. Thecalculated values of leaf N ranged from 1.6 g N m−2
leaf to 2.0 g N m−2 leaf in both plots; hence, theestimated leaf N was higher than the threshold pro-posed by Muchow and Sinclair (1994). Concerning Pnutrition, Plénet et al. (2000b) concluded that shootP concentrations above 2 mg g−1 dry weight do notaffect RUE. In our study, this was the case for LIand for most of the maize cycle in NLI (Figure 3b).We concluded that RUE in NLI was not affected be-cause the critical levels of N and P concentration werereached throughout growth. However, this hypothesisneeds to be confirmed in future work, including themeasurements of leaf N and P concentrations.
Conclusion
The length of the period during which shoot P concen-tration increased in the very acid soil could reflect theability of the plant to take up soil P and to transfer ittowards the aerial organs. If this is true, then it couldbe used as an index of maize adaptation to soil acidity:the longer this period is, the lower is the toleranceof soil acidity. Moreover, the relationships obtainedbetween N and P concentration and above-ground bio-mass indicated that short-term experimentation shouldbe unsuitable to analyze this phenomenon becauseroot growth modifies plant nutrient status with time.For this purpose, field experiments seem more appro-

225
priate to take into account the temporal changes innutrient uptake.
In spite of the lower level of plant nutrition in thenon-limed plot, our calculations indicated that leaf Nand P concentrations were higher than those known toaffect RUE. A hypothesis to test is that maize plantsgrowing in very acid soils increase nutrient concentra-tion in the leaf in order to compensate for the lowerLAI and assure adequate carbon assimilation.
Our results suggested that currently available cropmodels could be used to predict maize growth in acidtropical soils without Al toxicity. For very acid soilsthe models would have to be improved by includingthe effect of Al toxicity on root growth and nutrientuptake, and the allocation of carbon and nutrients intoroots and shoots. This work is now in progress.
Acknowledgements
We thank F. Solvar, G. Gougougnan, D. Nagou, J.Leinster, S.A. Sophie, T. Bazajet and C. Flereau fortheir excellent technical assistance during the study.Helpful comments on this paper by R. Bonhomme,G. Lemaire, J.C. Fardeau and the unknown refereesare acknowledged. We also thank Alan Scaife forreviewing the English manuscript.
References
Al Rifaï M 2000 Etude de l’intérêt en sélection de populationsde maïs source de tolérance à l’acidité à partir d’un plan decroisement diallèle. Mg Sc Thesis, ENSAIA, Paris. 58 p.
Baligar V C, Pitta G V E, Gama E E G, Schaffert R E, Bahia FilhoA F C and Clark R B 1997 Soil acidity effects on nutrients useefficiency in exotic maize genotypes. Plant Soil 192, 9–13.
Bonhomme R, Derieux M and Edmeades G O 1994 Flowering of di-verse maize cultivars in relation to temperature and photoperiodin multilocation field trials. Crop Sci. 34, 156–164.
Bonhomme R, Ruget F, Derieux M and Vincourt P 1982 Relationsentre production de matière sèche aérienne et énergie interceptéechez différents génotypes de maïs. C.R. Acad. Sc. Paris 294,393–398.
Bowen W T, Jones J W, Carsky R J and Quintana J O 1993 Eval-uation of the nitrogen submodel of CERES-Maize followinglegume green manure incorporation. Agron. J. 85, 153–159.
Bushamuka V N and Zobel R W 1998 Maize and soybean tap, basal,and lateral root responses to a stratified acid, aluminium-toxicsoil. Crop Sci. 38, 416–421.
Campaoré E, Fardeau J C, Morel J L and Sedogo M P 2001 Lephosphore biodisponible des sols: Une des clés de l’agriculturedurable en Afrique de l’Ouest. Cahiers Agricultures 10, 81–85.
Collet L and Horst W J 2001 Characterisation of maize cultivarsin their adaptation to acid soils on the single plant level. In
Plant Nutrition – Food Security and Sustainability of Agro-ecosystems. Eds. W J Horst et al. pp 86–87. Kluwer AcademicPublishers, Dordecht, The Netherlands.
Dabin B 1967 Sur une méthode d’analyse du phosphore dans lessols tropicaux. In Colloque Sur la Fertilité des Sols Tropicaux.pp 99–115. IRAT, France.
de Magalhães J V, Alves V M C, de Novais R F, Mosquim P R,Magalhães J R, Bahia Filho A F C and Huber D M 2000 In-fluence of phosphorus stress on ammonium uptake by maize. J.Plant Nutr. 23, 263–273.
Gaume A, Mächler F and Frossard E 2001 Aluminium resistancein two cultivars of Zea mays L.: Root exudation of organic acidsand influence of phosphorus nutrition. Plant Soil 234, 73–81.
Girardin P 1998 Ecophysiologie du Maïs. AGPM, Montardon.France.
Granados G, Pandey S and Ceballos H 1993 Response to selectionfor tolerance to acid soils in a tropical maize population. CropSci. 33, 936–940.
Kampshake L J, Hannah S A and Cohen J M 1967 Automated ana-lysis for nitrate by hydrazine reduction. Water Resour. Res. 1,205–216.
Kaplan A 1965 Standard Methods of Clinical Chemistry. AcademicPress, New York. 249 p.
Kiniry J R, Jones C A, O’Toole J C, Blanchet R, Cabelguenne Mand Spanel D A 1989 Radiation-use efficiency in biomass accu-mulation prior to grain filling for five grain-crop species. FieldCrops Res. 20, 51–64.
Lemaire G, Gastal F and Salette J 1989 Analysis of the effect ofN nutrition on dry matter yield of a sward by reference to po-tential yield and optimum N content. In Proceedings of the 16thInternational Grassland Congress. pp 179–180. INRA, France.
Lucresio E S and Duque C M 1999 Alleviating soil acidity withorganic matter, lime and phosphorus application. CMU J. Sci. 8,2–20.
McKee G W 1964 A coefficient for computing leaf area in hybridcorn. Agron. J. 70, 58–67.
Mollier A and Pellerin S 1999 Maize root system growth and devel-opment as influenced by phosphorus deficiency. J. Exp. Bot. 50,487–497.
Muchow R C and Sinclair T R 1994 Nitrogen response of leaf pho-tosynthesis and canopy radiation use efficiency in field-grownmaize and sorghum. Crop Sci. 34, 721–727.
Novozamsky I, Houba V J G, van Eck R and van Vark W 1983A novel digestion technique for multi-element plant analysis.Commun. Soil Sci. Plant Anal. 14, 239–249.
Otegui M E and Bonhomme R 1998 Grain yield componentsin maize. I. Ear growth and kernel set. Field Crops Res. 56,247–256.
Plénet D, Etchebest S, Mollier A and Pellerin S 2000a Growth ana-lysis of maize field crops under phosphorus deficiency. I. Leafgrowth. Plant Soil 223, 117–130.
Plénet D and Lemaire G 2000 Relationships between dynamics ofnitrogen uptake and dry matter accumulation in maize crops.Determination of critical N concentration. Plant Soil 216, 65–82.
Plénet D, Mollier A and Pellerin S 2000b Growth analysis of maizefield crops under phosphorus deficiency. II. Radiation-use effi-ciency, biomass accumulation and yield components. Plant Soil224, 259–272.
Rout G R, Samantaray S and Das P 2001 Aluminium toxicity inplants: a review. Agronomie 21, 3–21.
Ruget F, Bonhomme R and Chartier M 1996 Estimation simple dela surface foliaire de plantes de maïs en croissance. Agronomie16, 553–562.

226
Urrea-Gómez R, Ceballos H, Pandey S, Bahia Filho A F C and LeónL 1996 A greenhouse screening technique for acid soil tolerancein maize. Agron. J. 88, 806–812.
van Beem J, Smith M E and Zobel R W 1998 Estimating root massin corn using a portable capacitancemeter. Ag. J. 90, 566–570.
Varlet-Grancher C, Bonhomme R, Chartier M and Artis P 1982Efficience de la conversion de l’énergie solaire par un couvertvégétal. Oecol. Plant. 3, 3–26.
Section editor: J. Lynch