mine pool workshop
TRANSCRIPT

Recharge to Underground Mines
Why is this Important?• Inflow rate during mining.• Rate of flooding after mining.• Ultimate discharge rate once equilibrium
is reached (inflow = outflow).• Impact the post-mining head expressed
by the mine.• Strongly impact treatment plant set up
and cost of treating post-mining discharges.
• Other factors to be considered.

Background
• Precipitation• Ground water stored in aquifers• Direct stream loss• Seepage from adjacent flooded mines• Interaction of overlying or underlying
mines• Wells and other manmade structures
acting as conduits
What is the source of the recharge water?

Range of Recharge Rates ReportedRecharge Rate in gpm/acre Source Context
0.47 - 0.76 U.S. EPA, 1975 From Research in PA0.011 Permitting Info. SW PA
0.20 and 0.464 Winters et al., 1999 PA <200’ and avg. 250’ OB0.029 to 0.29 Lovell and Gunnett, 1974 PA
0.01 Tieman and Rauch, 1987 SW PA and Northern WV0.654 Miller and Thompson, 1974 PA included barrier seepage0.16 Hollyday and McKenzie, 1973 MD
0.76 to 1.20 Hlortdahl, 1988 MD1.74 to 2.92 Booth, 1986 PA mountains0.21 to 0.35 Burbey et al., 2000 VA0.16 to 0.96 Cifelli and Rauch, 1986 Northern WV
0.21 to 0.174 Donovan et al., 1999 Southern Mon. Basin0.41 McCament et al., 2003 Southern Ohio
0.52 to 0.775 Stoertz et al., 2001 Southern Ohio
1.0 Hobba, 1987 Upshur Co., WV0.35 to 0.70 Carpenter and Herndon, 1933 Northern WV0.35 to 0.75 Hawkins and Perry, 2005 Central PA

Summary
Rule of Thumb = 0.5 gpm/acre based on Parizek’s work from the early
1970’s
Range of reported values 0.01 to 2.92 gpm/acreMean = 0.59 gpm/acre
Median = 0.44 gpm/acre

Three Brief Case StudiesOmega Mine - WV
Berlin – Pen Mar Mines - PABarnes & Tucker Lancashire 15 - PA

Omega Mine
Treatment Inlet
Coal Outcrop
Discharges
Approximate limitsof mine works
N
Dip 9%

Discharges are piped, and collected.

And Treated.

Background• Mined in the 1980’s; closed in 1989.• A relatively small mine - 172 acres.• Maximum overburden 171 feet thick
with as little as 20 feet in shallow areas.• Overburden primarily sandstones with
some shale.• Vertical (stress relief) fracturing
prominent in the overburden.

More Background• Isolated hilltop mine above drainage. • No adjacent underground mines.• Recharge is essentially all from
precipitation.• Partial grouting of the mine was
conducted in an attempt to remediate the AMD.
• The mine discharges mainly through a series of horizontal boreholes.

Omega Mine Average Monthly Flow,1997-2001
0
50
100
150
200
250
Jan.
,199
7Ap
rilJu
lyO
ct.
Jan.
,199
8Ap
rilJu
lyO
ct.
Jan.
,199
9Ap
rilJu
lyO
ct.
Jan.
,200
0Ap
rilJu
lyO
ct.
Jan.
,200
1Ap
rilJu
lyO
ct.
Month
Flow
Ave
rage
(gpm
) Grout Injection

Recharge ranges from a mean of 0.105 gpm/acre in November to a mean 0.882
gpm/acre in March.
Overall mean and median recharge = 0.426 gpm/acre
Summary
Amount of precipitation recharging the mine ranged from 6.3 to 46.4 percent

Omega Mine Recharge Characteristics
0.00
0.200.40
0.600.80
1.00
Jan Feb March April May June July Aug Sept Oct Nov Dec
Month
Rec
harg
e (g
pm/A
)
0%
10%20%
30%40%
50%
Recharge (gpm/A)
Recharge Percentage ofPrecipitation
Rec
harg
e Pe
rcen
tage
of
Prec
ipita
tion

Pen Mar Location Map
")
")
Diamond Street Discharge
Penmar Shaft
LegendPittsburgh (deep)
Lower Freeport (deep)
Lower Freeport Rider (surface)
±0 2,500 5,0001,250
Feet
Pen Mar 2, 3, 4 & 5 Mines
Pen Mar Shaft Salco

Pen Mar Shaft Discharge

Background• Mined from the 1920’s to 1940’s.• Mine extends from Lower Kittanning outcrop
to the west and a depth of about 800 feet.• Approximately 1,910 acres were affected.• The entire mine discharges from a single
shaft located in the south central portions of the mine.
• The mine water flows vertically about 400 feet to discharge.
• Discharge rate was determined by use of a large rectangular weir.

Background• There are no known adjacent underground mines• Recharge is primarily from the surface (precipitation
and losing streams)
Date
Flow
in g
pm
12/31/00 5/15/02 9/27/03 2/8/05 6/23/060
500
1000
1500
2000
2500
3000
Average
Median

Recharge ranges from 0.10 gpm/acre during extreme drought to 1.42 gpm/acre
during high recharge periods.
Mean recharge = 0.34 gpm/acreMedian recharge = 0.19 gpm/acre
Summary

Barnes & Tucker Lancashire 15

Blowout Area
Maberry Boreholes
Duman
Colver Treatment
Sterling 6
Lancashire 20
Sterling 1 (Monkey Drift)
0 16000 feet4000
Scale8000
N

Main Discharge Points

Treatment System

Background• Mined the Lower Kittanning (B) and the Lower
Freeport (D) seams separated by 165 feet.• Lateral interconnection between mines ranges
from open pass-throughs to solid barriers 200 feet or more thick.
• Vertical interconnections are direct via open shafts to more restricted through natural and mining-induced fractures.
• Significant head differences exist between some adjacent mines with thick solid barriers.
• High-extraction mining occurred on both seams.• There is now one main discharge point (Duman)
and a few smaller ones.
More Background• Lancashire 15 is ~ 11 square miles.• Contributing mines cover over 25 square miles.• Lancashire 15 closed on July 14, 1969 (pumps
shut off) and it flooded.• A major blowout occurred in late June or early
July, 1970.• Pumping and treating at Duman since 1971.• Overburden depth ranges from 0 to 640+ feet.• There appears to be significant stream loss in
some of the major overlying streams.

Blowout Area
Duman
Lancashire 24B
Sterling 1, 6, 10
Lancashire 15Lancashire 14
Unflooded area
Flooded area
0 16000 feet4000
Scale
N
Colver
Springfield 4 Reilley

Blacklick (Mid-Summer)
Elk CreekBlacklickCreek

Recharge ranges from 0.15 gpm/acre during extreme drought to 0.54 gpm/acre during
high recharge periods.
Mean annual recharge = 0.35 gpm/acre
Summary

Lancashire 15
Date
Ele
vatio
n
7/30/05 11/7/05 2/15/06 5/26/06 9/3/061480
1484
1488
1492
1496
1500
1504

Food for Thought: Factors that Likely Impact the Recharge Rates• Depth of cover (<150-200’ vs. >200’, etc.)• Overburden lithology (sandstone vs. shales &
claystones)• Method of mining (e.g., longwall vs. 1st
mining vs. retreat mining)• Laterally, adjacent mines (flooded and
unflooded)• Lineaments, faults, fracture zones, etc.
(presence or absence)

Recharge in gpm/acre0 0.2 0.4 0.6 0.8 1 1.2
0
200
400
600
800
1000
1200
Ove
rbur
den
Thi
ckne
ss in
Fee
tRelationship of Underground Mine
Recharge Rate and Overburden Thickness

More Food• Interaction with over and/or underlying
mines• Climatic data (rainfall, temperature, etc.)• Land use/cover information• Topography• Manmade features (e.g., wells, shafts,
etc.)• Others?
Discussion

Seepage through and Seepage through and over coal barriersover coal barriers
Mine Pool ForumMine Pool Forum
Tom GalyaTom GalyaPhysical ScientistPhysical Scientist
Office of Surface MiningOffice of Surface MiningCharleston Field OfficeCharleston Field Office
Charleston, West VirginiaCharleston, West VirginiaMarch 6March 6--7, 20077, 2007


Discussion points Discussion points Salient factors that control Salient factors that control -- Seepage flow through coal barriersSeepage flow through coal barriers-- Seepage flow over the coal barrier into the roof rockSeepage flow over the coal barrier into the roof rockPermeability and Permeability and KKhh values of coal barriers and overburden values of coal barriers and overburden -- Isotropic versus anisotropic seepage (fracture) flowIsotropic versus anisotropic seepage (fracture) flowCoal barrier cleat systems and orientation of mine workingsCoal barrier cleat systems and orientation of mine workingsRelationship between coal barrier thickness and hydraulic Relationship between coal barrier thickness and hydraulic conductivity conductivity Data availability for Data availability for DarcianDarcian estimates of coal barrier and estimates of coal barrier and overburden seepage flow overburden seepage flow Example: Estimate of seepage through a coal barrier and Example: Estimate of seepage through a coal barrier and roof rock (overburden) using roof rock (overburden) using DarcianDarcian assumptions assumptions

The role of barriers is a balancing actThe role of barriers is a balancing actSafety concerns-- Industry and government both realize that coal barriers Industry and government both realize that coal barriers are needed for mine safety from sudden release of water are needed for mine safety from sudden release of water -- Control of ventilation and fireControl of ventilation and fire-- Prevention of blowouts, flooding, and landslidesPrevention of blowouts, flooding, and landslides-- Ashley and InspectorAshley and Inspector’’s formulas for prudent design s formulas for prudent design Environmental concerns-- Restrict rate of AMD mine water outcrop seepageRestrict rate of AMD mine water outcrop seepage-- Restrict artesian effects from belowRestrict artesian effects from below--drainage drainage mines mines Balanced coal barrier designBalanced coal barrier design-- Not unnecessarily restrictive to industry, but address Not unnecessarily restrictive to industry, but address
safety and environmental concerns safety and environmental concerns

Seepage through Seepage through coal barrierscoal barriers

Seepage flow through a coal barrierSeepage flow through a coal barrier

HydrogeologicHydrogeologic factors influencing barrier seepagefactors influencing barrier seepageOverburden depthOverburden depthAbove Above vsvs belowbelow--drainage deep mines drainage deep mines -- Type and proximity of adjacent active Type and proximity of adjacent active
and abandoned mining and abandoned mining Geologic frameworkGeologic framework-- Coal barrier thicknessCoal barrier thickness-- Structure, hydraulic gradient Structure, hydraulic gradient -- Lineaments, seam discontinuitiesLineaments, seam discontinuitiesCharacteristics of the coal barrier, roof overburden, floorCharacteristics of the coal barrier, roof overburden, floor-- LithologyLithology, coal cleats, SRF and mine, coal cleats, SRF and mine--induced fracturesinduced fractures-- Mine floor topographyMine floor topography
+ Gradual mine floor structure may be indicative of + Gradual mine floor structure may be indicative of slower slower rates of water rise in flooding mines rates of water rise in flooding mines
Roof and floor can behave as Roof and floor can behave as acquitardsacquitards in flooding mines in flooding mines -- Significantly lower Significantly lower KKhh than adj. abandoned workings than adj. abandoned workings


AboveAbove--drainage mine drainage mine coal barrierscoal barriers
Outcrop seepage reflects the extent of mine flooding and Outcrop seepage reflects the extent of mine flooding and pool development, depending uponpool development, depending upon-- Mine geographic location, mine seals, seepage Mine geographic location, mine seals, seepage flowpathsflowpaths-- Even prudent design for outcrop barriers result in seepageEven prudent design for outcrop barriers result in seepageMining operations design ventilation Mining operations design ventilation punchoutspunchouts at outcrop at outcrop barriers that can also serve as NPDES discharge outlets barriers that can also serve as NPDES discharge outlets Location of Location of punchoutspunchouts-- Reflect health and safety concerns during miningReflect health and safety concerns during mining-- Control potential AMD discharges by Control potential AMD discharges by downgradientdowngradient miningminingOutcrop breakout pointsOutcrop breakout points-- Seepage from the mine pool expedites weathering and Seepage from the mine pool expedites weathering and
erosion of and along the coal outcrop barrier erosion of and along the coal outcrop barrier Pool breakout locationsPool breakout locations-- Ground water discharge breakout (elevation) pointsGround water discharge breakout (elevation) points
+ Streams, flowing artesian wells + Streams, flowing artesian wells

Example: seepage through outcrop barrierExample: seepage through outcrop barrier
Portal area

Potential impacts from AMD barrier Potential impacts from AMD barrier outcrop seepage to receiving streamoutcrop seepage to receiving stream

BelowBelow--drainage mine drainage mine coal barrierscoal barriers
Intact barriersIntact barriers-- Barrier seepage from adjacent mines provide and Barrier seepage from adjacent mines provide and
contribute to inflow developing & maintaining mine poolscontribute to inflow developing & maintaining mine pools-- Pumping or artesian discharges provide outflow from Pumping or artesian discharges provide outflow from
mine poolsmine poolsNonNon--intact barriersintact barriers-- Breached by boreholes or entries between adjacent mines Breached by boreholes or entries between adjacent mines -- Leaking sealed areas of the mineLeaking sealed areas of the mineMine pool breakout locationsMine pool breakout locations-- When inflows > outflows then rising pool level When inflows > outflows then rising pool level -- Ground water discharge locations Ground water discharge locations
+ Adverse hydrologic impacts to streams + Adverse hydrologic impacts to streams + Artesian conditions to residents+ Artesian conditions to residents’’ homes, wellshomes, wells

BelowBelow--drainage mine barrier leakagedrainage mine barrier leakage

Relationship between barrier Relationship between barrier thickness and seepage flow ratethickness and seepage flow rate
Rate of coal barrier seepage measured by Rate of coal barrier seepage measured by KKhh
Physical characteristics of the mined coal seamPhysical characteristics of the mined coal seam-- Coal barrier thickness Coal barrier thickness -- Orientation of the mine barrier with respect to the coal Orientation of the mine barrier with respect to the coal
cleat orientation cleat orientation Sufficient compressive stress applied to coal barriersSufficient compressive stress applied to coal barriers-- CouldCould reduce the density of the secondary fracture reduce the density of the secondary fracture flowpathflowpath network and its permeability (network and its permeability (LuoLuo et al.et al., 2001), 2001)Effective Effective KKhh of coal barriers may be inversely related to of coal barriers may be inversely related to barrier thickness (Leavitt, 1993), barrier thickness (Leavitt, 1993), perhapsperhaps lithologylithology and/or and/or -- Vertical and horizontal discontinuity of fractures, joints, Vertical and horizontal discontinuity of fractures, joints, coalcoal cleats cleats maymay impede seepage flow in the coal barrierimpede seepage flow in the coal barrier
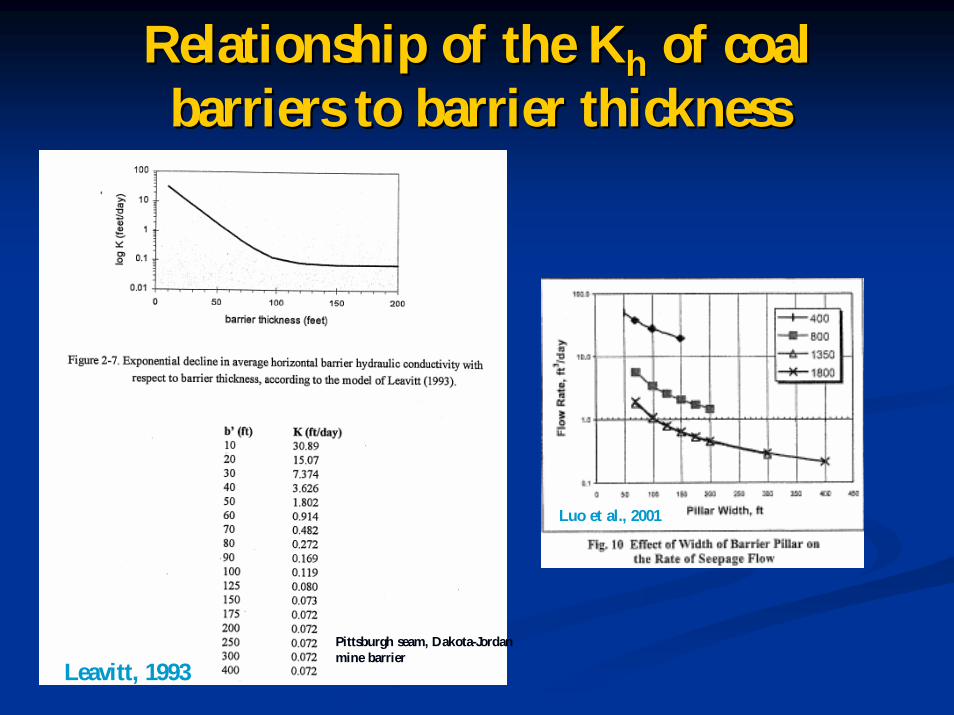
Relationship of the Relationship of the KKhh of coal of coal barriers to barrier thickness barriers to barrier thickness
Leavitt, 1993Pittsburgh seam, Dakota-Jordan mine barrier
Luo et al., 2001

Coal barrier seepage flow Coal barrier seepage flow occurs by anisotropic occurs by anisotropic
permeability via permeability via coal cleats coal cleats

Jointed Jointed WinifredeWinifrede coal face cleats coal face cleats

Coal barrier cleat systemCoal barrier cleat systemCleat system follows regional Cleat system follows regional structurestructure-- in PA & WV, Ex: in PA & WV, Ex: Pittsburgh, No. 2 Gas seams Pittsburgh, No. 2 Gas seams -- Face cleat:Face cleat: trend normal to trend normal to regional folding regional folding approximately N 58approximately N 58..W and W and N 70N 70..W (Stoner, 1983)W (Stoner, 1983)
+ + HobbaHobba (1991) N 68(1991) N 68..W W + Boone County, WV, + Boone County, WV, N32N32--7878..W (USBM #9413)W (USBM #9413)
-- Face cleat trend parallel to Face cleat trend parallel to seepage flow, encourages flow seepage flow, encourages flow -- Butt cleat:Butt cleat: trends parallel to trends parallel to regional structureregional structure
+ Butt cleat shorter + Butt cleat shorter flowpathsflowpaths, lower , lower permeability permeability
Diamond et al., 1976

Orientation of mine workings Orientation of mine workings to coal cleat systemto coal cleat system
McColloch, 1974, 1986
Holes drilled perpendicular to the face cleat yields seepage water and
2.5-10 times the amount of gas compared to the butt cleat

Permeability of coal pillar and Permeability of coal pillar and overburden seepage flow ratesoverburden seepage flow ratesSomeSome horizontal hydraulic conductivity permeability horizontal hydraulic conductivity permeability measurements in the available literature, largely isotropic measurements in the available literature, largely isotropic -- Outcrop and/or shallow mines Outcrop and/or shallow mines -- FewerFewer kkhh measurements for deeper mines measurements for deeper mines -- KKhh values for coal seams in the literature do not state that values for coal seams in the literature do not state that
the values reflect isotropic or anisotropic flow paths the values reflect isotropic or anisotropic flow paths Field permeability tests are more relevant than lab tests that Field permeability tests are more relevant than lab tests that
measure primary porositymeasure primary porosityComparison of field versus laboratory of Allegheny Fm. Comparison of field versus laboratory of Allegheny Fm. strata in PA (Schubert, 1980) strata in PA (Schubert, 1980) -- Lab measurements: 8 Lab measurements: 8 XX 1010--55 feet/dayfeet/day-- Field measurements: 0.14 feet/dayField measurements: 0.14 feet/day

Permeability of shallow and Permeability of shallow and outcrop coal barriers and roof outcrop coal barriers and roof
seepage flow ratesseepage flow ratesMiller and Thompson Miller and Thompson (1974) data (1974) data -- Dames and Moore, Dames and Moore,
19811981Relevant to outcrop and Relevant to outcrop and shallow mines values only shallow mines values only not deep, belownot deep, below--drainage drainage minesmines

Jamison # 9Jamison # 9--Odonnell mines Odonnell mines barrier seepage flowbarrier seepage flow
McCoy McCoy et al.et al., 2006 calculated K face and butt cleat values , 2006 calculated K face and butt cleat values for the coal barrier between the Pittsburgh seam Jamison # for the coal barrier between the Pittsburgh seam Jamison # 9 and 9 and OdonnellOdonnell mines in West Virginia and Pennsylvania mines in West Virginia and Pennsylvania -- KKff, face cleat 0.24 to 1.1 feet/day, face cleat 0.24 to 1.1 feet/day-- KKbb butt cleat 0.072 to 0.32 feet/daybutt cleat 0.072 to 0.32 feet/day-- CompareCompare: isotropic : isotropic KKhh estimate of 0.12estimate of 0.12--0.59 feet/day 0.59 feet/day Data showed Jamison # 9 barrier orientation lends to Data showed Jamison # 9 barrier orientation lends to shorter shorter flowpathsflowpaths, lower permeability along the butt cleat, lower permeability along the butt cleatCoal barrier orientation of entries that dip parallel in the Coal barrier orientation of entries that dip parallel in the direction of the face cleat will encourage seepage flow that direction of the face cleat will encourage seepage flow that will will ””let the water run with youlet the water run with you”” mining process mining process
DarcianDarcian flow flow estimate assumptionsestimate assumptions


Fracture flow Fracture flow seepage modelseepage model
Equivalent porous media approach Equivalent porous media approach treats the fractured rock mass treats the fractured rock mass as equivalent to a continuous and as equivalent to a continuous and
homogenous porous medium homogenous porous medium (Schmidt, 1985)(Schmidt, 1985)

DarcianDarcian barrier seepage barrier seepage estimate assumptionsestimate assumptions
Mines are fully flooded, confined flow along the Mines are fully flooded, confined flow along the coal barrier, and at equilibrium (steady state)coal barrier, and at equilibrium (steady state)Homogenous coal seam barrierHomogenous coal seam barrierSeepage flow is laminar and follows cleat systems Seepage flow is laminar and follows cleat systems Horizontal conductivity K along the coal barrier Horizontal conductivity K along the coal barrier -- KKhh is independent of:is independent of:
+ Barrier width + Barrier width + Spatially uniform+ Spatially uniform
Horizontal flow could extend upward to above the Horizontal flow could extend upward to above the coal barrier separating adjacent mines coal barrier separating adjacent mines Isotropic and/or anisotropic fracture flow modelsIsotropic and/or anisotropic fracture flow models

Are data available to use Are data available to use the Darcy equation?the Darcy equation?

Darcy equation data requirementsDarcy equation data requirementsCoal barrier characteristics Coal barrier characteristics -- Barrier segments size determined from mine mapsBarrier segments size determined from mine maps-- Length and thickness of coal barrier segmentsLength and thickness of coal barrier segmentsHydraulic headHydraulic head-- Mine pool levels from Mine pool levels from piezometerspiezometers and/or shaftsand/or shafts-- Coal seam elevations at coal barriers segments and Coal seam elevations at coal barriers segments and
saturated overburden thickness saturated overburden thickness Aquifer characteristics: coal seam and overburden Aquifer characteristics: coal seam and overburden -- Hydraulic conductivity Hydraulic conductivity KKhh values (or values (or TransmissivityTransmissivity data)data)
+ No site+ No site--specific data largely available specific data largely available + Literature values for + Literature values for KKhh (largely isotropic (largely isotropic KKhh))
Mine pump discharge historyMine pump discharge history-- Accurate Accurate KKhh determinationsdeterminations cancan be madebe made by using by using
permitteepermittee pump history; RA data not suited for taskpump history; RA data not suited for task
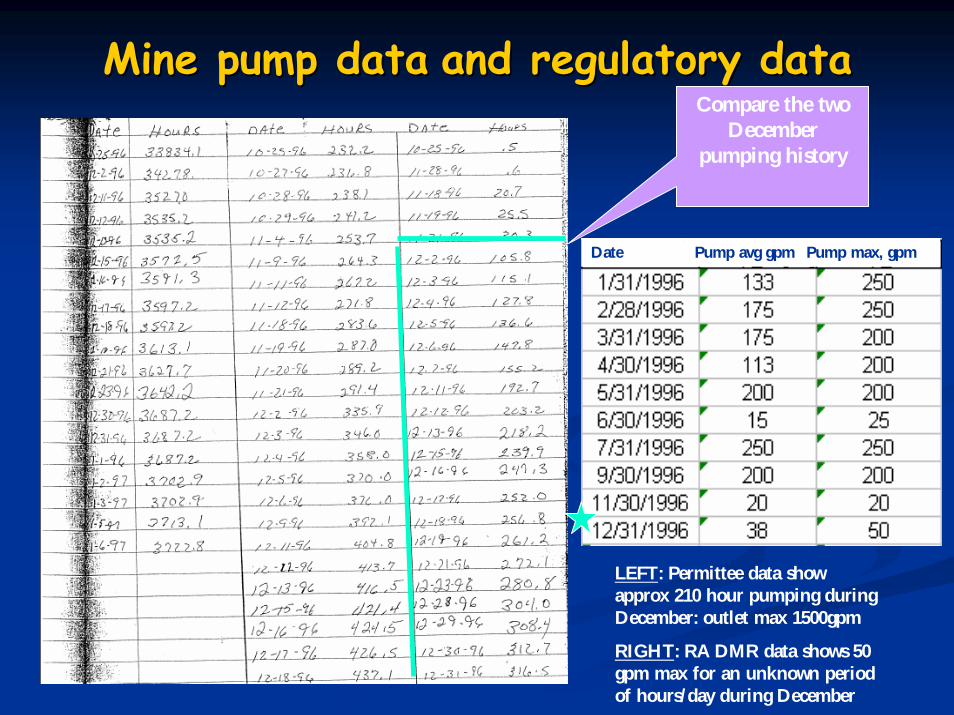
Mine pump dataMine pump data and regulatory dataand regulatory data
Pump avg gpm Pump max, gpmDate
Compare the two December
pumping history
LEFT: Permittee data show approx 210 hour pumping during December: outlet max 1500gpm
RIGHT: RA DMR data shows 50 gpm max for an unknown period of hours/day during December

Seepage over the Seepage over the coal barriercoal barrier

Mine roof controls seepage flow Mine roof controls seepage flow over mine barriers over mine barriers
Draw slate (shale) in the roof Draw slate (shale) in the roof acting as a confining layeracting as a confining layerPresence of fractures within Presence of fractures within mine roof (overburden) mine roof (overburden) -- Angle of advance influenceAngle of advance influence--11-- Angle of complete miningAngle of complete mining--22-- Intersections of fractures Intersections of fractures from adjacent mines from adjacent mines separsepar. by . by coal barriercoal barrierStress relief and mineStress relief and mine--induced induced fractures occurring in zonesfractures occurring in zones-- Horizontal and vertical Horizontal and vertical continuity of fracturescontinuity of fracturesInflows to flooding mines Inflows to flooding mines through through KendorskyKendorsky 1993 1993 Zones occur through fracturesZones occur through fracturesZones of intense fracturing Zones of intense fracturing have have KKhh values order of values order of magnitude higher than adj. magnitude higher than adj. unfracturedunfractured stratastrata
1 2
Modified after Schmidt, 1985
1

Coal barrier permeability adjacent Coal barrier permeability adjacent to subsidence troughto subsidence trough
Example: Ferrell Mine, WVExample: Ferrell Mine, WV
Kohli, 1983

The edges of the subsidence trough are wedges of highest permeability and flow
Example: Ferrell Mine, WVFerrell Mine, WV
Kohli, 1983
Potential tensile fractures in coal barrier roof rock
Feet

Example: Example: Estimates of coal barrier Estimates of coal barrier and roof rock overburden and roof rock overburden
seepage flow seepage flow
GuyanGuyan and Hampton and Hampton Mines, Boone Co., WVMines, Boone Co., WV

West VirginiaBoone Co.
Logan Co.
Spruce Laurel Fork
Clothier
StudyArea

Guyan Mines
HamptonNo. 4
Hampton No. 3
A1A2A3
A4A5
A6A7A8
A10A11A12
A13A14
A17A15A16
SLA1SLA2 SLA3
Cazy shaft
Rockhouse pump
Adkinsartesian
Supply well
Residences
Lightfoot Mines
Sycamore Br.Trough Fk.
Location of Location of streamflowstreamflow
sitessites

1023’MSL
993’MSLh1-h2=125’
1998
Guyan 1133’msl Hampton 4, 1034’msl,=99’Hampton 3, 886’msl=149’


Seepage and water Seepage and water budget estimatebudget estimateDarcianDarcian flow modelsflow models

Hampton No.3Hampton No.3--4 coal barrier 4 coal barrier seepage calculationsseepage calculations


Hampton No.3Hampton No.3--44 mmines ines roof rock (overburden) roof rock (overburden)
seepageseepage flow calculationsflow calculations

Summary of HamptonSummary of Hampton--GuyanGuyanmine floodingmine flooding
BackBack--calculating the calculating the KKhh of coal barriers and roof of coal barriers and roof rock overburden seepage rock overburden seepage
Hampton No. 3 closed in 1987; Res. complaintsHampton No. 3 closed in 1987; Res. complaints--19911991--1992 = 1992 = approx.5 year timeapprox.5 year time--frame;frame;
Hampton No. 4 closed in 1990; Res. complaints, 1991Hampton No. 4 closed in 1990; Res. complaints, 1991--1992 1992 =approx.2 year time=approx.2 year time--frame;frame;
GuyanGuyan mine closed in Jan.1978: Adkins mine closed in Jan.1978: Adkins FkFk, artesian, artesian--1985 =approx.7 1985 =approx.7 year timeyear time--frame.frame.

Conceptual model of seepage flow from Conceptual model of seepage flow from the Hampton No.4 to No.3 minethe Hampton No.4 to No.3 mine
Upgradient Hampton No. 4 mine Downgradient
Hampton No. 3 mine
Un-mined coal barrier pillar
Fractured and caved zones
Dilated zone
Roof rock (overburden) sags with
bedding-plane separations
Pool level
Pool level
Gob
Gob
1034’MSL
886’MSL
Modified after McCoy et al., 2006

ConclusionsConclusionsUnderstanding seepage rates across coal barriers and in the Understanding seepage rates across coal barriers and in the overburden is important in planning postoverburden is important in planning post--mining mine mining mine closure flooding elevations closure flooding elevations To more accurately estimate seepage rates and postTo more accurately estimate seepage rates and post--mine mine flooding pool elevations, these data are necessaryflooding pool elevations, these data are necessaryMine maps provided in Mine maps provided in AutoCADDAutoCADD or or ArcMAPArcMAP formatformat-- Mine pool water levels from installed Mine pool water levels from installed piezometerspiezometers-- Detailed Detailed permitteepermittee mine pump records mine pump records
+ Yields important information about mine + Yields important information about mine pumping rates per day and fluctuations in pool levelspumping rates per day and fluctuations in pool levels
-- Data could be utilized in TIPS ground water model apps. Data could be utilized in TIPS ground water model apps. Permits utilizing more enhanced water level monitoring Permits utilizing more enhanced water level monitoring HRP plans through the life of mine would result in better HRP plans through the life of mine would result in better water management, especially if the mine water is AMD water management, especially if the mine water is AMD

The EndThe End

Water Quality in Flooded and Partly Flooded Mine-pools
Eric PerryOffice Surface Mining
Pittsburgh, PA

Significance of Long Term Water Quality
• Estimate Whether Post-mining Water requires treatment
• Estimate Chemical Consumption and Duration of Treatment.
• Change in Water Composition, Chemical Consumption, or Potential Impacts Over Time

Flooded and Partly Flooded Mines
What separates flooded from partly flooded? What degree of flooding inhibits acid production?

Flooded vs. Partly Flooded (The Concept)
• Flooding excludes Oxygen, stops pyrite oxidation, acid pools may turn alkaline– Soluble salts may still be flushed, TDS can remain
elevated. – Ferrous iron may still be present. Also manganese.
• Partly Flooded – D.O. greater than 1-2 mg/L, pyrite oxidation continues– Continuing acid generation, metals, dissolved solids

Initial Water Chemistry
Acid Neutral
Metals and Dissolved Solids
Metals and Dissolved Solids High High
Low Low
What is the long term chemical composition of these mines when they flood?
Do the acid mine-pools remain acidic?

Siphon
source
source
source
source
sink
sink
sink
sink
sink
Ground water Flow Direction
sink
Spatial Variation in Mine-pool Chemistry
Near 100% flooded, one main pump location (Siphon), barrier leakage and outflow to west

Water Quality of Fairmont Mine-poolin Different Parts of Flow System, 2003
Site pH Alkalinity TDS Fe Ca Mg Na SO4 Cl
Mine 38Recharge
7.32 179 548 3.44 61 14 105 207 34
Mine 63Intermed.
7.31 589 3301 33.9 158 33 853 1697 44
Dakota Siphon
End7.20 568 5194 135 251 90 1254 2812 119
Over-burden 8.57 263 454 0.04 21 5 138 48 52
Mine 38 well in recharge area, Mine 63 well at intermediate flow path location, and Siphon at end of flow path. Dissolved constituents in mg/L.

Structure and Ground Water Flow in Lancashire 15 Mine-pool
Duman
LegendBarrier Seepage FlowFlow in Flooded AreasFlow in Unflooded AreasBeach LineLower Freeport MinesLower Kittanning Mines
Sterling 1 Discharge
Laurel Hill Anticline
NoloAnticline
Barnesboro Syncline
Barnesboro Syncline N
About 80% Flooded
One pumping location – Duman
Main mine-pool in Lower Kittanning
Overlying mine-pool in Lower Freeport
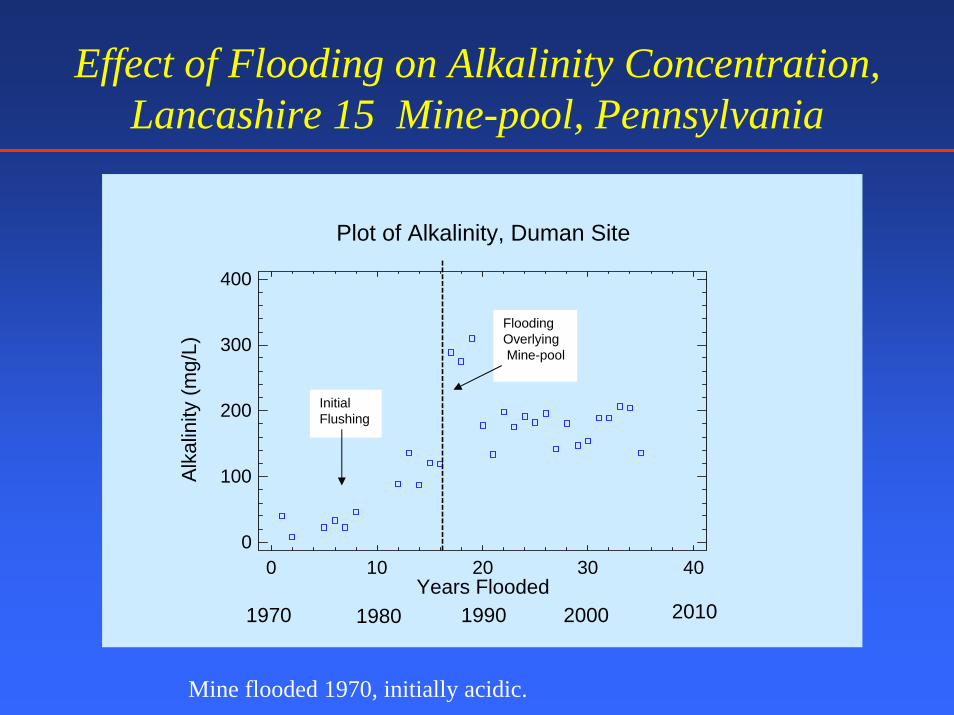
Effect of Flooding on Alkalinity Concentration, Lancashire 15 Mine-pool, Pennsylvania
Plot of Alkalinity, Duman Site
Years Flooded
Alk
alin
ity (m
g/L)
1970 1980 1990 2000 2010
0 10 20 30 400
100
200
300
400
------
------
------
------
------
------
------
-
Flooding OverlyingMine-pool
Initial Flushing
Mine flooded 1970, initially acidic.

Temporal Change in Mine-pool ChemistryAverage Annual Iron Concentration,
Lancashire 15 Main Discharge
Yearly Average Iron Concentration Duman Raw Water
Years Since FloodingYea
rly A
vera
ge Ir
on C
once
ntra
tion
(mg/
L)
------
------
------
------
------
------
----
1970 20101980 20001990
0 10 20 30 400
200
400
600
800
1000
Flooding OverlyingMine-poolInitial
Flushing
Fe Average (mg/L) = 82.5 + (1579.8/Years since flooding) 1971-1986
Fe Average (mg/L) = 1/(7.59* 10-4 *Years since Flooding) 1986-2004

Short Term Variation Mine-pool Composition,Lancashire 15 Main Discharge ,Iron Concentration, 2000-2004
Simple Moving Average Plot , Duman Influent Iron, 2000-2004
Iron,
mg/
L
DataTrend line
0 10 20 30 40 500
20
40
60
80
Monthly Sample Interval, quality affected by pumping rate.

Effect of Pumping Rate on Discharge Quality, Lancashire 15 Mine-pool
Discharge Rate (gpm)
pH Alkalinity Acidity Iron Sulfate
3250 6.7 230 58 32.6 299
6500 6.5 169 94 47.7 402

Hydrogeologic Setting of the Unflooded T&T 2 Mine-pool
Mine-poolDischarge Point
Flooded Extent of T&T 2 Mine
Free Draining Zone in T&T 2 Mine
About 20% flooded

Water Quality Change Over TimeMedian Water Quality for the Lancashire 15 (Flooded) and T&T 2 (Partly flooded) Mine-pools At Closure and After 25
Pool Volumes.
Site pHTotal
Acidity (mg/L)
Alkalinity (mg/L)
Fe(mg/L)
Al(mg/L)
Sulfate(mg/L)
Dis.O2
(mg/L)
FloodedAfter Closure 5.1 1500 40 837 N.D. 3432 N.D.
FloodedAfter 25 Pool
Volumes 6.53 113 120 63 N.D. 614 <0.5
Partly flooded After
Closure 2.6 968 0 313 82 2400 N.D.
Partly flooded After 25
Pool Volumes 2.9 340 0 72 27 905 ~2.5

Plot of Cumulative Sulfate Production (Kg),Flooded Lancashire 15 and Partly flooded T&T2 Mines
Lancashire 15 Cumulative Sulfate Production vs. Pool Volume
y = 9.00E+07Ln(x) - 1.25E+08R2 = 9.92E-01
0.00E+00
5.00E+07
1.00E+081.50E+08
2.00E+08
2.50E+08
3.00E+08
0.00 10.00 20.00 30.00 40.00 50.00 60.00
Pool Volume
Sulfa
te P
rodu
ctio
n K
gT&T 2 Mine, Cumulative Sulfate Productionvs.
Pool Volumey = 375492x - 209036
R2 = 0.992
0.00E+001.00E+062.00E+063.00E+064.00E+065.00E+066.00E+067.00E+068.00E+069.00E+06
0.00 5.00 10.00 15.00 20.00 25.00
Pool volume
Sul
fate
Pro
duct
ion
Kg
Sulfate production is decreasing in the flooded mine-pool but remains nearly constant in the partly flooded mine-pool. Indicates acid production is
continuing in partly flooded conditions, but decreasing in the
flooded mine.

Iron to Sulfate Mole Ratio, Flooded Lancashire 15 Mine-pool
and Partly Flooded T&T Mine-poolIron to Sulfate Mole Ratio, Lancashire 15 Mine-pool
0.0
0.1
0.2
0.3
0.4
0.5
0.6
1970 1975 1980 1985 1990 1995 2000 2005YearFe
:SO
4
Pyrite Composition
Iron to Sulfate Mole Ratio,Unflooded T&T Mine
0.000
0.100
0.200
0.300
0.400
0.500
0.600
4/8/96
10/8/
964/8
/9710
/8/97
4/8/98
10/8/
984/8
/9910
/8/99
4/8/00
10/8/
004/8
/0110
/8/01
4/8/02
10/8/
024/8
/0310
/8/03
4/8/04
10/8/
04
Date
Ratio
Pyrite Composition
A significant fraction of iron is being retained within the mine-pool aquifer even in
very acid mine-pools (precipitation, adsorption
etc?)

Seasonality in a Partly Flooded Mine-pool
Seasonality of Flow and Sulfate Loading, Partly Flooded Mine
0500
10001500200025003000
02/11
/9308
/11/93
09/01
/9409
/07/95
04/26
/9608
/31/96
02/21
/9710
/15/97
05/13
/9812
/10/98
06/29
/9901
/17/00
01/15
/0101
/16/02
Date
Sul
afte
load
(kg/
day
0.00200.00400.00600.00800.001000.001200.001400.001600.00
Flow
(L/m
in)SO4 Flux
Flow
Thin overburden (less than 250 ft), rapid recharge and response to precipitation.

Seasonal Characteristics Within A Mine-pool
Seasonality in Iron From Two Discharges In a flooded Mine-pool
01020304050607080
5/28/2
005
9/5/20
0512
/14/20
053/2
4/200
6
7/2/20
0610
/10/20
061/1
8/200
7
Date
Iron
(mg/
L)
SilvisPhillips
Phillips is a steady state discharge. Silvis is an overflow point for the mine-pool

Cation Exchange
Cla
y P
artic
le
Cla
y P
artic
le
Ca++ H+
Ca++ H+
Ca++ H+
Ca++ H+
Ca++ H+
Cation Exchange
Before After
Na+
Na+
Na+Na+Ca++ Ca++
H+
H+
K+
K+Ca++
Na+ Ca++
H+Na+Na+
Na+
Na+
Na+ Na+
K+
K+
Relative Ease of ReplacementCa++ > Mg++ > K+ > Na+

Cation Exchange in Lancashire 15 Mine-pool
Source Waters pH Alkalinity Fe Ca
96
Mg Na
70
UnfloodedL. Kittanning
2.8 0 113 85 34 35 767
11
Ground-water
7.0 142 0.3 43
75
6 2 27
159
SO4
FloodedL.Kittanning
6.4 63 62
40
30
19
15
417
LowerFreeport
6.3 124 0.3 157
End of Flowpath 6.55 137 40 390

What do We Know About Long Term Mine-pool Chemistry?• Poorest water quality at the beginning in the first flushing of the mine works.
• Mine-pool evolution includes an initial short term flushing followed by a longer term maturation period. Same behavior observed in coal mine-pools in United Kingdom.
• Initial flush is years to a decade, with variable water composition and rapid decline in pollutant concentration. Metals and sulfate decline more rapidly in flooded mine-pools compared to unflooded mines.
• The maturation phase is characterized by a continuing slow decline in most chemical concentrations and less variation. Maturation occurs over a period of decades as the mine-pools approach a steady-state condition.
• Part of the metals generated by chemical weathering are retained in the aquifer, even in acid mine-pools.
• Complete flooding suppresses or stops pyrite oxidation, and some acid mine-pools turn alkaline.

What We Don’t Know about Mine-pool Chemistry
• How do we use Acid Base Accounting data to estimate mine-pool chemistry?
• How to estimate metals and dissolved solids concentrations?• What rocks control mine-pool chemistry (How far
above/below the coal)?• Does alkaline recharge from overlying aquifers influence
water quality?• How long for pollutant concentrations to decline to some
acceptable level (How long is the “tail”)?• What happens at the end of the “tail”?

Discussion Questions• - Discuss the initial water quality of the mine pool and the
changes in the water quality with time• - What parameters changed with time and what was the time
frame for the change?• - What was the cause of the change in the water quality?• - What type of data was collected to help determine the cause
of the change?• - Where the changes in the water quality predicted?• - What procedure and method was used to measure the
changes in the water quality?• - How reliable is the data collected through the monitoring
program? • - Is it sufficient in quantity and quality?

Hydrologic Analysis for Underground Mine Permitting
WVDEP/OMR/Philippi Region

Two Major Types of Underground Mines
• Below Drainage Deep Mines (Conventional Room and Pillar Mines and Longwall Mines)
• Above Drainage Deep Mines (Predominately Conventional Room and Pillar Mines)

Below Drainage Deep Mines
• Deep Mines that are below local surface drainage or streams (Conventional Room and Pillar Mines and Longwall Mines)
– Water Quality Issues– AMD Prediction– Artesianing of Mine Water into Streams and Aquifers– “Inter-Mine Barrier” Seepage– Mine Discharge Effects on Surface Water and Groundwater Quality
Water Quantity Issues – Infiltration Rate Into Mine Workings– “Inter-Mine Barrier” Seepage– Flooding Rate of Mines– Subsidence De-watering of Streams and Aquifers

Prohibitions – Below Drainage Deep Mines
• Do not allow mining where hydrostatic head exceeds cover in a potential acid producing seam, unless they can demonstrate that this seam is non-acid producing.
• Can demonstrate it is non-acid producing with water quality data from adjacent mines in this seam, or, with benign coal sulfur or ABA data.

Above Drainage Deep Mines
• Deep Mines that are above local surface drainage or streams (Predominately Conventional Room and Pillar Mines)
• Water Quality Issues-AMD Prediction-Outcrop Barrier Seepage-Down-Dip Gravity Discharges (through down-dip punch-outs or boreholes)
- Up-dip Discharges (from deep mines that are completely flooded and discharging)- Mine Discharge Effects on Surface Water and Groundwater Quality. Water Quantity Issues- Infiltration Rate Into Mine Workings
- Outcrop Barrier Seepage- Flooding Rate of Mines- Subsidence De-watering of Streams and Aquifers

Prohibitions – Above Drainage Deep Mines
• Do not allow “gravity” discharges in a potential acid producing seam, unless they can demonstrate that this seam is non-acid producing.
• Can demonstrate it is non-acid producing with water quality data from adjacent mines in this seam, or, with benign coal sulfur or ABA data

Types of Data Used to Predict Mine Pool Quality
• Geological and Geochemical Data- Sulfur Content of the coal seam- ABA data of coal pavement and roof and of overburden- Review of Geologic Cross-Sections to determine overburden type.
Water Quality Data from Adjacent Mines in the Same Coal SeamData can be from discharges, boreholes into the mine, etc. A mine that will have the same flooding characteristics should be selected if possible.
• Water Quality Data of Groundwater Sources or Aquifers That May enter the Mine Either through natural infiltration or seepage or through infiltration
and seepage enhanced by subsidence fracturing. (Alkaline GW, such as limestones above Pittsburgh coal, should inhibit AMD production. Acidic GW may promote AMD production).

Analyses Used to Predict Mine Pool Flow/Seepage/Flooding/Infiltration or Quantity
• Barrier Seepage Calculations – Use Dames and Moore Formula to Calculate Seepage Through a Barrier (Outcrop Barrier and Internal Mine Barrier) Q = K x P/W x t., Q = KIA – Darcy’s Law
• Infiltration Rate Calculations – Use Rule of Thumb (0.5 gpm/acre) or a Site-Specific Number.
• Site-specific Number can be Derived From Pumping Rates of a Known Mine Area in the Same Seam in the Same Area with Similar Cover Conditions.
• The above are not done with every permit application. There should be a particular reason for doing these calculations. Usually only do outcrop seepage for an acid-producing seam.

Recent Activity
• In the Past 5 years most deep mine permitting activity in northern region has been for below drainage deep mining. Pittsburgh, Sewickley, Lower Kittanning, and Sewell coal seams. Most of these are revisions to existing permits
• So we have not done many outcrop barrier seepage calculations lately.
• Only occasionally do inter-mine barrier seepage calculations when there is a reason to do it. Shoemaker/Bailey Barrier K = 0.34 to 0.5 ft/day.

Surface Mine Application DEP Form MR-4
• Geologists in Philippi review sections I, J, O-8, U• Section I – Geologic Information (ABA data,
sulfur forms of coal, Geologic X-Section, etc.)• Section J – Hydrologic Information (PHC, HRP,
SW and GW Baseline data, Groundwater Inventory)
• Section O-8 – Toxic Materials Handling (for surface mines only)
• Section S - Mine Development and Subsidence Control Plan Map. (Engineer reviews most of this section)
• Section U – Water Monitoring Plan (SW and GW)

Deep Mine Review Section I-1
• Table for Sulfur Forms of the Coal Being Mined
• Have asked for this data from multiple holes. Important to get raw sulfur data.
• Recently have asked for raw sulfur isopleth maps. Note: Companies do not want this made part of the public file.

Deep Mine Review Section I-2• Gravity discharge question – Is gravity discharge anticipated from a
proposed underground mine or augering area?
Gravity discharges per the regulations are freely flowing down-gradient discharges.
• A flooded mine spilling out an up-dip opening is not gravity discharge as per the definition in the regulations.
• A gravity discharge would be from a down-dip punch-out, for example.
• One question is how to consider outcrop seepage???

Deep Mine Review Section I-2 (cont.)
If answer is yes and the coal is a potential acid producer, they need to provide data to prove that it is not acid-producing.
• If AMD potential, I ask for data whether it will be a gravity discharge or not.

Deep Mine Review Section I-7
• Geologic Cross-Section• Am now consistently requiring this for deep
mine applications .

Section I-9
• Geologic Descriptions
• For subsidence revisions (mining area additions to deep mines), have not always asked for this section. Get most of this info in the PHC.

Deep Mine Review Section I-10
• Geologic Borehole Logs
• Normally at least ask for holes used to construct the Geologic Cross-Section.

Deep Mine Review Section I-11• ABA Data
Have begun to ask for more holes for deep mines.
Asking for ABA data of coal, roof and floor of coal, and of a portion of the overburden.
• For overburden, asking for ABA data to represent the collapse zone ( 3 to 6 times coal thickness)
• Not a lot of historical data to compare with.

Deep Mine Review – Section J-2
• Groundwater InventoryTry to sample all groundwater sources within one-half mile of the proposed deep mining area. Baseline quality, static water levels of wells, flow of springs.
These aquifers may or may not be subsided into the deep mine.
The quality of these groundwater sources may impact the quality of the mine pool if they do enter the mine.

Deep Mine Review Section J-4
• Baseline Groundwater Data– Get “raw water”data from adjacent mines in the
same seam in this section– Best to try to get a sample from a mine that will
have similar flooding conditions to the proposed mine.

Deep Mine Review Section J-6• Probable Hydrologic Consequences (PHC)
– Discussion of quality and quantity issues, such as– Prediction of post-mining pool quality– Prediction of post-mining pool level – Prediction/calculations of infiltration rate into the mine– Prediction/calculations of barrier seepage– Discussion of how mine discharges/seepage will impact surface
water and groundwater quality. Have done mass balance calculations to determine the effects of these on stream quality.
The above should reference any data or calculations included in the application.
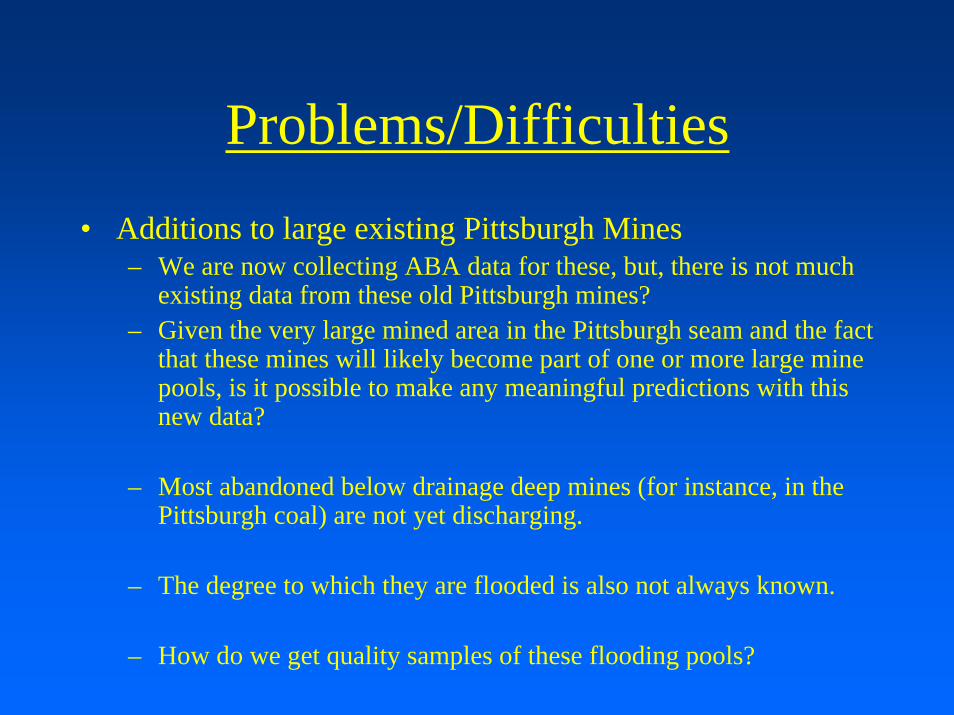
Problems/Difficulties• Additions to large existing Pittsburgh Mines
– We are now collecting ABA data for these, but, there is not muchexisting data from these old Pittsburgh mines?
– Given the very large mined area in the Pittsburgh seam and the fact that these mines will likely become part of one or more large mine pools, is it possible to make any meaningful predictions with this new data?
– Most abandoned below drainage deep mines (for instance, in the Pittsburgh coal) are not yet discharging.
– The degree to which they are flooded is also not always known.
– How do we get quality samples of these flooding pools?

Problems/Difficulties (cont.)
– What worth are samples of pumped discharges from active mining areas?
• Mine pool quantity calculations, such as infiltration rate from pumping data – How do you account for water stored in sealed sections of a mine.

Other Mine Pool Issues
Nick Schaer, WVDEP

Blowouts and artesian discharges
• Prediction Methods …everything discharges somewhere.
• Seepage, discreet and wetland creation.

Mine Pool spatial
variabilty

Mine Pool and deep
mine mapping
MSHA vs. SMCRA sources. Actual vs. proposed.Contour grids, Thickness, pool info, etc.

Mine Pool legal issues
Post law/pre lawHow do you treat 5.3% of a discharge?No SMCRA permit

Forced mine pool migration
•Internal seals
•Siphons and u-pipes
•Large scale pumping issues.

T & T Mine
Mine-poolDischarge Point
Flooded Extent of T&T 2 Mine
Free Draining Zone in T&T 2 Mine
About 20% flooded
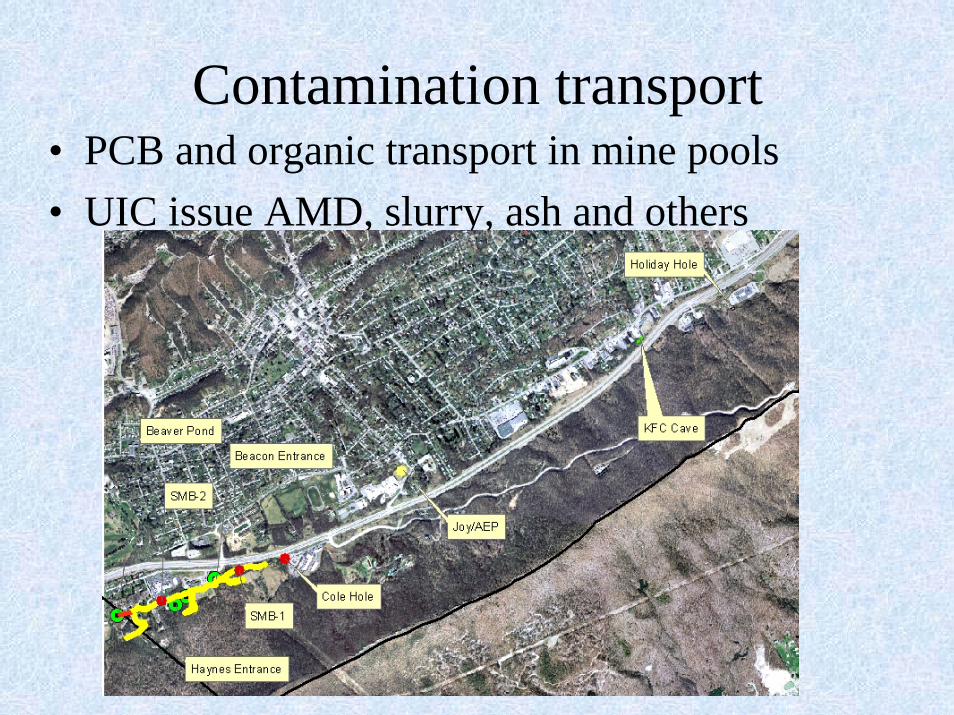
Contamination transport• PCB and organic transport in mine pools• UIC issue AMD, slurry, ash and others

Mine Pool Resources
Pittsburgh PoolsFireclay PoolsCountyLower Kittanning PoolsUpper Freeport PoolsPond Creek PoolsPoca 3 PoolsModern Mine Pools
90 0 90 180 Miles
N
EW
S
WV Mine Pools•Mine Pool as a resource issues.
• Storage modeling
• Legal issues liability vs. resource
• Resource parameter definitions
Mine pools need not be a liability, they are also a valuable resource.

PSD’s in the Poca 3 coal seam

Mine Pool Flow Systems
• Dynamic vs Steady State• When “if ever” should MODFLOW be
used?• Use of karst hydrology flow models

ADTI and the creation of a mine pool internet database
http://aciddrainage.com/problem_summaries.cfm