mincon, a basic program to control temperature and oxygen
TRANSCRIPT

U. S. DEPARTMENT OF THE INTERIOR
GEOLOGICAL SURVEY
MINCON, a BASIC program
to control temperature and
oxygen fugacity in furnaces
by
J. Stephen Huebner
Open-File Report 81-132^
This report is preliminary and has not been reviewed for conformity with U.S. Geological Survey editorial standards. Any use of trade names is for descriptive purposes only and does not imply endorsement by the USGS.
1981
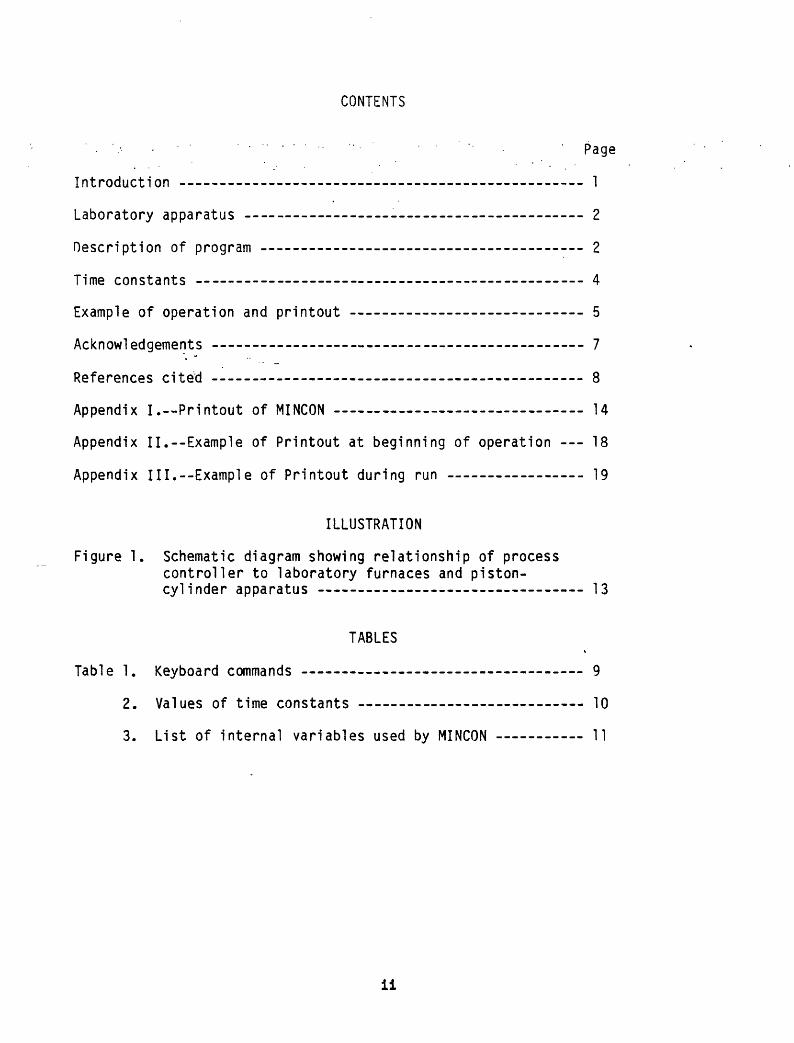
CONTENTS
Introduction - - --- -- 1
Laboratory apparatus -- --- ------ --- 2
Description of program ---- ---- -- -- ------- 2
Time constants -- ----- -- ---- - -- ----- 4
Example of operation and printout - -- - 5
Acknowledgements _________ _.._ __ _____ __ _ 7
References cited ------ - ----- ______ 3
Appendix I. --Printout of MINCON 14
Appendix II. --Example of Printout at beginning of operation 18
Appendix III. --Example of Printout during run ---- _ -__ 19
ILLUSTRATION
Figure 1. Schematic diagram showing relationship of process controller to laboratory furnaces and piston- cylinder apparatus 13
TABLES
Table 1. Keyboard commands 9
2. Values of time constants -- - 10
3. List of internal variables used by MINCON 11
ii

Introduction
Following the pioneering studies of Van't Hoff (see Eugster, 1971) and Bowen (1928), experimental petroTogists have simulated natural processes in the .laboratory to understand the conditions at which minerals and rocks crystallize.. For. half a century, .these studies have . focused upon the determination of equilibrium conditions. Charges (samples) of known bulk; composition were subjected to steady values of the intensive parameters temperature, pressure, and fugacities of volatile components; the charges were quenched to ambient conditions and then examined. Run durations used were generally believed sufficient for the charge to achieve an equilibrium state. This research enabled petrologists to comprehend many aspects of magma generation and crystallization by equilibrium processes, but it did not permit satis factory explanations of processes that never attained equilibrium or that proceeded by a succession of local equilibrium states. Such processes must be understood if petrologists are to interpret correctly the distinct textures and the intercrystalline minor element distributions in igneous and volcanic rocks or to measure cooling rates from diffusively zoned crystals or microstructures.
Recent efforts in experimental mineralogy and petrology have stressed the departure from equilibrium and thus have necessitated the control of temperature as a function of elapsed time. Such efforts include dynamic crystallization studies of lunar basalts (Donaldson et al., 1975; Thornber and Huebner, 1980) and my own attempts to measure Fe-Mg diffusion rates in silicate minerals (unpublished). The perfection with which these studies model natural processes is limited, in part, by the difficulty of manually controlling more than one of the important intensive parameters, especially for the long periods of time characteristic of even relatively fast petrol ogic processes.
Manually controlled furnaces are not attended 24 hours per day, and researchers have difficulty in making the precise adjustments in C02 and Ho gas flow rates necessary to vary furnace 'c^ as a smooth function or temperature or time. In this report, I describe a program that will cause a laboratory process controller to monitor and control gas mixing furnaces for experiments of long (indefinite) duration. For diffusion and dynamic crystallization studies, temperature, oxygen fugacity, and time are the critical variables, but the program can be modified to control other variables.
The program MINCON was written to cause an Analog Devices Macsym II process controller to satisfy several requirements:
1. Monitor the temperature and oxygen fugacity of conventional gas- mixing and quenching furnaces equipped with zirconia cells.
2. Control the temperature and oxygen fugacity of such furnaces as a function of time and temperature, respectively.
3. Without disturbing other active processes (experiments), permit any experiment to be terminated, modified, and started again.
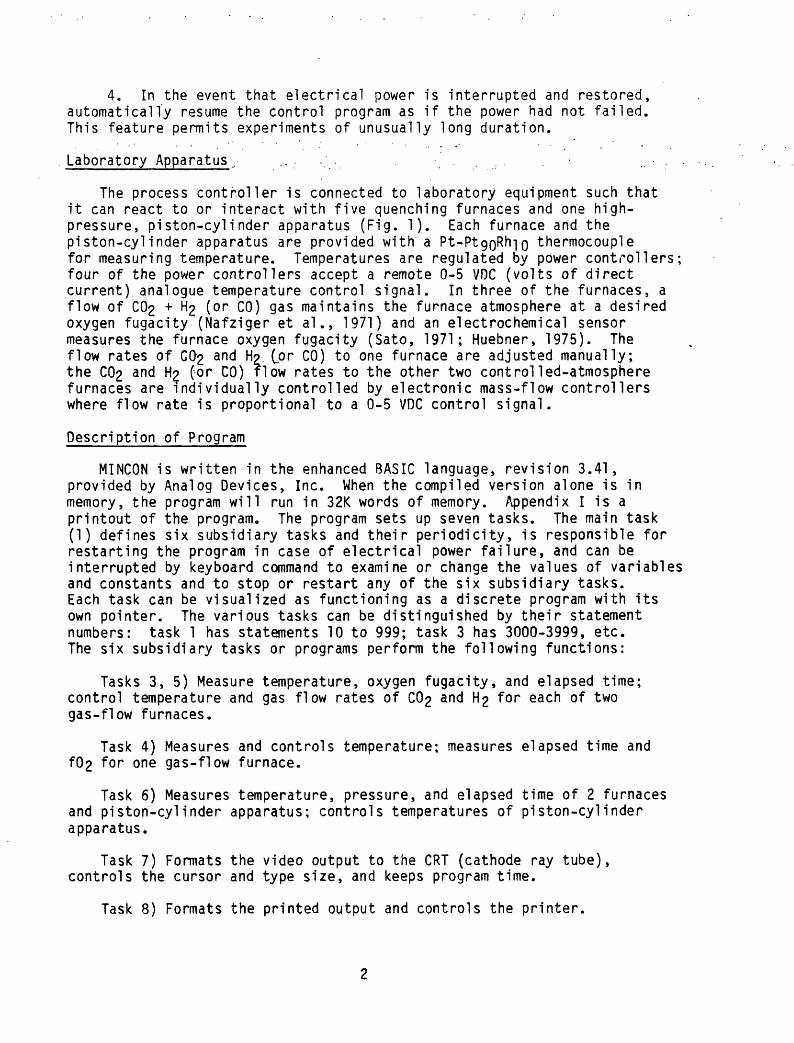
4. In the event that electrical power is interrupted and restored, automatically resume the control program as if the power had not failed. This feature permits experiments of unusually long duration.
Laboratory Apparatus.. .. . , . .
The process controller is connected to laboratory equipment such that it can react to or interact with five quenching furnaces and one high- pressure, piston-cylinder apparatus (Fig. 1). Each furnace and the piston-cylinder apparatus are provided with a Pt-PtgoRh-|o thermocouple for measuring temperature. Temperatures are regulated by power controllers; four of the power controllers accept a remote 0-5 VDC (volts of direct current) analogue temperature control signal. In three of the furnaces, a flow of C02 + H2 (or CO) gas maintains the furnace atmosphere at a desired oxygen fugacity (Nafziger et al., 1971) and an electrochemical sensor measures the furnace oxygen fugacity (Sato, 1971; Huebner, 1975). The flow rates of G02 and H?- C° r CO) to one furnace are adjusted manually; the C02 and H2 (or CO) flow rates to the other two controlled-atmosphere furnaces are individually controlled by electronic mass-flow controllers where flow rate is proportional to a 0-5 VDC control signal.
Description of Program
MINCON is written in the enhanced BASIC language, revision 3.41, provided by Analog Devices, Inc. When the compiled version alone is in memory, the program will run in 32K words of memory. Appendix I is a printout of the program. The program sets up seven tasks. The main task (1) defines six subsidiary tasks and their periodicity, is responsible for restarting the program in case of electrical power failure, and can be interrupted by keyboard command to examine or change the values of variables and constants and to stop or restart any of the six subsidiary tasks. Each task can be visualized as functioning as a discrete program with its own pointer. The various tasks can be distinguished by their statement numbers: task 1 has statements 10 to 999; task 3 has 3000-3999, etc. The six subsidiary tasks or programs perform the following functions:
Tasks 3, 5) Measure temperature, oxygen fugacity, and elapsed time; control temperature and gas flow rates of C02 and H2 for each of two gas-flow furnaces.
Task 4) Measures and controls temperature; measures elapsed time and f02 for one gas-flow furnace.
Task 6) Measures temperature, pressure, and elapsed time of 2 furnaces and piston-cylinder apparatus; controls temperatures of piston-cylinder apparatus.
Task 7) Formats the video output to the CRT (cathode ray tube), controls the cursor and type size, and keeps program time.
Task 8) Formats the printed output and controls the printer.

Explanation of two tasks (1,3) should suffice to make clear the operation of the program. Task 1 is unique; tasks 4-6 embody operations included in task 3, and tasks 7 and 8 use conventional BASIC format and print statements to-put results out to a printer and the video screens.
At the beginning of the program, task 1 prints title and date, reserves space, and assigns initial values to various "constants" used subsequently (Table 1). These "constants" are placed in the main task so that the initial value may be adapted by subsequent operators or programmers to the needs of individual experiments. Task 1 then defines the six secondary tasks (lines 300-800); these statements include the line number at which each task begins and a priority (100 to 200 in the program). If statements from two active tasks require the CPU (central processing unit) at the same time, the statement from the task having higher priority will be executed first.
Lines 903-971 establish the periodicity with which individual secondary, tasks are executed and start execution of these tasks. Task 7 executes most frequently (30-second intervals); task 3 is executed every 85 seconds. Task 8 controls printer output; measurements are printed every 300, 3600, or 7200 seconds, depending upon the value of J8 (970, 960, or 920, respectively) at the time Task 8 was last activated.
After the tasks are started, the task 1 pointer moves into lines 986 to 993, a loop designed to keep the main task active. Exit from the loop is provided by a value of J8 other than 989 or by an automatic restart. If the automatic restart statement (line 986) is activated, control is passed to line 994, the time of the power failure is printed, the subsidiary tasks are restarted (line 997), then control is passed back to the main loop beginning with line 986. In either case, departure from the main loop is only momentary.
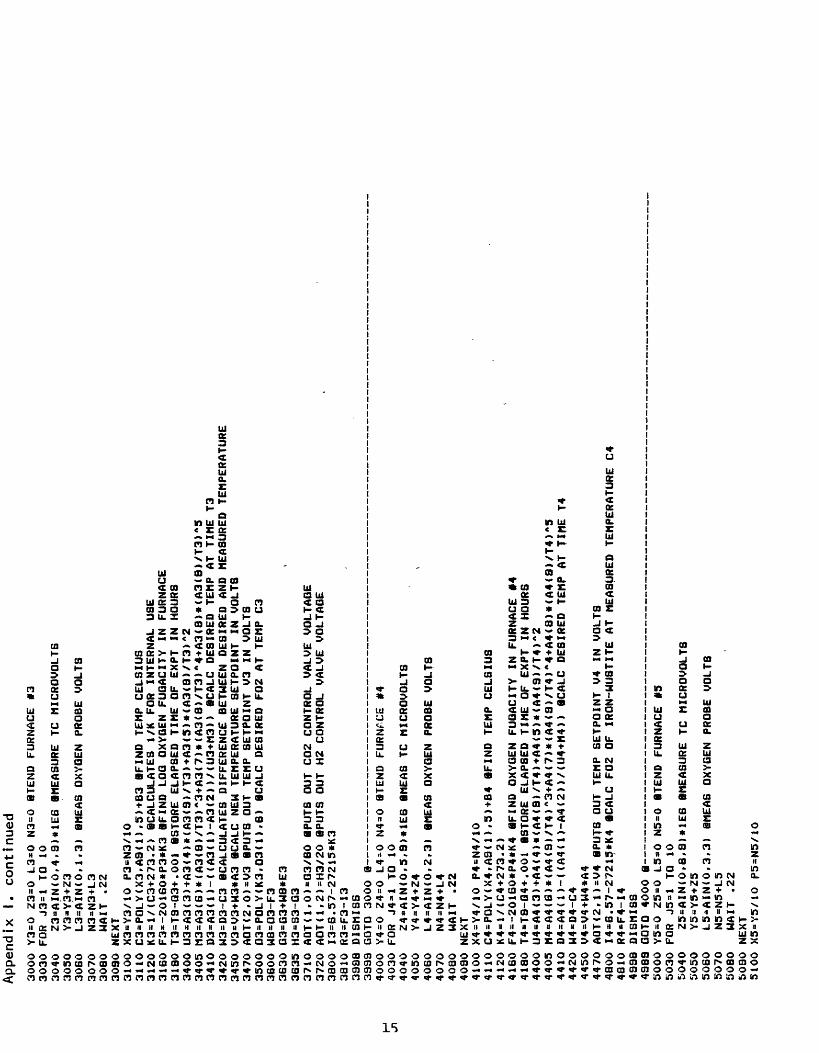
Task 3, lines 3000 to 3999, first measures the thermocouple (microvolts) and oxygen probe (volts), ten times each. The average thermocouple microvoltage reading (line 3100) is converted to °C (line 3110) and 1/°K (line 3120) by means of a polynomial of the form °C = a + bx + cx2 + dx3 + ex^ where x is microvolts. The average oxygen probe EMF reading (also line 3100) is used to compute the log value of the furnace atmosphere, F3 (line 3160), using the Nernst equation, EMF = (RT/4F)*ln (f02 furnace/^ reference) where the reference oxygen fugacity is 1 atmosphere. The run or elapsed time T3 in line 3190 is simply the difference between the current system time (T9) and the system time at the initiation of an experiment (03).
The desired temperature (03) is computed as a function of elapsed time (T3) in lines 3400-3410, according to the equation.
= "'"max
Cil fJil 2 Til 3 Til 4 Tila + b [ T3J + c[T3j + d LT3j + e LT3j + f LT3J
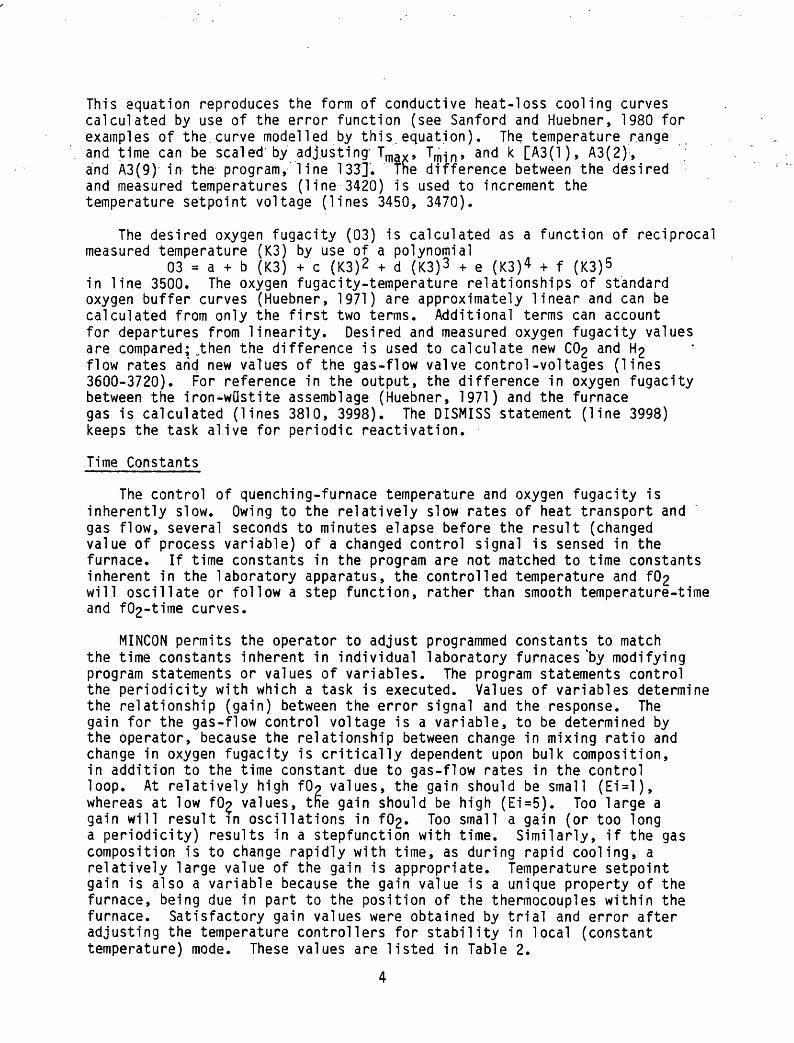
This aquation reproduces the form of conductive heat-loss cooling curves calculated by use of the error function (see Sanford and Huebner, 1980 for examples of the.curve model led. by this equation). The temperature range and time can be scaled by adjusting Tmax , Tm ^ n , and k [A3(l), A3(2), and A3(9) in the program, line 133]. The difference between the desired and measured temperatures (line 3420) is used to increment the temperature setpoint voltage (lines 3450, 3470).
The desired oxygen fugacity (03) is calculated as a function of reciprocal measured temperature (K3) by use of a polynomial
03 = a + b (K3) + c (K3) 2 + d (K3) 3 + e (K3) 4 + f (K3) 5 in line 3500. The oxygen fugacity-temperature relationships of standard oxygen buffer curves (Huebner, 1971) are approximately linear and can be calculated from only the first two terms. Additional terms can account for departures from linearity. Desired and measured oxygen fugacity values are compared; .then the difference is used to calculate new C02 and H2 flow rates arid new values of the gas-flow valve control-voltages (lines 3600-3720). For reference in the output, the difference in oxygen fugacity between the iron-wustite assemblage (Huebner, 1971) and the furnace gas is calculated (lines 3810, 3998). The DISMISS statement (line 3998) keeps the task alive for periodic reactivation.
Time Constants
The control of quenching-furnace temperature and oxygen fugacity is inherently slow. Owing to the relatively slow rates of heat transport and gas flow, several seconds to minutes elapse before the result (changed value of process variable) of a changed control signal is sensed in the furnace. If time constants in the program are not matched to time constants inherent in the laboratory apparatus, the controlled temperature and f02 will oscillate or follow a step function, rather than smooth temperature-time and f02-time curves.
MINCON permits the operator to adjust programmed constants to match the time constants inherent in individual laboratory furnaces 'by modifying program statements or values of variables. The program statements control the periodicity with which a task is executed. Values of variables determine the relationship (gain) between the error signal and the response. The gain for the gas-flow control voltage is a variable, to be determined by the operator, because the relationship between change in mixing ratio and change in oxygen fugacity is critically dependent upon bulk composition, in addition to the time constant due to gas-flow rates in the control loop. At relatively high fOp values, the gain should be small (Ei=0), whereas at low fO^ values, the gain should be high (Ei=5). Too large a gain will result in oscillations in f02» Too small a gain (or too long a periodicity) results in a stepfunction with time. Similarly, if the gas composition is to change rapidly with time, as during rapid cooling, a relatively large value of the gain is appropriate. Temperature setpoint gain is also a variable because the gain value is a unique property of the furnace, being due in part to the position of the thermocouples within the furnace. Satisfactory gain values were obtained by trial and error after adjusting the temperature controllers for stability in local (constant temperature) mode. These values are listed in Table 2.

Example of Operation and Printout
A compiled version of MINCON must be loaded into memory from tape file # (see Appendix II): .
NEW RTNLOAD W:# RTN
If the program was previously listed onto the tape file, use
NEW RTN* COMPILE W:# RTN
Bring the furnaces to the desired initial temperature and oxygen fugacity by using the manual control (local) mode. When the intensive parameters in the furnaces are close to the desired values (how close will depend upon the tolerable amount of mismatch when automatic or remote mode is initiated), type RUN RTN to start the program (see Appendix II). Within several seconds of the warning bell, default values of the setpoints will be put out by the controller. At this time, the operator may switch any furnace to automatic (remote or program) control or adjust initial control variables [Vi , Gi , Hi, Ei , Ai(l), Ai(2), and Ai(9) are likely to need changing; see Table 1], To adjust the variables, first type CTRL/A.** When the control variables are adjusted satisfactorily (remember, control voltages are changed only every -90 seconds by the program), a task may be halted at steady state (SUSPEND i), and the. output values of the variables will remain constant.
As the experiment is begun, set Qi equal to the current value of the program time T9 (thereby initializing the run-time to zero) and type ALERT i RTN (see Appendix III). The process controller will begin to control temperature and f$2> attempting to maintain actual values equal to the calculated values. At this time it is advisable to resume the main task (CON Rtn) so that the power fail -automatic restart feature, which is controlled by task 1, is operative. In the example Shown in Appendix III, furnace 3 has been brought to temperature and an oxygen fugacity close to that desired (the value of the iron-wtlstite buffer). Following the entry of ALERT 3, task 3 assumed control of both temperature and oxygen fugacity. Within 4 minutes, furnace fO£ was adjusted satis factorily; the value of delta log (fO£ in atm) is close to zero in the report printed 2 hours later.
Note the use of the CON to reactivate the main task in Appendix III, enabling the automatic restart command sequence. Subsequent entry of CTRL/A halts the main task and again permits the operator to stop or start tasks and to examine or change variables (see Table 3).
Underscore indicates that the set of characters is a single keystroke. **Slash indicates that both keys are depressed simultaneously.

Two notes of caution are necessary. When zeroing or calibrating a peripheral analogue device such as an electrometer, strip chart recorder, or digital, thermometer, the analogue input to the process controller may be disturbed. The controller will sense the perturbed input value and attempt to correct this change by altering its control (output) signals. This problem can be avoided by suspending the appropriate task (SUSPEND i) during the zeroing or calibrating procedure, then subsequently resuming the task (ALERT i). During suspension, a task's output signals are maintained constant and its computing is halted. When resumed, the time will be updated and new measurements (and output) will be made. The second warning concerns the automatic restart feature, which is controlled by Task 1. When the main task is halted, either by use of CTRL/A or by BASIC program error, the automatic restart feature is disabled. In this case, a power interuption will halt all tasks and set all outputs to 0 volts; however, the program and values of all variables remain stored in memory. In the event that the main task halts, print the values of the variables, restart the program with RUN, then replace the default values of the variables with those to be used.

Acknowledgements
Gilpin R. ("Rob"),Robinson of the U.S. Geological Survey (USGS) wrote and kindly made available the equation that reproduces the cooling curves originally derived by use- of the erf function. Use of this simple equation conserves considerable memory within the computer. Robinson and Priestley Toulmin III, also of the USGS, and John Bowles of Analog Devices, Inc., reviewed this report and offered helpful suggestions.

References Cited
Bowen, N.L. (1928) The evolution of the igneous rocks. Princeton Univ. 'Press,. Princeton, N.J. x+ 334 pages. . .
Donaldson, C.H., T.M. Usselman, R.J. Williams, and G.E. Lofgren (1975) Experimental modeling of the cooling history of Apollo 12 olivine basalts. Proc. Lunar Sci. Conf. 6th, 843-869.
Eugster, H.P. (1971) The beginnings of experimental petrology. Science, 173, 481-489.
Huebner, J.S. (1971) Buffering techniques for hydrostatic systems at elevated pressure, in Research techniques for high pressure and high temperature, G.C. Ulmer, editor, p. 123-177. New York: Springer-Verlag
Huebner, J.S. -(1975) Qxyg_en fugacity values of furnace gas mixtures. Amer. Mineral,'60_, 815-823.
Nafziger, R.H., G.C. Ulmer, and E. Woermann (1971) Gaseous buffering for the control of oxygen fugacity at one atmosphere, in Research techniques for high pressure and high temperature, G.C. Ulmer, editor, p. 9-41. New York: Springer-Verlag.
Sanford, R.F. and J.S. Huebner (1980) Model thermal history of 77115 and implications for the origin of fragment-laden basalts. Proc. Conf. Lunar Highlands Crust, 253-269.
Sato, M. (1971) Electrochemical measurements and control of oxygen fugacity and other gaseous fugacities with solid electrolyte sensors, in Research techniques for high pressure and high temperature, G.C. Ulmer, editor, p. 43-99. New York: Springer-Verlag.
Thornber, C.R. and J.S. Huebner (1980) An experimental study of the thermal history of fragment-laden "basalt" 77115. Proc. Conf. Lunar Highlands Crust, 233-252.

Table 1. Keyboard Commands
RUN - Begin entire program
CTRL/B - Halt entire program, set output voltages to zero
CTRL/A - Interrupt main task (1); other tasks continue execution
Keyboard Commands recognized only after CTRL/A
CON - Resumes execution of main task
PRINT X - Returns value of variable X
X=N - Assigns X a new value N
SUSPEND n - Interrupts execution of task n
ALERT n - Resumes execution of task n
Values ("constants") the operator will need to change
A3 - A6 - gain (change in control signal/error signal), temperature setpoint
J8 - Determines frequency of printout (J8 = 920 for every 2 hours, default; 960 for every 60 minutes; 970 for every 5 minutes). Must be followed by RTN CON RTN
A3(i) - A6(i) Cooling curve constants for tasks 3 to 6
03(i), 05(i) - Polynomial equation constants to control f02
A9(i) - Thermocouple conversion constants, used to convert microvolts to degrees C.
Ql to Q6 - Values of system time in hours (T9) at the initiation of particular experiments in Furnaces 1 to 5 and the piston-cylinder apparatus (Q6).
V3 to V6 - Values of the programmable temperature setpoint at the initiation of an experiment, in volts.
El to E6 - gain (change in control signal/error signal), gas-flow controllers
Bl to B6 - Temperature correction, in °C
L8 - Pressure transducer conversion factor, to yield kilobars
G3, G5 - Initial C02 flow rates, SCCM (standard cubic centimeters per minute)
H3, H5 - Initial H 2 flow rates, SCCM
S3, S5 - Total gas-flow rate to be maintained during an experiment9

Table 2: Values of Time Constants'
Variable Task periodicity Gain
temperature 90 seconds 0.001-0.002
(at iron-wtistite) 90 seconds 1-5
(above iron-wUstite) 90 seconds 1-3
10
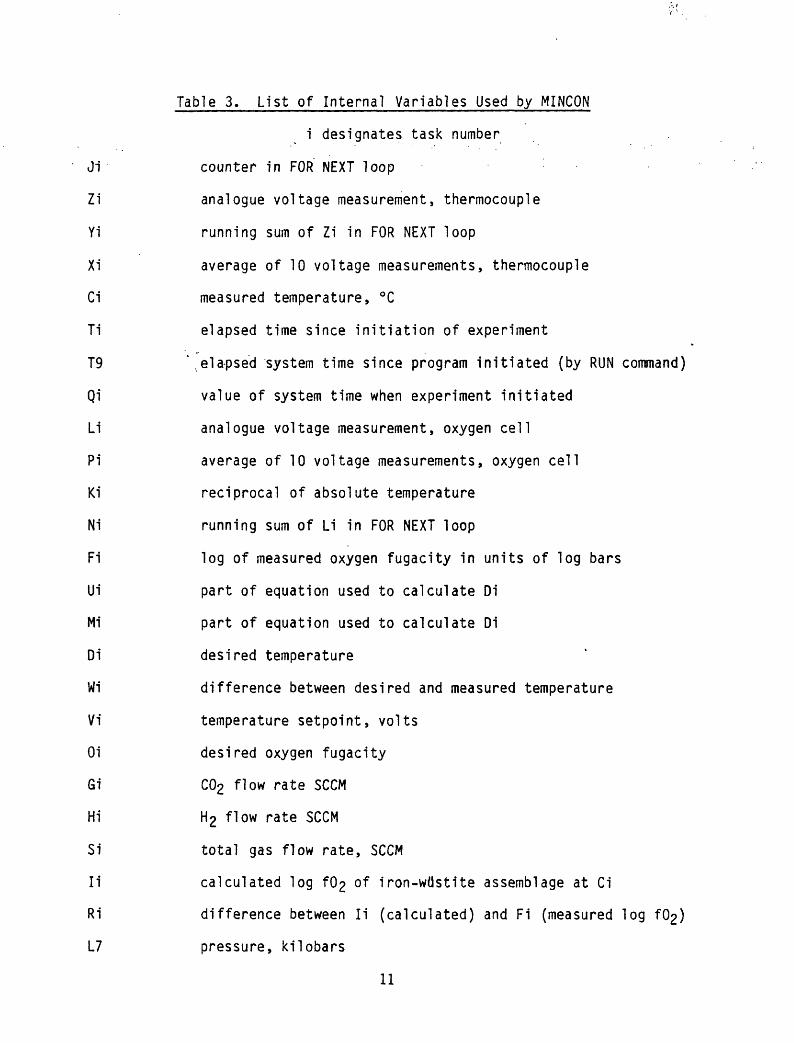
Table 3. List of Internal Variables Used by MINCON
i designates task number
Ji counter in FOR NEXT loop
Zi analogue voltage measurement, thermocouple
Yi running sum of Zi in FOR NEXT loop
Xi average of 10 voltage measurements, thermocouple
Ci measured temperature, °C
Ti elapsed time since initiation of experiment
T9 ".elapsed system time since program initiated (by RUN command)
Qi value of system time when experiment initiated
Li analogue voltage measurement, oxygen cell
Pi average of 10 voltage measurements, oxygen cell
Ki reciprocal of absolute temperature
Ni running sum of Li in FOR NEXT loop
Fi log of measured oxygen fugacity in units of log bars
Ui part of equation used to calculate Di
Mi part of equation used to calculate Di
Di desired temperature
Wi difference between desired and measured temperature
Vi temperature setpoint, volts
Oi desired oxygen fugacity
Gi C02 flow rate SCCM
Hi H 2 flow rate SCCM
Si total gas flow rate, SCCM
li calculated log f0 2 of iron-wdstite assemblage at Ci
Ri difference between li (calculated) and Fi (measured log f02 )
L7 pressure, kilobars
11
Table 3. List of internal variables - continued
L9 constant relating number of seconds measured by the system's internal stopwatch to hours of e-lapsed time. Nominally 3600.
W8 difference in log f02> calculated - measured values, Furnace 3
W9 difference in log f02> calculated - measured values, Furnace 5
12

Figure 1. Schematic diagram showing relationship of process controller to falDoratory furnaces and piston-cylinder apparatus. The small numbers in the upper right hand corner of each box are program task numbers, here associated with the system components the various tasks control. The five furnaces and piston cylinder apparatus all include thermocouples for furnace power controllers. Furnaces 3, 4, and 5 contain electrochemical (oxygen fugacity) cells; Furnaces 3 and 5 have remotely controlled gas flow control values; and the piston cylinder apparatus contains a pressure transducer. VDC is volts, direct current.
13

Pis
ton-
cylin
de
r appara
tus
1,7
Ma
csym
-IE
pr
oces
s co
ntr
olle
r
Analo
gue
to
dig
ital
convert
er
Inp
ut
and O
utp
ut
card
sD
igita
l to
analo
gue
conve
rter
Fu
rna
ce
*3
Fu
rna
ce
Furn
ace
*5
8
Prin
ter
Vid
eo
Scr
een
Furn
*1
'Bu
tch
*
Furn
*2 da
nce*

APPENDIX I.
Printout o
f MI
NCON
10 90
100
105
110
113
115
118
119
120
130
133
134
135
136
138
140
143
145
190
191
210
220
22B
227
233
235
300
400
500
600
700
800
903
904
905
906
907
920
921
980
961
970
971
988
997
989
999
99;
99!
T9-0 J9=920 L9-3600
DIM N*<31),L*<3>,A*<9),B*<8>,C*<10),W*<2B),D*<10>
N**"MINCON VERSION OF JULY 24, 1891"
OPENW :2"*QTO:0"
PNT 15 PRINT :2 N* PRINT 12
PRINT 12
"PROGRAM ACTIVATED:
"JPTIME 12
PRINT 12
L**"--#"
PRINT 12
"PRINT USINQ!2
" FURNACE
ML«,1,2,3,4»5,6 PRINT
CLOSE IZ
DIM A3<9),A4<9),A5(9),A6<9) 8COOLINQ CURVE CONSTANTS
A3<1
12 PRINT 12
2 PRINT :2
A4(l
A5(l
AB<1
=1230 A3<2)*1045 A3<3>*1.02714 A3(4)"3.11849 A3(S)=-1.51518 A3(6)=l.69106 A3(7)*-0.39303 A3(8)=0.05308 A3(9)=1.00000
=1230 A4<2)*1045 A4<3)-1.02714 A4(4)*3.11849 A4<5)*-1.51518 A4<6)*1.69106 A4(7)=-0.38303 A4(8)=0.05308 A4<9)=1.00000
«1230 A5<2)«1045 A5(3)=1.02714 A5<4)=3.11849 A5(5)*-l.51518 A5(B>°1.69106 A5<7)*-0.39303 A5(8)=0.05308 A5(9)-1.00000
=1230 A6<2)=1045 AS<3)=1.02714 AB<4)=3.11849 A6(5)*-l.51518 A6<6>*1.69106 A8<7> 0.39303 A6<8)=0.05308 AB(9)=1.00000
A3*.001 A4-.001 A5-.001 A6=.001 BDEFAULT VALUES OF GAIN, TEMPERATURE CONTROL <IN VOLTS PER DEGREE ERROR)
DIM 03(6),04(6),05(6) 8CON6TANTS POM F 02
03(1 =6.57 03<2)=-27215 03<3)«0 03<4)*0 03<5)*0 03(B)=0
05<1 *9.57 05<2)*-27215 05(3)=0 05<4)*0 05<5)=0 05<B)=0
DIM A9(5) 8CONVER6ION CONSTANTS FOR PT-PT90.RH10 THERMOCOUPLES
A9(1)=4.1B705E+1 A9<2)=1.13434E-1 A9<3)«-l.67B28E-6 A8(4>*-l.08458E-11 A9<5>=1.83797E-15
01-0 Q2 = 0 Q3=-0
Q4 = 0 Q3-0 G6=0 9SYBTEM TIME AT INITIATION OF EXPERIMENTS
V3-3.7B V4-3.68 V5*3.77 V6*0 9INITIAL TEMPERATURE SETPOINT6 IN VOLTS
Bl=8.5 82*9.2 B3=25.B 84*12.8 85*23.0 86*0
L8-1
.013
8 §P
RE6B
URE'
TRAN
SDUC
ER F
ACTOR
G3-35 H3«55 63*80 E3*5 8INITIAL C02, H2, AND TOTAL GAS FLOW RATES IN SCCM7 RATE OFCHANGE
G5
*72
H
5-1
8
65*9
0
£5*3
TASK 3
,3000,220 8FURN 3
TASK 4.4000
,230 8FURN 4
TASK 5
,5000,240 BFURN 5
TASK 6,6000,150 §PISTON-CYLINDER
TASK 7,7000,250 8CONTROLS CRT VIDEO DISPLAY
TASK 9,8000,100 BPRINTOUT
ACTIVATE 3 PER 85
ACTIVATE 4
PER 90
ACTIVATE 5 PER 95
ACTIVATE 6 PER 60
ACTIVATE 7
PER 30
ACTIVATE 8 PER 7200
GOTO 988
ACTIVATE 8 PER 3600
GOTO 888
ACTIVATE 8 PER 300
GOTO BBS
RESTART MAIN,994
JUMP J8
J8=9B9
RESTART 3,3000 RESTART 4,4000 RESTART 5,5000 RESTART 6,6000 RESTART 7,7000 RESTART 8,800O
WAIT
1GOTO 986
OPEN
W :Z
N$QT
O:O
HPR
INT
12 P
RINT
I2
MPOW
ER F
AILED
AT "J
PTIM
E 12
PRI
NT 12
PRINT 12
PRI
NT 12
CLOSE 12
RESUME 3 RESUME 4
RESUME 5 RESUME 6 RESUME 7 RESUME 8
PNT 15 iCHANGES TO 64 CHARACTER LINE ON VIDEO 6CREEN
GOTO 986
Appendix I.
co
ntin
ued
3000 Y3 = 0 Z3=0 L3»0 N3=0 8TENO FURNACE #3
3030 FOR J3
=l TO 10
3040
Z3=AIN<0,4,9)*1E6 BMEASURE TC MICROVOLTS
3050
Y3»Y3+Z3
3060
L3=AIN<0,1,3) SHEAS OXYGEN PROBE VOLTS
3070
N3=N3+L3
3080
WAIT .22
3090 NEXT
3100 X3«Y3/10 P3=N3/10
3110 C3=POLY<X3,A9<1).5>+B3 8FIND TEMP CELSIUS
3120 K3*l/(C3+273.2> 8CALCULATES 1/K FOR INTERNAL USE
3160 F3*-20160*P3*K3 BFIND LOQ OXYGEN FUGACITY IN FURNACE
3180 T3=T9-Q3+.001 BSTORE ELAPSED TIME OF EXPT IN HOURS
3400 U3*A3(3>+A3<4>*<A3<9>/T3>+A3<S>*(A3(8>/T3)
A2
3405 M3=A3(6)*<A3(8>/T3>
A3+A3<7)«(A3<8>/T3)
A4+A3(8>*<A3<8)/T3>
A5
3410 D3=A3m-«A3(l)-A3(2»/(U3+M3>) 8CALC DESIRED TEMP AT TIME T3
3420 H3=D3-C3 BCALCULATES DIFFERENCE BETWEEN DESIRED AND MEASURED TEMPERATURE
3450 V3=V3+W3*A3 0CALC NEW TEMPERATURE SETPOINT IN VOLTS
3470 AOT(2.0)=V3 BPUT8 OUT TEMP SETPOINT V3 IN VOLTS
3500 Q3=POLY<K3,03<1).B> BCALC DESIRED F02 AT TEMP C3
3600 W8-03-F3
3630 G3=G3+W8*E3
3635 H3»S3-G3
3710 AQT(1,0)=03/60 BPUTS OUT C02 CONTROL VALVE VOLTAGE
3720 AOT<1,2)=H3/20 8PUTS OUT H2 CONTROL VALVE VOLTAGE
3BOO I3=B.57-27215*K3
3B10 R3»F3-I3
3998 DISMISS
ocio
o
nn
Tn
o
A A
A
n«
_«
__
__
««
_M
_««_«__««««_«_
M«
««
__
««
_«
«_
»«
««
.««
««
««
»_
«_
_«
._._
_..
_._
,._
_-.
_*J
*Jd
«J
U
U I
w
wV
W
13
4000 Y4=0 Z4=0 L4*0 N4=0 QTEND FURNACE #4
4030 FOR J4»l TO 10
4040
Z4=AIN(0,5,9)*1E6 8MEAB TC MICROVOLTS
4050
Y4=Y4+Z4
4060
L4*AIN(0,2r3) 8MEAS OXYGEN PROBE VOLTS
4070
N4=N4+L4
4080
WAIT .22
4090 NEXT
4100 X4=Y4/10 P4=N4/10
4110 C4=PQLY(X4rA9(l),5)+B4 8FIND TEMP CELSIUS
4120 K4-l/(C4+273.2)
4160 F4B-20160*P4»K4 BFIND OXYGEN FUQACITY IN FURNACE *4
4180 T4"T8-Q4+.001 8STORE ELAPSED TIME OF EXPT IN HOURS
4400 U4°A4(3)+A4<4>«<A4<a>/T4>+A4<3)*(A4(9)/T4>
A2
4405 M4°A4<6)*(A4<9)/T4>
A3+A4(7>*(A4(8>/T4>
A4+A4(8>«(A4<8)/T4)
A5
4410 D4»A4(1)-((A4(1)-A4(2))/(U4+M4» 8CALC DESIRED TEMP AT TIME T4
4420 W4-D4-C4
4450 V4=V4+H4*A4
4470 AOT(2,1)=V4 8PUTS OUT TEMP SETPOINT V4 IN VOLTS
4800 I4*6.57-27215»K4 8CALC F02 OF IRON-MUSTITE AT MEASURED TEMPERATURE C4
4810 R4«F4-I4
4998 DISMISS
^CpD9 ULJ I
U *vvV
H"""*""" "" "" " ~'i
-«. -.. « « »«.« «. «. »«. .«
^
- .
^
.
^ ^
^ .
..
. .
^..
..
.
. ..
^.
5000 Y5=0 Z5=0 L5=0 N5=0 8TEND FURNACE #5
5030 FOR J5»l TO 10
&040
ZS»AIN(OrB,8)*lEB 6MEASURE TC MICROVOLTS
5050
Y5«Y5+Z5
5060
L5-AIN<0,3,3) 3MEAS OXYGEN PROBE VOLTS
5070
N5«N5+L5
5080
WAIT .22
5090 NEXT
5100 X5»Y3/iO P5=N5/10

Appe
ndix
I.
co
ntin
ued
5110 C5*POLY<X5,A9<1),5)+B5 0 FIND TEMP CELSIUS
5120 K5»l/(C5+273.2>
5160 F5*-20160*P5*K5 BFIND OXYQEN FUGACITY IN FURNACE #5
5190 T5-T9-Q5+.001 BBTORE ELAPSED TIME OF EXPT IN HOURS
5400 U5«A5(3)+A5(4)*(A5<9)/T5)+A5(5)*(A5(9)/T5)
A2
5405 M5-A5(6)*(A5(8>/T5)
A3+A5<7>*(A5(9)/T5)
A4+A5(8)«(A5(9>/T5>
A5
5410 D5»A5(1)-((A5(1)-A5(2))/(U5+M5» BCALC DESIRED TEMP AT TIME T5
5420 M5-D5-C5
5450 V5«V5+H5»A5
5470 AOT(2.2)-V5 BPUTB OUT TEMP SETPOINT V5 IN VOLTS
5500 05*POLT(K5,05<1>,B) BCALC DESIRED F02 AT TEMP C5
5SOO MB-05-F5
5630 G5»G5+UB«E5
5635 H5»S5-G5
5710 AOT(1.1)-05/40 BPUTS OUT C02 VALVE CONTROL VOLTAGE
5720 AOT(1,3)«H5/10 BPUTS OUT H2 VALVE CONTROL VOLTAQE
5800 I5«6.57-27215*K5 BCALC F02 OF IRON-MUSTITE AT MEAS TEMP
5910 R5-F5-I5
5999 DISMISS
5998 GOTO 5000 B
BOOO Y6«0 ZB«0 Y7«0 Z7-0 0TEND PISTON CYLINDER
6030 FOR JB-1 TO 10
6040
Z6"AIN(Or15,9>*1EB BMEAB TC MV
6041
WAIT 0.21
6043
Z7*AIN(0,8f4) BMEAB PRESSURE TRANSDUCER VOLTS
6050
Y6«Y6+Z6
6051
Y7-Y7+Z7
6060 NEXT
6065 X8-Y6/10
6070 C6"POLY<X6.A9<1),5) 8FIND TEMP CELSIUS
6080 L7-Y7*LB BCONVERTB BUM OF TRANSDUCER MEASUREMENTS TO KILOBARS
H
6100 TB°T9-QB+.001 0BTORE ELAPSED TIME OF EXPT IN HOURS
- 6400 U6-A6(3)+AB(4>«<A6(8)/T6)+A6(5)*(A6(9)/T6)
A2
6405 M6=A6(6)*(A6(8)/T6)
A3+AB(7)»(AB(9)/TB)
A4+A6(B)*(A6(9)/T6)
A5
6410 DB»A6(1>-((AS(1)-AS(2))/(U6+M6>> BCALC DESIRED TEMP AT TIME T6
6420 MB-D6-C8
6450 VB*V6+MB*A6
6470 AOT(2.3)*V6 BPUTS OUT TEMP SETPOINT V6 IN VOLTB
6500 Yl-0 Y2-0 Zl-0 Z2*0 BMONITOR FURNACES 1>2 (BUTCH AND 8UNDANCE)
6530 FOR JIM TO 10
6532
Zl»AIN(3fO>*lE6 BMEAB TC MICROVOLTS. BUTCH
B534
Y1-Y1+Z1
B542
Z2*AIN(3.2)«1E8 BMEAB TC MICROVOLTS. SUNDANCE
8544
Y2-Y2+Z2
6548
WAIT 0.31
6548 NEXT
6565 X1-Y1/10 X2-Y2/10
6570 Cl-POLY(XlfA9<l),5)+Bl BFIND TEMP CELSIUS OF BUTCH
B571 C2»POLY(X2.AB(l)f5)+B2 BFIND TEMP CELSIUS OF BUNDANCE
6590 T1-T9-Q1 T2=T9-Q2 BSTORE ELAPSED TIME OF EXPERIMENTS IN HOURS
6996 DISMISS
6699 GOTO BOOO
7000 WAIT 20 BPAUSE TO PERMIT VARIABLES TO BE ASSIGNED VALUES -
7001 PNT 7 BSOUNDB WARNING BELL
7002 WAIT 5
7005 PNT 5 BCLEARB CRT SCREEN IN PREPARATION FOR NEW DISPLAY CYCLE
7010 PRINT PTIME PRINT
7020 PRINT "PGM TIME -"!PRINT T8JPRINT "HRS"
7040 PRINT "FURNACE NO.
1 2
3
4
56"
7041 PRINT
7045 At*" ####.#"
7047 PRINT "RUN TIME HRS";
7050 PRINT USING At.Tt .T2. T3.T4. .T5. TB

Appendix
I. co
ntin
ued
7051 PRINT
7055 B*»" ##*#.*"
7057 PRINT "TEMP CELSIUS"?
7060 PRINT USING BtrCl,C2,C3,C4»C5,CB
7061 PRINT
7062 C**" ###.##"
70B3 PRINT "DELTA TEMP CELSIUS
"I7064 PRINT USING C*rW3.W4.W5
7065 PRINT
7067 PRINT "LOG ATM F02
7070 PRINT USING C$rF3,F4,F5
7071 PRINT
7075 D$«" ##.###"
7077 PRINT "DELTA LOG F02
"J7080 PRINT USING D*,R3,R4,R5
7090 PRINT "PRESSURE IN KILOBARS";
7035 PRINT TAB(51>;L7
7500 T8=T9+TIMER/L3 BINCREMENTS THE PROGRAM TIME
7510 ZERO TIMER
7300 DISMISS
7333 GOTO 7000
8000 OPENW :2 "tQTOIO" BOPENS CHANNEL 2
FOR PRINTING -
B001 PNT 7
PNT 12 7
8WARNING BELL RINGS THRICE
8002 WAIT .4
8003 PNT 7
PNT 12 7
8004 WAIT .4
8005 PNT 7
PNT 12 7
8006 WAIT 30 8DELAY ASSURES THAT ALL INTERNAL VARIABLES ARE ASSIGNED VALUES
8010 PRINT 12 PTIME 12 PRINT
'.2 BCOMMENCE PRINTING OUTPUT
8020 PRINT
.'2
"PGM TIME «"JPRINT 12
TB
.'PR
INT
12 "HRS"
8030 A$ = " ##*#.##"
8035 PRINT 12 "RUN TIME IN HOURS";
8040 PRINT USING:2"
"A*»T1
,T2,T3,T4,T5,TB
8050 B$*" ####.#"
8055 PRINT 12
"TEMP, CELSIUS
8060 PRINT USINGIZ"
"B*,C1rC2
rC3,C4,C5,CB
8070 C$="--####.###"
8075 PRINT 12 "OXYGEN FUGACITY IN LOG ATMOSPHERES
"',
8080 PRINT USING:2"
"C$,F3,F4,F5
80B1 D**"--###f.*#«"
80B3 PRINT :2 "DELTA LOG ATM F02 RELATIVE TO IRON-MU8TITE
";8084 PRINT USING:2"
"D$,R3,R4,R5
BOBS PRINT !2 "PISTON CYLINDER PRESSURE IN KILOBARS"
8086 PRINT 12 TAB(96),L7
8080 PRINT :2
8100 CLOSE 12
8988 DISMISS
8333 GOTO 8000

APPENDIX
I I
f. Example
of Printout Du
ring
Run
CONSOLE INTERRUPT
AF LIME 994
(M)
ALERT 3
<M>
CON
04/27/81 12:10:55
PGM TIME =2.84088 MRS
RUN TIME IN
HOURS
2.82
2.B2
TEMP, CELSIUS
467.2
441.4
OXYGEN FUGACITY IN
LOG ATMOSPHERES
DELTA LOG ATM F02 RELATIVE TO IRON-WUSTITE
PISTON CYLINDER PRESSURE IN KILOBARS
2.82
1122.3
-13.222
-0.291
2.03
952.3
0.011
15.«
64B
2.03
1248.G
-3.323
1.391
Z.Q3
17.4 .0773544
CONSOLE INTERRUPT
AT LINE 994
(M)
J8=020
(M)
CON
04/27/81 12:19:10
PGM TIME =2.878 HRS
RUN TIME IN HOURS
2.82
2.82
TEMP, CELSIUS
487.2
441.4
OXYGEN FUGACITY IN LOG ATMOSPHERES
DELTA LOG ATM F02 RELATIVE TO IRON-WUSTITE
PISTON CYLINDER PRESSURE IN KILOBARS
2.87
1126.7
-13.178
-0.308
2.86
950.4
0.010
15.682
2.85
1248.4
-9.315
1.39D
2.87
18.G .0758073
04/27/81 14:19:10
PGM TIME =4.85033 MRS
RUN TIME IN HOURS
4.79
4.79
TEMP, CELSIUS
801.7
712.8
OXYGEN FUGACITY IN LOG ATMOSPHERES
DELTA LOG ATM F02 RELATIVE TO IRON-WUSTITE
PISTON CYLINDER PRESSURE IN KILOBARS
4.85
1125.3
-12.888
0.002
4.83
950. G
0.010
15.679
4.83
1240.3
-9.316
2.000
4.84
20.1 .0476503