million ton deficit –fact or...
TRANSCRIPT

Page 1
MILLION TON DEFICIT – FACT OR FICTION?CMAA – MIAMI March 13,2015Pamela Thornton
Oliver Tritton
March 15

Disclaimer
• Source of data: Armajaro, unless otherwise stated. The fund(s) mentioned herein are exempted companies incorporated with limited liability in the Cayman Islands as an open-ended
investment company. The Fund is an unregulated collective investment scheme for the purposes of the Financial Services and Markets Act 2000 of the United Kingdom (the “Act”). The
promotion of the Fund and the distribution of this document in the United Kingdom is accordingly restricted by law. Shares in the fund are not available for sale in any state or
jurisdiction in which such sale would be prohibited. Please note, the fund has not been registered, nor will be registered, under the U.S. Investment Company Act of 1940, as amended,
or the Securities Act of 1933, as amended, and may not be sold directly or indirectly in the U.S. or to a US person.
• The information and opinions contained in this document are for background purposes only and do not purport to be full or complete. No reliance may be placed for any purpose on the
information or opinions contained in this document or their accuracy or completeness. No representation, warranty or undertaking, express or implied, is given as to the accuracy or
completeness of the information or opinions contained in this document by Armajaro Asset Management LLP or its members or employees and no liability is accepted by such persons
for the accuracy or completeness of any such information or opinions. The contents including details of any research, investment strategies and any bespoke financial products are
confidential to the person to whom it is delivered and should not be copied, distributed, or disclosed, in whole or in part, to any other person without our prior consent. Past
performance is not indicative of future performance.
• This document does not constitute or form part of any offer to issue or sell, or any solicitation of any offer to subscribe or purchase, any Shares nor shall it or the fact of its distribution
form the basis of, or be relied on in connection with, any contract therefore. Recipients of this document who intend to apply for Shares following publication of the prospectus by the
Fund are reminded that any such application may be made solely on the basis of the information and opinions contained in the prospectus which may be different from the information
and opinions contained in this document.
• In the United Kingdom this document is issued and approved by Armajaro Asset Management LLP (authorised and regulated by the Financial Services Authority and registered with the
U.S. Securities and Exchange Commission (SEC) as an investment adviser under the Investment Advisers Act of 1940), 16 Charles Street, London, W1J 5DS. The fund is not regulated
under the Financial Services and Markets Act 2000 (the Act) and consequently no protection is provided by the UK regulatory system. Similarly, benefits available under the UK Financial
Services Compensation Scheme do not apply. This document is only intended for distribution to persons permitted to receive it by Section 238 of the Act and is intended for distribution
to Professional Clients
• The views expressed are those of the manager at the time of publication and are subject to change.
Page 2
All data as at 30 March 2012 unless otherwise stated.
March 15
SUMMARY
• Background to the 2020 projection
• Existing state of cocoa macro research
• Demand Prognosis
• Supply Developments
• Conclusion
Page 3March 15

Page 4
2020 S&D Picture – Headlines in November 2014
* ICCO statement 21st November 2014March 15
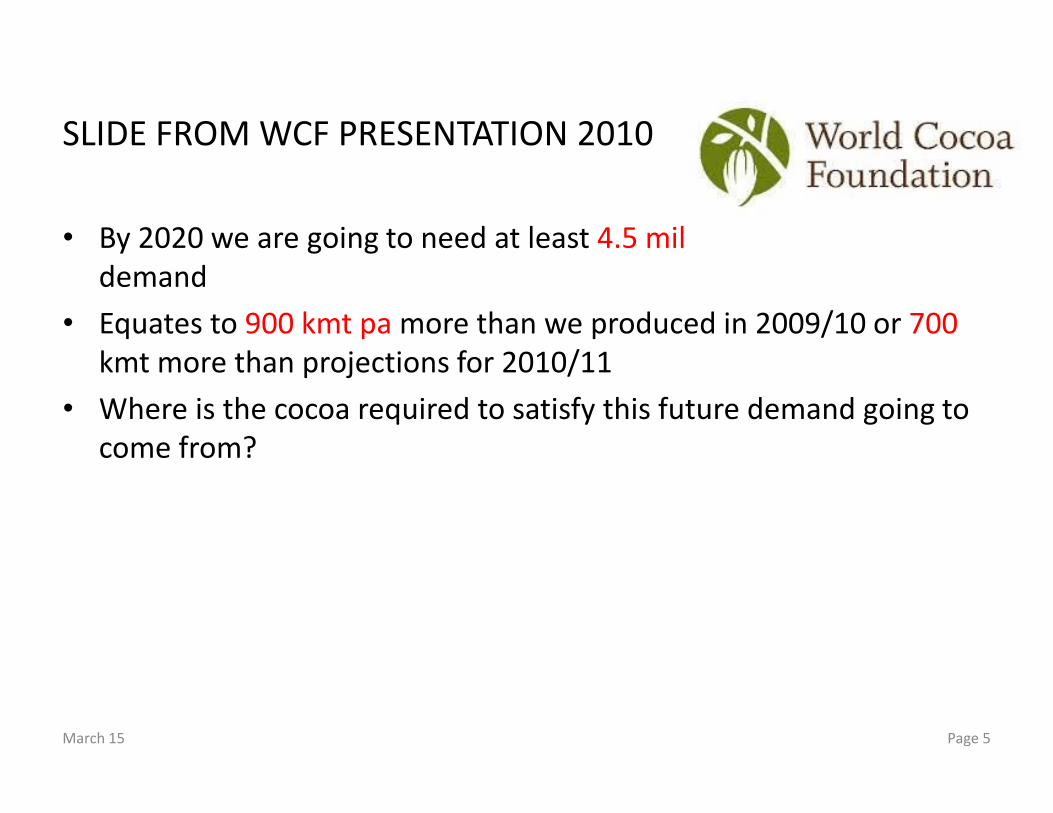
SLIDE FROM WCF PRESENTATION 2010
• By 2020 we are going to need at least 4.5 mil tons pa to satisfy
demand
• Equates to 900 kmt pa more than we produced in 2009/10 or 700
kmt more than projections for 2010/11
• Where is the cocoa required to satisfy this future demand going to
come from?
Page 5March 15

Global Macro Cocoa Resources
• Definition – research directed to estimating the size and trend of global cocoa production, demand and stocks and by extension, price
• Key producers lack the financial resources to conduct an inventory of the area under cocoa , planting density, age profile of trees etc
• No major governmental organization like FAO has done so because not considered a “strategic” food
• ICCO produce the best production /stocks info in the public domain but this is essentially backward-looking research. No pod counting. Have to accept numbers provided by members.
• The cocoa industry now spends millions on sustainability conferences and programs ,has mapped the cocoa genome etc yet has spent little on conducting an inventory of global cocoa resources from which to derive a baseline for any forward planning.
• Only 11 companies conduct their own field forecasting exercises. TOTAL trade and industry spending on original raw research likely to be between $15 - 20 M/pa.
Page 6March 15
What people should have known is that Supply and
Demand in Cocoa are Self-Correcting
• This is because there is no direct substitute for cocoa
• It’s a tree crop which takes 3 years from planting to production
• Signals to increase production are conveyed by higher prices
• However if prices rise too steeply or rapidly there is demand
destruction until the supply becomes adequate again
• These tensions maintain the market in approx.balance
• Similar to coffee, citrus, livestock, dairy and minerals
• Different to annual crops like grain which also grow in 2
hemispheres giving a lead time of just 6 months
March 15 7

• Demand Picture in 2020
Page 8
Demand
March 15
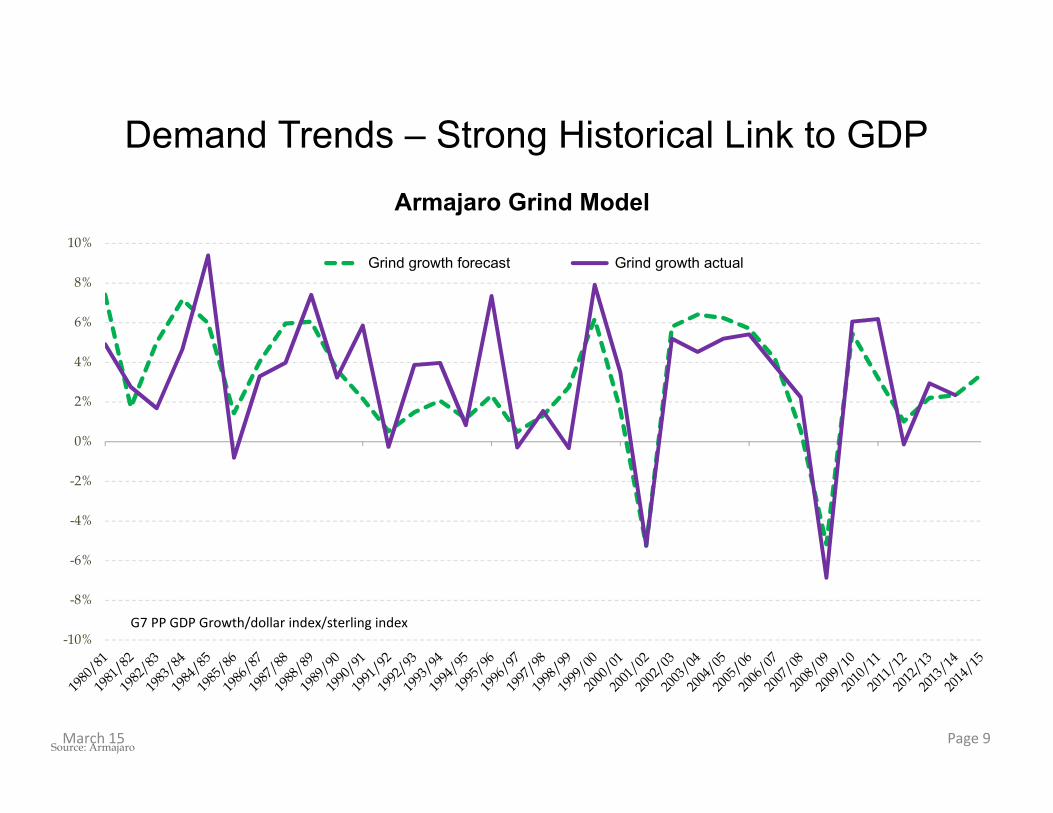
Demand Trends – Strong Historical Link to GDP
Page 9
-10%
-8%
-6%
-4%
-2%
0%
2%
4%
6%
8%
10%
Armajaro Grind Model
Grind growth forecast Grind growth actual
G7 PP GDP Growth/dollar index/sterling index
Source: Armajaro March 15

Demand Trends – Strong Link to Macro Factors
Page 10
60
65
70
75
80
85
90
3400
3500
3600
3700
3800
3900
4000
4100
4200
2005 2006 2007 2008 2009 2010 2011 2012 2013
Cocoa Grind Vs US New Car Sales
Cocoa Grind New Car Sales
40
42
44
46
48
50
52
54
56
58
60
3400
3500
3600
3700
3800
3900
4000
4100
4200
2005 2006 2007 2008 2009 2010 2011 2012 2013
Cocoa Grind VS Chicago PMI Index
Cocoa Grind PMI Index
2,000
2,500
3,000
3,500
4,000
4,500
20,000
25,000
30,000
35,000
40,000
45,000
50,000
1990 1992 1994 1996 1998 2000 2002 2004 2006 2008 2010 2012
Billions
Grind Vs Global GDP
Grindings Global GDP (Constant 2000 US$)
• Well-established demand trends have
maintained their relationships over decades
Source: Armajaro/World Bank/IMF March 15

Annual Growth in Grind per annum
-8%
-6%
-4%
-2%
0%
2%
4%
6%
8%
10%
12%
Page 11Source: Armajaro
March 15

Processing Margins
Page 12
-£400
-£300
-£200
-£100
£0
£100
£200
£300
£400
Hamburg pressing Nigeria pressing Ghana mid pressing Ghana main pressing CDI pressing
Source: Armajaro DataMarch 15

Demand in 2020
Page 13
[VALUE]
0
500
1,000
1,500
2,000
2,500
3,000
3,500
4,000
4,500
5,000
1980
1981
1982
1983
1984
1985
1986
1987
1988
1989
1990
1991
1992
1993
1994
1995
1996
1997
1998
1999
2000
2001
2002
2003
2004
2005
2006
2007
2008
2009
2010
2011
2012
2013
2014
2015
2016
2017
2018
2019
2020
000s Tonnes
Global Grind – Linear Trend Approx 2% p.a.
Dot-com bubble/subprime
mortgage crisis
Global financial crisis
= Forecast
Source: ArmajaroMarch 15

Apparent Consumption in 2020
Page 14
[VALUE]
0
500
1000
1500
2000
2500
3000
3500
4000
4500
5000
96/9797/9898/9999/0000/0101/0202/0303/0404/0505/0606/0707/0808/0909/1010/1111/1212/1313/1414/1515/1616/1717/1818/1919/20
000’s Tonnes
Developed Developing
Source: ICCO/ArmajaroMarch 15

• Supply Outlook
Page 15
PRODUCTION
March 15

Summary of Demand
• Instead of linear analysis of global demand – to project further forward it is
necessary to split developed and developing country trends.
• Developed countries consumption has grown at an average rate of 1.6% over the
last 20 years.
• Developing countries have been growing faster, at 4.3%.
• Developing economies will consume 35% of production in 2020
• Grind forecasted to rise by 940 kmt between 2010 and 2020 to 4582kmt.
• Using different trends for developed and developing countries, consumption is
projected to rise by just over 1mmt to 4609kmt in the 19/20 season.
Page 16March 15

Global Cocoa Production 1984-2015
Page 17
1000
1500
2000
2500
3000
3500
4000
4500
000’s tonnes
Global Production
Linear (Global Production)
Previous High/Ceiling?
4320k tonnes
Source: ArmajaroMarch 15
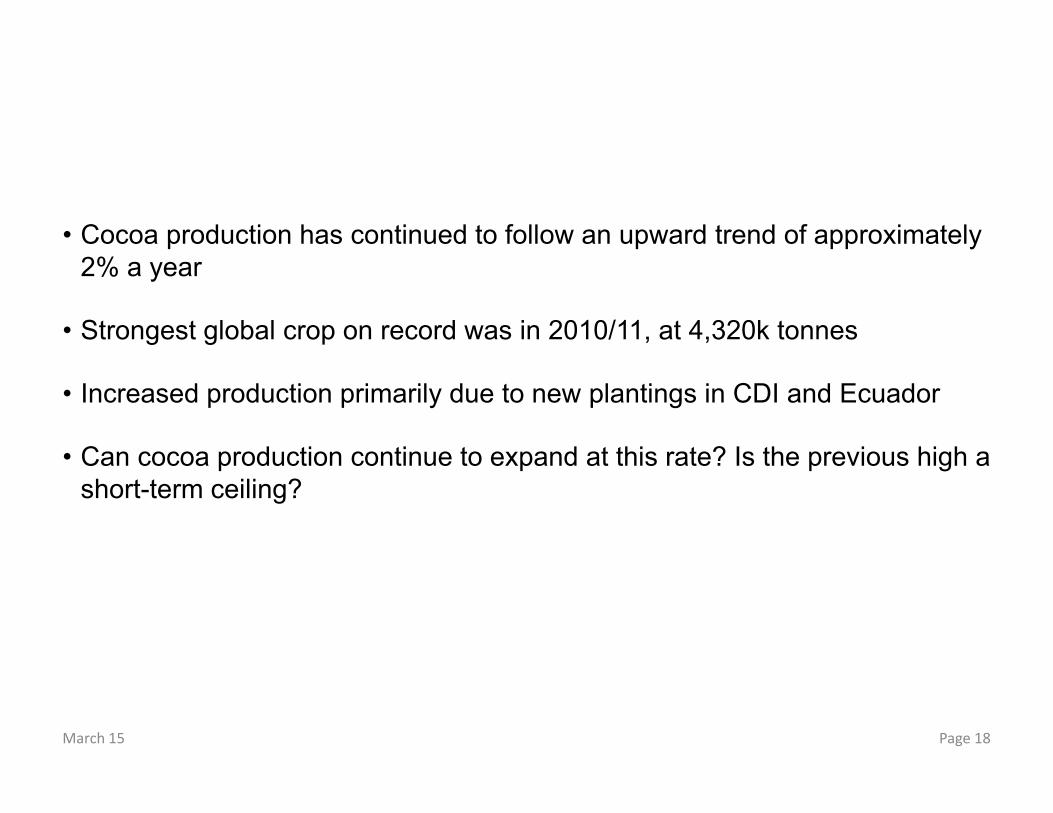
• Cocoa production has continued to follow an upward trend of approximately
2% a year
• Strongest global crop on record was in 2010/11, at 4,320k tonnes
• Increased production primarily due to new plantings in CDI and Ecuador
• Can cocoa production continue to expand at this rate? Is the previous high a
short-term ceiling?
Page 18March 15

Production Trends by Continent
Page 19
0
500
1000
1500
2000
2500
3000
3500
4000
000’s tonnes
Africa South & Central America Asia
= ForecastMarch 15
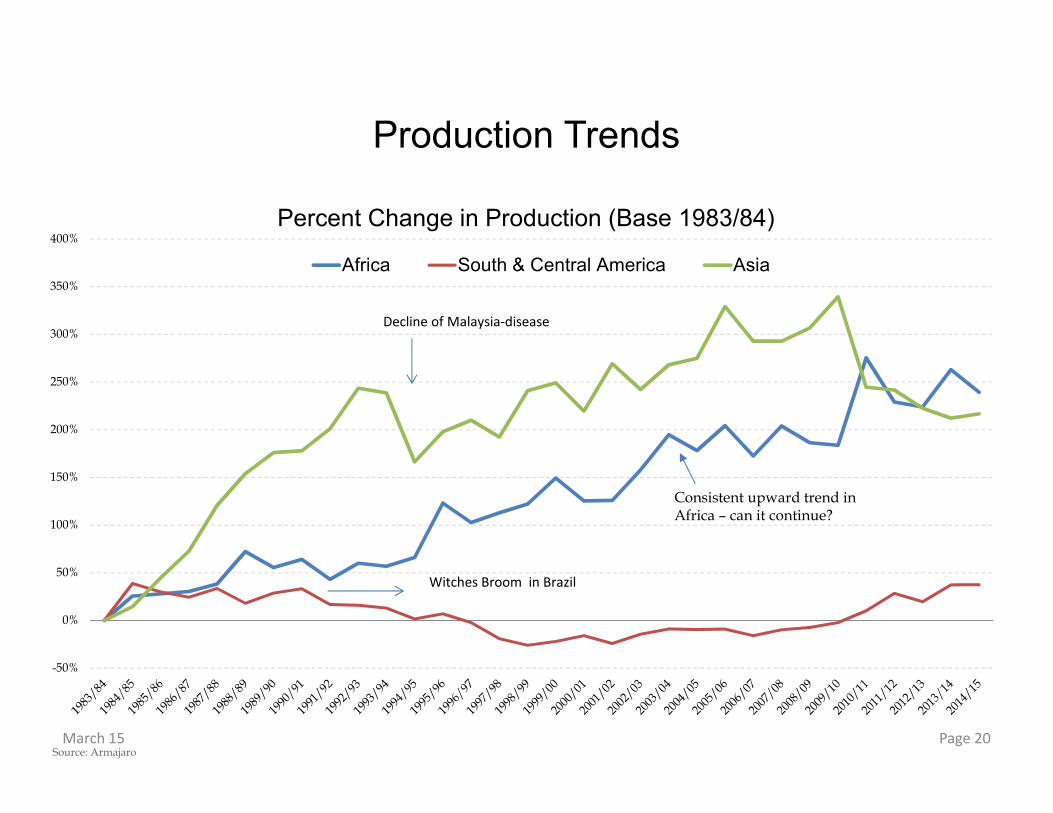
Production Trends
Page 20
Consistent upward trend in Africa – can it continue?
-50%
0%
50%
100%
150%
200%
250%
300%
350%
400%
Percent Change in Production (Base 1983/84)
Africa South & Central America Asia
Decline of Malaysia-disease
Witches Broom in Brazil
Source: ArmajaroMarch 15

Production Trends – Major Origins
Page 21
0
200
400
600
800
1000
1200
1400
1600
1800
2000
000’s tonnes
Ghana Côte d'Ivoire Brazil Ecuador Indonesia
Source: ArmajaroMarch 15

Futures Prices – Performance Since March 2010
Page 22
-50%
-30%
-10%
10%
30%
50%
70%
90%
110%
130%
150%Palm Oil Rubber Orange Juice Rice Cotton Cocoa
Only cocoa has higher
futures prices in Jan 2015
compared to 5 years ago
but marginal
Source: ReutersMarch 15

Page 23
Farm gate Prices
500
1,000
1,500
2,000
2,500
3,000
3,500
4,000
Oct06
Jan07
Apr07
Jul07
Oct07
Jan08
Apr08
Jul08
Oct08
Jan09
Apr09
Jul09
Oct09
Jan10
Apr10
Jul10
Oct10
Jan11
Apr11
Jul11
Oct11
Jan12
Apr12
Jul12
Oct12
Jan13
Apr13
Jul13
Oct13
Jan14
Apr14
Jul14
Oct14
USD/Tonne
C. D'IVOIRE GHANA BRAZIL INDONESIA ECUADOR
March 15

• 1. Indonesia
Page 24March 15

• Indonesia remains 3rd largest cocoa producer, but trend is downwards as farmers move into palm oil and rubber
• Farmers have grappled with diseases and aging trees
• Small plot size
• Production has dropped for 6 consecutive years
• Farmers have the ability to modernize their farms
• Prices are good and closely track the world market
• But competing economy activities are the risk to cocoa
25March 15

Indonesia – Structural Downtrend or Temporary?
Page 26
0
1
2
3
4
5
6
7
1980 1985 1990 1995 2000 2005 2010
Millions Acres
Acreage
Cocoa, beans Oil, palm fruit Rubber
0
5000
10000
15000
20000
25000
30000
35000
40000
1980 1985 1990 1995 2000 2005 2010
000’s tonnes
Palm Oil Production
0
100
200
300
400
500
600
1980 1985 1990 1995 2000 2005 2010
000’s tonnes
Cocoa Production
Source: Armajaro Data/ World Bank
0.9
1.0
1.0
1.1
1.1
1.2
1.2
1990 1995 2000 2005 2010
Mil
lio
n S
q.
Km
Rainforest Area
March 15

Oil Palm
Page 27
Expansion of acreage in Indonesia
• Oil palm needs a rainforest climate – high
humidity and temperatures – therefore a lot of
plantations are established at the expense of
rainforests.
• Major importers include India, China and the
EU.
• Fundamentals are good, with demand
forecasted to increase as many developed
economies shift away from the use of trans-
fasts to healthier alternatives.
• Strong demand also coming from biofuel and
energy sectors
Source: GreenPalmMarch 15

Income Comparison
Page 28
700
720
740
760
780
800
820
840
Cocoa Coffee Rubber Oil Palm
US$ per hectare per year
Net Income Potential for Different Smallholder Crops
3-5 years 4-6 years 10+ years 3-7 yearsLag between
planting and
positive cash
flow
Sources: Indonesia, A business case for sustainable coffee productionMarch 15

• 2. South America
Page 29March 15

Brazil
• Diseases account for losses of more than 30% of the potential crop each year.
• Brazil suffered an outbreak of witches broom in the mid 90s
• Actively using CCN51 and equivalents and seeking more disease resistant/tolerant
planting material
Page 30
0
50
100
150
200
250
300
350
400
450
00
0’s
to
nn
es
Brazil Annual Production
Never recovered from witches
broom outbreak
Source: Armajaro March 15

0
50
100
150
200
250
300
2001/02 2002/03 2003/04 2004/05 2005/06 2006/07 2007/08 2008/09 2009/10 2010/11 2011/12 2012/13 2013/14 2014/15
000's tonnes
Brazil Ecuador Peru
Page 31
Production Trends – Ecuador overtakes Brazil
Source: Armajaro March 15

Ecuador and Peru
Page 32
• Compared to West Africa production
is small
• Despite this, the region likely to be
key for the future of cocoa production
by being the “model”
• Advanced techniques
• Could change the face of the cocoa
industry away from small-scale
farmers to large-scale, technological
production
• We forecast combined production will
exceed 400k mt by 2020.
2,465
300
0
500
1000
1500
2000
2500
3000
2014/15
000’s tonnes
Production in 2014/15
Peru & Ecuador
Ivory & Ghana
Source: Armajaro March 15

Why Ecuador?
• Use of CCN51 has revolutionized the cultivation of cocoa
• Yields of 2-2.5 mt /ha the “norm” for large scale plantations
• But not just for big farms
• Small holders can get 1mt quite handily
• Disease tolerant – rebounds much faster than Nacional
• Dedication and enthusiasm of farmers has persisted
• Ecuador has now created a “high tech farming cluster” with
cocoa a key part
• Propagation of good planting material
March 15 33

• Multiple and experimental irrigation systems
• Sophisticated use of chemicals/fertilizers
• Innovative planting patterns to permit mechanization
• Continuous development of post-harvest practices to improve
flavour profile
34March 15

• Ecuador farmers have done this for themselves DESPITE their government
• Government discouraged use of CCN51
• Their continued promotion of low yielding Nacional effectively commits farmers to poverty
• No evidence that large scale industry is prepared to pay an equalizing price for Nacional
• Chocolate industry have been complicit – complaining about flavour while they should have been finding ways to use CCN beans
• Nacional and CCN now effectively trading at “par”
• Production would have been far higher if they had got on board sooner
35March 15

• 3. West Africa
Page 36March 15

Production Trends – Ghana & Côte d'Ivoire
Page 37
-600
-400
-200
0
200
400
600
800
1000
1200
35%
40%
45%
50%
55%
60%
65%
(Ghan
a & Côte d'Ivoire) –Rest of W
orld Crop
% of World Crop
Combined production from Ghana
& Ivory overtook the rest of the
world in 1995/96. This trend has
increased ever since.
60% of total crop threshold
Source: Armajaro March 15

Land Competition between Crops 1980-2013
Page 38
0.0
0.5
1.0
1.5
2.0
2.5
1980 1985 1990 1995 2000 2005 2010
Million A
cres
Ghana
Cocoa beans Maize Oil palm fruit Rice, paddy
Source: FAO Stat
0
0.5
1
1.5
2
2.5
3
1980 1985 1990 1995 2000 2005 2010Million A
cres
Côte d'Ivoire
Cocoa beans Coffee, green Maize
Oil palm fruit Rice Natural rubber
• No indication of significant land loss to other crops
• Farmers traditionally grow different crops to diversify income sources
• Familiarity of cocoa and fixed prices provide incentives compared to competing crops
• Whilst yields are stable/marginally increased over the years, production rises have been due to new plantings.
March 15

Production Trends – Ghana/Côte d'Ivoire
Page 39
0
200
400
600
800
1000
1200
1400
1600
1800
2000
000’s mts
Ghana Côte d'Ivoire
Market fears CI was in a
topping out phase
Structural downtrend or
temporary blip?
Source: Armajaro
Dotted Line = Since last conference
= forecast
March 15

Reasons Behind Big Crops of 2010-11
• 2010/11 combined CDI/Ghana crops remain the record
• Optimal weather – abundant rainfall and crucially temps 2-3 degrees above
normal (correlation in trend in both countries)
CDI
• Post-election political struggles boosted prices
• Super efficient harvesting in CDI – might be the last harvest?
• Farmers stayed on the farm to keep a low profile
• Converted everything to cash in case they had to leave
GHANA
• Ghana farmers just given a big price increase
Page 40March 15
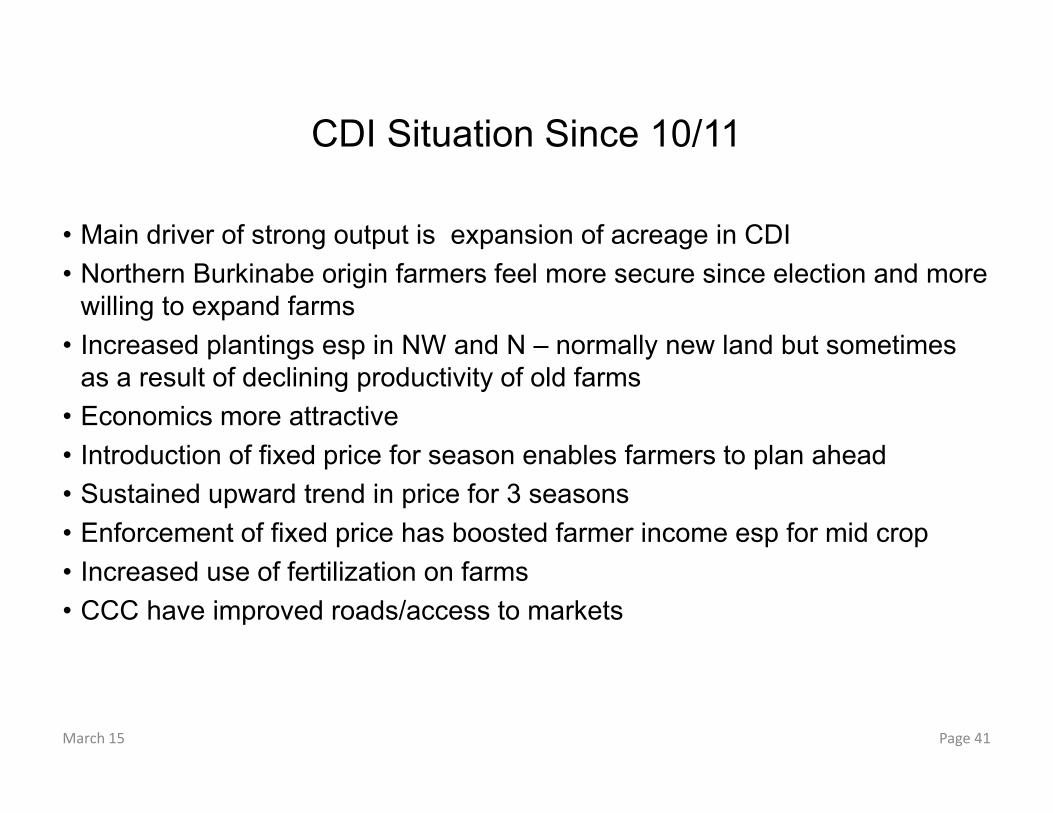
CDI Situation Since 10/11
• Main driver of strong output is expansion of acreage in CDI
• Northern Burkinabe origin farmers feel more secure since election and more
willing to expand farms
• Increased plantings esp in NW and N – normally new land but sometimes
as a result of declining productivity of old farms
• Economics more attractive
• Introduction of fixed price for season enables farmers to plan ahead
• Sustained upward trend in price for 3 seasons
• Enforcement of fixed price has boosted farmer income esp for mid crop
• Increased use of fertilization on farms
• CCC have improved roads/access to markets
Page 41March 15
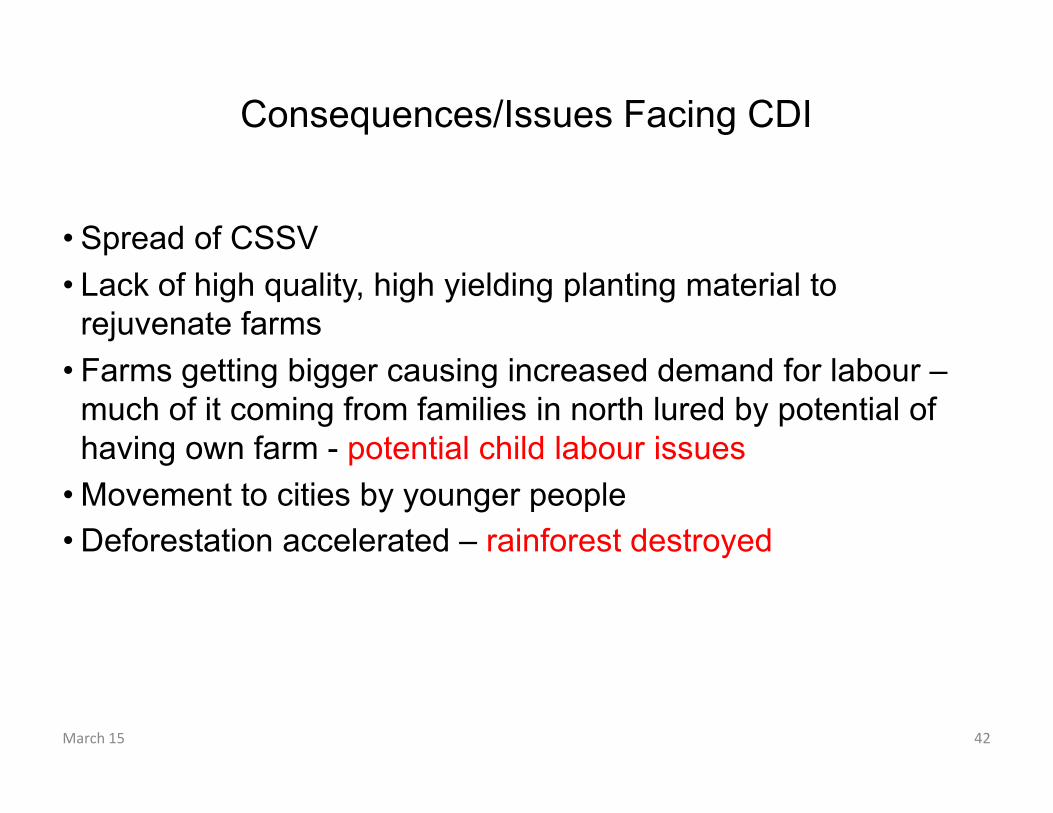
Consequences/Issues Facing CDI
• Spread of CSSV
• Lack of high quality, high yielding planting material to
rejuvenate farms
• Farms getting bigger causing increased demand for labour –
much of it coming from families in north lured by potential of
having own farm - potential child labour issues
• Movement to cities by younger people
• Deforestation accelerated – rainforest destroyed
42March 15
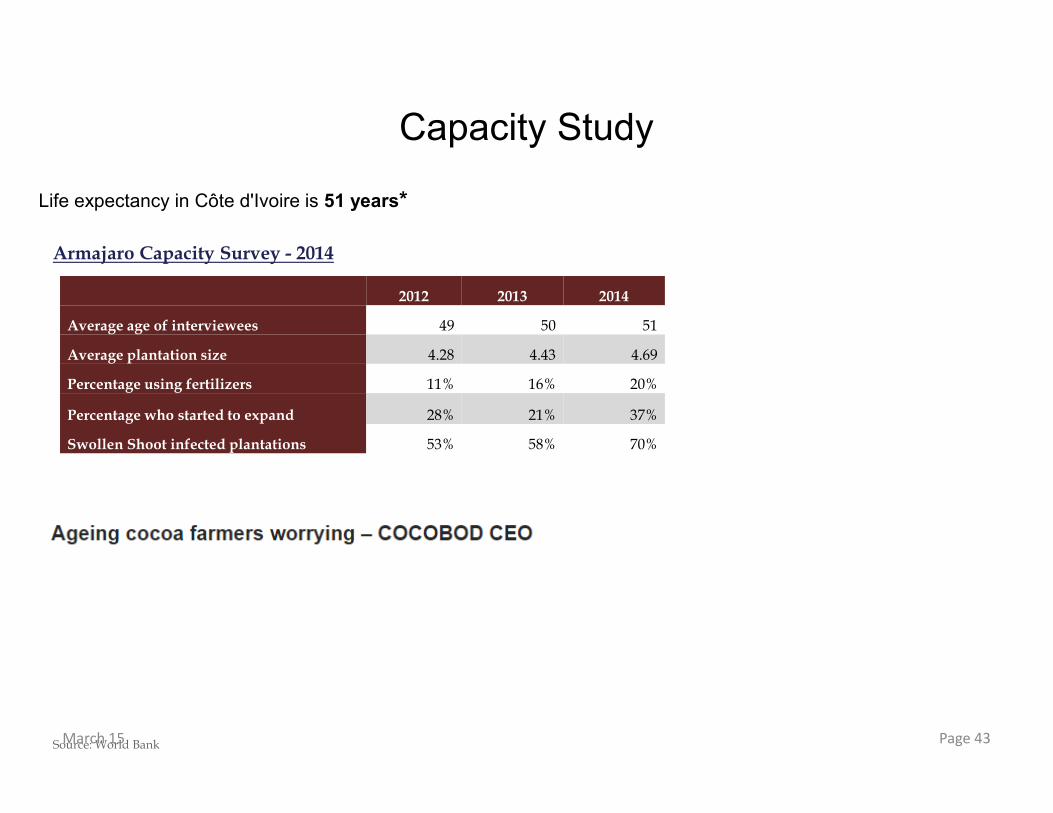
Capacity Study
Page 43
Life expectancy in Côte d'Ivoire is 51 years*
Source: World Bank
2012 2013 2014
Average age of interviewees 49 50 51
Average plantation size 4.28 4.43 4.69
Percentage using fertilizers 11% 16% 20%
Percentage who started to expand 28% 21% 37%
Swollen Shoot infected plantations 53% 58% 70%
Armajaro Capacity Survey - 2014
March 15
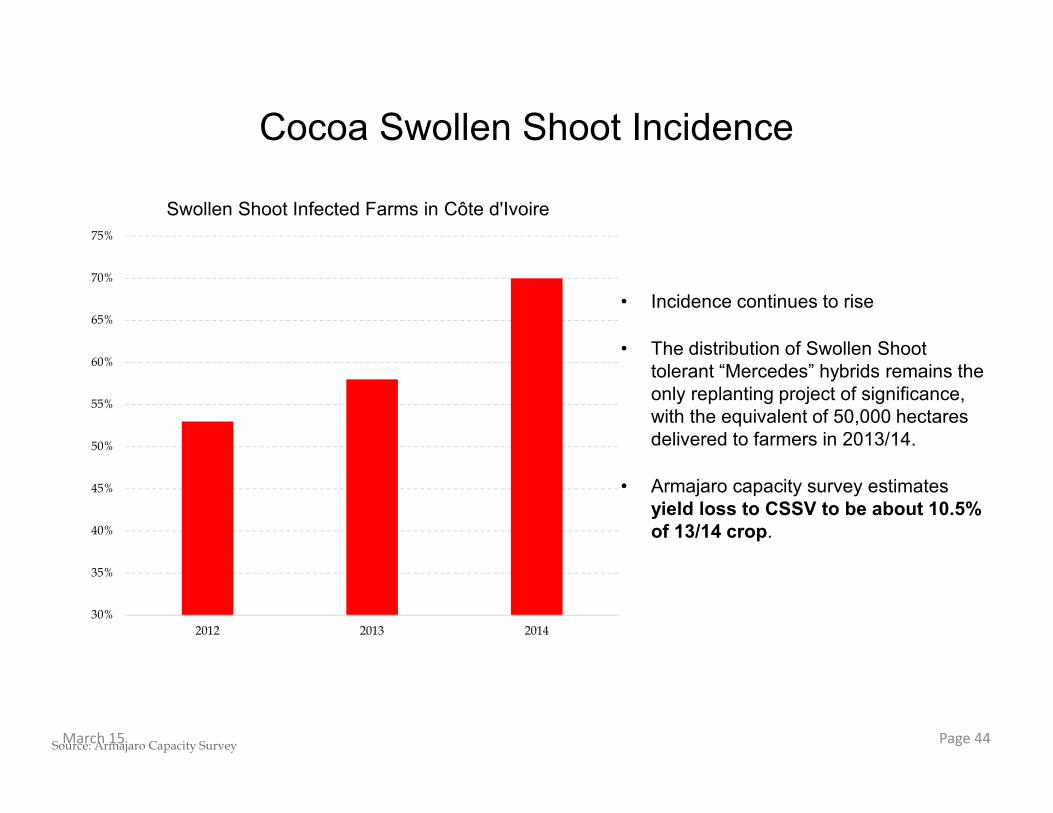
Cocoa Swollen Shoot Incidence
Page 44
30%
35%
40%
45%
50%
55%
60%
65%
70%
75%
2012 2013 2014
Swollen Shoot Infected Farms in Côte d'Ivoire
Source: Armajaro Capacity Survey
• Incidence continues to rise
• The distribution of Swollen Shoot
tolerant “Mercedes” hybrids remains the
only replanting project of significance,
with the equivalent of 50,000 hectares
delivered to farmers in 2013/14.
• Armajaro capacity survey estimates
yield loss to CSSV to be about 10.5% of 13/14 crop.
March 15
Page 45March 15

46March 15

Côte d'Ivoire – Employment in Agriculture
Page 47
10%
20%
30%
40%
50%
60%
70%
1990 1991 1992 1993 1994 1995 1996 1997 1998 1999 2000 2001 2002 2003 2004 2005 2006 2007 2008 2009 2010 2011 2012 2013
Population (Millions)
Source: IMF
% of Total Employment)
March 15
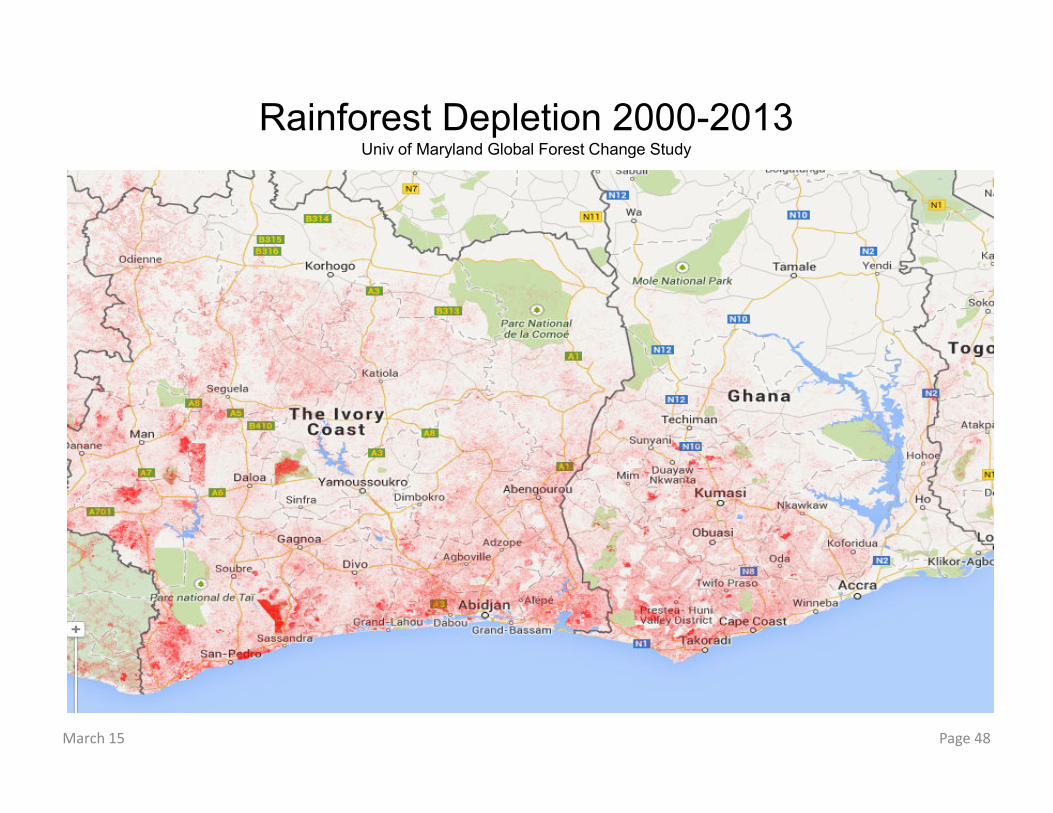
Rainforest Depletion 2000-2013Univ of Maryland Global Forest Change Study
Page 48March 15

Page 49March 15

Ghana Situation Since 10/11
• Farmer price stalled as government spending caused budget deficit
• CMC cut back on fertilizer and mass spraying programs
• Oil economy
• Rural migration esp of young
• Alternative land use (see previous) opportunities esp in gold mining
Page 50March 15

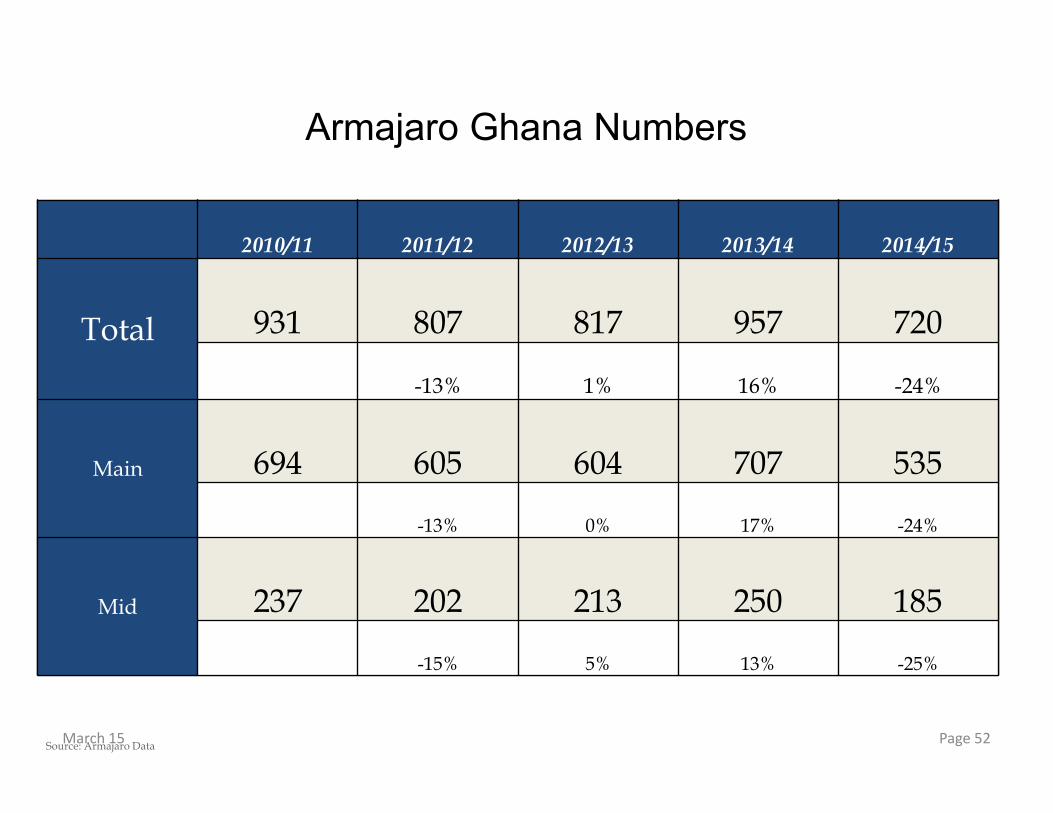
Ghana Problem - Crop 2014/15
• Unexpected collapse in crop for 14/15
• But not seen in our pod counts
• 13/14 crop boosted by reduction in normal end season hoarding
• Knock-on effect of weaker start to 14/15
• No weather issues-good rains, harmattan only hit in late Dec/early Jan
• No abnormal disease issues
• Fertilizer distribution was delayed but impact should be expressed in pod
load/survival
• Likely drop from c950 kmt to 700/750
• An unprecedented drop of 24%
• One-off or structural change?
• How so sudden?
Page 51March 15
Page 52
Armajaro Ghana Numbers
2010/11 2011/12 2012/13 2013/14 2014/15
Total 931 807 817 957 720
-13% 1% 16% -24%
Main 694 605 604 707 535
-13% 0% 17% -24%
Mid 237 202 213 250 185
-15% 5% 13% -25%
Source: Armajaro DataMarch 15

Nigeria Cocoa & Oil Production
Page 53
0
500
1000
1500
2000
2500
3000
50
100
150
200
250
300
350
m. B
arrels
000's tonnes
Cocoa Oil
Source: Armajaro/Energy Information AdministrationMarch 15
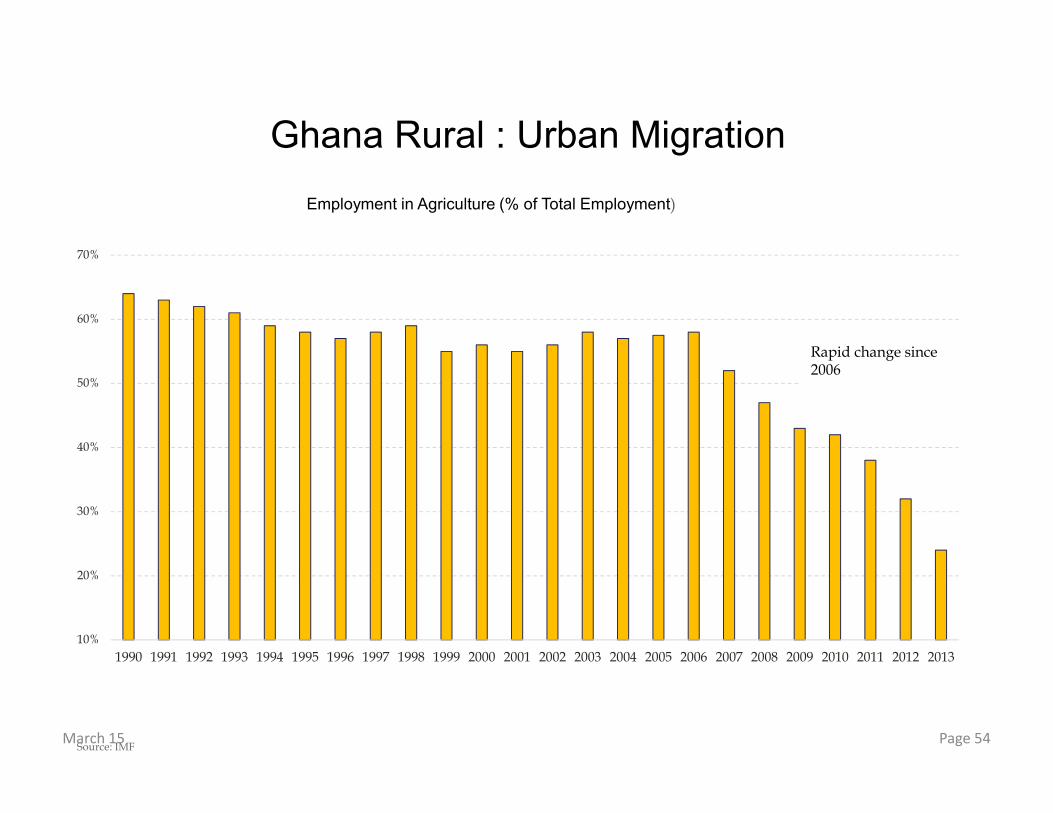
Ghana Rural : Urban Migration
Page 54
10%
20%
30%
40%
50%
60%
70%
1990 1991 1992 1993 1994 1995 1996 1997 1998 1999 2000 2001 2002 2003 2004 2005 2006 2007 2008 2009 2010 2011 2012 2013
Employment in Agriculture (% of Total Employment)
Source: IMF
Rapid change since 2006
March 15

-
20,000
40,000
60,000
80,000
100,000
120,000
140,000
Cocoa Farmer* Minimum Salary Operations Manager Project Manager Professor Fuel Handler
GHC/Year
Average Annual Salary in Ghana (GHC/year)
Page 55
Urban Migration – Why the move?
*Assumptions: 5 hectares with yield of 400kg/ha.
Note: Purely income from cocoa. most farmers will gain income from other crops
March 15

Gold – Photo from Trek September 2014
Page 56March 15

Page 57
Infrared Imagery: Near Bogoso
Source: Cranfield UniversityMarch 15

Google Earth – Near Bogoso in Western Region
Before: 2011
Page 58Source: Armajaro
Distance = 7km
March 15

Page 59
Google Earth – After: 2014
Source: ArmajaroMarch 15

Page 60
24th April 2013 - Eastern Region, close to Armajaro sites in Jejeti and Asafo
Gold – Google Earth Images: BEFORE
Source: Google EarthMarch 15
Page 61
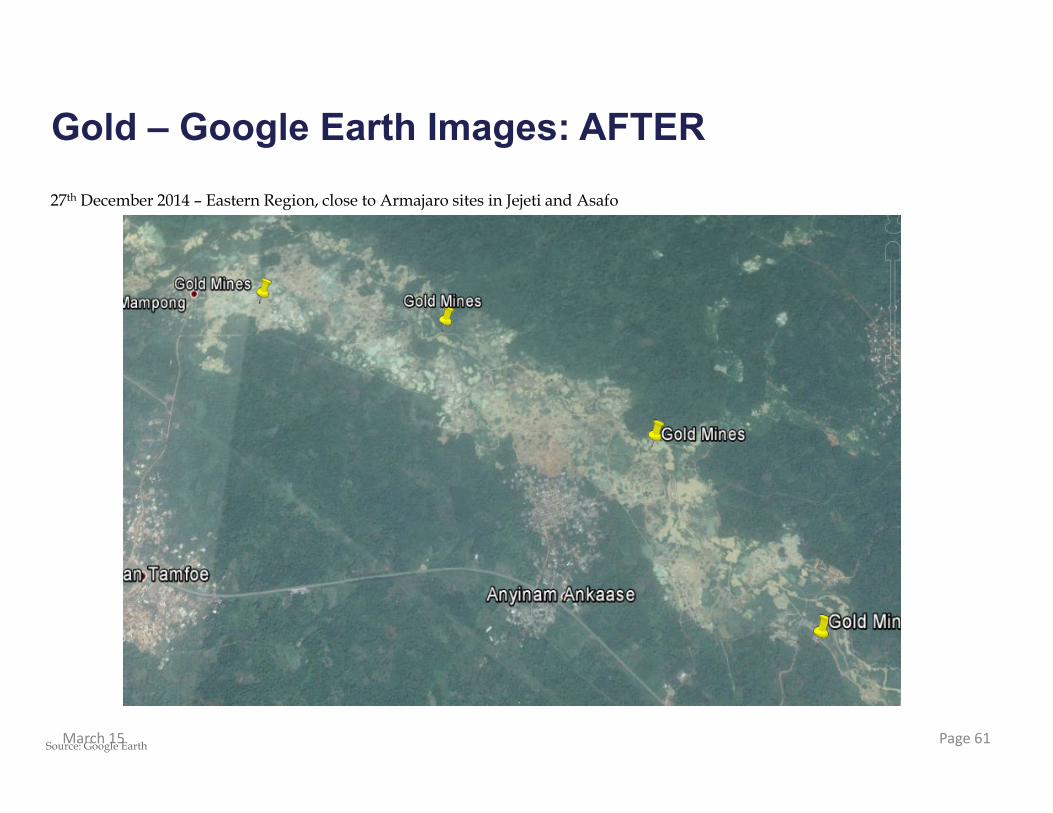
27th December 2014 – Eastern Region, close to Armajaro sites in Jejeti and Asafo
Gold – Google Earth Images: AFTER
Source: Google EarthMarch 15

Page 62
A closer look at the damage
Source: Google EarthMarch 15

Page 63
Gold – Google Earth Images: BEFORE
1st January 2012
Armajaro Crop Survey Site: Near Kotokuom
Source: Google EarthMarch 15
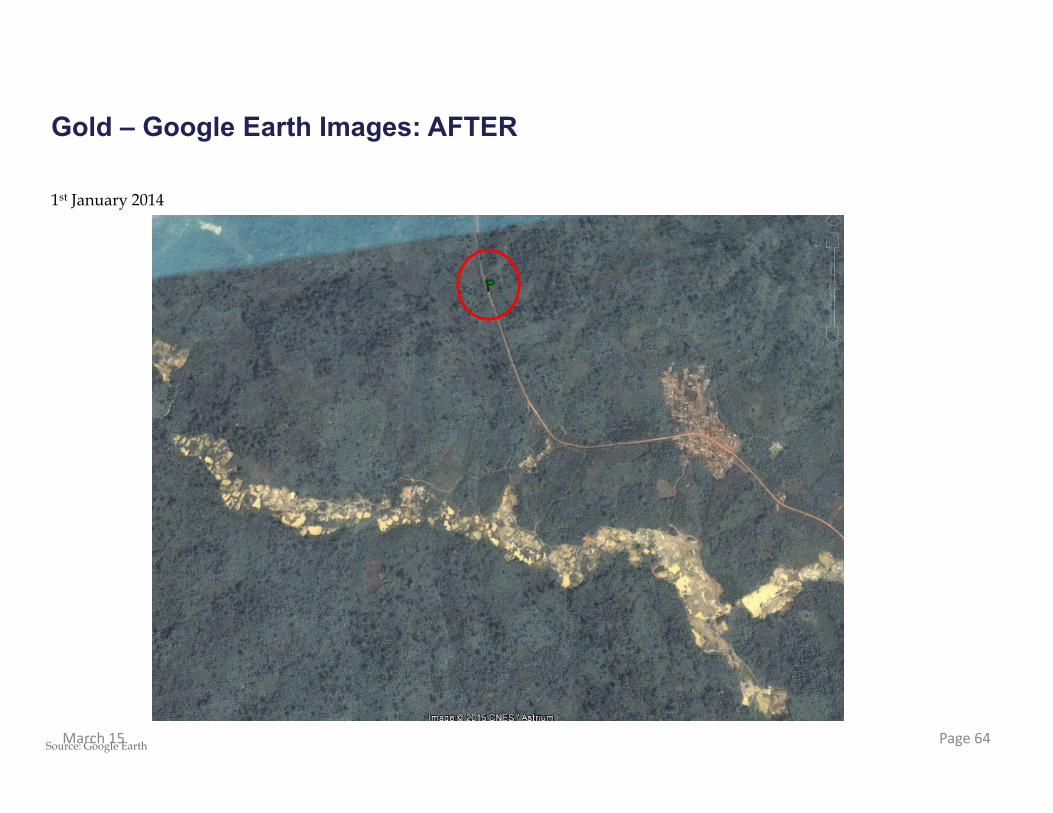
Page 64
1st January 2014
Gold – Google Earth Images: AFTER
Source: Google EarthMarch 15
Page 65
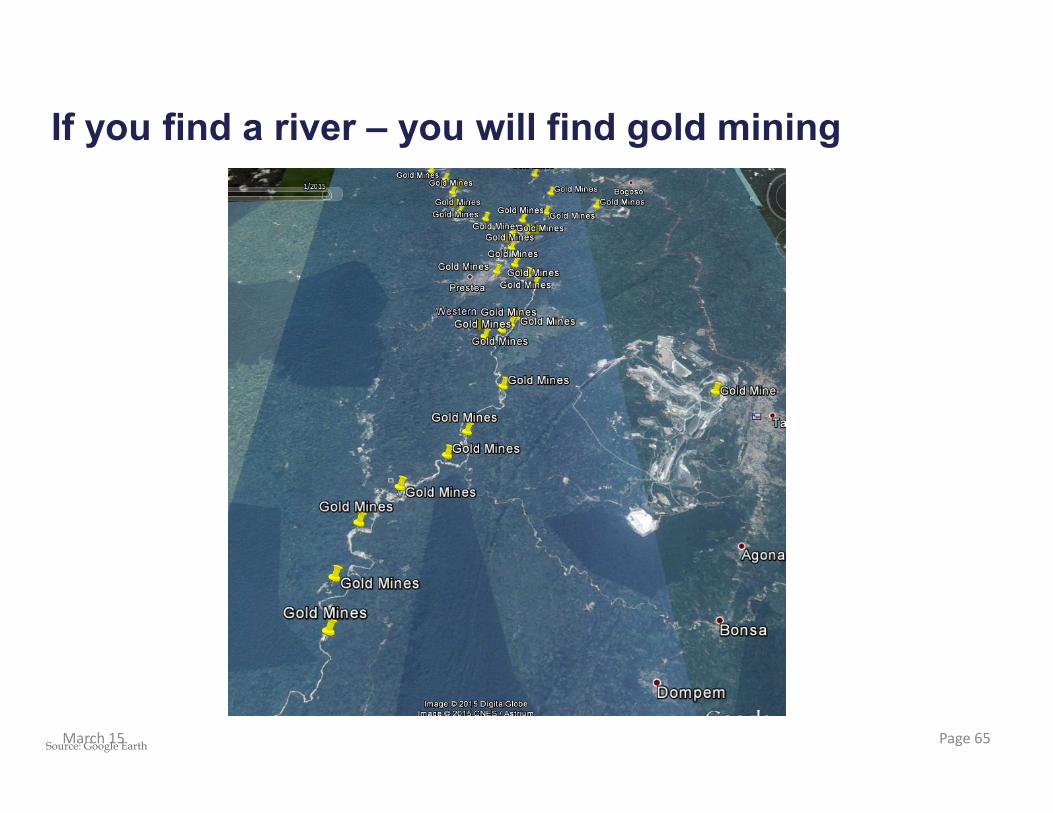
If you find a river – you will find gold mining
Source: Google EarthMarch 15

Page 66
Gold: Competition or Complement?
Intercropping agricultural crops is common and helps diversify farmer income
However, Gold is a different proposition and threatens production in new way
• Toxic chemicals (cyanide and mercury) destroy the soil
• Water pollution
• Cocoa land used for gold mining
• Farmers abandoning farms to mine gold
• Farmers selling their farms to mining firms
• Farmers unable to get workers required during harvest season as they
can earn more in mines
March 15

A number of academic studies have taken place on the impact of gold mining on agriculture.
Key findings are:
1. Hilson & Garthford study in 2014 – gold generates benefits for some individual farmers (via
income), these benefits are outweighed by aggregate costs of small-scale mining activities in
terms of collective loss of agricultural lands and water pollution
2. Aragon & Rud 2013 – Gold mining in Ghana reduces agricultural output in nearby farms by
40%.
3. In the case of Ghana, there is substantial evidence, ranging from anecdotal to scientic, that
gold mining is associated with high levels of pollution and loss of agricultural livelihoods
(Human Rights Clinic, 2010; Akabzaa, 2009; Aryeetey et al., 2007; Hilson and Yakovleva, 2007)
Page 67
Gold: Academic Studies
March 15
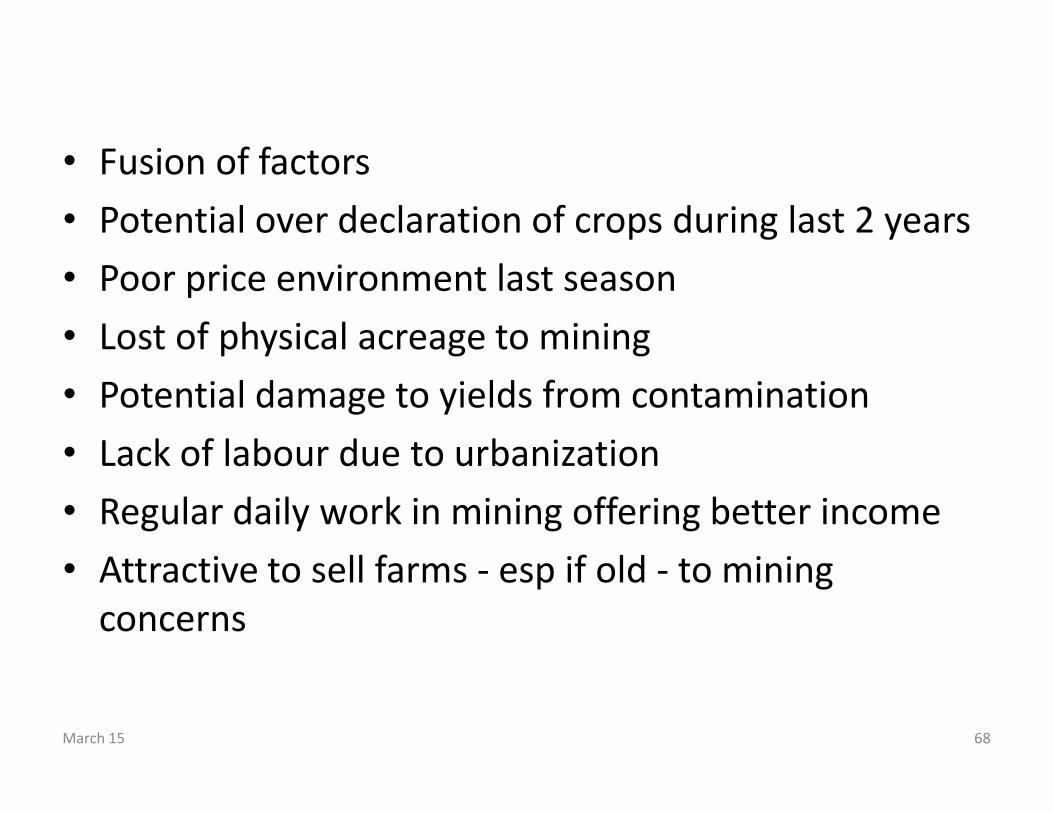
• Fusion of factors
• Potential over declaration of crops during last 2 years
• Poor price environment last season
• Lost of physical acreage to mining
• Potential damage to yields from contamination
• Lack of labour due to urbanization
• Regular daily work in mining offering better income
• Attractive to sell farms - esp if old - to mining
concerns
March 15 68

Will it last?
• Unclear on causes but confident current crop is sharply lower
• Observed transfer of land to mining
• Not reversible
• Rivers polluted
• Soil contaminated
• Demographics of farmers suggest rebound unlikely and trend
might continue
• Loss of growth potential from the most reliable supplier
March 15 69
• Conclusion
Page 70March 15

Page 71
S&D Balance
Source: Armajaro Data
-400
-200
0
200
400
600
800
1,000
0
500
1000
1500
2000
2500
3000
3500
4000
4500
5000
Balance Production Grindings
March 15

Page 72
S&D Potential Picture in 2020
2500
3000
3500
4000
4500
5000
000s tonnes
Production Grindings
Source: Armajaro DataMarch 15
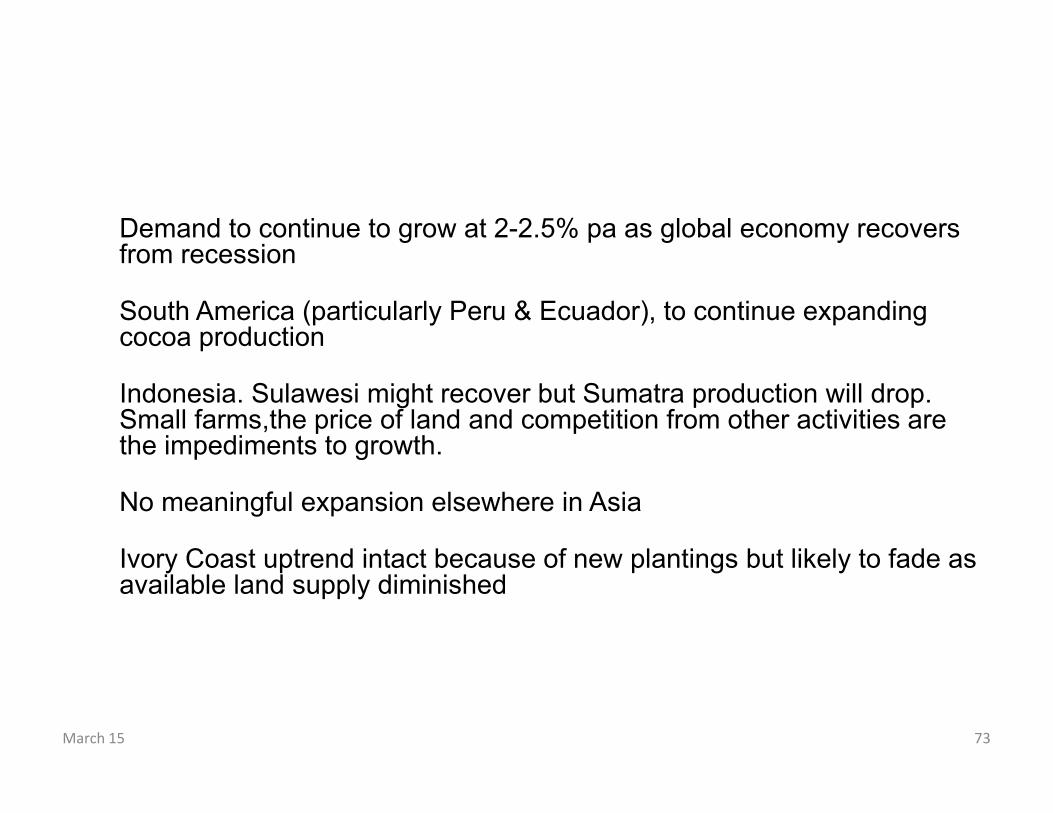
Demand to continue to grow at 2-2.5% pa as global economy recovers from recession
South America (particularly Peru & Ecuador), to continue expanding cocoa production
Indonesia. Sulawesi might recover but Sumatra production will drop. Small farms,the price of land and competition from other activities are the impediments to growth.
No meaningful expansion elsewhere in Asia
Ivory Coast uptrend intact because of new plantings but likely to fade as available land supply diminished
March 15 73

• Ghana a huge question mark.The upward trend looks over.
• Old, decaying farms in W.Africa should be taken out of production and
converted to other land use so that attention can be given to raising
yields/income on younger, existing farms
• Industry made poor decisions , notably ignoring Ecuador , and is paying
the price with little progress in W.Africa and a lost opportunity to diversify
the geographical production base
• Higher prices are required to encourage production and attract younger
farmers
March 15 74

Page 75Source: Armajaro
S&D Balance
2012/13 % +/- 2013/14 % +/- 2014/15 % +/-
NET PRODUCTION 3,853 -3% 4,245 10% 4,051 -5%
GRINDINGS 4,051 3% 4,150 2% 4,108 -1%
Surplus / Deficit -198 95 -57
BALANCE

Global Balance 2012/13-2014/15
March 15 76
-198
95
-57
-250
-200
-150
-100
-50
0
50
100
150
2012/13 2013/14 2014/15
000's tonnes

Short-term Factors
• Immediate political risks high in Nigeria and potentially rising
in Cote d’Ivoire
• Weather has been benign for several years but some risk
ahead eg El Nino especially for Ecuador
• Unanswered questions about Ghana’s futures
• Demand growth rebound in 15/16 after a poor year
• Deficit this year and next a high probability
March 15 77

WCF PRESENTATION 2010
• Cocoa is a unique product
• It requires harvesting by hand
• Requires multi-stage post-harvest handling
• Approx 25000 pods have to be cut open to produce 1 metric ton of
beans
• We have been spoiled as consumers benefitting from the efforts
of desperately poor people who lack alternatives
• This pool of African farmers is not enough to meet the needs of
world demand going forward
78March 15

Page 79Source: Armajaro
Weather

Page 80March 15

THANK YOU
81March 15

Appendix
82March 15

Gold: Case Study
• Artisanal and small-scale mining has emerged in communities endowed with natural
resources as a lucrative activity due to its income-generating potential
• The situation changed due to the influx of Chinese from 2006, bring expensive machinery
with them. Following a government crackdown on these illegal mines in 2012, many of the
Chinese were deported. The Ghanaians rapidly took over these mines, using the machinery
and expertise left behind
• Start-up costs are negligible (as machinery was left), and reward is instant due to daily
income
Page 83March 15
Case Study: Amansie Central District in
Ghana
• Interviews with 55 farmers – of which 14 either engage directly in mining of a household member does.
• Samuel Ofori Duodu, a cocoa farmer and miner, indicated that he earns about US$300 a month from artisanal mining
as compared to an acre of cocoa farm that generates about US$170 per harvest within a year (Interview, 13/02/2014).
• Artisanal and small-scale miners (who are not farmers and are engage exclusively in mining) capitalize on this informal
land ownership structure to seize lands often with little or no compensation to farmers. There are multiple cases
where cocoa farms have been destroyed without the free, prior and informed consent of farmers concerned.
• The Minerals and Mining Act, 2006, governs compensation payments and requires mining companies or an individual
miner to pay affected occupiers of the land (see also: Akabzaa 2000). The crude calculation used values one cocoa tree
at about 15-25 Ghana cedi's (US$10-US$15)
• Farmers complained over massive pollution of water tables. Field observations during the research revealed that
“most water sources available to farmers” have been polluted by ASM activities
Page 84March 15