millennium challenge account – mongolia monitoring and
TRANSCRIPT

MCA Mongolia Monitoring and Evaluation Plan 1
Millennium Challenge Account – Mongolia
Monitoring and Evaluation Plan
June 2021 Version 1

MCA Mongolia Monitoring and Evaluation Plan 2
TABLE OF CONTENTS
Preamble ......................................................................................................................................... 3 List of Acronyms ............................................................................................................................ 4 1. Compact and Objective Overview .......................................................................................... 5
1.1. Introduction ..................................................................................................................... 5 1.2. Program Logic ................................................................................................................ 5 1.2.1. Compact Background .................................................................................................. 5 1.2.2. Project Description and Logic .................................................................................... 7 1.2.3. Risks and Assumptions ............................................................................................. 11 1.3. Projected Economic Benefits ........................................................................................ 12 1.3.1. Water Supply Project Economic Analysis ................................................................ 13 1.3.2. Projected Program Beneficiaries ............................................................................... 13 1.3.3. Water Supply Project Beneficiary Analysis ............................................................. 15
2. Monitoring Component ......................................................................................................... 15 2.1. Summary of Monitoring Strategy ................................................................................. 15 2.2. Data Quality Reviews ................................................................................................... 16 2.3. Standard Reporting Requirements ................................................................................ 17
3. Evaluation Component .......................................................................................................... 18 3.1. Summary of Evaluation Strategy .................................................................................. 18 3.2. Specific Evaluation Plans ............................................................................................. 18 3.3. Evaluation Questions .................................................................................................... 19 3.4. Evaluation Methodology Description ........................................................................... 20 3.5. Summary of Activities or Sub-Activities without Evaluations ..................................... 20
4. Implementation and Management of M&E .......................................................................... 21 4.1 Responsibilities ............................................................................................................. 21 4.2 MCA Data Management System for Monitoring and Evaluation ................................ 22 4.3 Review and Revision of the M&E Plan ........................................................................ 23
5. M&E Budget ......................................................................................................................... 24 ANNEX I: Indicator Documentation Table .................................................................................. 25 ANNEX II: Table of Indicator Baselines and Targets .................................................................. 46 ANNEX III: M&E Plan Modifications ......................................................................................... 60

MCA Mongolia Monitoring and Evaluation Plan 3
PREAMBLE This Monitoring and Evaluation (M&E) Plan:
• is part of the action plan set out in the MILLENNIUM CHALLENGE COMPACT (Compact) signed on 27 July 2018 between the United States of America, acting through the Millennium Challenge Corporation, a United States Government corporation (MCC), and Mongolia, acting through its government;
• will support provisions described in the Compact; and • is governed by and follows the principles stipulated in the Policy for Monitoring and
Evaluation of Compacts and Threshold Programs (MCC M&E Policy). This M&E Plan is considered a binding document, and failure to comply with its stipulations could result in suspension of disbursements. It may be modified or amended as necessary following the MCC M&E Policy, and if it is consistent with the requirements of the Compact and any other relevant supplemental legal documents.

MCA Mongolia Monitoring and Evaluation Plan 4
LIST OF ACRONYMS AWPP BOH
Advanced Water Purification Plant Baigal Orchin Hamgaalal (Nature and Environmental Protection)
CBA Cost Benefit Analysis CHPP Combined Heat and Power Plant CWWTP Central Wastewater Treatment Plant CCR Compact Completion Report CRP Cost Recovery Plan DQR Data Quality Review EIF Entry Into Force ERR Economic Rate of Return ESP Environmental and Social Performance GSI Gender and Social Inclusion HQ Headquarter HUT Hereglegchded Uilchleh Tuv (Customer Service Center) ITT Indicator Tracking Table MIS Management Information System MCA-M Millennium Challenge Account-Mongolia MCC Millennium Challenge Corporation MCM Million Cubic Meter MET Ministry of Environment and Tourism MNS Mongolian National Standard MNT Mongolian Tugrug M&E Monitoring & Evaluation MUB Municipality of Ulaanbaatar NSO National Statistics Office O&M Operation and Maintenance OSNAAUG Oron Suuts Niitiin Aj Ahuin Udirdah Gazar (Ulaanbaatar Housing and Public
Utilities Authority) POC Point of Contact PMC Project Management Consultant QDRP Quarterly Disbursement Request Package SHUHA Shugamiin Us Hangamjiin Alba (Pipe-fed kiosk division of USUG) SCADA Supervisory Control and Data Acquisition TOR Terms of Reference UB Ulaanbaatar USUG Us Suvgiin Udirdakh Gazar (Ulaanbaatar Water Supply and Sewerage
Authority) WSRC Water Services Regulatory Commission ZUHA Zuuvriin Us Hangamjiin Alba (Truck-fed kiosk division of USUG)

MCA Mongolia Monitoring and Evaluation Plan 5
1. COMPACT AND OBJECTIVE OVERVIEW
1.1. Introduction This Monitoring and Evaluation Plan serves as a guide for program implementation and management, so that Millennium Challenge Account-Mongolia (MCA-M) management staff, Board of Directors, program implementers, beneficiaries, and other stakeholders understand the progress being made toward the achievement of objectives and results and are aware of variances between targets and actual achievement during implementation. This Monitoring and Evaluation Plan is a management tool that provides the following functions:
a) Describes the program logic and expected results. Gives details about what impacts the Compact and each of its components is expected to produce in economic, social, and gender areas (as relevant) and how these effects will be achieved.
b) Sets out data and reporting requirements and quality control procedures. Defines indicators, identifies data sources, frequency to define how performance and results will be measured. Outlines the flow of data and information from the project sites through to the various stakeholders both for public consumption and to inform decision-making. It describes the mechanisms that seek to assure the quality, reliability and accuracy of program performance information and data.
c) Establishes a monitoring framework. Establishes a process to alert implementers, MCA-M management, stakeholders, and MCC to whether or not the program is achieving its major milestones during program implementation and provides a basis for making program adjustments.
d) Describes the evaluation plan. Explains in detail how MCC and MCA-M will evaluate whether or not the interventions achieve their intended results and expected impacts over time.
e) Includes roles and responsibilities. Describes in detail what the M&E staff are responsible for.
1.2. Program Logic
1.2.1.Compact Background Mongolia concluded its first Millennium Challenge Compact on September 17, 2013. That compact, which was signed on October 22, 2007, and entered into force on September 17, 2008, including investments in property rights, health, vocational education, energy and environment, and transportation. Following the successful completion of the first Compact, given its performance on MCC’s scorecard for the fiscal year 2015, Mongolia was selected in December 2014 as eligible to develop this second compact. Working closely with MCC, the National Secretariat for the Second Compact Agreement between the Government of Mongolia and the Millennium Challenge Corporation of the USA (National Secretariat) established by the Government of Mongolia analyzed the constraints to

MCA Mongolia Monitoring and Evaluation Plan 6
economic growth in Mongolia and identified “costly access to water and sanitation” as one of Mongolia’s most binding constraints. Mongolia’s capital Ulaanbaatar is home to nearly one-half of the country’s population and accounts for three-quarters of the country’s registered companies and two-thirds of its economic output. Following two decades of rapid growth, Ulaanbaatar faces an imminent shortage of potable water that, as early as 2021, may begin to undermine its economy and impact the quality of life of its residents. Through extensive due diligence analysis during 2016, 2017, and 2018, MCC and the National Secretariat identified investments to develop new wellfields, introduce the recycling and reuse of wastewater, and enhance long-term sustainability in the water sector. These investments align with the Government’s interest in more efficient and focused water governance. The Government of the United States of America, acting through the Millennium Challenge Corporation (MCC), and the Government of Mongolia (GoM), entered into a second Millennium Challenge Compact in the amount of three hundred fifty million dollars ($350,000,000) to be implemented over five years by the Millennium Challenge Account-Mongolia (MCA-M). The agreement was signed on 27 July 2018. The Mongolia second compact entered into force (EIF) on March 31, 2021, initiating the five-year timeline for project implementation.

MCA Mongolia Monitoring and Evaluation Plan 7
Figure 1. Program Logic: Water Supply Project
INVESTMENTS
Poverty Reduction Through Economic Growth
Activity 1: Downstream Wells
Activity 3: Sustainability, Sub-activity 4: Industrial Pre-Treatment and Pollution Control
Activity 2: Wastewater recycling
Activity 3: Sustainability, Sub-activity 5: Public Awareness and Behavior Change
Activity 3: Sustainability, Sub-activity 1: Cost Recovery
Activity 3: Sustainability, Sub-activity 2: Ger Area Cost Containment
Activity 3: Sustainability, Sub-activity 3: Utility Operations
Training through Twinning
Advanced Water Purification Plant Built
Water Production Capacity Added (Groundwater Wells)
TA to Strengthen Industrial Pollution Monitoring and Enforcement
Water Recycling Plant & Associated Infrastructure
Behavior Change or Public Communications Activities
OUTPUTS OUTCOMES MCC GOAL
Affordability and Customer Assistance Study
Water Withdrawn from Project Wellfields
Risk A. Water Supply from Sources External to the Project Exceeds Projections
Increased Supply of Water in Ulaanbaatar System (m3)
Risk D. Required connections are not built for USUG to tap CHPP wells Risk E. CHPP-3 and CHPP-4 do not release their wells for use by USUG
Risk B. Water withdrawn is lost (physical losses)
Released Groundwater for General Consumption
Risk F. CWWTP is not replaced & effluent of adequate quality is not delivered to the Wastewater Recycling
Increased O&M cost recovery
Planned Maintenance is Executed
Plan for Inter-Institutional Coordination and Decision-making to Reduce Costs
Water Kiosk Improvements
Stakeholder Institutions Coordinate to Reduce Costs
USUG Staff Capacity to conduct O&M Improves
TA to improve capture and analysis of consumer data
TA to support Asset Management
COMPLETENESS: Green Result: Measurable Metric with Baseline in M&E Plan Yellow Result: Measurable Metric with no Baseline in M&E Plan Red Result: Not Measurable and no Baseline in M&E Plan
CWWTP Effluent Meets Treatment Standards
USUG’s Un-Recovered Costs Reduced
Improvement in Staff Capacity to address Aquarating
Decreased Annual Degradation of USUG Well’s Capacity
Objective: Additional Projected Demand Met (Timeline: Expected to begin in Year 5)
Increased Water is Consumed by UB Residents (aggregate)
Increased Water is Used by Commercial and Industrial Users (aggregate)
Willingness to Pay Study
USUG Staff Capacity to capture and analyze data improves
Cost-Recovery Tariff Implemented
Reductions in Water Kiosks Operating Costs for USUG
USUG Weaknesses (as uncovered by AquaRating) addressed
ERR=10.9% (CBA Benefit A, linked to Result box with Purple outline)
Increased Public Understanding of the Cost of Water Resources
ERR=8% (CBA Benefit B, linked to Result box with Blue outline)
ERR=11% (CBA Benefit C, linked to Result box with Yellow outline)
Recycled Water Supplied for CHPP3 & 4 Industrial Use
Problem Statement: Ulaanbaatar faces an imminent water supply shortage. Objective: To meet the projected additional demand for water in Ulaanbaatar for residential consumers and commercial and industrial users.
Risk C. Water consumption does not match pre-compact projections
Tariff Options Studies
GoM Policy defines Affordability
Consumer Subsidies made Explicit
Targeted Water Service Affordability

MCA Mongolia Monitoring and Evaluation Plan 8
1.2.2.Project Description and Logic The Mongolia Program focuses on the binding constraint of “costly access to water and sanitation,” and is designed to address the problem of limited long-term sustainable supplies of water for the capital city, Ulaanbaatar. The Water Supply Project comprises three closely related investment activities: i) Downstream Wells Activity, ii) Wastewater Recycling Activity and iii) Water Sector Sustainability Activity.
Downstream Wells Activity The “Downstream Wells Activity” supports the development of the Biokombinat Wellfield and the Shuvuun Wellfield downstream of Ulaanbaatar. MCC Funding for this Activity funds the construction of (i) approximately 52 new wells in the two downstream wellfields, (ii) associated pumps, local collection pipelines, equalization tanks and a transmission line to convey the water from the wellfields, (iii) an advanced water purification plant located at the western edge of the city to remove contaminants (designed to include multiple barriers to remove pathogens, volatile organic compounds, heavy metals, and other contaminants that may be present in the groundwater), and (iv) storage facilities, pumping station, and conveyance pipeline to transport finished water from the purification plant into the existing municipal water network of Ulaanbaatar. Wastewater Recycling Activity The “Wastewater Recycling Activity” supports the recycling and reuse of a large quantity of wastewater effluent from the central wastewater treatment plant (“CWWTP”). MCC Funding for this Activity funds the construction of (i) a wastewater recycling plant (located on available public land adjacent to the CWWTP) designed to treat a portion of the effluent from the CWWTP, (ii) pumping stations and associated pipelines to convey the recycled water to water storage facilities near combined heating and power plants (“CHPP”) three and four (known as “CHPP-3” and “CHPP-4”), and (iii) internal piping, storage facilities, and control systems to facilitate the use of recycled wastewater for certain processes within CHPP-3 and CHPP-4.
Water Sector Sustainability Activity The “Water Sector Sustainability Activity” supports five interventions that address policy, legal, regulatory, and institutional issues and improve the long-term sustainability of the water sector in Ulaanbaatar.
a) The “Cost Recovery Sub-Activity” supports technical assistance to the WSRC for a detailed examination of the structuring of water and wastewater tariffs, based on a detailed assessment of the willingness and ability of USUG customers to pay for improved water service. The sub-activity also supports assistance to USUG for the preparation of rate cases that reflect the goal of full coverage of costs for operations, maintenance and depreciation, as required by law.
b) The “Ger Area Cost Containment Sub-Activity” supports efforts to curtail the high costs that USUG bears for providing water through the system of water kiosks throughout the ger areas of Ulaanbaatar. The sub-activity supports a variety of small-scale works intended to reduce the direct costs associated with the delivery and sale of water, including the conversion of manually operated kiosks to automatic “smart” kiosks that operate longer hours at a lower cost, the extension of supply pipes in order to connect some water kiosks currently supplied by tanker truck to a continuous piped water supply, and the construction of additional filling

MCA Mongolia Monitoring and Evaluation Plan 9
stations to reduce distance and time traveled by USUG’s fleet of tanker trucks. The sub-activity also supports improvements in data sharing, planning, and coordination among USUG, municipal agencies, and district offices around expansion and the development of municipal infrastructure.
c) The “Utility Operations Sub-Activity” supports the strengthening of critical operational capacities within USUG, to be identified through the implementation of AquaRating, an international assessment and benchmarking tool for utility operations developed by the International Water Association. The sub-activity includes funding support for a comprehensive partnership between USUG and an experienced water utility from a developed country that operates in similar conditions or deals with similar concerns. The sub-activity also includes targeted support for specific concerns with USUG’s ability to operate, maintain, manage and plan its asset base, as well as its ability to capture, analyze and make use of customer data.
d) The “Industrial Pre-Treatment and Pollution Control Sub-Activity” supports efforts to reduce the incidence of industrial pollution in the municipal wastewater collection system before it is constructed and commissioned. The sub-activity funds technical assistance to identify and model sources of industrial pollution, strengthen pollution standards, ordinances and penalties. The sub-activity also provides technical assistance and advanced laboratory equipment to those Government and municipal government entities responsible for monitoring, detecting and enforcing pollution regulations in Ulaanbaatar.
e) The “Public Awareness and Behavior Change Sub-Activity” supports improved communication and engagement with stakeholders and the general public in an effort to improve awareness and understanding of the scarcity of water resources available to Ulaanbaatar and the actual costs of exploiting them in ways that protect environmental and social concerns.
Ongoing Project Design Work to further define some investments is ongoing and expected to be completed per the schedule below. The M&E Plan will reflect those changes once they occur and be revised accordingly. Investments are currently projected to be finalized according to the below timetable: Table: Timeline for Investment Design and Baseline Considerations
Activity 3: Sustainability Investment Design Status
3.1 Cost Recovery Final (Follow-up Option TBD)
3.2 Ger Area Cost Containment
Water Kiosk Improvements Expected Year 1
Plan for Inter-institutional coordination and decision-making Expected Year 3
3.3 Utility Operations

MCA Mongolia Monitoring and Evaluation Plan 10
Training through Twinning Expected Year 2
TA to support asset management Expected Year 3
TA to improve capture and analysis of consumer and user data Expected Year 1
3.4 Industrial Pre-Treatment and Pollution Control
TA to strengthen industrial pollution monitoring and enforcement Expected Year 1
3.5 Behavior Change or Public Communication
Behavior Change or Public Communication Activities Expected Year 1
Narrative Description of the Program Logic Diagram The goal of this Compact is to reduce poverty through economic growth in Mongolia. MCC intends to provide assistance in a manner that strengthens good governance, economic freedom, and investments in the people of Mongolia. The objective of the Mongolia Program is to meet the projected demand for water in Ulaanbaatar for residential consumers and commercial and industrial users. Outputs of the Downstream Wells Activity are expected to include new wells in the Biokombinat Wellfield and Shuvuun Wellfield; an advanced water purification plant and the associated pumps, pumping stations, collection pipelines, storage facilities; and a transmission line and conveyance pipeline. Working together, these outputs should produce the expected outcome, which is an increase in the amount of water abstracted from groundwater aquifers, supplied to Ulaanbaatar, and ultimately consumed by residential consumers and commercial and industrial users. With a safe, secure supply of additional water, commercial and industrial users should be able to increase their economic activity, ultimately contributing to economic growth. Outputs from the Wastewater Recycling Activity are expected to include the wastewater recycling plant; pumping stations and transmission pipelines; and storage facilities and internal control valves within CHPP-3 and CHPP-4. Working together, those outputs should produce the desired outcome which is a stable supply of recycled wastewater to be used for certain processes within CHPP-3 and CHPP-4. This ultimately allows the plants to release groundwater from their proprietary wells, thereby increasing the amount of water supplied to Ulaanbaatar’s residential consumers and commercial and industrial users. With a safe, secure supply of additional water, commercial and industrial users should be able to increase their economic activity, ultimately contributing to economic growth. Outputs from the Water Sector Sustainability Activity are more diverse. Working together, the Cost Recovery Sub-Activity and the Ger Area Cost Containment Sub-Activity seek to increase USUG’s revenues and reduce the excessive unrecovered costs associated with water delivery in the ger areas of Ulaanbaatar. Those outputs support the desired outcome which is the adoption of water and wastewater tariffs that fully recover costs. Cost-recovery tariffs, in turn, allow the utility to fully budget and implement its operations and maintenance activities, leading to optimal performance in the new downstream wells and the ongoing withdrawal of groundwater at levels that reflect the full capacity of the infrastructure assets. Similarly, the Utility Operations Sub-Activity helps build the necessary capacity within the utility for

MCA Mongolia Monitoring and Evaluation Plan 11
operating new facilities, planning operations and maintenance, and maintaining assets. That leads to the desired outcome of stronger operation and maintenance of new assets, which in turn also leads to optimal performance in the new downstream wells and the ongoing withdrawal of groundwater at levels that reflect the full capacity of the infrastructure assets. The Public Awareness and Behavior Change Sub-Activity is expected to increase public understanding of the full costs associated with a water supply and water service, raise awareness of feedback channels to USUG, the Ulaanbaatar Housing and Communal Services Authority (known as OSNAAUG), and other service providers, and establish public support for adjustments in water and wastewater tariffs. At the same time, the Industrial Pre-Treatment and Pollution Control Sub-Activity provide, among several outputs, assistance to MET to
maintain the quality of surface water and groundwater. That output -directly supports the Downstream Wells Activity and eventually leads to the desired outcomes, including the withdrawal of additional water from the wells, the increased supply of water to Ulaanbaatar, and the consumption of that water by residential consumers and commercial and industrial users. With a safe, secure supply of additional water, commercial and industrial users should be able to increase their economic activity, ultimately contributing to economic growth. The diagram above illustrates and describes the causal relationships among the program components and synthesizes expected outcomes intended to achieve the Project objectives and the program goal.
1.2.3.Risks and Assumptions The Mongolia program logic is based on specific assumptions about the linkages between individual Project Activities and the goal of poverty reduction through economic growth. Assumptions inform the economic analysis (economic rates of return) while risks are external to program implementation, but are likely to affect program success. However, such assumptions and risks do not excuse any Party’s performance unless otherwise expressly agreed to in writing by the other Party. Known assumptions and risks include:
Water Supply Project
Assumptions/Risks
Mitigation
Risk A: Water supply from sources external to the project exceeds projections (Note: This is a risk because it reduces the benefits of the project.)
None
Risk B: Water withdrawn lost (physical losses)
Ensuring funds are available for proper maintenance will allow USUG to keep physical losses at or below expected levels. Activity 3 Sub-activities 1 & 3, Cost recovery and Utility operations respectively, are designed to improve the ability of USUG to maintain wells and the piped network through cost recovery and increased training.
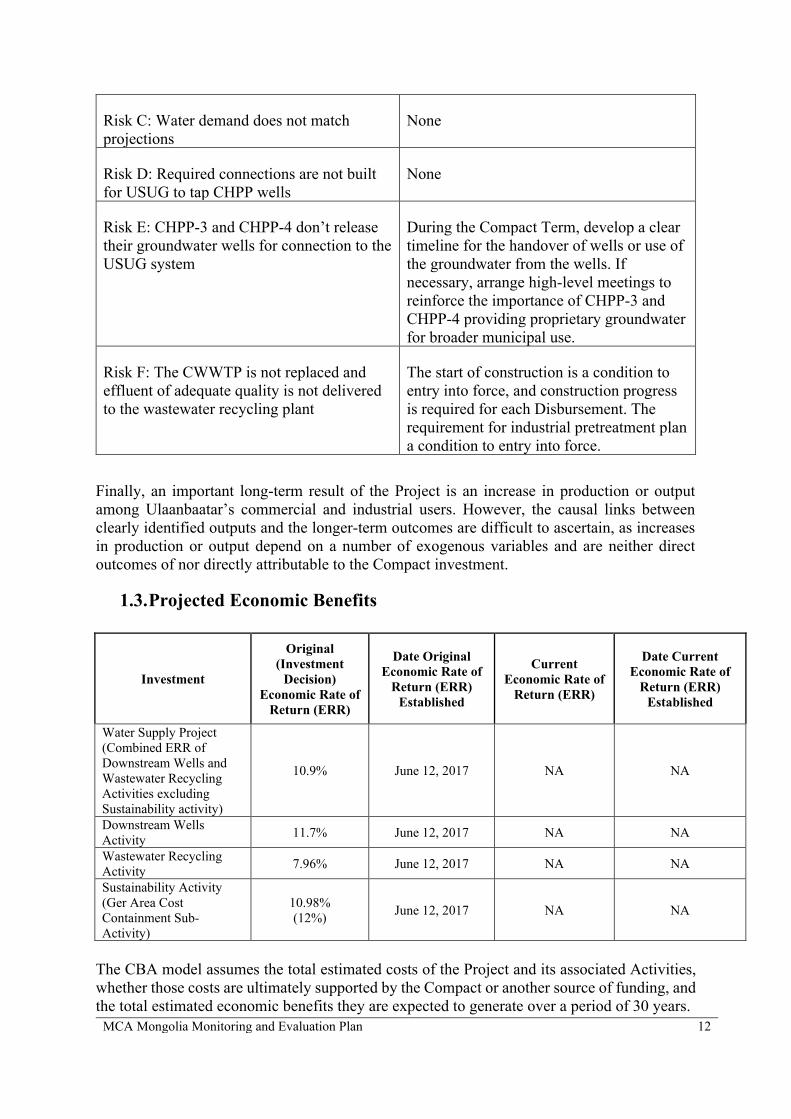
MCA Mongolia Monitoring and Evaluation Plan 12
Risk C: Water demand does not match projections
None
Risk D: Required connections are not built for USUG to tap CHPP wells
None
Risk E: CHPP-3 and CHPP-4 don’t release their groundwater wells for connection to the USUG system
During the Compact Term, develop a clear timeline for the handover of wells or use of the groundwater from the wells. If necessary, arrange high-level meetings to reinforce the importance of CHPP-3 and CHPP-4 providing proprietary groundwater for broader municipal use.
Risk F: The CWWTP is not replaced and effluent of adequate quality is not delivered to the wastewater recycling plant
The start of construction is a condition to entry into force, and construction progress is required for each Disbursement. The requirement for industrial pretreatment plan a condition to entry into force.
Finally, an important long-term result of the Project is an increase in production or output among Ulaanbaatar’s commercial and industrial users. However, the causal links between clearly identified outputs and the longer-term outcomes are difficult to ascertain, as increases in production or output depend on a number of exogenous variables and are neither direct outcomes of nor directly attributable to the Compact investment.
1.3. Projected Economic Benefits
Investment
Original (Investment
Decision) Economic Rate of
Return (ERR)
Date Original Economic Rate of
Return (ERR) Established
Current Economic Rate of
Return (ERR)
Date Current Economic Rate of
Return (ERR) Established
Water Supply Project (Combined ERR of Downstream Wells and Wastewater Recycling Activities excluding Sustainability activity)
10.9% June 12, 2017 NA NA
Downstream Wells Activity 11.7% June 12, 2017 NA NA
Wastewater Recycling Activity 7.96% June 12, 2017 NA NA
Sustainability Activity (Ger Area Cost Containment Sub-Activity)
10.98% (12%) June 12, 2017 NA NA
The CBA model assumes the total estimated costs of the Project and its associated Activities, whether those costs are ultimately supported by the Compact or another source of funding, and the total estimated economic benefits they are expected to generate over a period of 30 years.

MCA Mongolia Monitoring and Evaluation Plan 13
When making investment decisions, MCC sets a threshold of 10 percent on the estimated ERRs from each project. Using the best information available, MCC estimates the combined ERR for the Water Supply Project at 10.9 percent. The MCC Website provides further details on the calculation of this ERR, including datasets and additional disaggregated information.
1.3.1. Water Supply Project Economic Analysis The primary benefit of the Water Supply Project derives from the addition of freshwater to the water supply network in Ulaanbaatar. The Downstream Wells Activity is expected to provide additional supplies of up to 50 MCM per year by extracting, purifying and transporting new sources of groundwater into the city. The Wastewater Recycling Activity is expected to provide future supplies of 14.6 MCM by creating a substitute for freshwater that CHPP-3 and CHPP-4 currently consume. The benefits of that substitution accrue in later years, as the contamination in downstream wellfields abates and CHPP-3 and CHPP-4 begin to release the groundwater from their proprietary wells for broader consumption in the city. As additional water becomes available, that water allows residential consumers to improve their general well-being and allows commercial and industrial users to expand their services, their production or their output. Without the additional water that the compact program is expected to provide, residential consumers and commercial and industrial users are expected to feel the effects of water shortages within the next three to four years. As water prices rise, their willingness to pay for and to consume additional water may vary based on the elasticity of their demand, revealing the value they place on the water. The Water Sector Sustainability Activity is expected to improve the long term sustainability of the additional water supplied through the Downstream Wells and Wastewater Recycling Activities. Such improvements are urgent, given evidence that the performance of the upstream wellfields operated by USUG has deteriorated significantly over the last decade or more. Tariff increases, operations and maintenance (“O&M”) planning, and cost-saving infrastructure improvements are expected to allow USUG to improve the performance of long-term operation and maintenance of infrastructure assets, thereby slowing degradation of wellfield capacity.
1.3.2. Projected Program Beneficiaries According to the MCC Guidelines for Economic and Beneficiary Analysis, beneficiaries of projects are considered individuals that are expected to experience better standards of living due to Compact activities aimed to increase their real incomes. The economic rate of return (ERR) analysis for proposed projects gives details on benefit streams through which beneficiaries should experience increased income. A general overview of the span of program benefits across the population of Ulaanbaatar, used for Compact justification to MCC’s Investment Committee, is presented in the table below. Projected Program Participants
Investment Program Participant Definition
Est. Number of Program Participants

MCA Mongolia Monitoring and Evaluation Plan 14
Downstream Wells Activity
USUG Staff (to be defined, mostly plant operators at AWPP, anyone that does controls, pipeline repair,
equipment repair)
TBD, up to 32 staff
Wastewater Recycling Activity
USUG Staff (to be defined, mostly plant operators at WWRP, anyone that does controls, pipeline repair,
equipment repair)
TBD, about 35
Cost Recovery Sub-Activity
WTP survey respondents
(5000), NSO (6), WSRC (?), USUG, OSNAAUG, private kontors, municipalities, and
MLSP
TBD, about 5000 The number of the participants
from USUG, OSNAAUG, private kontors,
municipalities and MLSP can be finalized at the end of
2021 Ger-Area Cost
Containment Sub-Activity
TBD TBD
Utility Operations Sub-Activity TBD TBD
Industrial Pre-Treatment and Pollution Control
Sub-Activity TBD TBD
Public Awareness and Behavior Change Sub-
Activity TBD TBD
Projected Program Beneficiaries (Based on 2017 calculation)
Project Program
Beneficiary Definition
Est. Number of Beneficiaries in
Year 30
Present Value (PV) of Benefits1
in 30 years
Net Present Value (NPV)2 in
30 years Downstream
Wells and Wastewater Recycling Activity
The entire population
of Ulaanbaatar
city
2,427,657 individuals of
656,124 households
798.66 million USD 61.5 million USD
Sustainability Activity
234.58 million USD 13.3 million USD
1 The PV of benefits are included in the QRR as the “estimated discounted increase in income over the life of the project or the “beneficiary income gain.”
2 The NPV illustrates the net benefits, which subtract the discounted costs from the discounted benefits. Cost-benefit analysis produces two main outputs: the ERR and NPV. This provides a more complete picture and allows for comparison at this level across projects.
MCA Mongolia Monitoring and Evaluation Plan 15
1.3.3. Water Supply Project Beneficiary Analysis The Downstream Wells Activity, Wastewater Recycling Activity, and Water Sector Sustainability Activity are expected to increase water supply for the entirety of Ulaanbaatar. Beneficiaries of the Activities include the entire population of Ulaanbaatar. Under the Downstream Wells and Wastewater Recycling Activity, those below the 2016 Mongolian national poverty line of $2.57 a day receive 7.4 percent of all benefits from the compact, or 13 percent of annual income for the average individual below in the poverty line in benefits over 30 years. Under the Sustainability Activity, those below the Mongolian national poverty line of $2.57 a day receive 7.4 percent of all benefits from the compact, or 4 percent of annual income for the average individual below in the poverty line in benefits over 30 years.
2. MONITORING COMPONENT
2.1. Summary of Monitoring Strategy The Compact will be monitored systematically and progress reported regularly through the Indicator Tracking Table (ITT). There are four levels of indicators that follow from the program logic framework: (i) process; (ii) output; (iii) outcome; and (iv) goal. The various indicator levels map to the program logic and thus allow Project developers and managers to understand to what extent planned activities are likely to achieve their intended objectives. Often most outcome and goal indicators are not monitored during the life of the Compact, but rather are reported through evaluations after the Compact is complete. Those levels of results typically take longer to be achieved. Monitoring data will be analyzed regularly to allow managers of MCA-M and MCC to make programmatic adjustments as necessary with a view towards improving the overall implementation and results of the Program. Goal indicators measure the economic growth and poverty reduction that occur during or, most likely, after implementation of the program. For MCC Compacts, goal indicators will typically be a direct measure of local income and are typically measured through post compact evaluations. Outcome indicators measure the intermediate effects of an Activity or set of Activities and are directly related through the Program Logic to the output indicators. Output indicators directly measure Project Activities. They describe and quantify the goods and services produced directly by the implementation of an Activity. Process indicators measure progress toward the completion of Project Activities. They are a precondition for the achievement of output indicators and a means to ascertain that the work plan is proceeding on time.3 MCC has introduced common indicators for external reporting across all MCC Compacts. The common indicators relevant to the MCA-M Compact are included in this M&E Plan.
3 The indicator levels are formally defined in MCC’s Policy for Monitoring and Evaluation of Compacts and Threshold Programs.

MCA Mongolia Monitoring and Evaluation Plan 16
The Compact outlines the initial indicators for the Program. The M&E Plan builds on this information with additional indicators developed by MCC, MCA-M project managers and implementers in the early stage of project implementation. The Indicator Definition Table provides relevant details for each indicator by Project and can be found in Annex I. It provides descriptions for the indicator structure by specifying each indicator’s: (i) name; (ii) definition; (iii) unit of measurement; (iv) level of disaggregation; (v) data source; (vi) responsible party; and (vii) frequency of reporting. To ensure that the Program is on track to meet its overall goals and objectives, the monitoring indicators will be measured against established baselines and targets, derived from the ex-ante economic rate of return analysis, other types of analysis, and project planning documents. The targets reflect the underlying assumptions made in program design about what each activity will likely achieve. Baselines and target levels for each indicator are defined in Annex II. Indicators may need to be modified in future versions of the M&E Plan. Modification and revisions to the indicators may only be made according to the MCC M&E Policy. Any significant modifications to the indicators or other content will be summarized in Annex III of the M&E Plan. A number of indicators, baselines and targets are currently pending determination. The majority of these baselines and targets will be established once the feasibility and design studies are completed. Others are pending updated data from once implementation contracts are awarded and contractors have presented their work plans. The MCA-M M&E Unit shall consult and assist implementing entities in setting up their data collection plan and reporting templates. Gender considerations and gender-disaggregated indicators are incorporated into the Mongolia M&E Plan and the ITT specifies which indicators will be disaggregated by gender at the household level. i.e., households headed by females. In Mongolia, targets are not required for the number of women or men being served by a Project or Activity as the project designs are not directly linked to performance to gender-specific outcomes.
2.2. Data Quality Reviews Data quality is the primary responsibility of the MCA-M staff, led by the M&E and Economic Analysis Director. The M&E Unit, other MCA staff, as appropriate, and implementing entities should regularly check data quality. The M&E Unit should verify that all reported data has appropriate source documentation and that calculations have been done correctly. The MCA-M M&E Unit will conduct field visits on a regular basis or whenever requested by MCC, to review the quality of the data gathered through this M&E Plan. MCA-M may hire individual data quality monitors to monitor data collection and quality, as needed. In addition to regular data quality checks by MCA staff, independent Data Quality Reviews (DQRs) will be conducted in accordance with the requirements of the MCC M&E Policy. The objectives of DQRs are to assess the extent to which data meets the standards defined in the MCC M&E Policy in the areas of validity, reliability, timeliness, precision and integrity.

MCA Mongolia Monitoring and Evaluation Plan 17
DQRs will be used to verify the consistency and quality of data over time across implementing agencies and other reporting institutions. DQRs will also serve to identify where the highest level of data quality is not possible, given the realities of data collection. The particular objectives for the DQRs will include identification of the following parameters: i) what proportion of the data has quality problems (completeness, conformity, consistency, accuracy, duplication, integrity); ii) which of the records in the dataset are of unacceptably low quality; iii) what are the most predominant data quality problems within each indicator; iv) what are the main reasons behind low quality; and v) what steps can be taken to improve data quality. In-house Data Quality Review (DQR) on existing indicators was conducted from November 2019 to March 2020 before the Mongolia Compact EIF. In specific, the DQR assessed the current data collection procedures and reporting systems for 14 outcome indicators that had clear definitions and targets. The DQR report has provided initial recommendation and considerations for future data gathering approaches with key stakeholders including USUG, WSRC, MUB, MET and Water Agency. A second round of internal DQR is expected to begin on new indicators in late 2021. MCA-M will contract an independent data quality reviewer in compliance with MCC Program Procurement Guidelines. The entity responsible for data quality reviews should be hired in Year 3 of the Compact. By this time, all sub-components should be fully designed, allowing all indicators to be defined. Additionally, it will be before results are expected to be realized on higher level outcomes, allowing time for adjustments to data sources if necessary.
2.3. Standard Reporting Requirements Reporting to MCC: Quarterly Disbursement Request Package Performance reports serve as a vehicle by which the MCA Management informs MCC of implementation progress and on-going revisions to Project work plans. Currently, MCC requires that MCA submit a Quarterly Disbursement Request Package (QDRP) each quarter. The QDRP must contain an updated ITT and a narrative report. A complete ITT presents the preceding quarters’ indicator actuals and current quarter indicator progress against targets set forth in this M&E Plan. The ITT is the source for MCC’s internal and external reporting on indicator progress. Additional guidance on reporting is contained in MCC’s Guidance on Quarterly MCA Disbursement Request and Reporting Package. Reporting to MCA and Local Stakeholders Even though the QDRP is required to be sent to MCC, MCAs should also use these reports and the data included in them to assess progress and performance internally. The M&E teams attempt to align MCC and MCA reporting so that data is used to inform decision-making at both levels.

MCA Mongolia Monitoring and Evaluation Plan 18
3. EVALUATION COMPONENT
3.1. Summary of Evaluation Strategy While good program monitoring is necessary for program management, it is not sufficient for assessing the ultimate results. Therefore, MCC and MCA-M will use different types of evaluations as complementary tools to better understand the effectiveness of its programs. As defined in the MCC M&E Policy, evaluation is the objective, systematic assessment of a program’s design, implementation, and results. MCC and MCA-M are committed to making the evaluations as rigorous as warranted to understand the causal impacts of the program on the expected outcomes and to assess cost-effectiveness. This Evaluation Component contains two types of evaluation activities: (i) independent evaluations (impact and/or performance evaluations) and(ii) self-evaluation, each of which is further described below. The results of all evaluations will be made publicly available in accordance with the MCC M&E Policy. Independent Evaluations According to the MCC M&E Policy, every Project in a Compact must undergo a comprehensive, independent evaluation (impact and/or performance). The next section on Specific Evaluation Plans will describe the purpose of each evaluation, methodology, timeline, and the process for collection and analysis of data for each evaluation. All independent evaluations must be designed and implemented by independent, third-party evaluators, which are hired by MCC. If the MCA-M wishes to engage an evaluator, the engagement will be subject to the prior written approval of MCC. Contract terms must ensure non-biased results and the publication of results. For each independent evaluation, MCA-M and relevant stakeholders are expected to review and provide feedback to independent evaluators on the evaluation design reports, evaluation materials (including questionnaires), baseline report (if applicable), and any interim/final reports to ensure proposed evaluation activities are feasible, and final evaluation products are technically and factually accurate. MCC’s evaluation review process will follow the guidelines outlined in the MCC M&E Policy. Self-Evaluation MCC produces a Star Report for each Compact and Threshold program. The Star Report provides a comprehensive and accessible assessment of MCC’s investments in a given country and builds on MCC’s longstanding commitment to results and accountability. The Star Report offers a complete narrative—from initial country selection by MCC’s Board of Directors through final project evaluation—and highlights investment objectives, partnerships, policy reforms, results, and lessons learned. MCC aims to make the Mongolia Star Report available on MCC’s public website approximately 10 months after compact end date. The results of all evaluations shall be made publicly available in accordance with the MCC M&E Policy.
3.2. Specific Evaluation Plans Summary of Specific Evaluation Plans

MCA Mongolia Monitoring and Evaluation Plan 19
The following table summarizes specific evaluation plans. The independent evaluator is expected to be hired by September 2022, after which point the evaluation design and reporting timeline will be established
Evaluation Name Evaluation Type Evaluator
Primary/ Secondary
Methodology
Final Report Date
Water Supply Project Evaluation TBD TBD TBD TBD
3.3. Evaluation Questions All MCC independent evaluations are required to answer three fundamental questions:
Was the program implemented according to plan (in terms of quantity and quality of outputs)?
Did the program achieve its targeted outcomes, particularly its stated objective, in the timeframe and magnitude expected? Why or why not?
Do the results of the program justify the allocation of resources towards it?
In addition to these questions, the evaluation may ask questions that MCC or stakeholders believe will result in useful learning to be applied in future investments or policies. Possible evaluation questions are detailed below. The final list of evaluation questions will be developed in collaboration with the independent evaluator and codified in their Evaluation Design Report.
• Did the Water Supply Project result in the additional demand for water in Ulaanbaatar being met? This question links to the following outcome indicator: Objective: Additional Projected Demand Met. This question will be merged with required evaluation question #2 above.
• If so, did the Water Supply Project lead to greater water consumption among residential consumers and commercial and industrial users, compared to a scenario where a water shortage occurs (the counterfactual)? What are the differential welfare effects of this water consumption for ger area residents and apartment residents by income profile? This question links to the following outcome indicators: Increased Water is Consumed by Ulaanbaatar Residential Consumers, Increased Water is Used by Commercial and Industrial Users.
• If water consumption among commercial and industrial users has increased, compared to a scenario where a water shortage occurs (the counterfactual), has the increased consumption lead to increased output and profit? This question links to the following goal indicators: Increased Output from Water Intensive Industries, Increased Profit from Water Intensive Industries.

MCA Mongolia Monitoring and Evaluation Plan 20
• Is USUG consistently monitoring water quality standards to ensure the beneficial impact of reduced pollution in the Tuul River and cleaning/purification of the downstream aquifer? This question links to the following outcome indicator: Water Withdrawn from MCC Wellfields.
• Is the Wastewater Recycling Activity supporting the transfer of CHPP wells to USUG authority and the expansion of freshwater supply to Ulaanbaatar? This question links to the following outcome indicator: Released Groundwater for General Consumption.
• Are these results of the Water Supply Project likely to be sustained: can additional demand for water in Ulaanbaatar continue to be met for decades to come? Is O&M being sustained at levels and quality consistent with preventing degradation of USUG’s assets that were prevalent before the compact? Is the water tariff path consistent with full cost recovery? Is the regulator operating independently, and regularly promulgating standards and rates consistent with good regulatory practices? Does the tariff structure provide support to poorer households consistent with the social equity preferences of the Government? Is this the result of the Water Sector Sustainability Activity? These questions link to the following outcome indicators: Decreased Annual Degradation of USUG Wells’ Capacity, Cost Reflective Tariff Implemented.
3.4. Evaluation Methodology Description The evaluation methodology will be proposed by the independent evaluator in the Evaluation Design Report.
Data Sources
Data sources (primary data and administrative data) for the evaluation will be determined with the independent evaluator and codified in the Evaluation Design Report. Primary Data Collection
Survey Name
Quantitative or
Qualitative
Define Sample
Sample Size
Number of Rounds
Exposure Period
(months)
Expected Dates of Primary
Data Collection
TBD TBD TBD TBD TBD TBD TBD
3.5. Summary of Activities or Sub-Activities without Evaluations All activities and sub-activities will be included in the evaluation.

21
4. IMPLEMENTATION AND MANAGEMENT OF M&E
4.1 Responsibilities The MCA-M M&E Unit will be composed of an M&E and Economic Analysis Director who will have the key responsibility of leading and managing all M&E activities; and M&E specialists who will support the M&E and Economic Analysis Director in performing the M&E activities. Additionally, the M&E Unit will hire short-term support on an as needed basis. The M&E Unit will carry out, or hire contractors to complete the following and other related activities:
• Direct implementation of all activities laid out in the M&E Plan and ensure all requirements of the M&E Plan are met by MCA-M;
• As the champion of results-based management, the M&E Unit will take steps to foster a results-oriented culture throughout MCA-M and its implementing partners – this includes making sure that M&E information is used by the MCA-M management and project teams to improve Compact performance (feedback loop).
• Ensure that the M&E Plan is modified and updated as improved information becomes available;
• Oversee the development and execution of an M&E system (including data collection, data analysis and reporting systems) integrated with the MCC Management Information System (MIS);
• Elaborate and document M&E Policies, Procedures and Processes in a guidance document to be used by all MCA-M staff and project implementers;
• Communicate the M&E Plan and explain the M&E system to all key stakeholders involved in the Compact, particularly project implementers, to ensure a common understanding by all. This could take the form of orientation and capacity building sessions and could focus on issues such as:
o Explaining indicator definitions, data collection methods and timing/frequency of data collection and reporting,
o Data quality controls and verification procedures, o Impact evaluation questions and methodology, etc.;
• Develop and use a documentation system to ensure that key M&E actions, processes and deliverables are systematically recorded. This may be accomplished either as part of the M&E information system or independently. The documentation may encompass the following elements:
o Indicators and material evidence for reported values o M&E Plan versions o Reporting manuals and templates o Key M&E deliverables including Terms of References (TORs),
contracts/agreements, data collection instruments, reports/analyses, etc.; • Develop (with the Communication Unit, Environmental and Social Performance (ESP)
Directors, and Gender and Social Inclusion (GSI) team/unit) and implement a systematic results dissemination approach that draws on verified ITT data;
• Organize and oversee regular independent data quality reviews on a periodic basis to assess the quality of data reported to MCA;
• Participate in project monitoring through site visits, review of project reports and analysis of performance monitoring and other data;

22
• Update the M&E work plan periodically; • Manage the M&E budget efficiently; • Contribute to the design of the evaluation strategy; • Collaborate with the procurement team to prepare and conduct procurement of M&E
contracts; • Ensure that data collection mechanisms are designed to collect data disaggregated by
gender and other dimensions, as applicable and practical, and that the findings are presented at the appropriately disaggregated level; and
• Ensure data collection, storage, and dissemination activities maximize protection of confidentiality of survey respondents’ personally identifiable information. This may require:
o Facilitating local Institutional Review Board clearance for data collection o Using lock and key cabinets for paper files, o Using secure file transfer systems, o Encrypting data files, o Employing password protection on data systems and data encryption, o Requiring signed acknowledgements of roles and responsibilities, o Requiring relevant stakeholders to sign non-disclosure agreements, and o Incorporating data protection standards into the organization’s records management
procedures, or if necessary, developing records management procedures that includes such standards.
The M&E and Economic Analysis Director will be a part of MCA-M’s internal Management Unit, composed of MCA leadership, Project Directors, and other Directors. Collaboration with the procurement team will be very important to prepare and conduct timely procurement of M&E related contracts as well as ensuring that other implementation contracts contain necessary data reporting provisions. Seminars, workshops, elaboration and distribution and dissemination of M&E materials shall be conducted in close cooperation with the MCA Communications Unit. In order to prepare for post compact monitoring by the Government, the MCA-M M&E Unit should identify a post compact point of contact (POC) for MCC early on in the program and work with that POC to build an understanding of the MCC program and monitoring process. This POC should be part of the Government entity that will commit to continuing M&E of Compact investments after the Compact End Date. The M&E Unit should also identify the team that will be responsible for reviewing evaluation reports that are delivered post compact (e.g. project leads), to ensure that the relevant project stakeholders review and provide feedback prior to the publication of final reports.
4.2 MCA Data Management System for Monitoring and Evaluation MCA-M will use the MCC MIS for reporting the QDRP (including the ITT) to MCC. For the purpose of internal tracking and maintaining data from implementers and stakeholders, MCA-M may have simple spreadsheet files that support MCC MIS.

23
4.3 Review and Revision of the M&E Plan The M&E Plan is designed to evolve over time, adjusting to changes in program activities and improvements in performance monitoring and measurement. In the fourth quarter of every year of the Compact, or as necessary, the M&E and Economic Analysis Director of MCA-M and representatives of MCC M&E staff will review how well the M&E Plan has met its objectives. The review is intended to ensure that the M&E Plan measures program performance accurately and provides crucial information on the need for changes in project design. More specifically, the review:
• Ensures that the M&E Plan shows whether the logical sequence of intervention outputs and outcomes are occurring;
• Checks whether indicator definitions are precise and timely; • Checks whether M&E indicators accurately reflect program performance; • Updates indicator targets, as allowed by the MCC M&E Policy; and • Adds indicators, as needed, to track hitherto unmeasured results.
The M&E Plan will be revised by MCA, in agreement with MCC M&E, when the need for change has been identified in the review. The revision and approval process will follow the guidelines outlined in the MCC M&E Policy.

24
5. M&E BUDGETThe budget for the implementation of the proposed M&E activities for the five-year term of the Compact is US$ 10.36 million. The M&E budget does not include the M&E staff in the MCA-M Management Unit whose salaries and field trips are included in the administrative budget of the Compact. The budget should not exceed the total amount over the five years, but the distribution of funding between line items and years may be adjusted according to the results of the M&E Plan’s reviews or quarterly if needed.
While the resources for the carrying-out of surveys are allocated by MCA-M from the Compact funds, the evaluation design and analysis are to be funded directly by MCC. The amount MCC will commit to the external evaluation is currently TBD.
Compact CDF Year 1 Year 2 Year 3 Year 4 Year 5
Program Total
Monitoring and evaluation expenses 0.03 0.35 3.45 1.79 1.12 3.62 10.36
Total 0.03 0.35 3.45 1.79 1.12 3.62 10.36

WSP O‐01 yes EvaluationIncreased Water is Consumed by Ulaanbaatar Residential Consumers (aggregate)
OutcomeWater consumption by Ulaanbaatar residential consumers (aggregate) Total water consumed annually by Ulaanbaatar apartment & ger dwellers, measured in million cubic meters/year
Millions of cubic meters per year
Residence [Apartment/Ger] TBD WSRC Annual
WSP O‐02 yes EvaluationIncreased Water is Used By Commercial and Industrial Users (aggregate)
OutcomeWater consumption by Ulaanbaatar commercial and industrial users (aggregate)
Total water consummed annually by Ulaanbaatar businesses, measured in million cublic meters/yearMillions of cubic meters per year
Business [Commercial/Beverage and Spirit/Cashmere
and Tannery/Construction
and construction materials/Meat and
meat processing/Other]
TBDWater Agency and
WSRC Annual
WSP O‐03 yes MonitoringOBJECTIVE: Additional Projected Demand Met
Outcome Objective: additional demand metPercentage of additional demand met by the project’s water supply investments, expressed as the treated water supplied by AWPP (WSP O‐07) over demand in excess of existing supply capacity (projected demand, WSP R‐C's target, minus water capacity from external sources, WSP R‐A1) multiplied by 100%
Millions of cubic meters per year no disaggregation N/A N/A Annual
Year 5 target assumes withdrawals from MCC wells in the final two months of the year. This indicator accurately
reflects the project’s intentions if external sources are used at maximum capacity.
[treated water supplied by AWPP]t x100%/
[(projected demand)t‐(water supply capacity from external sources)t]
WSP R‐C yes Monitoring Risk C: Water Consumption Does Not Match Pre‐Compact Projections
Risk/Assumption Risk C: consumption does not match projections
Water consumed in Ulaanbataar annually, including residential, industrial, and energy consumption from both USUG and private wells, measured in million cubic meters/year
Millions of cubic meters per year
Consumption Type [Residential/Industrial/Energy]; Supply Source [USUG/Private Wells]
TBD Water Agency Annual
WSP R‐B yes Monitoring Risk B: Water Withdrawn is Lost (Physical Losses)
Risk/Assumption Risk B: lost water (physical losses) The difference between the volume of water supplied and the volume of water billed (i.e., volume of water “lost”) expressed as a percentage of water volume supplied in a year.
Percentage no disaggregation TBD WSRC Annual
WSP O‐04 yes Monitoring Increased Supply of Water in Ulaanbaatar System
Outcome Water supply in Ulaanbaatar system Total amount of water supplied to Ulaanbaatar, including that provided by USUG and private wells, measured in million cubic meters per year via a meter on the well
Millions of cubic meters per year
no disaggregation TBD Water Agency Annual
WSP O‐04.1 Pending yes Monitoring N/A (sub‐indicator) Outcome Supplied water volumeThe volume of water supplied to the entire distribution system, which equals the total volume of water produced by the utility annually Cubic meters no disaggregation TBD Water Agency Annual
This is a sub‐indicator of the utility‐only supply is WSP O‐04, for the sake of the common indicators
WSP R‐A1 yes MonitoringRisk A1: Water Supply From Sources External to the Project Exceeds Projections
Risk/Assumption Risk A1: external water supply capacity
Water supply capacity (not amount withdrawn) within safe yield measures from water sources external to the project, including USUG wells and private wells, measured in million cubic meters per year
Millions of cubic meters per year
no disaggregation TBD MET AnnualThis indicator monitors the expectations in investment decision CBA (shown as targets here) for external water
sources compared to what actually materializes
WSP R‐A2 yes MonitoringRisk A2: Water Supply From Sources External to the Project Exceeds Projections
Risk/AssumptionRisk A2: external water supply withdrawals
Water withdrawn (not production capacity) from water sources external to the project, including USUG wells and private wells, measured in million cubic meters per year
Millions of cubic meters per year no disaggregation TBD MET Annual
This indicator monitors the expectations in investment decision CBA (shown as targets here) for external water
sources compared to what actually materializes
WSP O‐06 yes Monitoring Water Withdrawn from MCC Wellfields
Outcome Wellfields water Actual amount of water withdrawn from MCC‐built groundwater wells, measured in million cubic meters per year via a meter where the water exits the groundwater well
Millions of cubic meters per year
no disaggregation USUG annual report
USUG Annual
WSP P‐01 WS‐5 Monitoring N/A (process indicator) Process Temporary employment generated in water and sanitation construction
The number of people temporarily employed or contracted by MCA‐ contracted construction companies to work on construction of water or sanitation systems.
Number Sex TBD MCA Quarterly Sum of indicators DWA P‐05, WRA P‐02 and WSAGA P‐02
WSP P‐02 Pending yes Monitoring Water Production Capacity Added Output Additional water production capacity The volume of water supply or production capacity added to the relevant water system, resulting from the introduction of new water sources (freshwater or recycled wastewater) and/or the expansion of water treatment plants paid for by MCC. This additional water would be expected to flow into the distribution system.
Millions of liters/day no disaggregation TBD MCA Annual Sum of DWA P‐04 and WRA P‐01. Note that the unit is different here, for the sake of the common indicators.
WSP O‐07 yes Monitoring Water Supplied from AWPP Outcome AWPP water Actual amount of water supplied from newly built Advanced Water Purification Plant to the Ulaanbatar Water System, measured in million cubic meters per year via a meter where the water exits the AWPP
Millions of cubic meters per year
no disaggregation USUG annual report
USUG Annual
Mongolia Annex I: Indicator Documentation Table
CI Code Responsible PartyFrequency of Reporting
Additional InformationIndicator Level Indicator NameResult in Project LogicCBA Linkage? [Definition &
Targets from CBA]Definition Unit of Measure Disaggregation
Primary Data Source
Evaluation or Monitoring Indicator?
Number
1. The economic model theoretically expects increased residential and industrial water consumption as a result of the increased water supply, compared to a counterfactual scenario where there is a shortage of water. Increasing residential consumption is not specifically what this
investment is targeting.2. The units of these indicators deviate from the MCC
Common Indicators to match the CBA and facilitate the use of administrative data. If the evaluation pursues questions tied to these indicators, evaluation survey data will calculate both with these units and with the Common Indicators' units.
Water Supply Project

DWA P‐01 yes Monitoring Advanced Water Purification Plant Built
Output Advanced Water Purification Plant (AWPP) (contract package 2)
Date that construction of the Advanced Water Purification Plant is complete Date no disaggregation TBD MCA Once
WRA P‐04 Pending Monitoring Advanced Water Purification Plant Built
Output
Treatment process units within centralized water or wastewater treatment facilities constructed, rehabilitated, or expanded
The number of treatment process units within centralized water or wastewater treatment facilities constructed, rehabilitated, or expanded. The specific treatment process units for each centralized facility must be identified by the engineering expertise on the program.
Number Treatment facility type (Water/Wastewater)
TBD MCA Quarterly
DWA P‐04 yes MonitoringWater Production Capacity Added (Groundwater Wells)
Output Water production capacity added (groundwater wells)
The volume of water supply or production capacity added to the relevant water system, resulting from the groundwater wells. This additional water would be expected to flow into the distribution system.
Millions of cubic meters per year
no disaggregation TBD MCA Annual
DWA P‐06 Monitoring N/A (process indicator) Process Women in temporary employment (groundwater wells)
Percentage of temporary employment (DWA P‐05) that is female. DWA P‐05 (female disaggregation) divided by DWA P‐05 (total) expressed as a percentage.
Percentage no disaggregation TBD MCA Quarterly
DWA P‐05 Monitoring N/A (process indicator) ProcessTemporary employment generated in water and sanitation construction (groundwater wells)
The number of people temporarily employed or contracted by MCA‐ contracted construction companies to work on construction of the groundwater wells.
Number Sex TBD MCA Quarterly
WRA O‐01 yes Evaluation Released Groundwater For General Consumption
Outcome Groundwater for general consumption
Amount of recycled water released by the CHPP plants to USUG's general supply, measured in million cubic meters per year Millions of cubic meters per year
no disaggregation TBD Water Agency Other
This is expected to start in Year 10, so this is a post‐compact indicator.
WRA O‐02 yes MonitoringRecycled Water Supplied for CHP‐3 & CHP‐4 Industrial Use Outcome Recycled water for CHPP‐3 & CHPP‐4
Amount of recycled water provided annually to the CHPPplants from the MCC investment in wastewater recycling, measured in million cubic meters per year
Millions of cubic meters per year CHPP [CHPP‐3/CHPP‐4] TBD Water Agency Annual
WRA R‐E yes Evaluation Risk E: CHPP Plants Do Not Release Their Wells for Use by USUG
Risk/Assumption Risk E: CHPP wells for USUG CHPP Plants Release Their Wells for Use by USUG Date CHPP [CHPP‐3/CHPP‐4] TBD TBD Annual
This is expected to start in Year 10, so this is a post‐compact indicator.
WRA R‐D yes EvaluationRisk D: Required Connections are Not Built for USUG to Tap CHPP Wells Risk/Assumption
Risk D: connections for USUG to CHPP wells Required Connections are Built For USUG to Tap CHPP Wells Date CHPP [CHPP‐3/CHPP‐4] TBD TBD Annual
This is expected to start in Year 10, so this is a post‐compact indicator.
WRA P‐01 yes Monitoring Water Recycling Plant & Associated Infrastructure
Output Water production capacity added (water recycling plant)
The volume of water supply or production capacity added to the relevant water system, resulting from the water recycling plant. This additional water would be expected to flow into the distribution system.
Millions of cubic meters per year
no disaggregation TBD MCA Annual
WRA P‐03 Monitoring N/A (process indicator) ProcessWomen in temporary employment (wastewater recycling)
Percentage of temporary employment (WRA P‐02) that is female. WRA P‐02 (female disaggregation) divided by WRA P‐02 (total) expressed as a percentage. Percentage no disaggregation TBD MCA Quarterly
WRA P‐02 Monitoring N/A (process indicator) ProcessTemporary employment generated in water and sanitation construction (wastewater recycling)
The number of people temporarily employed or contracted by MCA‐ contracted construction companies to work on construction of the wastewater recycling plant. Number Sex TBD PMC Quarterly
WRA R‐F TBDRisk F: CWWTP is not replaced & effluent of adequate quality is not
Risk/Assumption TBD TBD no disaggregation TBD Authorised Agency (might be
WSA O‐01 yes Monitoring Decreased Annual Degradation of USUG Wells’ Capacity
Outcome Annual degradation of USUG wells’ capacity
Reduction in well capacity per year, expressed as current maxmimal withdrawals of all USUG wells divided by original capacity of all USUG wells divided by average age of USUG wells
Percentage no disaggregation TBD USUG Annual
WSA O‐02 TBD Planned Maintenance is Executed Outcome Execution of planned maintenance Percentage no disaggregation TBD USUG Annual
WSA O‐03 Pending Monitoring Increased O&M Cost Recovery Outcome Proportion of operating costs covered by revenue
Total annual operational revenues divided by total annual operating costs. (Note that maintenance is assumed to cover replacement as well, e.g.well motors.)
Percentage no disaggregation USUG annual report
USUG Annual
Mongolia Annex I: Indicator Documentation Table
Frequency of Reporting
Additional InformationNumber CI CodeCBA Linkage? [Definition &
Targets from CBA]
Evaluation or Monitoring Indicator?
Result in Project Logic Indicator Level Indicator Name Definition Unit of Measure DisaggregationPrimary Data
SourceResponsible Party
Activity 1: Downstream Wells
Activity 3: Sustainability
Activity 2: Wastewater Recycling

WSA O‐03.1 Monitoring N/A (sub‐indicator) Outcome Total annual operational revenue The monetary amount billed and collected annually by the utility for utility service rendered and for other services incidental thereto.
US dollars no disaggregation USUG annual report
USUG AnnualMust be reported in USD because it is a common indicator. Use exchange rate on the day the ITT is drafted, and specify exchange rate in the ITT comments.
WSA O‐03.2 Monitoring N/A (sub‐indicator) OutcomeTotal annual operational cost (including maintenance)
Annual expenses, including maintenance costs, and capital costs incurred as part of the water utility’s operations. (Note that maintenance is assumed to cover replacement as well, e.g.well motors.)
US dollars no disaggregationUSUG annual
report USUG AnnualSee above on exchange rate.
WSACR O‐04 Monitoring Cost Recovery Tariff Implemented OutcomeImplementation of cost recovery tariff Revenue From tariff covers USUG costs for operations, maintenance and depreciation Date no disaggregation
WSRC annual report
WSRC Once
WSACR O‐13 TBD
GoM Policy defines Affordability Outcome GoM policy on affordability
TBD TBD no disaggregation N/A N/A Other
WSACR O‐14 TBD
Consumer Subsidies made explicit Outcome Consumer subsidies made explicit TBD TBD
no disaggregation N/A N/A Other
WSACR O‐15 TBD
Targeted Water Service Affordability Outcome Targeted water service affordability TBD TBD
no disaggregation N/A N/A Other
WSACR P‐11 MonitoringAffordability and Customer Assistance Study Complete Output
Completion of affordability and customer assistance study The date by which the Affordability and Customer Assistance Study is complete and results are submitted to the Stakeholders Date no disaggregation TBD MCA Once
WSACR P‐02 Monitoring Tariff Options Studies Complete Output Tariff options studies The date by which the required water tariff rate cases are proposed by WSRC and accepted by MCC Date no disaggregation TBD MCA Once
WSAGA O‐05 yes MonitoringReduction in Water Kiosk Operation Costs For USUG Outcome
Total annual operational cost (including maintenance) to USUG of water kiosks in ger areas
Annual expenses, including maintenance costs, and capital costs incurred as part of the water utility’s operations of water kiosks in the ger areas of Ulaanbaatar. Tugrik (MNG) no disaggregation
USUG annual report USUG Annual
WSAGA O‐06 TBDUSUG’s Un‐Recovered Costs Reduced
Outcome TBD TBD TBD TBD TBD Other
WSAGA O‐07 TBD Stakeholder Institutions Coordinate to Reduce Costs
Outcome TBD TBD TBD TBD TBD Other
WSAGA P‐03 TBD Water Kiosk Improvements Output TBD TBD TBD TBD TBD Other
WSAGA P‐04 TBDPlan for Inter‐Institutional Coordination and Decision‐Making to Reduce Costs
Output TBD TBD TBD TBD TBD Other
WSAGA P‐02 Monitoring N/A (process indicator) ProcessTemporary employment generated in water and sanitation construction (ger infrastructure)
The number of people temporarily employed or contracted by MCA‐ contracted construction companies to work on construction of the ger infrastructure. Number Sex TBD MCA Quarterly
WSAUO O‐08 TBDUSUG Staff Capacity to Conduct O&M Improves Outcome TBD TBD TBD TBD TBD Other
WSAUO O‐11 TBDImprovement in Staff Capacity to Address Aquarating Outcome TBD TBD TBD TBD TBD Other
WSAUO O‐09 TBD USUG Weaknesses (As Uncovered by AquaRating) Addressed
Outcome TBD TBD TBD TBD TBD Other
WSAUO O‐10 TBD USUG Staff Capacity to Capture and Analyze Data Improves
Outcome TBD TBD TBD TBD TBD Other
WSAUO P‐05 Monitoring Training Through Twinning Output Number of trainings through partnership
# Of trips from partner utility to USUG and vice‐versa Number no disaggregation TBD TBD Annual
WSAUO P‐06 TBD Technical Assistance to Support Asset Management
Output TBD TBD TBD TBD TBD Other
WSAUO P‐07 TBDTechnical Assistance to Improve Capture and Analysis of Customer Data
Output TBD TBD TBD TBD TBD Other
WSAIP O‐11 Monitoring CWWTP Effluent Meets Treatment Standards
Outcome CWWTP effluent treatment standards
CWWTP Meets Mongolian National Standard 4943‐2015 Date no disaggregation TDB TDB Once
WSAIP P‐08 TBDTechnical Assistance to Strengthen Industrial Pollution Monitoring and Enforcement
Output TBD TBD TBD TBD TBD Other
Mongolia Annex I: Indicator Documentation Table
Number CI CodeCBA Linkage? [Definition &
Targets from CBA]
Evaluation or Monitoring Indicator?
Result in Project Logic Indicator Level Indicator Name Definition Unit of Measure DisaggregationPrimary Data
SourceResponsible Party
Frequency of Reporting
Additional Information
Number CI CodeCBA Linkage? [Definition &
Targets from CBA]
Evaluation or Monitoring Indicator?
Result in Project Logic Indicator Level Indicator Name Definition Unit of Measure DisaggregationPrimary Data
Source Responsible PartyFrequency of Reporting Additional Information
Sub‐Activity 3.2: Ger Area Cost Containment
Sub‐Activity 3.1: Cost Recovery
Sub‐Activity 3.4: Industrial Pre‐Treatment And Pollution Control
Sub‐Activity 3.3: Utility Operations

WSAPA O‐12 TBDIncreased Public Understanding of the Cost of Water Resources
Outcome TBD TBD TBD TBD TBD Other
WSAPA P‐09 TBD Public Communications Activities Output TBD TBD TBD TBD TBD OtherWSAPA P‐10 TBD Behavior Change Activities Output TBD TBD TBD TBD TBD Other
Mongolia Annex I: Indicator Documentation Table
Number CI CodeCBA Linkage? [Definition &
Targets from CBA]
Evaluation or Monitoring Indicator?
Result in Project Logic Indicator Level Indicator Name Definition Unit of Measure Disaggregation Primary Data Source
Responsible PartyFrequency of Reporting
Additional Information
Sub‐Activity 3.5: Public Awareness And Behavior Change

Year 1 Year 2 Year 3 Year 4 Year 5
April‐2021 to March 2022
April 2022 to March 2023
April 2023 to March 2024
April 2024 to March 2025
April 2025 to March 2026
OutcomeWater consumption by Ulaanbaatar residential consumers (aggregate)
Millions of cubic meters per year
Level 40.92 41.97 43.04 44.14 45.27 46.43 46.43
“Mongolia II – Bulk Water Supply Draft Investment Decision Report” (AECOM), December 2017, “UB Bulk Water Demand Projections” (Hazen) November 2016, and “2030 Water Resources Group Hydro‐economic Analysis on Cost‐Effective Solutions to Close Ulaanbaatar’s Future Water Gap – Final Report” (WRG 2016)”. Baseline demand is assumed to be total baseline consumption in the CBA (84.4 MCM). Residential consumption is assumed to be the same ratio as from the cited Water Resources Group report, page 10, mid‐point scenario 2021, “domestic demand”.
UB Bulk Water Demand Projections” (Hazen) November 2016. All water demand growth projections use the due diligence consultant’s low growth scenario, submitted to MCC in November 2016 in the file “UB Bulk Water Demand Projections”. Growth rate is calculated as the average growth for 2020‐2050, which equals 2.56%.
OutcomeWater consumption by Ulaanbaatar commercial and industrial users (aggregate)
Millions of cubic meters per year
Level 21.52 22.07 22.64 23.22 23.81 24.42 24.42 Same as above Same as above
Outcome Objective: additional demand metMillions of cubic meters per year
Percentage 0 0 0 0 0 1.63 1.63 N/AMongolia II – Bulk Water Supply Draft Investment Decision Report” (AECOM), December 2017 and “UB Bulk Water Demand Projections” (Hazen) November 2016.
Risk/AssumptionRisk C: consumption does not match projections
Millions of cubic meters per year
Level 84.41 85.80 86.72 88.42 90.16 91.40 91.40
Mongolia II – Bulk Water Supply Draft Investment Decision Report” (AECOM), December 2017 and “UB Bulk Water Demand Projections” (Hazen) November 2016. From the first cited report, Table 2‐1, current withdrawals = 76.7, plus 5.6 MCM in private wells (AECOM correspondence to MCC Economist), projected to baseline year using the growth calculations in the second footnote. Target value is projected in the same way.
Mongolia II – Bulk Water Supply Draft Investment Decision Report” (AECOM), December 2017 and “UB Bulk Water Demand Projections” (Hazen) November 2016.
Risk/Assumption Risk B: lost water (physical losses) Percentage Level 14% 14% 14% 14% 14% 14% 14%MCC Economist meetings w/WRSC where they reported 24.5% NRW, 14% of which were physical (estimated by MCC sector lead)
Assumed unchanged from baseline in CBA
Outcome Water supply in Ulaanbaatar systemMillions of cubic meters per year
Level 84.41 85.65 84.62 83.59 82.58 91.40 91.40
Mongolia II – Bulk Water Supply Draft Investment Decision Report” (AECOM) and “UB Bulk Water Demand Projections” (Hazen) November 2016. At baseline, supply is assumed to match demand. See footnote 4 for calculations. Technical losses are assumed to occur mainly at pumping.
Existing Capacity +Water withdrawn from MCC well fields”
Supplied water volume Level
Risk/Assumption Risk A1: external water supply capacityMillions of cubic meters per year
Level 86.70 83.59 82.58 81.58 80.60 79.62 79.62Mongolia II – Bulk Water Supply Draft Investment Decision Report” (AECOM), December 2017 and “UB Bulk Water Demand Projections
Same as baseline
Risk/Assumption Risk A2: external water supply withdrawalsMillions of cubic meters per year
Level 86.70 83.59 82.58 81.58 80.60 79.62 79.62Mongolia II – Bulk Water Supply Draft Investment Decision Report” (AECOM), December 2017 and “UB Bulk Water Demand Projections
Same as baseline (A1 and A2 have same baselines and targets because the CBA assumes they are the same, and they stay the same)
ProcessTemporary employment generated in water and sanitation construction
Number Cumulative N/A
Output Additional water production capacity Millions of liters/day Level 0 0 0 0 0
Value: 50 (Biokombinat
= 25;Shuvuun = 25)
Value: 50 (Biokombinat= 25;
Shuvuun = 25)
Deliverable 2 Technical Memorandum: Groundwater Modeling – Western Wellfields”, AECOM, March 12, 2018, Table 1, Page 2
Outcome AWPP water Millions of cubic meters per year
Level N/A 0 0 0 0 TBD TBD
OutputAdvanced Water Purification Plant (AWPP) (contract package 2)
Date Date N/A N/A N/A N/A N/A 30‐Mar‐26 30‐Mar‐26 Project plans
OutputTreatment process units within centralized water or wastewater treatment facilities constructed, rehabilitated, or expanded
Number Cumulative 0
MongoliaAnnex II: Table of Indicator Baselines and Targets
Indicator Level Indicator Name Unit of MeasureIndicator
Classification
Baseline in Compact Agreement(2018)
End of Compact TargetIf definition and/or baseline value are TBD, expected timeline for completion
Water Supply Project
Activity 1: Downstream Wells
Baseline Source Target Source

Year 1 Year 2 Year 3 Year 4 Year 5
April‐2021 to March 2022
April 2022 to March 2023
April 2023 to March 2024
April 2024 to March 2025
April 2025 to March 2026
ProcessWomen in temporary employment (groundwater wells)
Percentage Level N/A 30% 30% MCC GSI
ProcessTemporary employment generated in water and sanitation construction (groundwater wells)
Number Cumulative N/A
Outcome Groundwater for general consumptionMillions of cubic meters per year
Level 0 0 0 0 0 0 0.0 Tetra Tech Feasibility Study Report “MCC Mongolia II Water Recycling Project”, page 12
Outcome Recycled water for CHPP‐3 & CHPP‐4 Millions of cubic meters per year
Level 0 0 0 0 0 14.60 14.60 Tetra Tech Feasibility Study Report “MCC Mongolia II Water Recycling Project”, page 12
Risk/Assumption Risk E: CHPP wells for USUG Date Date N/A N/A N/A N/A N/A N/A N/A (Target is Year 10) Assumption in MCC CBA
Risk/Assumption Risk D: connections for USUG to CHPP wells Date Date N/A N/A N/A N/A N/A N/A N/A (Target is Year 10) Assumption in MCC CBA
OutputWater production capacity added (water recycling plant)
Millions of cubic meters per year
Level 0 0 0 0 0 14.60 14.60Tetra Tech Feasibility Study Report “MCC Mongolia II Water Recycling Project”, Page 26.
ProcessWomen in temporary employment (wastewater recycling)
Percentage Level N/A 30% 30% MCC GSI
ProcessTemporary employment generated in water and sanitation construction (wastewater recycling)
Number Cumulative N/A
Q3 2021
Outcome Annual degradation of USUG wells’ capacity Percentage Level 1.21% 0.20% 0.20%
MCC’s economist calculates that baseline max well withdrawal capacity is 110 mcm, but they are only withdrawing 76.7 mcm. Wells are about 35 years old, no degradation for the first five years is assumed.
MCC CBA assumption
Outcome Execution of planned maintenance Percentage Level TBD 100% 100% 2022Q4
OutcomeProportion of operating costs covered by revenue
Percentage Level TBD 100% 100%MCC CBA assumption
Outcome Total annual operational revenue US dollars Level TBD No target No target No target No target No target No target
Outcome Implementation of cost recovery tariff Date Date N/A N/A: Year 62024 Q1 MCC CBA Assumption
Output Completion of willingness to pay study Date Date N/A 31‐Mar‐21 31‐Mar‐21 MCC GSI Intervention PlanN/A TBD TBD N/A TBD 2021 Q4 TBDN/A TBD TBD N/A TBD 2021 Q4 TBDN/A TBD TBD N/A TBD 2021 Q4 TBDN/A Date Date N/A 31‐Mar‐22 31‐Mar‐22 TBD
Output Tariff options studies Date Date N/A 31‐Mar‐21 31‐Mar‐21 MCC GSI Intervention Plan
OutcomeTotal annual operational cost (including maintenance) to USUG of water kiosks in ger areas
Tugrik (MNG) Cumulative TBD TBD
2022 Q3Outcome TBD TBD TBD 2023 Q3Outcome TBD TBD TBD 2022 Q3Output TBD TBD TBD 2022 Q4Output TBD TBD TBD 2023 Q1
ProcessTemporary employment generated in water and sanitation construction (ger infrastructure)
Number Cumulative
Outcome TBD TBD TBD 2023Q1Outcome TBD TBD TBD 2020Q4Outcome TBD TBD TBD 2020Q4Outcome TBD TBD TBD 2023Q1
Output TBD TBD TBD2023 Q1
Output TBD TBD TBD 2022Q2
Outcome CWWTP effluent treatment standards Date Date TBD N/A N/A N/A N/A 30‐Mar‐26 30‐Mar‐26Output TBD TBD TBD 2021Q4
Outcome TBD TBD TBD 2022 Q2Output TBD TBD TBD 2022 Q2Output TBD TBD TBD 2022 Q2
Target Source
MongoliaAnnex II: Table of Indicator Baselines and Targets
End of Compact TargetIf definition and/or baseline value are TBD, expected timeline for completion
Baseline Source
Baseline in Compact Agreement(2018)
Indicator Level Indicator Name Unit of MeasureIndicator
Classification
Sub‐Activity 3.5: Public Awareness And Behavior Change
Sub‐Activity 3.4: Industrial Pre‐Treatment And Pollution Control
Activity 2: Wastewater Recycling
Sub‐Activity 3.2: Ger Area Cost Containment
Sub‐Activity 3.3: Utility Operations
Sub‐Activity 3.1: Cost Recovery
Activity 3: Sustainability

60
ANNEX III: M&E PLAN MODIFICATIONS
Note: MCC WASH common indicators were revised between compact signing and first M&E Plan
Water consumption by Ulaanbaatar residential consumers (aggregate) Project: Water Supply Project Activity: N/A Sub-Activity: N/A
Jun-21
Change Description: Target Modification Revised Target 46.4
Previous Target 47.61 Justification: Corrections to erroneous data Justification Description:
Previous target was a mistake, accidentally drew from Year 6 of CBA.
Water consumption by Ulaanbaatar commercial and industrial users (aggregate) Project: Water Supply Project Activity: N/A Sub-Activity: N/A
Jun-21
Change Description: Target Modification Justification: Corrections to erroneous data
Revised Target 24.4 Previous Target 25.05
Justification Description:
Previous target was a mistake, accidentally drew from Year 6 of CBA.
Objective: additional demand met Project: Water Supply Project Activity: N/A Sub-Activity: N/A
Jun-21
Change Description: Indicator definition modification Justification: Corrections to erroneous data Justification Description:
Correcting mistake to align with CBA as required and capture the project’s intended result.
Risk C: consumption does not match projections Project: Water Supply Project

61
Activity: N/A Sub-Activity: N/A
Jun-21
Change Description: Indicator definition modification Justification: Corrections to erroneous data
Justification Description:
Indicator definition was a mistake – we want to compare actual consumption to targets (or rather, assumptions), we don’t need an indicator for the targets themselves.
Jun-21
Change Description: Target Modification
Justification: Corrections to erroneous data
Revised Target 91.4 Previous Target 93.387747
Justification Description:
Previous target was mistake, accidentally drew from Year 6 of CBA.
Risk B: lost water (physical losses) Project: Water Supply Project Activity: N/A Sub-Activity: N/A
Jun-21
Change Description: Indicator definition modification Justification: Corrections to erroneous data Justification Description:
Added necessary detail and incorporated detail from the Economist.
Water supply in Ulaanbaatar system Project: Water Supply Project Activity: N/A Sub-Activity: N/A
Jun-21
Change Description: Indicator definition modification Justification: Corrections to erroneous data Justification Description:
Added necessary detail.
Jun-21
Change Description: Target Modification
Justification: Corrections to erroneous data
Revised Target 91.4

62
Previous Target 88.334631
Justification Description:
Previous target was mistake, accidentally drew from Year 6 of CBA.
Risk A1: external water supply capacity Project: Water Supply Project Activity: N/A Sub-Activity: N/A
Jun-21
Change Description: Target Modification Justification: Corrections to erroneous data
Revised Target 79.6 Previous Target 86.70
Justification Description:
Previous target was a mistake, accidentally drew from Year 6 of CBA.
Jun-21
Change Description: Indicator definition modification
Justification: Corrections to erroneous data
Justification Description: Added necessary detail.
Risk A2: external water supply withdrawals Project: Water Supply Project Activity: N/A Sub-Activity: N/A
Jun-21
Change Description: New Indicator Justification: Existing indicators do not sufficiently meet adequacy criteria Justification Description: Indicator necessary to contextualize objective indicator
Wellfields water Project: Water Supply Project Activity: N/A Sub-Activity: N/A
Jun-21
Change Description: Indicator definition modification Justification: Corrections to erroneous data
Revised Target 1.6 Previous Target 1.634631

63
Justification Description: Added necessary detail.
Temporary employment generated in water and sanitation construction Project: Water Supply Project Activity: N/A Sub-Activity: N/A
Jun-21
Change Description: New Indicator Justification: MCC requires new common indicator
Justification Description:
Indicator added to match MCC common indicators (needed new indicator to sum across two activities to match common indicator definition.
Additional water production capacity Project: Water Supply Project Activity: N/A Sub-Activity: N/A
Jun-21
Change Description: New Indicator Justification: MCC requires new common indicator Justification Description: Added applicable common indicator.
Advanced Water Purification Plant (AWPP) (contract package 2) Project: Water Supply Project Activity: Downstream Wells Sub-Activity: N/A
Jun-21
Change Description: Indicator definition modification Justification: Corrections to erroneous data Justification Description: Added necessary detail.
Treatment process units within centralized water or wastewater treatment facilities constructed, rehabilitated, or expanded Project: Water Supply Project Activity: Downstream Wells Sub-Activity: N/A
Jun-21 Change Description: New Indicator Justification: MCC requires new common indicator

64
Justification Description: Added applicable common indicator.
Temporary employment generated in water and sanitation construction (groundwater wells) Project: Water Supply Project Activity: Downstream Wells Sub-Activity: N/A
Jun-21
Change Description: New Indicator Justification: MCC requires new common indicator Justification Description:
Added this indicator to match common indicators (needed one indicator that sums this across activities).
Water production capacity added (groundwater wells) Project: Water Supply Project Activity: Downstream Wells Sub-Activity: N/A
Jun-21
Change Description: Indicator definition modification Justification: Corrections to erroneous data Justification Description:
Edited to align with common indicators (this isn’t a common indicator itself but is summed into one).
Groundwater for general consumption Project: Water Supply Project Activity: Wastewater Recycling Sub-Activity: N/A
Jun-21
Change Description: Target modification Justification: Corrections to erroneous data
Revised Target 0 Previous Target 14.6
Justification Description:
This was a mistake – the water isn’t expected to be needed until Year 10.
Recycled water for CHPP-3 & CHPP-4 Project: Water Supply Project Activity: Wastewater Recycling Sub-Activity: N/A
Jun-21 Change Description: Indicator definition modification

65
Justification: Corrections to erroneous data Justification Description: Clarified this is an annual number.
Annual degradation of USUG wells’ capacity Project: Water Supply Project Activity: Sustainability Sub-Activity: N/A
Jun-21
Change Description: Indicator definition modification Justification: Corrections to erroneous data Justification Description: Added necessary detail.
Proportion of operating costs covered by revenue Project: Water Supply Project Activity: Sustainability Sub-Activity: N/A
Jun-21 Change Description: Indicator definition modification Justification: Corrections to erroneous data
Water production capacity added (water recycling plant) Project: Water Supply Project Activity: Wastewater Recycling Sub-Activity: N/A
Jun-21
Change Description: Unit change Justification: Corrections to erroneous data
Revised Unit Million cubic meters/year Previous Unit Cubic meters per day
Justification Description:
Clarified this is an annual number.
Jun-21
Change Description: Target modification
Justification: Corrections to erroneous data
Revised Target 14.6
Previous Target 50,000 Justification Description: Corresponding to change in units.

66
Justification Description: Changed to match revised common indicator.
Completion of willingness to pay study Project: Water Supply Project Activity: Sustainability Sub-Activity: Cost Recovery
Jun-21
Change Description: Indicator definition modification Justification: Corrections to erroneous data Justification Description: Added necessary detail.
GoM Policy on Affordability Project: Water Supply Project Activity: Sustainability Sub-Activity: Cost Recovery
Jun-21
Change Description: New Indicator Justification: Existing indicators do not sufficiently meet adequacy criteria Justification Description: Added to more accurately reflect details of project design.
Consumer subsidies made explicit Project: Water Supply Project Activity: Sustainability Sub-Activity: Cost Recovery
Jun-21
Change Description: New Indicator Justification: Existing indicators do not sufficiently meet adequacy criteria Justification Description: Added to more accurately reflect details of project design.
Targeted water service affordability Project: Water Supply Project Activity: Sustainability Sub-Activity: Cost Recovery
Jun-21
Change Description: New Indicator Justification: Existing indicators do not sufficiently meet adequacy criteria Justification Description: Added to more accurately reflect details of project design.

67
Tariff options studies Project: Water Supply Project Activity: Sustainability Sub-Activity: Cost Recovery
Jun-21
Change Description: Indicator definition modification Justification: Corrections to erroneous data Justification Description: Added necessary detail.
Total annual operational cost (including maintenance) to USUG of water kiosks in ger areas Project: Water Supply Project Activity: Sustainability Sub-Activity: Ger Area Cost Containment
Jun-21
Change Description: Indicator definition modification Justification: Corrections to erroneous data Justification Description: Added necessary detail.
TBD Project: Water Supply Project Activity: Sustainability Sub-Activity: Utility Operations
Jun-21
Change Description: New Indicator Justification: Existing indicators do not sufficiently meet adequacy criteria Justification Description:
Was missing from compact annex III but always in program logic.
AWPP Water Project: Water Supply Project Activity: N/A Sub-Activity: N/A
Jun-21
Change Description: New Indicator
Justification: Existing indicators do not sufficiently meet adequacy criteria
68
Justification Description:
Realized that the output to the USUG system will be less than that withdrawn from wells, this indicator added to take account of that