migration notes. ravenstein’s laws of migration british sociologist (1834 – 1913) laws of...
TRANSCRIPT
MIGRATION NOTES
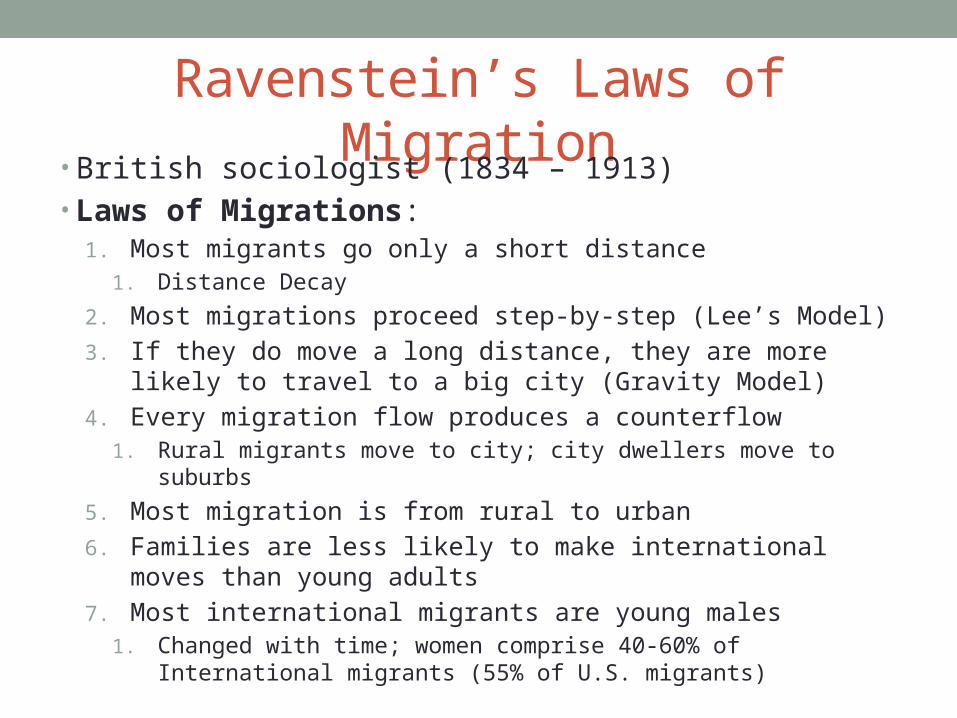
Ravenstein’s Laws of Migration• British sociologist (1834 – 1913)• Laws of Migrations:
1. Most migrants go only a short distance1. Distance Decay
2. Most migrations proceed step-by-step (Lee’s Model)
3. If they do move a long distance, they are more likely to travel to a big city (Gravity Model)
4. Every migration flow produces a counterflow1. Rural migrants move to city; city dwellers move to suburbs
5. Most migration is from rural to urban
6. Families are less likely to make international moves than young adults
7. Most international migrants are young males1. Changed with time; women comprise 40-60% of International
migrants (55% of U.S. migrants)
Why?• Most people migrate for ECONOMIC reasons
• New jobs• Better wages• Escape poverty• Find higher standard of living
• Push and Pull factors• Push us from one location• Pull us to another
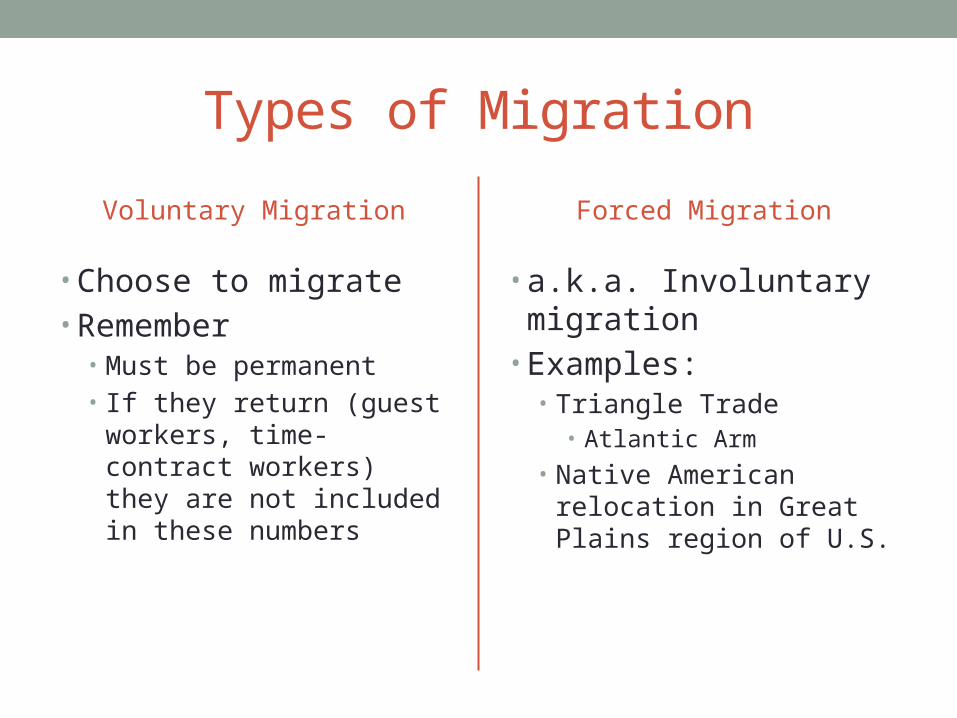
Types of Migration
Voluntary Migration
• Choose to migrate• Remember
• Must be permanent• If they return (guest workers,
time-contract workers) they are not included in these numbers
Forced Migration
• a.k.a. Involuntary migration
• Examples:• Triangle Trade
• Atlantic Arm
• Native American relocation in Great Plains region of U.S.
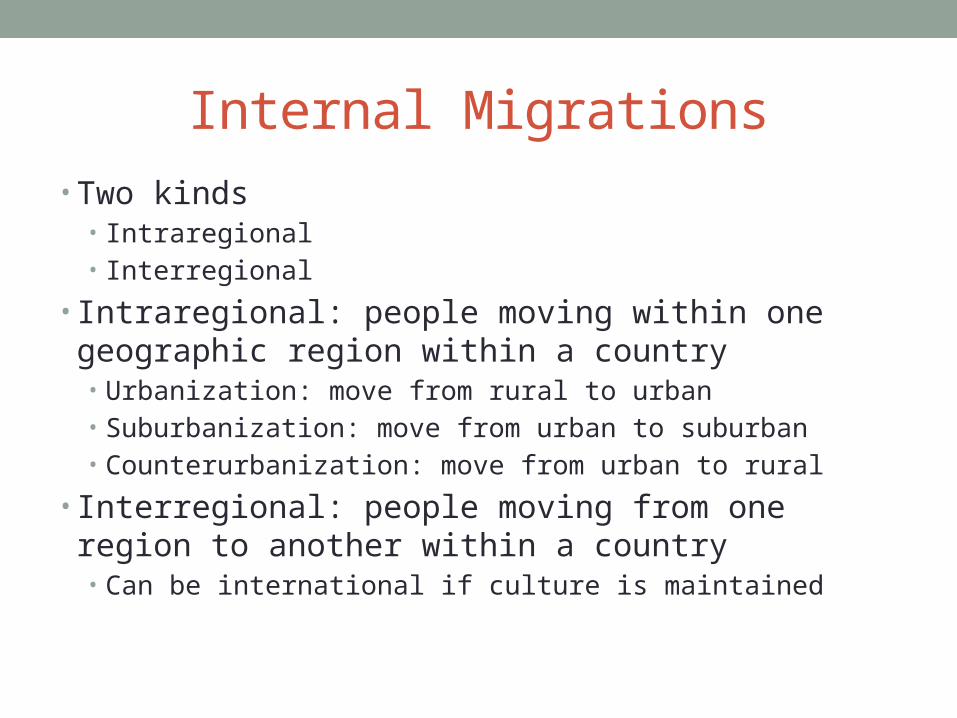
Internal Migrations• Two kinds
• Intraregional• Interregional
• Intraregional: people moving within one geographic region within a country• Urbanization: move from rural to urban• Suburbanization: move from urban to suburban• Counterurbanization: move from urban to rural
• Interregional: people moving from one region to another within a country• Can be international if culture is maintained
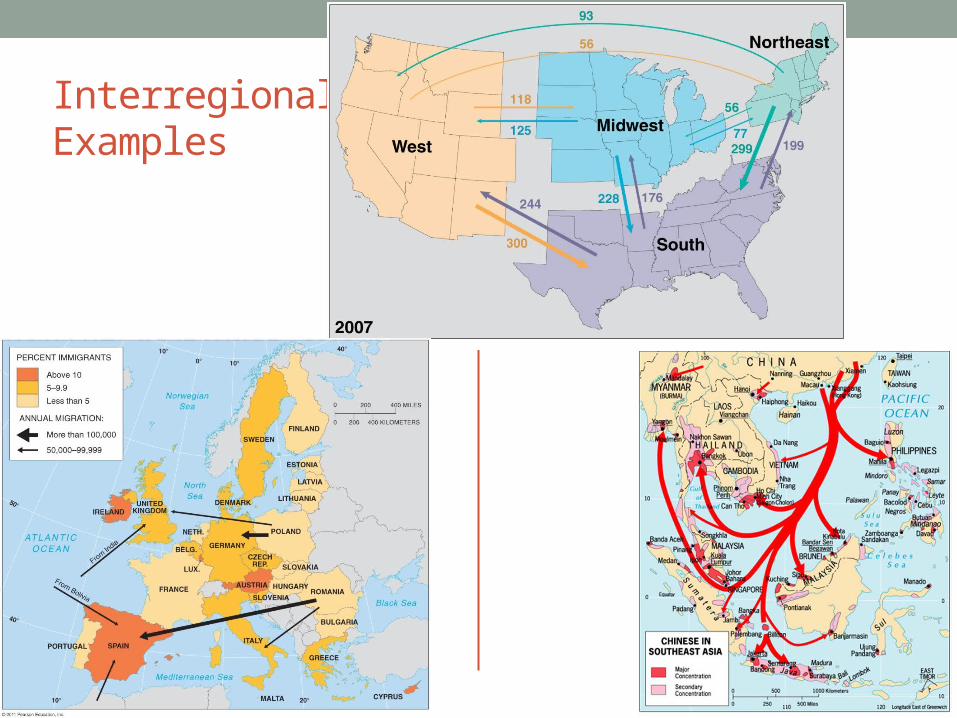
Interregional Examples
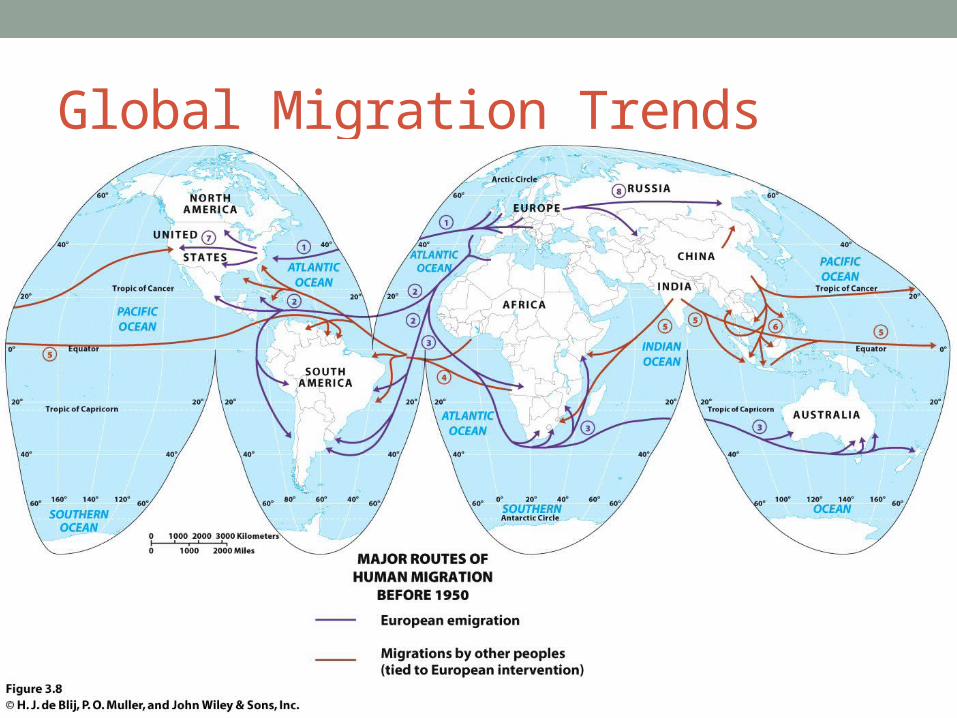
Global Migration Trends
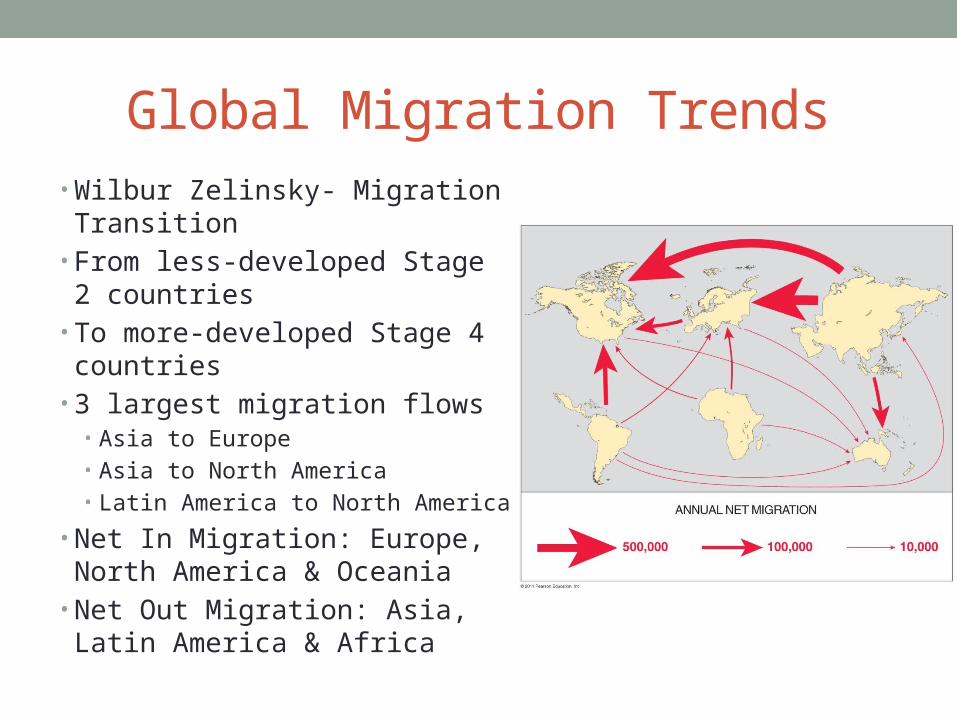
Global Migration Trends• Wilbur Zelinsky- Migration
Transition• From less-developed Stage 2
countries• To more-developed Stage 4
countries• 3 largest migration flows
• Asia to Europe• Asia to North America• Latin America to North America
• Net In Migration: Europe, North America & Oceania
• Net Out Migration: Asia, Latin America & Africa
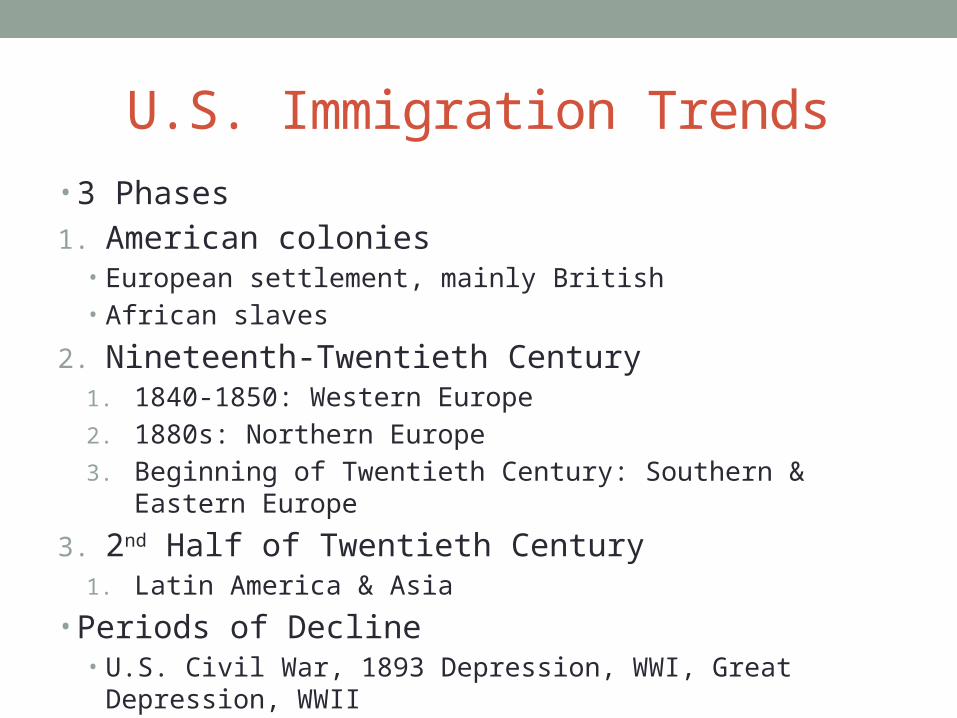
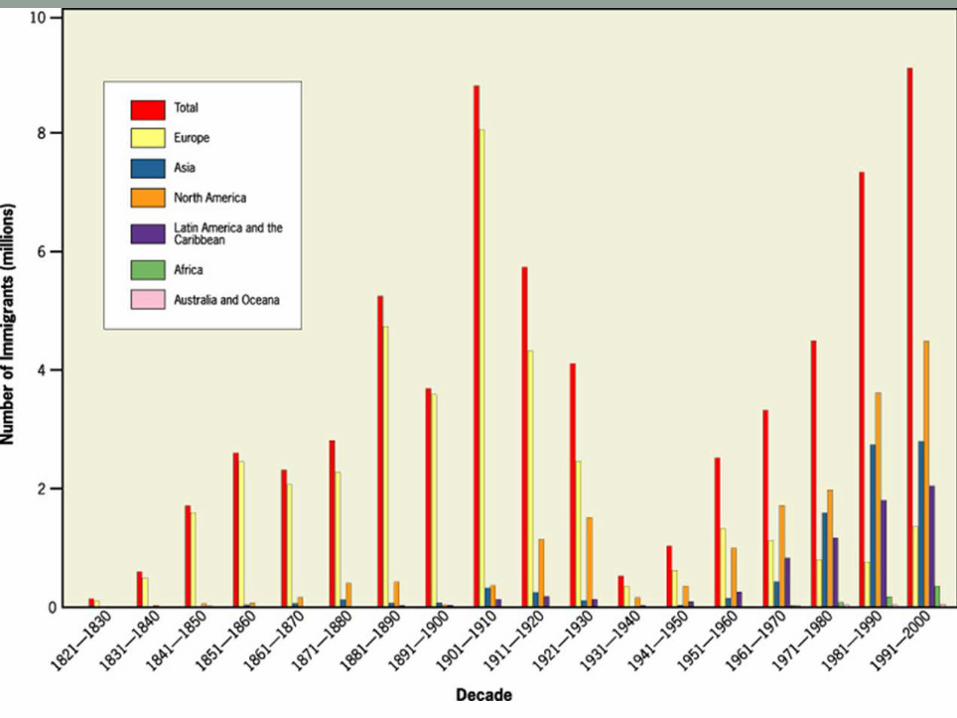
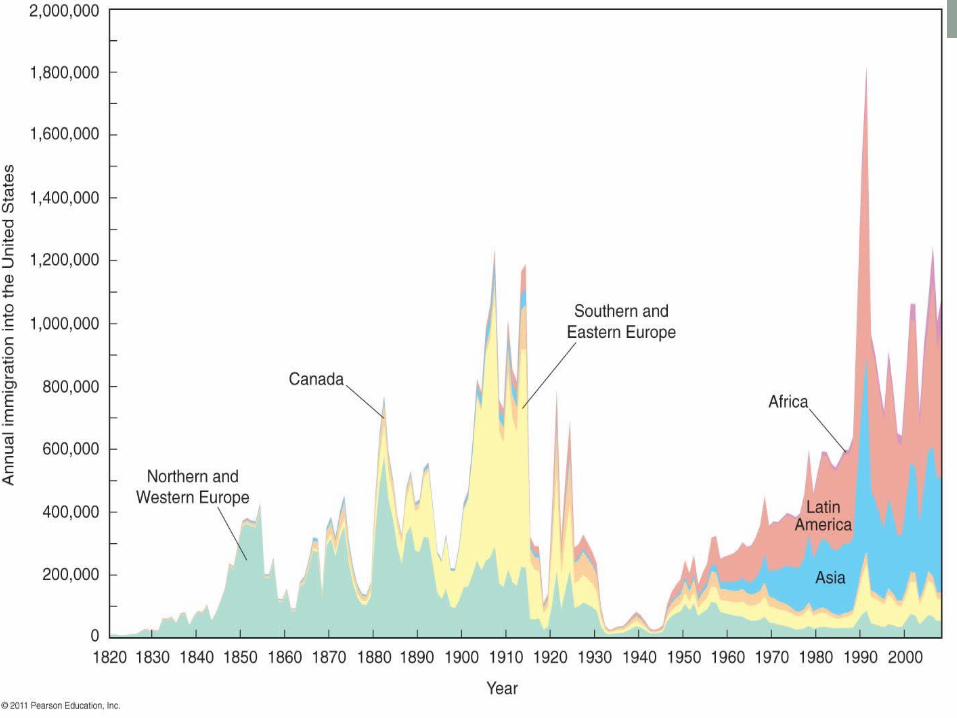
U.S. Immigration Trends• 3 Phases
1. American colonies• European settlement, mainly British• African slaves
2. Nineteenth-Twentieth Century1. 1840-1850: Western Europe
2. 1880s: Northern Europe
3. Beginning of Twentieth Century: Southern & Eastern Europe
3. 2nd Half of Twentieth Century1. Latin America & Asia
• Periods of Decline• U.S. Civil War, 1893 Depression, WWI, Great Depression, WWII
Refugees• UN reports 24 million refugees worldwide
• Numbers vary a lot
• Two types• International refugees
• Crossed one or more international borders and are in a country other than their own
• Intranational• Abandoned their homes but not their homeland
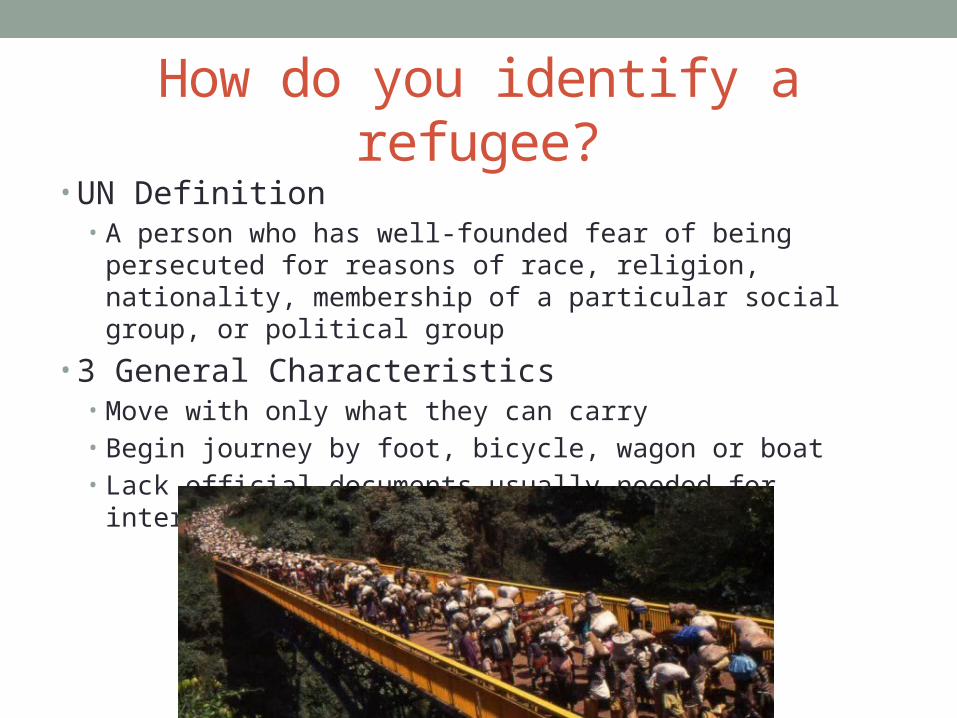
How do you identify a refugee?• UN Definition
• A person who has well-founded fear of being persecuted for reasons of race, religion, nationality, membership of a particular social group, or political group
• 3 General Characteristics• Move with only what they can carry• Begin journey by foot, bicycle, wagon or boat• Lack official documents usually needed for international migration
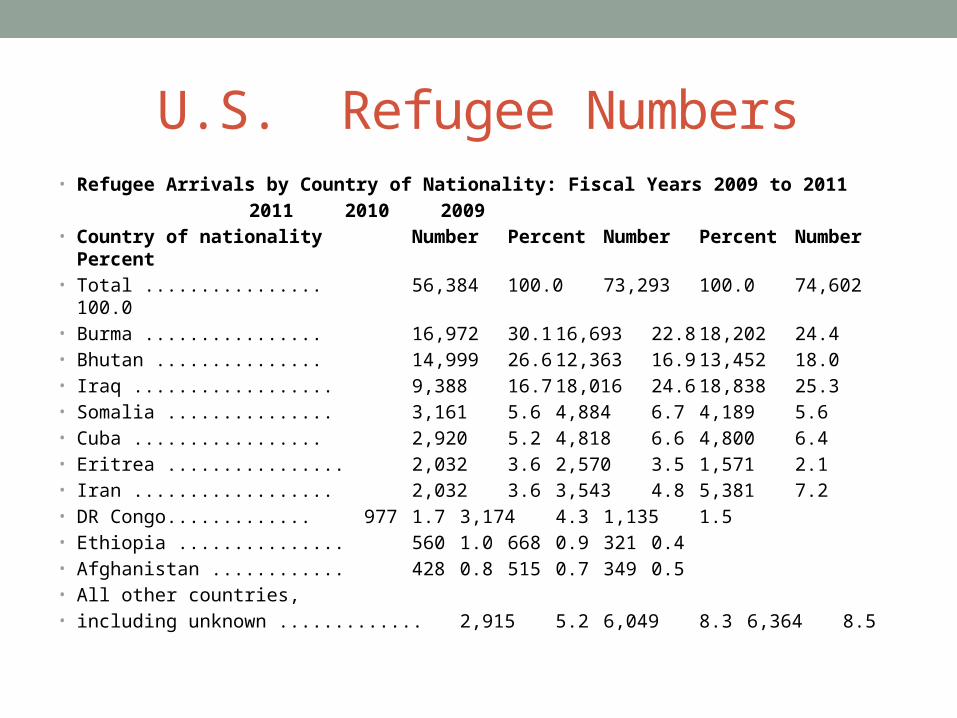
U.S. Refugee Numbers• Refugee Arrivals by Country of Nationality: Fiscal Years 2009 to 2011
2011 2010 2009• Country of nationality Number Percent Number Percent Number Percent • Total ................ 56,384 100.0 73,293 100.0 74,602 100.0• Burma ................ 16,972 30.1 16,693 22.8 18,202 24.4• Bhutan ............... 14,999 26.6 12,363 16.9 13,452 18.0• Iraq .................. 9,388 16.7 18,016 24.6 18,838 25.3• Somalia ............... 3,161 5.6 4,884 6.7 4,189 5.6• Cuba ................. 2,920 5.2 4,818 6.6 4,800 6.4• Eritrea ................ 2,032 3.6 2,570 3.5 1,571 2.1• Iran .................. 2,032 3.6 3,543 4.8 5,381 7.2• DR Congo............. 977 1.7 3,174 4.3 1,135 1.5• Ethiopia ............... 560 1.0 668 0.9 321 0.4• Afghanistan ............ 428 0.8 515 0.7 349 0.5• All other countries, • including unknown ............. 2,915 5.2 6,049 8.3 6,364 8.5
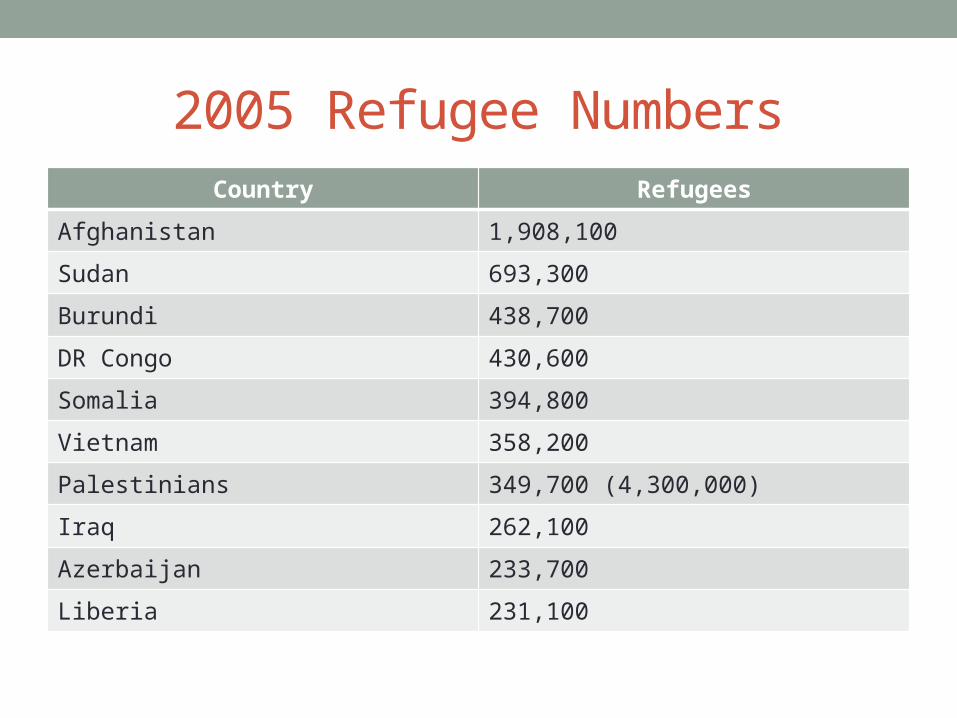
2005 Refugee NumbersCountry Refugees
Afghanistan 1,908,100
Sudan 693,300
Burundi 438,700
DR Congo 430,600
Somalia 394,800
Vietnam 358,200
Palestinians 349,700 (4,300,000)
Iraq 262,100
Azerbaijan 233,700
Liberia 231,100
Examples • Syrian Refugees• Civil Wars in Liberia, Sierra Leone, Angola, & Sudan• Ethnic war between Hutu & Tutsi tribes in Rwanda
• Has spilled over into DR Congo & Burundi
• Displacement due to ongoing dispute between Israelis & Palestinians
• Afghanistan• Due to Taliban rule• Soviet Invasion in 1970-80s• U.S. involvement during 2000s
• “Boat People” who fled Communist rule in Vietnam
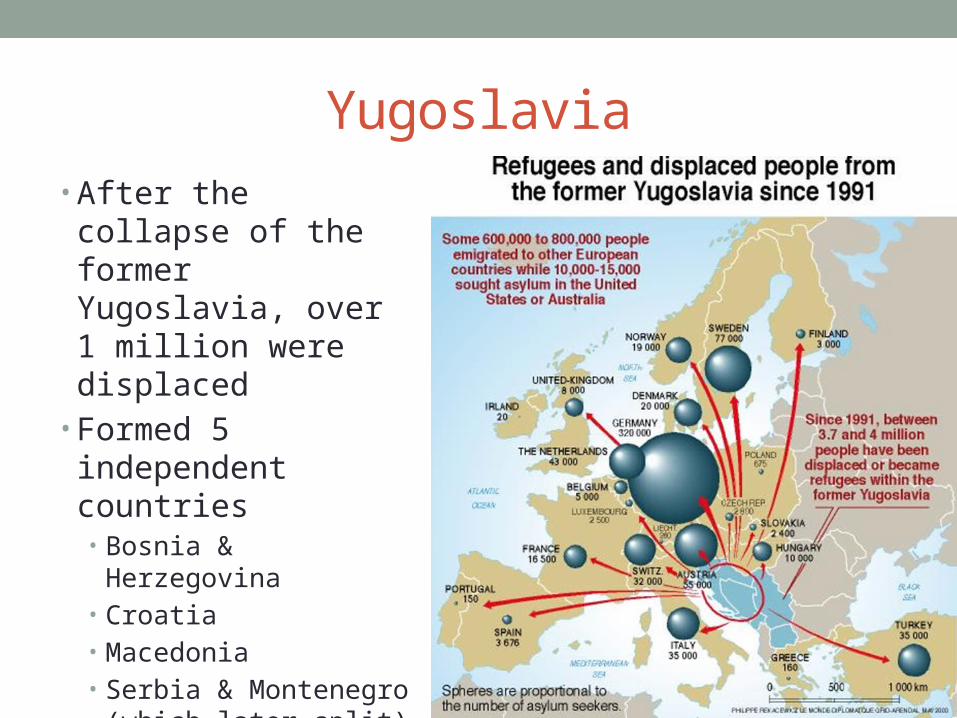
Yugoslavia• After the collapse of the
former Yugoslavia, over 1 million were displaced
• Formed 5 independent countries• Bosnia & Herzegovina• Croatia• Macedonia• Serbia & Montenegro
(which later split)• Slovenia
LEE’S MODEL OF MIGRATION

Key Terms• Push Factors• Pull Factors• Intervening Obstacle• Intervening Opportunity
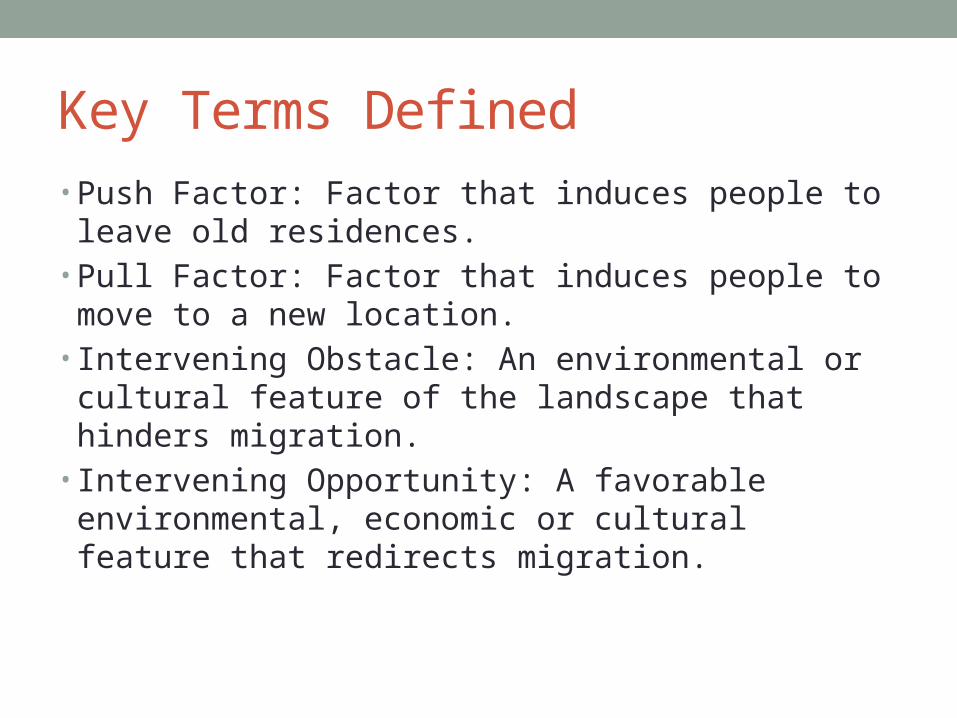
Key Terms Defined• Push Factor: Factor that induces people to leave old
residences.• Pull Factor: Factor that induces people to move to a new
location.• Intervening Obstacle: An environmental or cultural feature
of the landscape that hinders migration.• Intervening Opportunity: A favorable environmental,
economic or cultural feature that redirects migration.
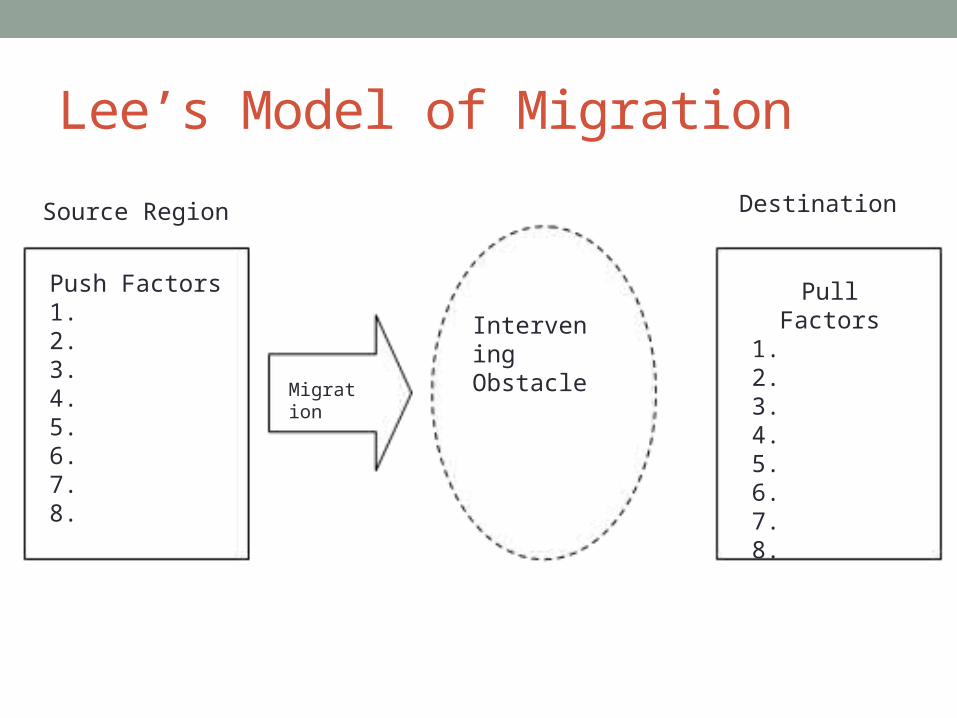
Lee’s Model of Migration
Push Factors1. 2. 3. 4. 5. 6. 7. 8.
Source Region
InterveningObstacle
Migration
Pull Factors1.2.3. 4.5.6. 7. 8.
Destination
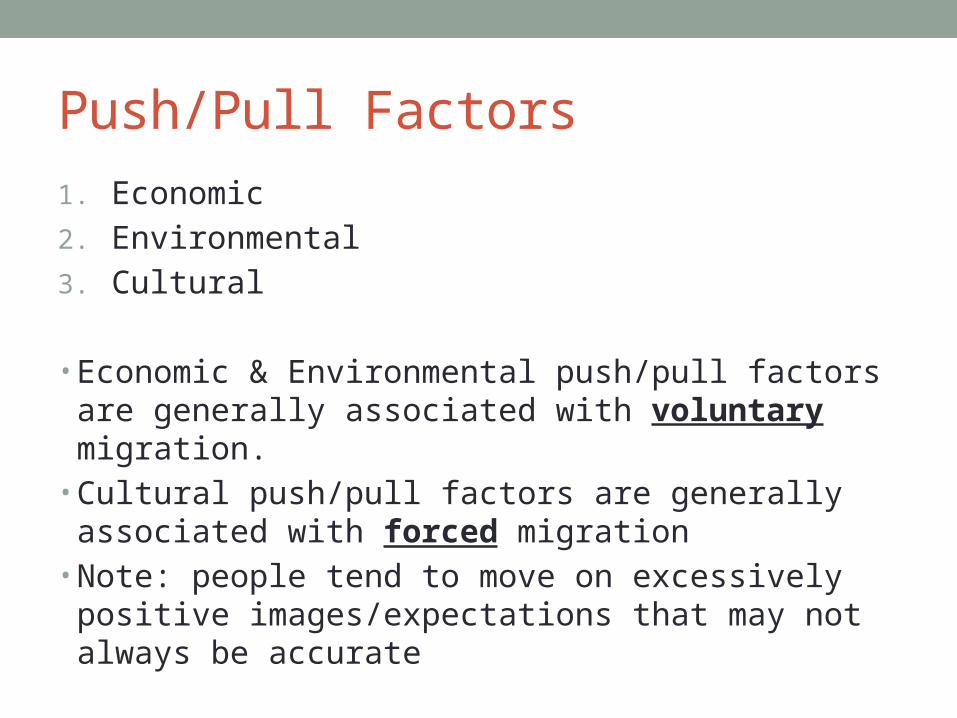
Push/Pull Factors
1. Economic
2. Environmental
3. Cultural
• Economic & Environmental push/pull factors are generally associated with voluntary migration.
• Cultural push/pull factors are generally associated with forced migration
• Note: people tend to move on excessively positive images/expectations that may not always be accurate
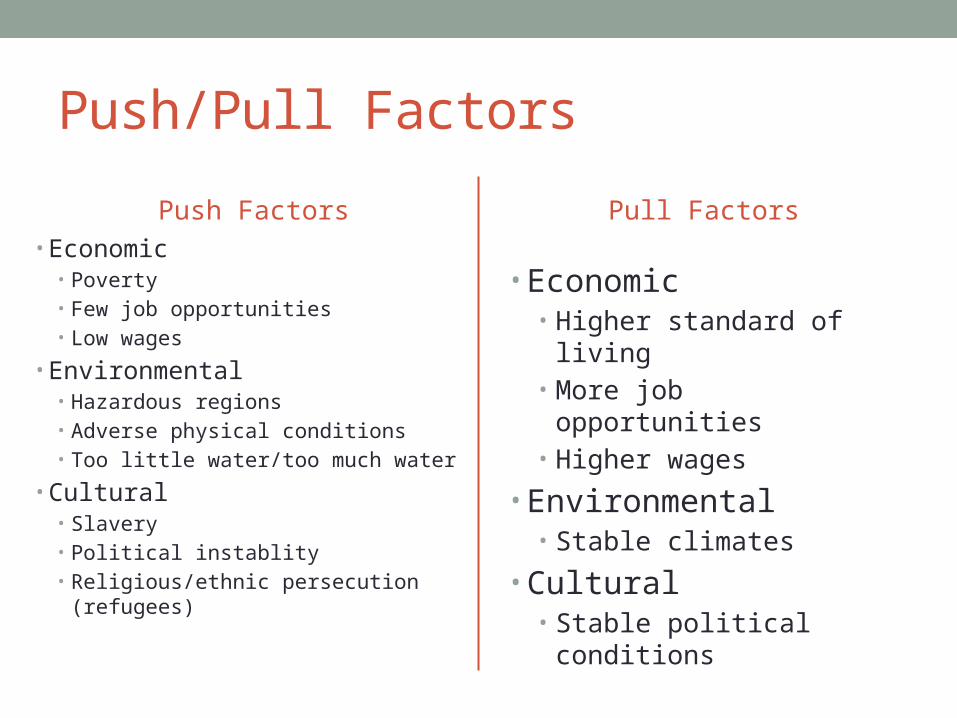
Push/Pull Factors
Push Factors• Economic
• Poverty• Few job opportunities• Low wages
• Environmental• Hazardous regions• Adverse physical conditions• Too little water/too much water
• Cultural• Slavery• Political instablity• Religious/ethnic persecution
(refugees)
Pull Factors
• Economic• Higher standard of living• More job opportunities• Higher wages
• Environmental• Stable climates
• Cultural• Stable political conditions
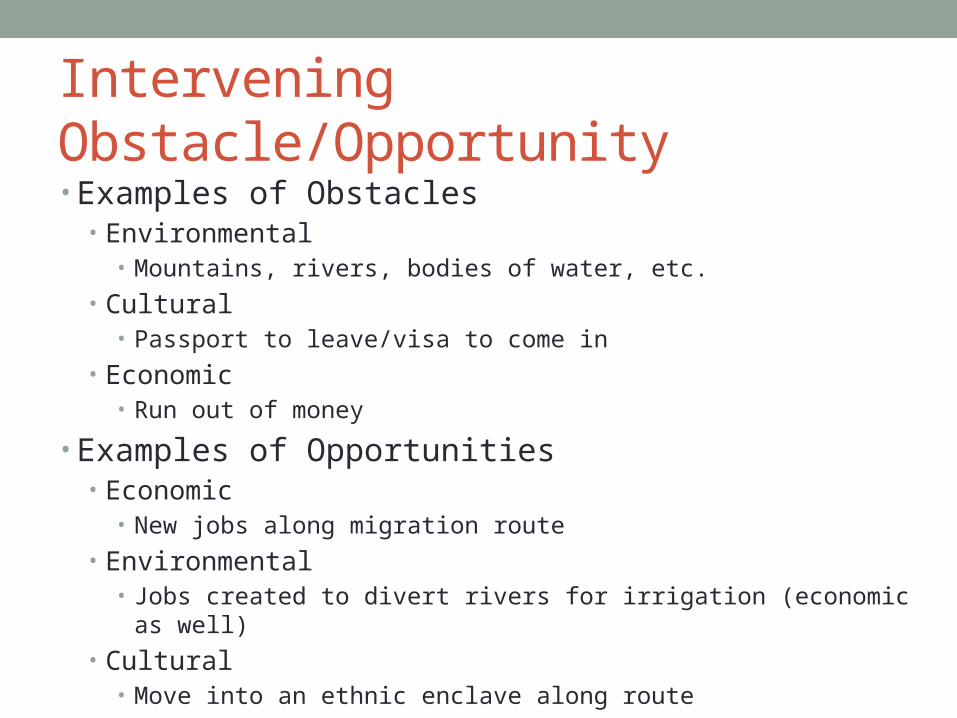
Intervening Obstacle/Opportunity• Examples of Obstacles
• Environmental• Mountains, rivers, bodies of water, etc.
• Cultural• Passport to leave/visa to come in
• Economic• Run out of money
• Examples of Opportunities• Economic
• New jobs along migration route
• Environmental• Jobs created to divert rivers for irrigation (economic as well)
• Cultural• Move into an ethnic enclave along route
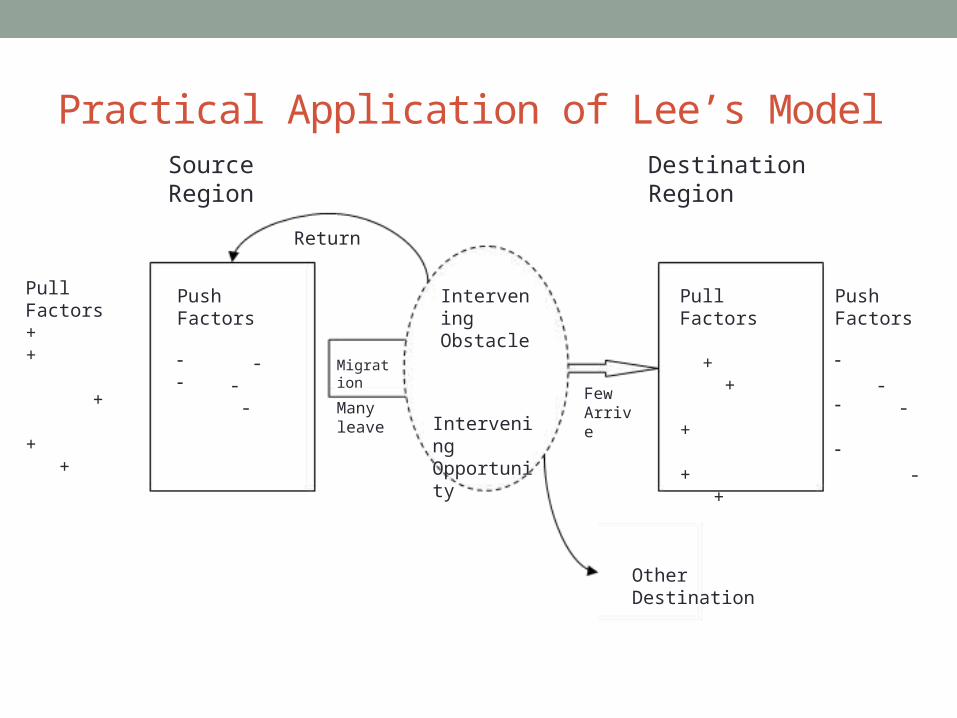
Practical Application of Lee’s ModelSource Region
Destination Region
Push Factors
- -- - -
Pull Factors
+ + +
+ +
Migration
Intervening Obstacle
Pull Factors+ +
+
+ +
Push Factors
- -- - - -
Return
Other Destination
Intervening Opportunity
Few ArriveMany
leave
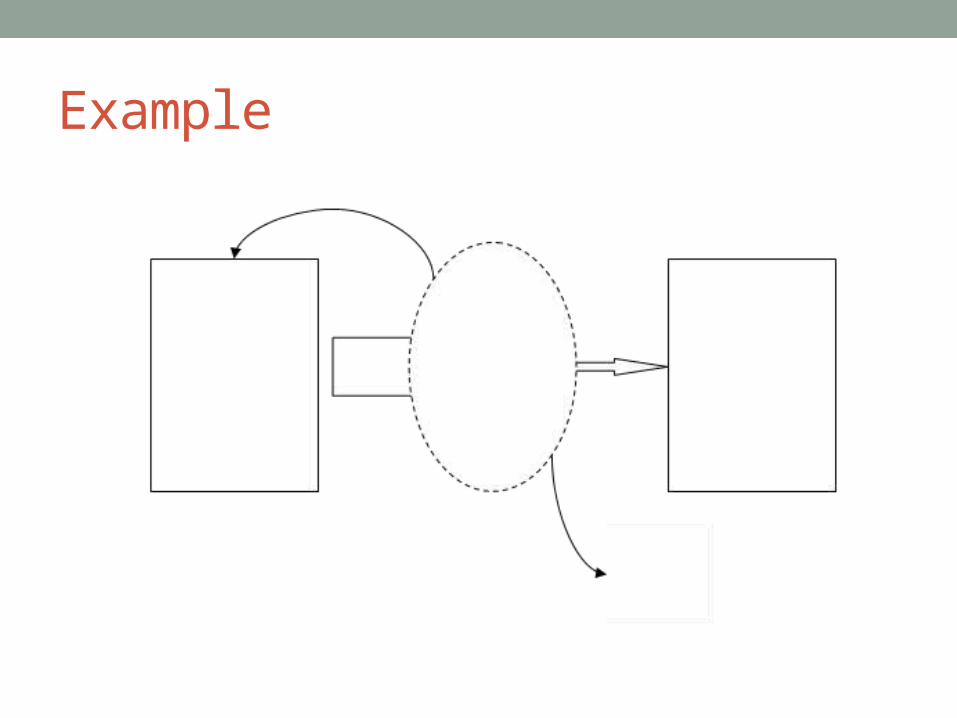
Example