migrating out of poverty? sector … fieldwork for the study was carried out by prakash kumar,...
TRANSCRIPT

MIGRATING OUT OF POVERTY?A STUDYOF MIGRANT CONSTRUCTION
SECTOR WORKERS IN INDIA

Institute for Human Development
The Institute for Human Development (IHD), a leading centre for studies onlabour markets, livelihoods and human development, aims to contribute tothe building of a society that fosters and values an inclusive social, economicand political system, free form poverty and deprivations. Towards achievingits goal, it engages in analytical and policy research, teaching and training,academic and policy debates, networking with other institutions and stake-holders, and publication and dissemination of the result of its activities. Themajor themes of current work of IHD are: poverty, inequality and well-being,labour markets and employment; social protection; women and children;marginalized social and economic groups and lagging regions; and governanceand institutions for human development.
The Authors
Ravi Srivastava is a Professor ofEconomics at the Centre for the Study ofRegional Development, Jawaharlal NehruUniversity, New Delhi.
Rajib Sutradhar completed his doctoral studies at the Centre for the Studiesof Regional Development, Jawaharlal Nehru University. He has also workedas a Research Associate in the Institute for Human Development, New Delhi.
MIGRATING OUT OF POVERTY?A STUDYOF MIGRANT CONSTRUCTION
SECTOR WORKERS IN INDIA
Ravi SrivastavaRajib Sutradhar
INSTITUTE FOR HUMAN DEVELOPMENTNew Delhi
www.ihdindia.org
2016
Published by:
Institute for Human DevelopmentNIDM Building, IIPA Campus, IP Estate, New Delhi-110002Phones: +91 – 11 23358166/23321610 Fax: +91 11 23765410Email: [email protected] Website: www.ihdindia.org
ISBN: 978-81-88315-55-0
Price: Rs. 300/- /US $ 40

ACKNOWLEDGEMENTS
This monograph is the result of a study carried out for a research programmeon Moving Out of Poverty of the University of Sussex and sponsored by theDFID (UK). A three-country study on the Impact of Migration to the ConstructionSector on Poverty was administratively coordinated by the Refugee andMigratory Movements Research Unit (RMRRU), Bangladesh and the India studywas part of this three-country study. The overall research programme wascoordinated by Priya Deshingkar at the University of Sussex. In India, this studywas housed with the Institute of Human Development (IHD), New Delhi. Weare grateful to DFID, RMRRU, and IHD for their support to the study and toPriya Deshingkar and other commentators of the draft study report for theirvarious suggestions.
The fieldwork for the study was carried out by Prakash Kumar, SubodhKumar, and Tirthankar Bhattacharya, while Prem Kant Mishra assisted withdata entry, We are grateful to them for their support. We are also grateful tomany others in the field areas, particularly the workers and their families whogave us their cooperation.
Rajib Sutradhar was the Research Associate in the study which wasdirected by Ravi Srivastava.


CONTENTS
Acknowledgements
Contents
List of Tables
1 Introduction 13
2 . Workers’ survey in the Delhi National Capital Region 172.1 Methodology and Approach 172.2 Profile of construction workers 172.3 Conditions of work, Wages, Social Security and Organizations 192.4 Impact of Migration at the Destination 322.5 Perceptions of Migrant workers Regarding Living and Working 39
conditions at Destination and Origin2.6 Some Conclusions from the Workers Survey in NCR 41
3 . Impact of Labour Migration on Households at Origin: Results 42of the Tracer Survey 423.1 Methodology and survey details 423.2 Profile of Sample Households 463.3 Profile of migrant workers 483.4 Impact of Migration 493.5 Perception among rural households on change in socio-economic status 663.6 Non-economic Impacts of Migration 693.7 Some Conclusions from the Tracer Survey 70
4 . Conclusion and Policy Implications 714.1 The Labourers’ Survey 714.2 The Tracer Survey 734.3 Impact of Migration to the Construction Sector on Poverty 744.4 Policy Issues 78
Notes 81References 84


LIST OF TABLES
Table1.1 Sectoral composition of different sectors in overall GDP (at 2004/05prices)
Table 1.2 Estimate of Total Employment (UPSS): 1999/2000, 2011/12 (in millions)Table 2.2.1 Percentage of workers who cite the following as main source of
livelihood at native placeTable 2.3.1 Percentage share of responses on the role of intermediaries in facilitating
recruitment and managing employmentTable 2.3.2 Amount of advance obtained by a worker from the contractor across
projects and skill levelTable 2.3.3: Percentage of workers with the following type of contract across various
projectsTable 2.3.4: Wages in Rupees across locations for skilled and unskilled workersTable 2.3.5: Wage in Rupees depending on recruitment pattern and skill levelTable 2.3.6 Average wage of the worker based on skill composition across project
typeTable 2.3.7 Percentage of workers reporting what they need do to take up another
employment opportunity: project-wise detailsTable 2.3.8 The percentage share of availability of casual, earned, sick, and
maternity leave across different types of projectsTable 2.3.9 Percentage of workers who reported following health problems across
different types of projectsTable 2.3.10 Percentage of workers who report industrial safety products offered
by the employer across different types of projectsTable 2.3.11 Percentage of workers reporting where they visit when they fall ill by
type of projectTable 2.3.12 Percentage of workers reporting the following entitlementTable 2.3.13 The percentage of workers who reported the following problems as
most across type of projectTable 2.3.14 Percentage of workers who reported familiarity with the following
labour laws

Table 2.4a.1 Percentage of workers reporting how skills are acquired across type ofprojects
Table 2.4 a.2 Percentage of workers reporting how they rate the chance of acquiringbetter skills and moving up in their profession across different typesof projects
Table 2.4a.3 Percentage of workers reporting how they rate their chances ofacquiring better skills and moving up in their profession across casteprofile
Table 2.4a.4 Percentage of workers reporting how they rate their chances ofacquiring better skills and moving up in their profession across religionprofile
Table 2.4b.1 Percentage of workers who report availing the followingaccommodation across different types of project
Table 2.4b.2 Percentage of workers by how they define the type ofaccommodation across different types of projects
Table 2.4c.1. Percentage of workers reporting how remittances is spent, skilledand unskilled and overall
Table 2.5 Percentage of workers on how they compare present location withnative place across type of project
Table 3.2.1: Distribution of family members in different age categories acrossmigrant status
Table 3.2.2 Percentage share of educational qualification of household membersfive years and above by migrant status in two villages
Table 3.2.3 Percentage share of households who report ownership and operationof land holding across migrant status in two villages
Table 3.4a.1 Educational Status of children in the age group 5 to 14 years bymigrant status in two villages
Table 3.4a.2 Average expenses on education incurred by households acrossdifferent migrant profile in two villages
Table 3.4b.1 Average value of livestock purchased by the sample households overthe last year and how such purchase is financed from differentsources
Table 3.4b.2 Average value of farm equipment purchased by the samplehouseholds over the last year and how such purchase is financedfrom different sources by sample households

Table 3.4b.3 Average value of transport equipment purchased by the samplehouseholds over the last year and how such purchase is financedfrom different sources by sample households
Table 3.4b.4 Average expenses on house repair/construction reported by thesample households over the last ten years and how such purchase isfinanced from different sources by sample households
Table 3.4b.5: Average present and purchase value of consumer durables anddifferent sources of finance over the last 10 years as reported by thesample households
Table 3.4d.1 The distribution of wage workers on how they are paid village wise
Table 3.4d.2 Days and wages reported migrant workers across skill level andvillages
Table 3.4d.3 Days and wages reported by non migrant workers across skill leveland villages
Table 3.4d.4 Total wage income and remittances reported by migrant and non-migrant households
Table 3.4e.1 Monthly per-capita expenditure (in Rs) of different items consumedby households of different migrant status in two villages
Table 3.5.1 Percentage share of how households rate their socio-economicposition compared to their neighbours
Table 3.5.2 Percentage share of how households rate their health, sanitation andhygiene compared to their past
Table 3.5.3 Percentage share of how households assess the infrastructure,sanitation and hygiene of their community
Table 3.5.4 Percentage share of how households think of their family foodconsumption adequacy
Table 4.1 Average Monthly Per capita consumption expenditure (Rs.) andPercentage of Households/ Population below Poverty Line.

MIGRATING OUT OF POVERTY? A STUDY OFMIGRANT CONSTRUCTION SECTOR WORKERS
IN INDIA
1. INTRODUCTION
Despite its growing significance, the link between poverty and migration remainsan understudied subject in India and migration has largely remained outside of thepublic policy realm. In the theoretical migration literature, the primary motive forthe movement of people from one sector/region to another is the differentials inearning opportunities, which could reflect differentials in employment opportunitiesor wages or both. These are in turn a result of the emerging patterns of developmentleading to the growth of the more productive sectors in specific spatial locations.
If migration is a response to the expectation of improvement in earningopportunities, it should lead to an improvement in the income of migrants. Otherbeneficial changes should follow, unless these are counteracted by the growingcongestion and worsening condition of public goods delivery in urban areas, whichare usually the principal kind of destination areas. However, the income of migrantsmay not improve if migration is an involuntary response to distress and loss ofincome and livelihoods, or if migrants become involved in exploitative labourmarkets, or if the expected earning differentials are not realized. In the migrationliterature, this has led to an examination of push and pull factors underlyingmigration.
In India, the scale and growth of regional disparities has been a subject of muchconcern and debate, particularly since the post liberalization period. One of theindicators of such disparity is the ratio between the highest and lowest state percapita income, which, represented by Punjab and Bihar in the period 1980–83 andMaharashtra and Bihar in the period 1997–2000, witnessed a rise from 2.6 to 3.5over the same period (Srivastava, 2003). The same ratio, represented more recentlyby again Bihar and Haryana, further rose to 4.78 for the period 2008–10. As the statehas moved away from the elements of regional policy to encourage agglomeration

14 Migrating out of Poverty? A Study of Migrant Construction Sector Workers in India
economies in and around the pre-existing growth centres in advanced regions, suchregional disparities have only got accentuated in the post-reform period (Srivastava,2009b).
Almost one-third of India’s population still lives below the poverty line and alarge proportion of poor live in rural areas. A great majority of rural poor areconcentrated in the rain-fed parts of eastern and central India, which continue tohave low productivity in agriculture. Generally, the rural poor in India possess meagerphysical and human capital and also tend to be concentrated among the sociallydeprived groups such as SC and ST and religious minority such as Muslims. In 200405,scheduled castes and tribes accounted for 80 percent of the rural poor althoughtheir share in total population is smaller. As some of these resource-poor regions fallbehind in their capacity to support populations, poor households participateextensively in migration (Connell et al., 1976). India has a long history of internalmigration, with urban pockets like Kolkata and Mumbai receiving rural labour mainlyfrom the labour catchment areas like Bihar, Uttar Pradesh, and Orissa in the eastand some parts of Andhra Pradesh, Tamil Nadu, Kerala, and Karnataka in the South(NCRL, 1991; Joshi and Joshi, 1976; Dasgupta 1987). Though such pattern of migrationcontinued unabated even after independence, increased labour mobility and migrationhave become more prominent in the national economy in the recent years. Thatmigration has been a significant livelihood strategy for poor households has beenconfirmed by some more recent studies.1
The importance of migration as a livelihood strategy has ,however, been beliedby official statistics such as Population Census and NSSO, which grosslyunderestimate some migration flows such as temporary, seasonal, and circulatoryflows, both due to conceptual and empirical difficulties. However, a closer examinationof migration pattern from the perspective of poverty and livelihood requires a focuson temporary and short-duration migration, because such migrants lack stableemployment and sources of livelihood at home. Moreover, the socio-economic profileof the temporary/ seasonal migration is very different from the other migrants, asmost of them are more likely to be from socially deprived and poorer groups, havelow levels of education, and are more likely to be engaged in casual work. Datafrom the migration survey carried out by NSSO in 2007/08, though poor in coverage,indicates some broad patterns of such short-duration migration. According to thesurvey, more than two-thirds of short-duration migration involves migration tourban areas, with 45.1 percent of them migrating to other states, of which 8.6 percentis to rural areas and 36.5 percent to urban areas in destination states (Srivastava,2011a).
Some micro surveys also attest to both high incidence and growth of seasonaland circular migrants, while estimates based on macro surveys put these figures inthe range of 80 to 100 million (Deshingkar and Akter 2009; Srivastava 2011a, c). Anumber of detailed empirical studies suggest that in the out-migration endemic ruralareas of Central and tribal regions, Andhra Pradesh, North Bihar, Eastern UttarPradesh, etc, the incidence of households with at least one out-migrant ranges from

Migrating out of Poverty? A Study of Migrant Construction Sector Workers in India 15
30 percent to 80 percent (Srivastava 2011a). However, not many of these studiestraced the migrants to their workplace or from workplace to the source area tobetter understand the factors that trigger such migration and the impact suchmigration has on poverty. Most of these micro studies have at best given a staticpicture that gives a one-point snapshot of the impact of migration on poverty eitherin the source area or at destination.
According to latest NSSO estimates, the construction sector is one of the mostpredominant sectors employing labour migrants and is also a sector which has seena rapid increase in employment in the recent years. The highest percentage of short-duration migrants work in the construction sector (36.2%), followed by theagriculture-related sector (20.4%), and manufacturing (15.9%) (Srivastava 2011a).
Both in terms of the share in GDP and particularly, the people employed, theimportance of the construction sector has increased significantly in the recent years(Table 1.1 and Table 1.2). In the last decade between 2000/01 and 2012, the GDP ofIndia’s construction industry grew on average by 14.58 percent annually, makingthe sector the third-fastest growing industry, after other industries such as “trade,hotel, transport and communications” and “finance, insurance, real estate andbusiness” (RBI, 2012). The expansion of the sector is also visible in terms of thepeople employed. With an employment of about 50 million, the sector has emergedas one of the largest employer outside of agriculture ranking after trade, hotel, andmanufacturing (Table 1.2). To put this in perspective, the workforce engaged in thesector is larger than the total population of the states of Kerala or Jharkhand. Seasonalmigrants constitute a significant proportion of workforce engaged in the construction
Table1.1Sectoral Composition of Different Sectors in Overall GDP (at 2004/05 prices)
Year Agriculture and Allied Manufacturing Construction Services
1999/2000 23.3 15.1 6.5 49.9
2000/01 22.3 15.5 6.6 50.4
2001/02 22.4 15.0 6.5 51.0
2002/03 20.1 15.4 6.8 52.5
2003/04 20.3 15.2 7.1 52.5
2004/05 19 15.3 7.7 53
2005/06 18.3 15.3 7.9 53.7
2006/07 17.4 16.0 8.0 54
2007/08 16.8 16.1 8.1 54.4
2008/09 15.8 15.8 8.0 56.1
2009/10 14.7 16 7.9 57.2
2010/11 14.5 15.8 7.9 57.7
Source: Calculation based on National Account Statistics (CSO)
16 Migrating out of Poverty? A Study of Migrant Construction Sector Workers in India
sector, accounting for 33 percent and 19 percent of short duration migrant workersin urban and rural areas respectively in the 2007/08 2 (Soundararajan, 2013).
Despite the large number of workers involved, we have limited information onthe impact of such large-scale migration on the well-being of workers in particularand on rural poverty in general. The lack of evidence, both at the macro and microlevel, belies enormous significance that migration to the sector holds for rurallivelihoods. We identify this as an important gap in the literature. With stagnation inemployment in both agriculture and manufacturing in India, it is all the more importantto see what impact such migration entails for the migrants in both source anddestination areas. Given that many of these seasonal/temporary migrants areundercounted in data and are invisible in policy discourse, this study of migrantworkers engaged in the construction sector can present an important case study ofwhat is happening to the vast mass of informal workers who migrate from resource-poor areas in search of livelihood. Using survey-based evidence collected in twophases from destination and source areas, the present study aims to fill the gap inthe literature through an in-depth study of both living and working conditions atthe destination areas and the impact of such migration at the source areas.
To begin with, India is the ninth- largest construction market, with a share of 3.3percent in the global construction market and is set to become the third-largestconstruction market by 2020 (Global Construction 2020, 2013). The sector is extremelydiverse. While a sizeable part of the construction activity is very small scale, and isin the unorganized sector, larger scale construction activity is organized by firms inthe private and public sector. Most of the construction activity is organized in sitesin the form of projects. The present study focuses on labour migrants in theconstruction sector and the impact of such migration on poverty, both at destinationand source. The study enumerates such workers in the Delhi National Capital Region(Delhi NCR) and follows it up by tracing some of the migrant workers to the villagesin source areas where living standards of migrant families are compared with thoseof comparable control households that rely on wage labour as source of theirlivelihoods.
2. WORKERS’ SURVEY IN THE DELHI NATIONAL CAPITAL REGION
The first phase of the project has entailed the survey of construction workers in theDelhi NCR. Workers who are engaged in three types of construction activities:construction of large residential complexes by organized sector firms; constructionof commercial and office complexes by similar firms; and construction of individualresidential premises, considered as unorganized sector activity, have been selectedfor interview.3 Sites visited for enumeration of workers in both the organized andunorganized sectors are situated in three locations in the NCR, namely Delhi,Gurgaon, and Noida. The rationale behind choosing different types of constructionactivity is to understand whether the working conditions and mode of recruitmentin such large-scale migration vary across type/scale of construction activities andfirms involved, and whether and how it impacts on poverty in the source areas.

Migrating out of Poverty? A Study of Migrant Construction Sector Workers in India 17
2.1. Methodology and Approach
The methodology for the first phase of fieldwork involved conducting detailedpersonal interviews, based on a structured questionnaire, with 50 workers fromdifferent sites representing each of the three types of construction activities mentionedearlier (150 workers in all), using controlled snow-balling techniques.4 These weresupplemented by Focused Group Discussion (FGD) with a wider set of stakeholdersinvolved in those sites that include workers, contractors, and labour supervisors toboth validate and supplement findings from the questionnaire survey. During thecourse of survey, some qualitative in-depth worker interviews were also carriedout, using a case study approach.
The survey with the workers engaged in the construction of individual residentialpremises is implemented with workers engaged in small private housing constructionprojects in localities such as Noida/Greater Noida, Sakarpur, Laxmi Nagar, andDLF Chattarpur. The construction works in such projects have a low budget and areoften executed by unlicensed contractors.
The organized sector entities visited for the survey of workers engaged in theconstruction of commercial complexes are all located in either Greater Noida orGurgaon. The entities selected for interview of workers involved in the constructionof residential complexes are located in Delhi.
2.2. Profile of construction workers
The sample of construction workers is overwhelmingly male dominated, with maleworkers accounting for as much as 97.33 percent of the sample workforce. Mostworkers belong to socially disadvantaged groups such as lower castes and religious
Table 1.2Estimate of Total Employment (UPSS): 1999/2000, 2011/12 (in millions)
Sectors 1999/2000 2004/05 2011/12
Agriculture 240.3 257.7 225.4
Mining and Quarrying 2.3 2.5 2.6
Manufacturing 43.9 56.1 60.8
Utilities 1.0 1.2 1.6
Construction 17.6 26.0 49.9
Trade, Hotel etc 40.9 49.8 56.1
Transport, Storage, and Communication 14.5 18.7 21
Financing, Insurance, Real estate, and business services 5.0 7.8 12.9
Community, social and personal services 33.0 37.7 40.9
Total 398.4 457.6 471.4
Note : Population adjusted figures, computed from various rounds of NSS reports onemployment and unemployment.
18 Migrating out of Poverty? A Study of Migrant Construction Sector Workers in India
minority with Scheduled Tribe (ST), Scheduled Caste (SC), and Other BackwardClasses (OBC) accounting for 6.67 percent, 33.33 percent, and 38.67 percent of thetotal sample workers, respectively. Muslims account for as much as 36.67 percent ofthe sample workers. Among Hindu workers, SC workers are 51.1 percent, while STand OBC workers are 7.1 percent and 33.3 percent, respectively.
The workforce engaged in the construction work is young, with 63.3 percent ofworkers below the age of 30 years and average age standing at approximately 28years. Most of the workers have poor educational background, with only 26 percentof the sampled workers reporting education higher than primary5.
Not surprisingly, most workers engaged in the sector are unskilled with only34.46 percent workers reporting as possessing any skill6. Interestingly, the skill profileamong the workers shows that workers from ST are conspicuous by lack of anyskill, with all of them reporting working as manual workers. However, the skilllevel among the workers from other communities do not vary much, with workersfrom SC, OBC, and General reporting 34 percent, 40.35 percent, and 35.48 percent ofthem, respectively, as skilled workers.
Migration profile of the workers throws up some other interesting facts, attestingto the evidence of seasonal/circular migration as an important subsistence strategyundertaken by the construction workers. Among the workers, 31.3 percent firstmigrated out 10 or more years ago and 25.4 percent first migrated 5 to 9 years ago,while the remaining 43.3 percent first migrated less than 5 years ago. Among them,8 percent workers first migrated to NCR more than 10 years ago, while 14.7 percentfirst migrated to the NCR 5 to 9 years ago and an overwhelming 77.3 percent firstmigrated to the NCR less than 5 years ago.
Interestingly, as many as 92 percent of the migrant workers report their nativeplace as primary residence, and an overwhelming majority of them retain strongconnections with the native place which they visit at the end of working season orholidays or when there is not enough work at the destination, confirming theirstatus as circulatory migrants. While some workers are recruited for a specificduration or seasonally, and go back to their places of origin at the end of this period,others stay on, rotating between one site and another, and return occasionally totheir places of origin.7 As per our survey, based on regularity of contact with thearea of origin, 40.4% of the sample workers can be regarded as seasonal migrantswhile the rest are seasonal/circular migrants. In terms of continuous period ofmigration for employment, 40% of the workers migrated for employment less than6 months ago, while 56.7% migrated for employment 6 to 12 months ago, and theremaining 3.3% migrated more than 12 months ago.
The workers in the sample have come from eight states and the neighbouringcountry of Nepal. Surprisingly, there are fewer migrant workers from statescontiguous to Delhi and more from distant states. Only 28% of the sampled workersare from the states adjacent to the NCR (Madhya Pradesh, Uttar Pradesh, andRajasthan) while 72% are from Orissa, Nepal, West Bengal, Bihar, Chhattisgarh, andJharkhand. The largest share of workers is from West Bengal (33.3%) and Bihar

Migrating out of Poverty? A Study of Migrant Construction Sector Workers in India 19
(31.3%). There is some difference in the proportions between the site types, with ahigher proportion of workers from adjacent states present in the unorganizedconstruction sites. The percentage of workers from neighbouring states present inthe organized commercial and residential sites is 24% and 10%, respectively. Thiscompares with as many as 50% of the workers engaged in unorganized residentialsites coming from the neighbouring sites. As we shall see later, a higher percentageof these workers migrate on their own to Delhi and are then recruited to work onthe smaller sites.
As evident in Table 2.2.1, as many as 84% of the workers report casual work asthe main source of livelihood even in their native place in comparison to only 11.33%workers reporting farming as their main source of livelihood. The average landholding possessed by both skilled and unskilled migrant workers is meagre andmeasures 1.12 and 0.89 acres, respectively, which, given their probable rain-fed status,is perhaps not large enough to support their family throughout the year, thus forcingthem to seek other livelihood sources. Most of the casual works are either inagriculture or in other non-farm sectors.
Little less than half of the migrant workers migrate in cohorts, either with theirfamily members or other kinsfolk, perhaps as some kind of protection against theharsh environment in which they travel and work. However, more than half theworkers migrate alone. Interestingly, the distribution of marital status among themigrants who migrate alone is almost similar to workers who migrate with eithertheir family or in cohort with friends and relatives, indicating factors other thanmarriage in their migration behavior. More than half of such migrants are married.
Table 2.2.1Percentage of workers who cite the following as main source of
livelihood at native place
Unskilled workers (N=98) Skilled workers (N=52) Total
Casual work 86.87 78.43 84
Farming 10.10 13.73 11.33
Regular salaried work 1.01 3.92 2
Self-employed outside 1.01 3.92 2
Others 1.01 0 0.67
Total 100 100 100
Source: Survey Data (Worker Survey in NCR).
2.3. Conditions of Work, Wages, Social Security and Organizations
One of the important channels through which migration affects the well-being ofthe informal construction workers is through its interaction with the labour market.This entails how migrants manage to get jobs in the destination areas, their conditionsof work, wages, social security, and their bargaining power.
It will be interesting to look at the mediatory mechanism that brings workers incontact with the employers in the construction sector and how such mechanism

20 Migrating out of Poverty? A Study of Migrant Construction Sector Workers in India
varies across sectors, organized and unorganized, and the effect such variation hason the working conditions of the migrant workers. Given their profile of littleeducation and skill, most construction workers are exposed to large uncertainties inthe potential job market. They have very little knowledge about the markets andoften risk high job search costs. Since most of them are inter-state migrants, theperceived risk and costs tend to be particularly higher.
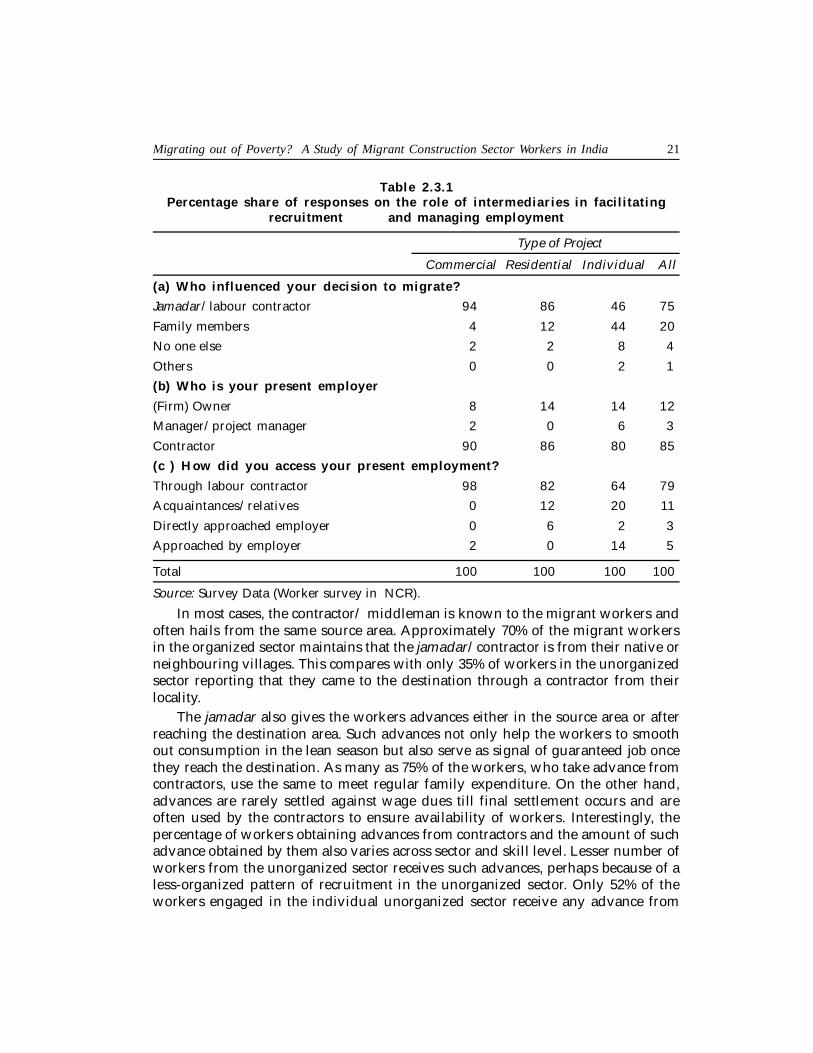
In the construction sector, middlemen known as jamadar/ contractor or munshiplay an important role in mediating employment as well as determining theconditions of work. Interestingly, the use of such recruitment systems is practicedwith greater intensity in the organized sector. As many as 94% of the migrant workersfrom commercial complexes and 86% of the migrant workers from residentialcomplexes report that their decision to migrate is influenced by such middlemen(Table 2.3.1). In sharp contrast, only 46% workers engaged in construction ofindividual residential premises have taken their decision to migrate because of suchmiddlemen. Workers in the unorganized construction sector arrive in the destinationsoften through their kin or family members, and sometimes through smallercontractors.
Contractors not only influence the decision of workers to migrate, but also helpin providing employment to them. Recruitment may be facilitated by contractorseven when workers take the initial decision to migrate because of family membersor kinsfolk. Overall, 79% of all workers get employed through contractors. Thisprobability is as high as 98% in commercial complexes and 82% in residentialcomplexes, but is lower at 64% in individual construction sites. The constructionworks in individual residential premises are conducted with smaller budget andscale that does not need large number of labourers. Most of the construction workersfor such projects are recruited locally through personal contacts or from the labourchowk, a term used to denote areas where unemployed workers arrive each day toseek employment.
Finally, most workers see the contractors as their employers, as the contractorsare responsible for wage payments as well as work supervision. In our survey, asmany as 85% of the workers see contractors as their employers, with this percentagebeing as high as 90% and 86% in the case of commercial and residential complexes,respectively. How the workers perceive the contractor is also no different in thecase of individual construction sites, with as high as 80% of the workers engaged insuch sites reporting contractors as their employers. Such perception of workers abouttheir contractors also underscores little or no role played by the manager of thecompanies, thus leaving little difference between the formal and informal constructionsector. A number of case studies conducted with workers also indicate tacit supportextended by the company management to the contractors, which allows themanagement to sidestep responsibility that comes with direct recruitment of workers.
Migrating out of Poverty? A Study of Migrant Construction Sector Workers in India 21
Table 2.3.1Percentage share of responses on the role of intermediaries in facilitating
recruitment and managing employment
Type of Project
Commercial Residential Individual All
(a) Who influenced your decision to migrate?
Jamadar/labour contractor 94 86 46 75
Family members 4 12 44 20
No one else 2 2 8 4
Others 0 0 2 1
(b) Who is your present employer
(Firm) Owner 8 14 14 12
Manager/project manager 2 0 6 3
Contractor 90 86 80 85
(c ) How did you access your present employment?
Through labour contractor 98 82 64 79
Acquaintances/relatives 0 12 20 11
Directly approached employer 0 6 2 3
Approached by employer 2 0 14 5
Total 100 100 100 100
Source: Survey Data (Worker survey in NCR).
In most cases, the contractor/ middleman is known to the migrant workers andoften hails from the same source area. Approximately 70% of the migrant workersin the organized sector maintains that the jamadar/contractor is from their native orneighbouring villages. This compares with only 35% of workers in the unorganizedsector reporting that they came to the destination through a contractor from theirlocality.
The jamadar also gives the workers advances either in the source area or afterreaching the destination area. Such advances not only help the workers to smoothout consumption in the lean season but also serve as signal of guaranteed job oncethey reach the destination. As many as 75% of the workers, who take advance fromcontractors, use the same to meet regular family expenditure. On the other hand,advances are rarely settled against wage dues till final settlement occurs and areoften used by the contractors to ensure availability of workers. Interestingly, thepercentage of workers obtaining advances from contractors and the amount of suchadvance obtained by them also varies across sector and skill level. Lesser number ofworkers from the unorganized sector receives such advances, perhaps because of aless-organized pattern of recruitment in the unorganized sector. Only 52% of theworkers engaged in the individual unorganized sector receive any advance from

22 Migrating out of Poverty? A Study of Migrant Construction Sector Workers in India
the contractor in comparison to over 80% workers in the organized sector receivingsuch advances. Interestingly, workers with higher skill level receive higher amountof advances, indicating better bargaining power of such workers compared tounskilled workers (Table 2.3.2). Similarly, workers in the organized sector receivehigher amount of advances than their counterparts in the unorganized sector.
Table 2.3.2Amount of advance obtained by a worker from the contractor across
projects and skill level
Unskilled worker Skilled worker
Commercial complex 6222 11875
Residential complex 7205 8063
Individual unorganized complex 3683 4000
Source Survey Data (Worker survey in NCR).
In a sense, the recruitment of labour through jamadar/contractor suits the poorermigrants, but they trade their freedom of making individual contracts with employersfor the relative comfort of securing advances and promises of secure employmentfrom contractors. The outsourcing of labour recruitment to the jamadar suits theemployers, particularly those in the formal sector, who use such mechanisms to getaway with any responsibility that comes with recruiting a mass of informal workers.In most cases, the mediatory role played by the labour contractor in recruiting labourgets extended to supervising and disciplining them at work in the construction sites,obviating any need for interference by the owners/managers of sites. As mentionedabove, most workers across sectors identify the contractor as their present employer,thus underscoring the little or no role of actual principal employers, who in mostcases, are the construction firm manager/project manager or owner of the building.In fact, such mode of recruiting labour is suited to sidestepping the basic standardsrelating to hiring of informal workers such as payment of minimum wages.
To supplement quantitative surveys, we also follow the case study approach andconduct focus group discussion with workers, contractors, and middlemen to bothcorroborate our findings and throw more light on how the mode of recruitment andrecruitment practices vary across sub sectors: organized and unorganized.Documented case studies of migrant workers suggest that most of the workersenumerated in our interview hail from resource-poor and rain-fed regions and havelittle option but to migrate as construction workers. Given their little or no skill andlittle education, most informal workers see the construction sector as a safety valve.While there are some workers who work in the sector throughout the year, somejoin only during the lean season when there is not enough farm work in the village.While the contractor from the source area remains the most common mode ofrecruitment, there are other modes of recruitments in the unorganized sector asrevealed by workers during the course of informal discussion.
Most of the construction work in the unorganized sector covers constructionwork in the individual residential complexes or the unauthorized colonies. As the
Migrating out of Poverty? A Study of Migrant Construction Sector Workers in India 23
construction works in such projects are conducted on a smaller scale, the requirementof labour in the project is low and is mostly secured through a number of methods.In such projects, workers mostly approach the contractor or the supervisor for jobsand at times, workers who previously worked with the contractor are assignedwith the task of recruiting the required labour on contractors’ behalf. Some of theseworkers are either local or come from nearby states in search of jobs. However,when the workers so recruited fall short of the requirements, the contractor visitsthe labour chowk to recruit labour on their own or approach the middlemen to meetthe demand for additional labour. In the latter cases, the middleman obtainscommission for each labour recruited through him and if required, he even mediatesbetween worker and contractors for advances demanded by the worker. Thoughpayment of such advances to workers involves risks at times, such mode ofrecruitment helps the contractor to access relatively cheaper labour from farawayplaces such as the tribal workers from places such as Chhattisgarh and Jharkhand.
Not all workers get advances because of the risk involved in such payment.Those availing advances are either known to the contractor, or the assurances aregiven on their behalf by the concerned middleman. In emergency, workers can evenavail loan from the contractor at monthly interest rate sometimes as high as 5% to10% per month. FGDs conducted with construction workers and contractors confirmour findings that the recruitment of workers for the construction works in theunorganized sector is less organized, with the contractor playing a relatively passiverole and as already discussed; payment of advances is less common in the recruitmentof labour in the unorganized sector.
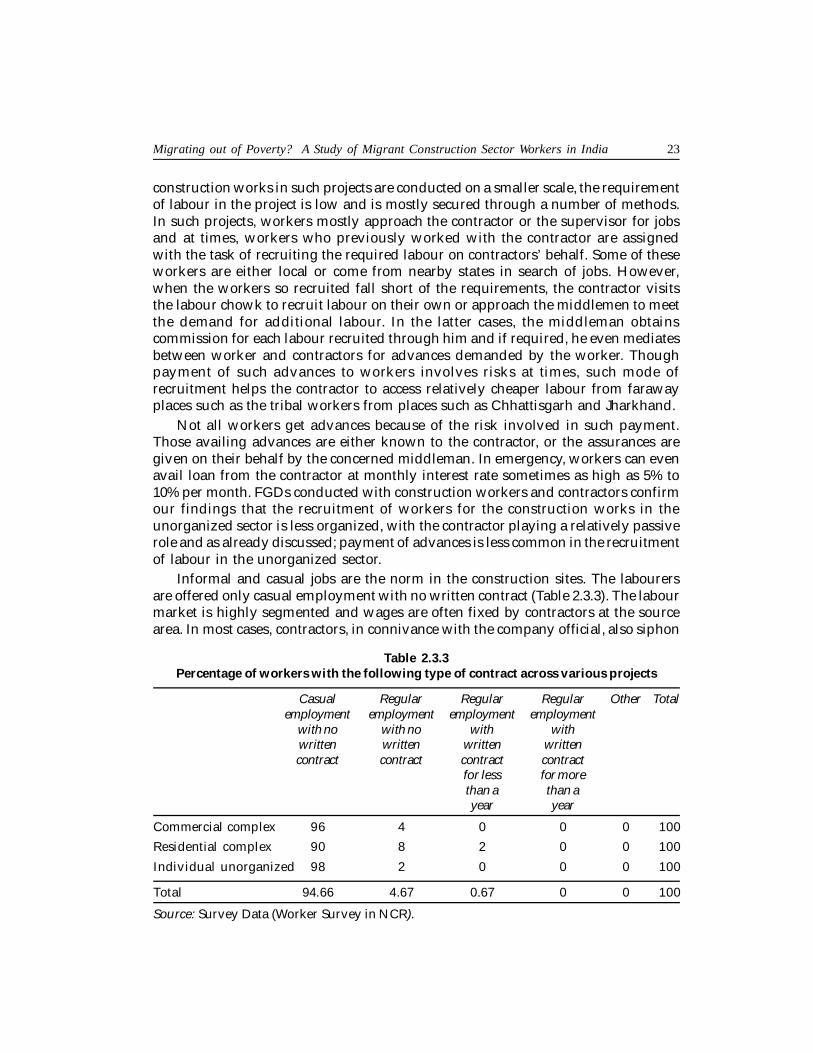
Informal and casual jobs are the norm in the construction sites. The labourersare offered only casual employment with no written contract (Table 2.3.3). The labourmarket is highly segmented and wages are often fixed by contractors at the sourcearea. In most cases, contractors, in connivance with the company official, also siphon
Table 2.3.3Percentage of workers with the following type of contract across various projects
Casual Regular Regular Regular Other Totalemployment employment employment employment
with no with no with withwritten written written writtencontract contract contract contract
for less for morethan a than ayear year
Commercial complex 96 4 0 0 0 100
Residential complex 90 8 2 0 0 100
Individual unorganized 98 2 0 0 0 100
Total 94.66 4.67 0.67 0 0 100
Source: Survey Data (Worker Survey in NCR).

24 Migrating out of Poverty? A Study of Migrant Construction Sector Workers in India
off part of funds allocated as wages for the workers. It is no wonder that in all thesites, wages paid to the workers fail to meet the minimum wages set by the respectivestate government8 (Table 2.3.4).
Table 2.3.4Wages in Rupees across locations for skilled and unskilled workers
Unskilled worker Skilled worker
Noida
8-hour work day 161 234
Normal work day 200 292
Monthly earnings 5522 7925
Delhi
8-hour work day 192 281
Normal work day 192 294
Monthly earnings 4956 7269
Gurgaon
8-hour work day 142 248
Normal work day 197 275
Monthly earnings 5276 5945
Source Survey Data (Worker Survey in NCR).
Our findings show that wages for similar work vary across workers within thesame site depending on the migration stream of which the workers are a part andhow they are recruited. Such a pattern serves as an example of segmentation of thelabour market and how it is used to serve the interest of capital. Comparison ofwages based on the recruitment pattern (Table 2.3.5) shows that workers who bankon contractors/ middlemen or employer agency receive lower wages than thoserecruited through acquaintances or when approached by the employers/managersthemselves.
The wages for 8 hours a day, when compared across type of project and skilllevel, shows that workers are paid poorly in the organized sector compared toindividual projects in the unorganized sector. Such wage pattern across sectorsindicates stronger hold of contractor/jamadar in the recruitment and payment ofwages in the organized sector, where wages are generally fixed in the source areaand bear little resemblance to the prevailing wage in the destination area (Table.2.3.6).In all, the recruitment in the sector as evident from the survey, attests to the highdegree of organized migration, leading to segmentation of workforce9.
Working beyond normal working hours is commonly reported, particularly inthe organized sector where most projects engage workers for 10 to 12 hours per day(excluding breaks). Normal working hours are smaller in individual residentialprojects. As many as 48% of the workers from commercial complex and 62% of the

Migrating out of Poverty? A Study of Migrant Construction Sector Workers in India 25
workers from residential complex report working 12 hours per day vis-a-vis 96%workers from individual residential projects in the unorganized sector reportingworking only 8 hours per day.10 Extra wages are mostly paid at the same rate for theovertime duty, rather than the double rate which is legally mandated for overtimework, and in some cases daily wages are fixed on the basis of a 10- or 12-hourworking day. Most workers happily accept such offers to maximize their returns tomigrant labour per day, so that they can make maximum savings out of their wages.
The advances given to the workers at the time of recruitment are adjusted againstthe wages receivable. Approximately 80% of the workers engaged with the organizedsector still prefer to obtain advances before joining work. The preferences amongthe workers for advances also suit the contractors who use such advances to obtainlabour commitments and bind them to continue working even in poor conditions. Asegment of workers, though employed with casual employment status and no writtencontract (discussed before), are required to give prior notice to the presentemployment and clear debt advances before they take up another employmentopportunity (Table 2.3.7), approximating what Breman and Guerin (2009), Srivastava(2009a), and others have referred to as neo-bondage. Such neo-bondage is ‘lesspersonalized, more contractual and monetized with elements of patronage absentfrom the relationship’ (Srivastava, 1997). Overall, 42% of all the construction workers
Table 2.3.5Wage in Rupees depending on recruitment pattern and skill level
Unskilled worker Skilled worker
Through labour contractor/middlemen
8-hour work day 160 240
Normal work day 195 288
In a month 5309 7667
Acquaintance /relatives
8-hour work day 176 292
Normal work day 195 350
In a month 4870 7663
Directly approached the employer
8-hour work day 204
Normal work day 239
In a month 6425
Approached by the employer / manager
8-hour work day 254 275
Normal work day 254 325
In a month 6917 8175
Source Survey Data (Worker Survey in NCR).

26 Migrating out of Poverty? A Study of Migrant Construction Sector Workers in India
maintain that they need to clear their debt and advances before they take up anotheremployment opportunity. This possibility is as high as 62% in commercial complexesand 48% in residential complexes, but was lower at only 16% in individual constructionsites.
Though the recruitment of workers at times varies across sub sectors, some ofour case studies highlight a number of issues suggesting that the difference betweenorganized and unorganized sector is blurred at times. The companies in the organizedsector rely on both registered and unregistered contractors to meet the requirementof labour. Interestingly, contractors may also differ, depending on the type of taskassigned. Though the company has had fixed wage per day for 8 hours of duty byan unskilled worker, the worker never gets the said amount. The company generallymakes the payment as daily wage. The contractor, however, offers three differentsystems of payment: piece rate, daily wage, and fixed monthly wage, suggestingthat the contractor, in connivance with company staff, siphons off part of the fundallocated as wages. The informal discussions with the labourers during the courseof survey also bring to light the different wages paid to workers for the same typeof work even within the same worksite, perhaps indicating the effect of differentmodes of recruitment on the wages. The difference in the wages for casual labour ata site may vary from Rs. 10 to Rs. 30 per day.
Table 2.3.6Average wage of the worker based on skill composition across project type
Type of project Unskilled worker Skilled worker
Commercial Complex
8-hour work day 159 249
Normal work day 200 295
In a month 5652 8295
Residential complex
8-hour work day 147 222
Normal work day 206 290
In a month 5455 7367
Individual residential complex
8-hour work day 190 278
Normal work day 190 287
In a month 4955 7228
Source: Survey Data (Worker Survey in NCR).

Migrating out of Poverty? A Study of Migrant Construction Sector Workers in India 27
Table 2.3.7Percentage of workers reporting what they need do to take up another
employment opportunity: project-wise detai ls
Can Would Would Can’t Others Totaljoin readily need need to join easily
without to give clear debt becausenotice to notice and of higherpresent to the present advance debt
employer employer burden
Commercial complex 6 32 62 0 0 100
Residential complex 36 16 48 0 0 100
Individual unorganized complex 26 54 16 0 4 100
Total 22.67 34 42 0 1.33 100
Source- Survey Data (Worker Survey in NCR).
The working conditions of construction workers are seriously inadequate,particularly in the case of construction sites of individual residential premises.Working conditions in the construction projects under the organized sector appearsomewhat better, with workers offered more tea/lunch breaks and for longerduration. However, the system of paid holiday, casual leave, sickness, or maternityleave is conspicuous by its absence even in the organized sector (Table 2.3.8).
In most cases, safety standards do not follow any minimum norm. Fatal accidentsare commonly reported in worksites, indicating little or no safety measures takenby the contractors/ employers in the sector. When accidents take place, employersdeal with them on a case-to-case basis and do not follow any norm or law. Basicsafety norms such as placing a safety sign at the worksites are grossly violated,particularly in the unorganized sector where only 20% workers report such normsbeing followed. This compares with more than 80% of workers in the organizedsector reporting such safety norms being followed at the workplace. Migrantlabourers work in harsh circumstances and suffer from various health hazards andaccidents at the work sites. Health risks such as dust particles, pollution, accidents,and eye strain are commonly reported in all projects, whether organized orunorganized. As discussed above, health problems such as cough, back pain, eyestrain, allergy, and exhaustion are commonly reported in the entire sector thoughtheir incidence is somewhat higher in the unorganized sector (Table 2.3.9).

28 Migrating out of Poverty? A Study of Migrant Construction Sector Workers in India
Table 2.3.9Percentage of workers who reported following health problems across
different types of projects
Type of project Cough Back pain Eye strain Allergy Exhaustion Other problems
Commercial complex 10 60 30 22 34 30
Residential complex 18 64 14 14 12 14
Individual complex 30 86 24 24 38 24
Total 19 70 22.67 20 28 22.67
Source Survey Data (Worker Survey in NCR).
Table 2.3.8The percentage share of availability of casual, earned, sick, and maternity leave across
different types of projects
� Yes No Not applicable Overall
Casual Leave
Commercial Complex 0 100 0 100
Residential Complex 0 100 0 100
Individual unorganized complex 0 96 4 100
Earned leave
Commercial Complex 0 100 0 100
Residential Complex 0 100 0 100
Individual unorganized complex 0 96 4 100
Sick leave
Commercial Complex 0 100 0 100
Residential Complex 2 98 0 100
Individual unorganized complex 0 94 6 100
Maternity leave
Commercial Complex 0 2 98 100
Residential Complex 0 12 88 100
Individual unorganized complex 0 2 98 100
Source Survey Data (Worker Survey in NCR).

Migrating out of Poverty? A Study of Migrant Construction Sector Workers in India 29
Table 2.3.10Percentage of workers who report industrial safety products offered by the
employer across different types of projects
Safety Gloves Safety Earplugs/ Insulated Goggles Dust Ordinary Otherhelmet belt muffs shoes mask mask
Commercialcomplex 82 10 10 0 58 0 0 0 0
Residentialcomplex 90 18 40 0 32 0 0 0 0
Individualcomplex 84 4 0 0 4 0 2 0 0
Source Survey Data (Worker survey in NCR).
The availability and use of basic industrial safety products such as helmets, gloves,and safety belt are more commonly reported in the organized sector. However,more sophisticated safety equipments such as earplugs/muffs, goggles, and dustmask are conspicuous by their absence in all projects across sectors (Table 2.3.10).Employers rarely take up the responsibility of providing anything other than wages.There is hardly any provision of a medical check-up in both the organized andunorganized sectors, leaving the workers in a situation where they have to fend forthemselves to meet their health requirements. Not surprisingly, unable to meet thestiff expenses charged by the private doctors, many workers visit the unregisteredmedical practitioners (Table 2.3.11).
Social security provisions concerning workers in the construction sector are poorlyimplemented. The Building and Other Construction Workers Act (BOCWA), 1996provides for safety, healthcare, and social security of the construction workersregistered under this Act. Apart from other assistance for construction workersthat include provision of pension for workers above 60 years of age and expenses
Table 2.3.11Percentage of workers reporting where they visit when they fall ill by type of project
Faith/ Unregistered Private Government ESIC Have no Others Totaltraditional medical doctor dispensary/ clinic access to
healer practitioner doctor /hospital medicalpractitioner
Commercialcomplex 0 72 24 0 0 4 0 100
Residentialcomplex 0 28 72 0 0 0 0 100
Individualunorganizedcomplex 0 62 20 18 0 0 0 100
Total 0 54 38.67 6 0 1.33 0 100
Source: Survey Data (Worker Survey in NCR).
30 Migrating out of Poverty? A Study of Migrant Construction Sector Workers in India
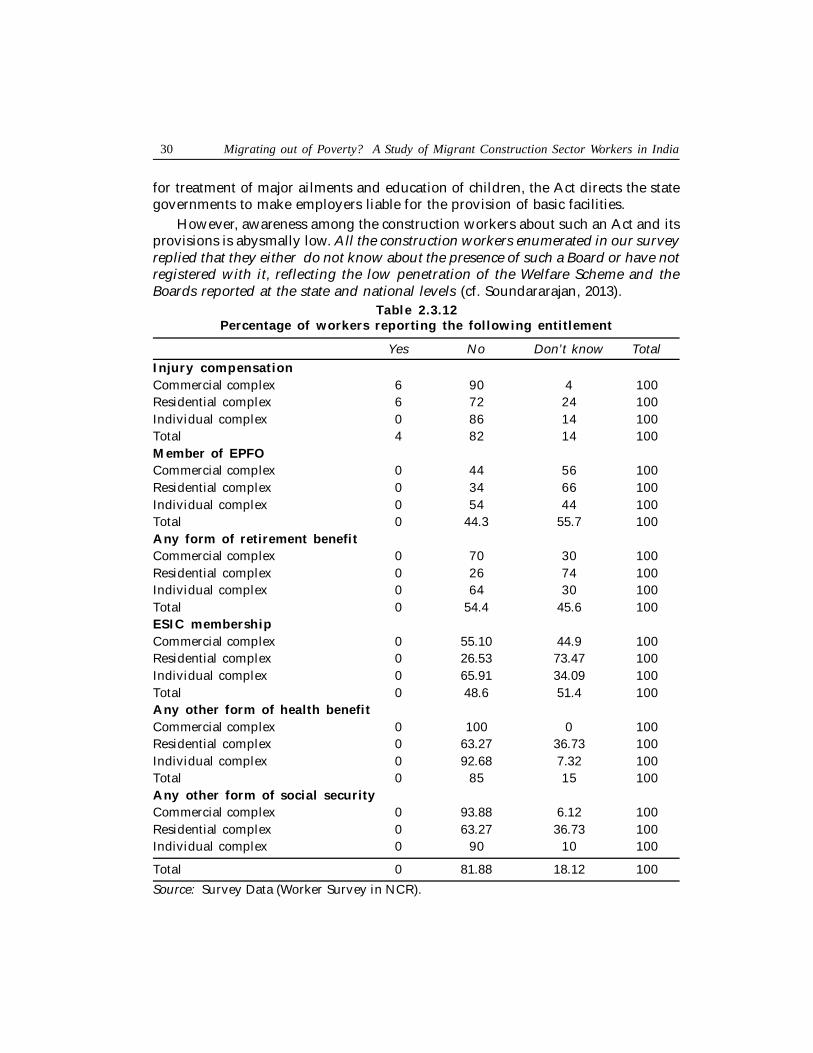
for treatment of major ailments and education of children, the Act directs the stategovernments to make employers liable for the provision of basic facilities.
However, awareness among the construction workers about such an Act and itsprovisions is abysmally low. All the construction workers enumerated in our surveyreplied that they either do not know about the presence of such a Board or have notregistered with it, reflecting the low penetration of the Welfare Scheme and theBoards reported at the state and national levels (cf. Soundararajan, 2013).
Table 2.3.12Percentage of workers reporting the following entitlement
Yes No Don’t know TotalInjury compensationCommercial complex 6 90 4 100Residential complex 6 72 24 100Individual complex 0 86 14 100Total 4 82 14 100Member of EPFOCommercial complex 0 44 56 100Residential complex 0 34 66 100Individual complex 0 54 44 100Total 0 44.3 55.7 100Any form of retirement benefitCommercial complex 0 70 30 100Residential complex 0 26 74 100Individual complex 0 64 30 100Total 0 54.4 45.6 100ESIC membershipCommercial complex 0 55.10 44.9 100Residential complex 0 26.53 73.47 100Individual complex 0 65.91 34.09 100Total 0 48.6 51.4 100Any other form of health benefitCommercial complex 0 100 0 100Residential complex 0 63.27 36.73 100Individual complex 0 92.68 7.32 100Total 0 85 15 100Any other form of social securityCommercial complex 0 93.88 6.12 100Residential complex 0 63.27 36.73 100Individual complex 0 90 10 100
Total 0 81.88 18.12 100
Source: Survey Data (Worker Survey in NCR).

Migrating out of Poverty? A Study of Migrant Construction Sector Workers in India 31
There is hardly any social security entitlement available to the workers thatdistinguishes the organized sector from the unorganized (Table 2.3.12). Membershipin labour unions or any such collective action organizations for representing theinterest of the workers is conspicuous by its absence in all construction sites, bothorganized and unorganized. Most workers are either not interested or see no utilityin such collective action and many others are also scared of losing employment incase such action is initiated. Such responses are all the more surprising especiallywhen an overwhelming majority of them complained about low wages, long workinghours and strenuous work (Table 2.3.13).
Table 2.3.13The percentage of workers who reported the following problems as most
across type of project
Problems Yes No Total
Low wagesCommercial project 96 4 100Residential project 82 18 100Individual residential project 98 2 100Total 92 8 100Irregular Payments � � �Commercial project 82 18 100Residential project 52 48 100Individual residential project 52 48 100Total 62 38 100Long working hoursCommercial project 44 56 100Residential project 64 36 100Individual residential project 8 92 100Total 38.67 61.33 100Strenuous workCommercial project 0 100 100Residential project 4 96 100Individual residential project 2 98 100
Total 2 98 100OtherCommercial project 2 98 100Residential project 0 100 100Individual residential project 0 100 100
Total 0.67 99.33 100
Source: Survey Data (Worker survey in NCR).
32 Migrating out of Poverty? A Study of Migrant Construction Sector Workers in India
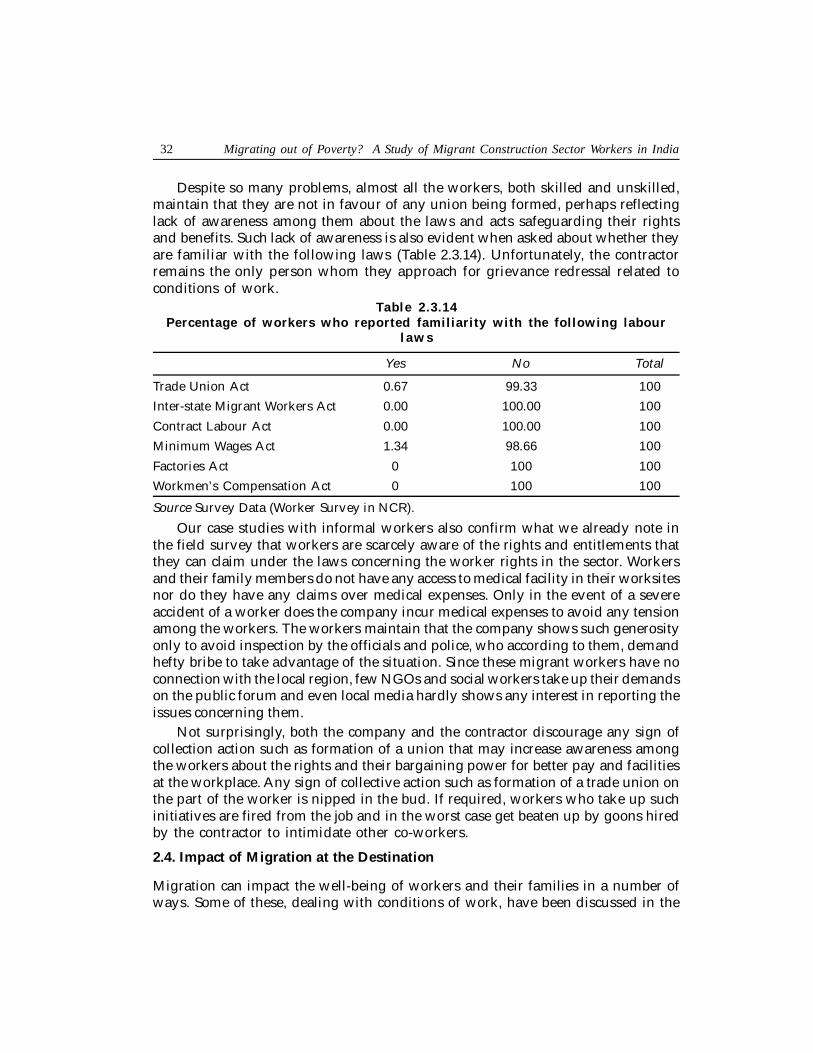
Despite so many problems, almost all the workers, both skilled and unskilled,maintain that they are not in favour of any union being formed, perhaps reflectinglack of awareness among them about the laws and acts safeguarding their rightsand benefits. Such lack of awareness is also evident when asked about whether theyare familiar with the following laws (Table 2.3.14). Unfortunately, the contractorremains the only person whom they approach for grievance redressal related toconditions of work.
Table 2.3.14Percentage of workers who reported familiarity with the following labour
l a w s
Yes No Total
Trade Union Act 0.67 99.33 100
Inter-state Migrant Workers Act 0.00 100.00 100
Contract Labour Act 0.00 100.00 100
Minimum Wages Act 1.34 98.66 100
Factories Act 0 100 100
Workmen’s Compensation Act 0 100 100
Source Survey Data (Worker Survey in NCR).
Our case studies with informal workers also confirm what we already note inthe field survey that workers are scarcely aware of the rights and entitlements thatthey can claim under the laws concerning the worker rights in the sector. Workersand their family members do not have any access to medical facility in their worksitesnor do they have any claims over medical expenses. Only in the event of a severeaccident of a worker does the company incur medical expenses to avoid any tensionamong the workers. The workers maintain that the company shows such generosityonly to avoid inspection by the officials and police, who according to them, demandhefty bribe to take advantage of the situation. Since these migrant workers have noconnection with the local region, few NGOs and social workers take up their demandson the public forum and even local media hardly shows any interest in reporting theissues concerning them.
Not surprisingly, both the company and the contractor discourage any sign ofcollection action such as formation of a union that may increase awareness amongthe workers about the rights and their bargaining power for better pay and facilitiesat the workplace. Any sign of collective action such as formation of a trade union onthe part of the worker is nipped in the bud. If required, workers who take up suchinitiatives are fired from the job and in the worst case get beaten up by goons hiredby the contractor to intimidate other co-workers.
2.4. Impact of Migration at the Destination
Migration can impact the well-being of workers and their families in a number ofways. Some of these, dealing with conditions of work, have been discussed in the

Migrating out of Poverty? A Study of Migrant Construction Sector Workers in India 33
preceding section. In this section, we discuss the possibility of workers achievingeventual job mobility through skill upgradation, impact of migration on their livingconditions as perceived by them, and the impact on savings and remittances.
(a) Upward Job Mobility through Skill Acquisition
The impact of migration on the economic mobility of workers can also be examinedfrom the changes in the worker occupation and how they rate their chances of movingup in their professional life through acquisition of skills in the workplace. As alreadydiscussed, most of the workers involved in the sector are unskilled and the task thatthey do is also largely unskilled. The chances of formal acquisition of skills are verylimited as most skills required are learnt only on the job (Table.2.4.a1). The commontheme running across projects in the organized and unorganized sectors is little orno access to formal training for better skills11.
To assess the prospect of economic mobility in their career, we have asked theunskilled migrant workers across caste and religion as to how they rate their chancesof acquisition of skills in both organized and unorganized individual projects. Morethan two-thirds of the unskilled workers in commercial and residential projects ratetheir chances of acquisition of skills as either nil or low, indicating that majority ofthem could remain stuck in low-skilled manual works (Table 2.4a.2). Only a quarterof these workers rate their chances of skill acquisition as fair and only 7% rate thesechances as “good”.
However, there are differences across project types. A comparatively higherpercentage of unskilled workers in individual projects rate their chances as beingeither “fair” or “good”. Over 40% of the unskilled workers in the individual projectrate their chances of skill acquisition as fair. This is followed by workers engaged inthe construction of commercial projects (of whom about 36% rate their chances ofskill acquisition as fair or good), and residential construction projects, in whichabout 18% workers rate the chances of their skill acquisition as either fair or good.It could be that workers in smaller unorganized sector projects have a greaterlikelihood of closer interaction with the skilled workers, raising the possibility oflearning some skills on the job.
Table 2.4a.1Percentage of workers reporting how skills are acquired across type of
pr ojec ts
Type of project On the job Have Have formal Not applicable Totalformal certified
training training
Commercial project 32 0 2 66 100
Residential Project 42 2 0 56 100
Individual Project 24 2 0 72 100
Total 32.67 1.33 0.67 65.33 100
Source Survey Data (Worker Survey in NCR).
34 Migrating out of Poverty? A Study of Migrant Construction Sector Workers in India
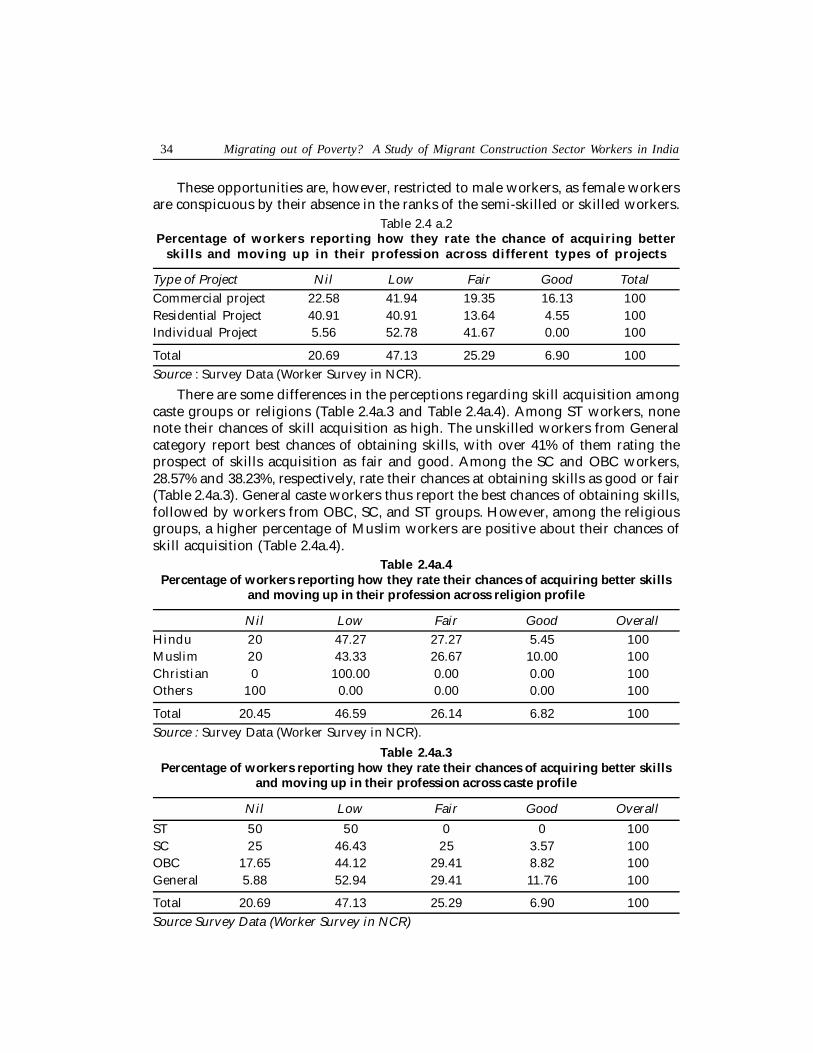
These opportunities are, however, restricted to male workers, as female workersare conspicuous by their absence in the ranks of the semi-skilled or skilled workers.
Table 2.4 a.2Percentage of workers reporting how they rate the chance of acquiring better
skills and moving up in their profession across different types of projects
Type of Project Nil Low Fair Good TotalCommercial project 22.58 41.94 19.35 16.13 100Residential Project 40.91 40.91 13.64 4.55 100Individual Project 5.56 52.78 41.67 0.00 100
Total 20.69 47.13 25.29 6.90 100Source : Survey Data (Worker Survey in NCR).
There are some differences in the perceptions regarding skill acquisition amongcaste groups or religions (Table 2.4a.3 and Table 2.4a.4). Among ST workers, nonenote their chances of skill acquisition as high. The unskilled workers from Generalcategory report best chances of obtaining skills, with over 41% of them rating theprospect of skills acquisition as fair and good. Among the SC and OBC workers,28.57% and 38.23%, respectively, rate their chances at obtaining skills as good or fair(Table 2.4a.3). General caste workers thus report the best chances of obtaining skills,followed by workers from OBC, SC, and ST groups. However, among the religiousgroups, a higher percentage of Muslim workers are positive about their chances ofskill acquisition (Table 2.4a.4).
Table 2.4a.4Percentage of workers reporting how they rate their chances of acquiring better skills
and moving up in their profession across religion profile
Nil Low Fair Good OverallHindu 20 47.27 27.27 5.45 100Muslim 20 43.33 26.67 10.00 100Christian 0 100.00 0.00 0.00 100Others 100 0.00 0.00 0.00 100
Total 20.45 46.59 26.14 6.82 100Source : Survey Data (Worker Survey in NCR).
Table 2.4a.3Percentage of workers reporting how they rate their chances of acquiring better skills
and moving up in their profession across caste profile
Nil Low Fair Good Overall
ST 50 50 0 0 100SC 25 46.43 25 3.57 100OBC 17.65 44.12 29.41 8.82 100General 5.88 52.94 29.41 11.76 100
Total 20.69 47.13 25.29 6.90 100Source Survey Data (Worker Survey in NCR)
Migrating out of Poverty? A Study of Migrant Construction Sector Workers in India 35
(b) Impact of Migration on Living Conditions
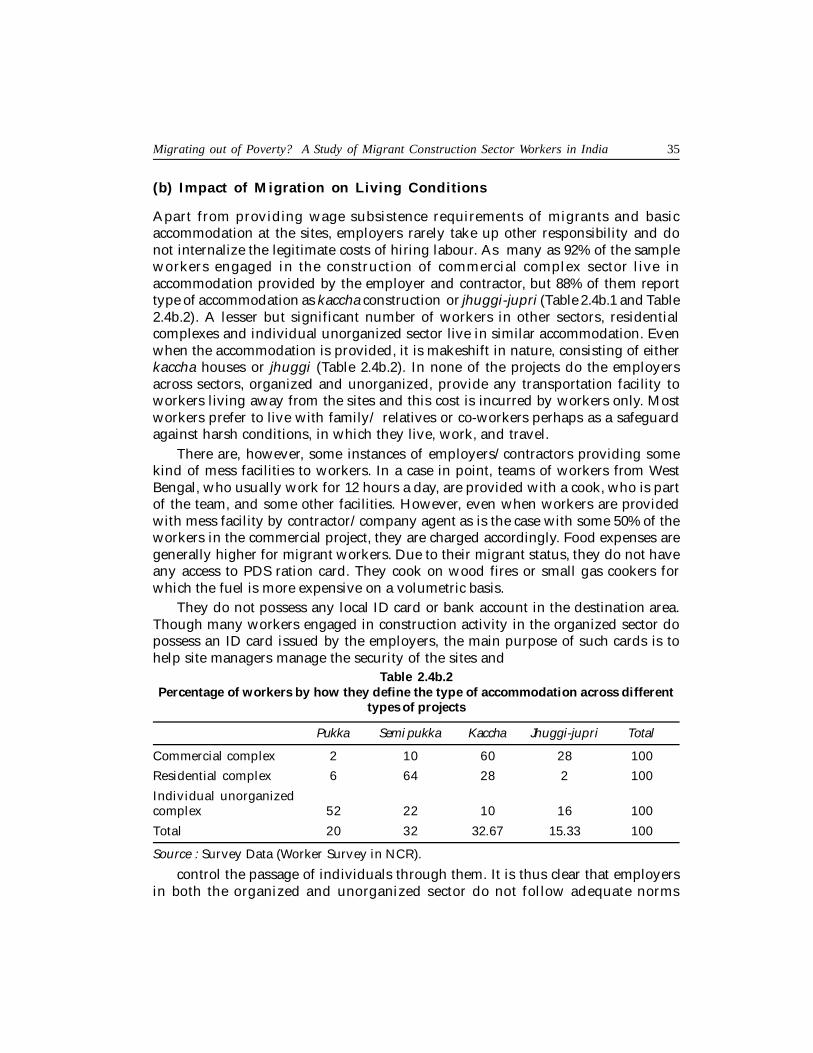
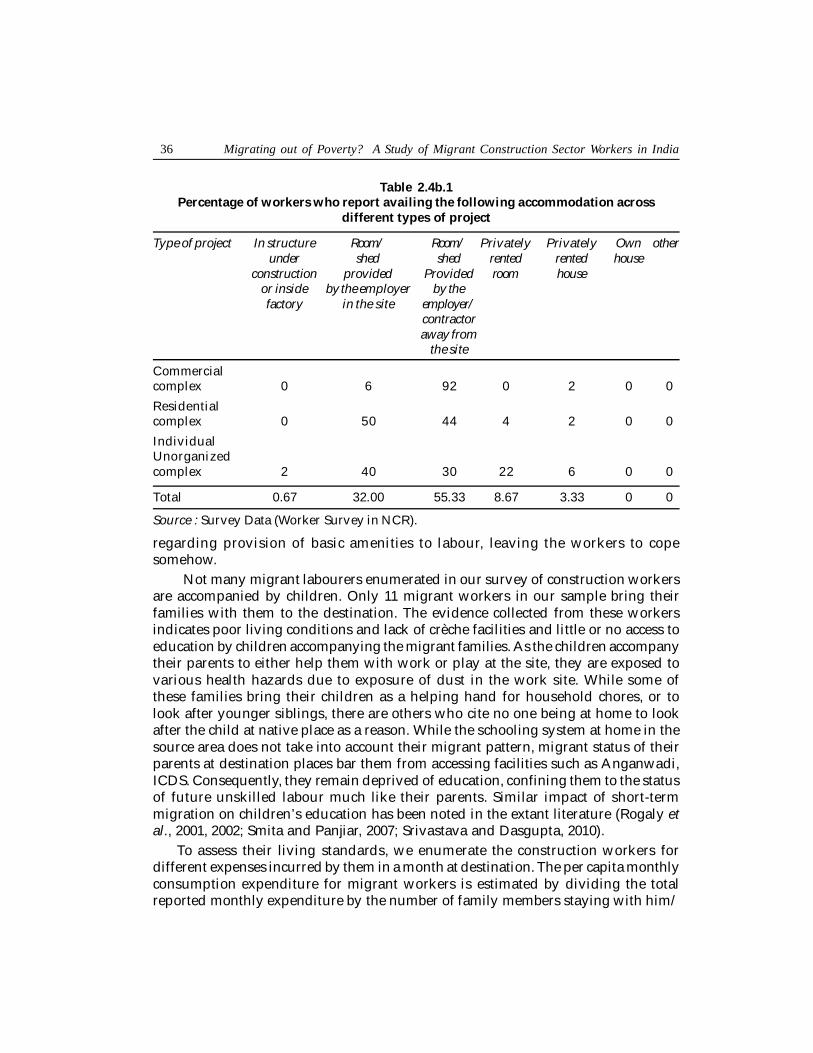
Apart from providing wage subsistence requirements of migrants and basicaccommodation at the sites, employers rarely take up other responsibility and donot internalize the legitimate costs of hiring labour. As many as 92% of the sampleworkers engaged in the construction of commercial complex sector live inaccommodation provided by the employer and contractor, but 88% of them reporttype of accommodation as kaccha construction or jhuggi-jupri (Table 2.4b.1 and Table2.4b.2). A lesser but significant number of workers in other sectors, residentialcomplexes and individual unorganized sector live in similar accommodation. Evenwhen the accommodation is provided, it is makeshift in nature, consisting of eitherkaccha houses or jhuggi (Table 2.4b.2). In none of the projects do the employersacross sectors, organized and unorganized, provide any transportation facility toworkers living away from the sites and this cost is incurred by workers only. Mostworkers prefer to live with family/ relatives or co-workers perhaps as a safeguardagainst harsh conditions, in which they live, work, and travel.
There are, however, some instances of employers/contractors providing somekind of mess facilities to workers. In a case in point, teams of workers from WestBengal, who usually work for 12 hours a day, are provided with a cook, who is partof the team, and some other facilities. However, even when workers are providedwith mess facility by contractor/company agent as is the case with some 50% of theworkers in the commercial project, they are charged accordingly. Food expenses aregenerally higher for migrant workers. Due to their migrant status, they do not haveany access to PDS ration card. They cook on wood fires or small gas cookers forwhich the fuel is more expensive on a volumetric basis.
They do not possess any local ID card or bank account in the destination area.Though many workers engaged in construction activity in the organized sector dopossess an ID card issued by the employers, the main purpose of such cards is tohelp site managers manage the security of the sites and
Table 2.4b.2Percentage of workers by how they define the type of accommodation across different
types of projects
Pukka Semi pukka Kaccha Jhuggi-jupri Total
Commercial complex 2 10 60 28 100
Residential complex 6 64 28 2 100
Individual unorganizedcomplex 52 22 10 16 100
Total 20 32 32.67 15.33 100
Source : Survey Data (Worker Survey in NCR).
control the passage of individuals through them. It is thus clear that employersin both the organized and unorganized sector do not follow adequate norms
36 Migrating out of Poverty? A Study of Migrant Construction Sector Workers in India
regarding provision of basic amenities to labour, leaving the workers to copesomehow.
Not many migrant labourers enumerated in our survey of construction workersare accompanied by children. Only 11 migrant workers in our sample bring theirfamilies with them to the destination. The evidence collected from these workersindicates poor living conditions and lack of crèche facilities and little or no access toeducation by children accompanying the migrant families. As the children accompanytheir parents to either help them with work or play at the site, they are exposed tovarious health hazards due to exposure of dust in the work site. While some ofthese families bring their children as a helping hand for household chores, or tolook after younger siblings, there are others who cite no one being at home to lookafter the child at native place as a reason. While the schooling system at home in thesource area does not take into account their migrant pattern, migrant status of theirparents at destination places bar them from accessing facilities such as Anganwadi,ICDS. Consequently, they remain deprived of education, confining them to the statusof future unskilled labour much like their parents. Similar impact of short-termmigration on children’s education has been noted in the extant literature (Rogaly etal., 2001, 2002; Smita and Panjiar, 2007; Srivastava and Dasgupta, 2010).
To assess their living standards, we enumerate the construction workers fordifferent expenses incurred by them in a month at destination. The per capita monthlyconsumption expenditure for migrant workers is estimated by dividing the totalreported monthly expenditure by the number of family members staying with him/
Table 2.4b.1Percentage of workers who report availing the following accommodation across
different types of project
Type of project In structure Room/ Room/ Privately Privately Own otherunder shed shed rented rented house
construction provided Provided room houseor inside by the employer by thefactory in the site employer/
contractoraway from
the site
Commercialcomplex 0 6 92 0 2 0 0
Residentialcomplex 0 50 44 4 2 0 0
IndividualUnorganizedcomplex 2 40 30 22 6 0 0
Total 0.67 32.00 55.33 8.67 3.33 0 0
Source : Survey Data (Worker Survey in NCR).

Migrating out of Poverty? A Study of Migrant Construction Sector Workers in India 37
her. The monthly per capita expenditure thus obtained for skilled and unskilledworkers are Rs. 1617.55 and Rs. 1144.69, respectively. These figures, when translatedinto daily per capita consumption expenditure, read as Rs 38 and Rs 55 for unskilledand skilled workers, respectively12
Such low daily per capita expenditure testifies to the low standard of livingmaintained at destination by the migrant workers, particularly those engaged asunskilled workers, who form the bulk of such workforce. These reported daily percapita expenditure can be put in perspective by sharp criticism sparked by Rs 32 aday per capita as poverty line fixed by the Planning Commission for urban areas in2009/10 (The Economic Times, 2011).
A number of case studies documenting living conditions of workers in differentconstruction sites indicate some differences between the organized and unorganizedsectors. The case studies suggest that the workers in the organized sector seem tobe availing somewhat better living facilities such as provision of basic accommodation,separate accommodation for a married couple, and drinking water and securityprovision at worksite, all arranged at the company’s expense. However, lack ofhygiene and cleanliness are clearly the issues that are evident during the visit tosome of the residences housing the workers. Some of these workers even reportaccessing the provision of anganwadi or school in nearby places. However, unlikethe formal sector, most construction works in the unorganized sector do not haveeven toilet facilities, or crèche facilities at the worksites. In some smaller projectseven in the unorganized sector, workers are seen to be encouraged by the contractorto stay in the construction sites. Such arrangements entail benefits for both workersand contractors. While workers can save on transportation costs and rent, theworkers staying in the workplace can both safeguard the construction sites andreport at the workplace on time. Unlike many worksites in the organized sector,workers in the informal sector have no access to the ID card facility nor are theyaware of basic safety equipments.
Our discussion with workers and contractors and security staff clearly indicatesthat paid leave is conspicuous by its absence even in the formal sector, with mostworkers getting only one paid half day in a week. Though construction work isgenerally held off on national holidays, the workers are not entitled to any paidholiday even on such occasions. Laws, such as those requiring workers to work notmore than 8 hours per day, except on overtime rates, are hardly followed in practice.Most workers work overtime at low rates in order to maximize earnings and savingsin a short duration.
(a) Remittances and Utilization
Remittance is one of the key channels through which migrants are able to stabilizeand better their conditions of living and which may even influence the pattern ofgrowth and development in the source areas.
38 Migrating out of Poverty? A Study of Migrant Construction Sector Workers in India
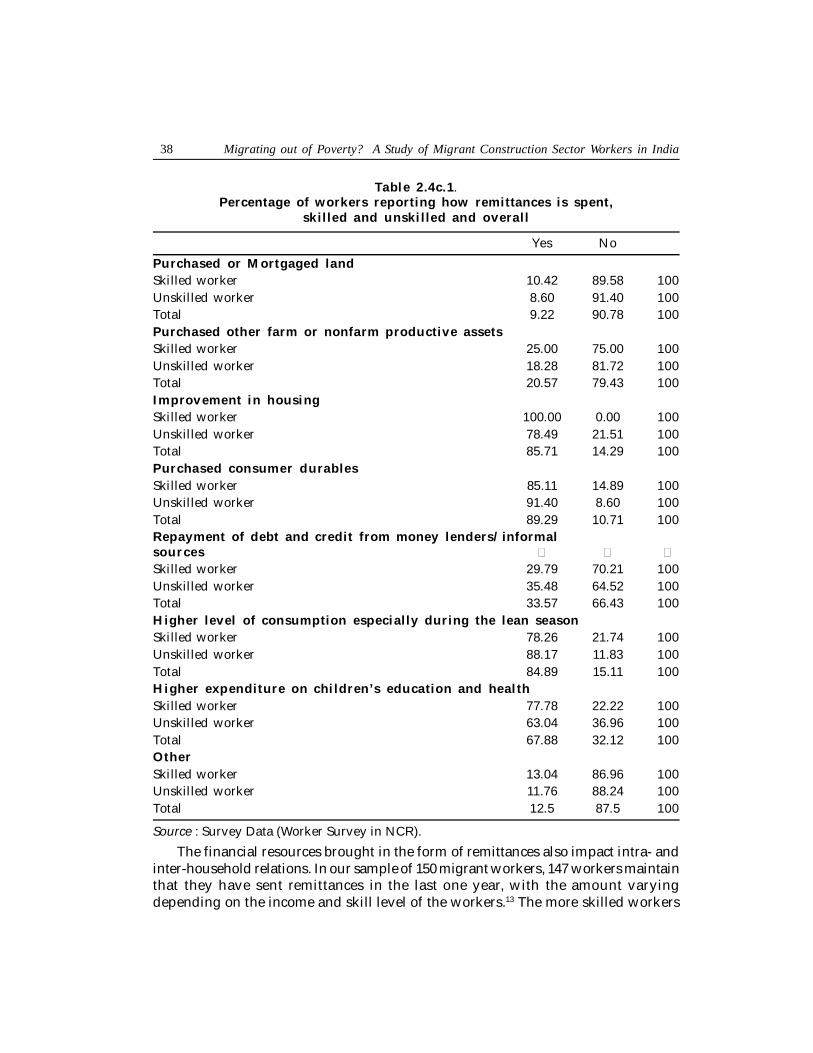
Table 2.4c.1 .Percentage of workers reporting how remittances is spent,
skilled and unski lled and overall
Yes No
Purchased or Mortgaged landSkilled worker 10.42 89.58 100Unskilled worker 8.60 91.40 100Total 9.22 90.78 100Purchased other farm or nonfarm productive assetsSkilled worker 25.00 75.00 100Unskilled worker 18.28 81.72 100Total 20.57 79.43 100Improvement in housingSkilled worker 100.00 0.00 100Unskilled worker 78.49 21.51 100Total 85.71 14.29 100Purchased consumer durablesSkilled worker 85.11 14.89 100Unskilled worker 91.40 8.60 100Total 89.29 10.71 100Repayment of debt and credit from money lenders/informalsour ces � � �Skilled worker 29.79 70.21 100Unskilled worker 35.48 64.52 100Total 33.57 66.43 100Higher level of consumption especially during the lean seasonSkilled worker 78.26 21.74 100Unskilled worker 88.17 11.83 100Total 84.89 15.11 100Higher expenditure on chi ldren’s education and heal thSkilled worker 77.78 22.22 100Unskilled worker 63.04 36.96 100Total 67.88 32.12 100OtherSkilled worker 13.04 86.96 100Unskilled worker 11.76 88.24 100Total 12.5 87.5 100
Source : Survey Data (Worker Survey in NCR).
The financial resources brought in the form of remittances also impact intra- andinter-household relations. In our sample of 150 migrant workers, 147 workers maintainthat they have sent remittances in the last one year, with the amount varyingdepending on the income and skill level of the workers.13 The more skilled workers

Migrating out of Poverty? A Study of Migrant Construction Sector Workers in India 39
have sent as much as Rs 36,810 as remittances on average that compares with anaverage of Rs 22,891 sent by unskilled workers. The impact of remittances on thehousehold economy could be via changes in the pattern of expenditure andinvestment. As evident in Table 2.4c.1, migrant households put the remittances tovarious uses.
Despite the differences in the amount of remittances sent by the skilled andunskilled workers, we do not notice much difference in the spending and investmentpattern. Among various uses, purchase of consumer durables, improvement inhousing, and higher level of consumption during lean season occupy top priority inboth groups of workers, suggesting definite improvement in their material conditionin the native place. A good number of workers spend part of their remittances onchildren’s education and health. We repeat this analysis for the households alsoduring the tracer survey. However, the cash income earned during the migrationperiod may not always add to the net resource base of the migrant household asevidenced by 33% of workers reporting that they also use remittances to settle debtand credit from money lender/ informal sources. Similar use of remittances hasbeen recorded in earlier literature (NCRL 1991; Mosse et al., 2002).
Evidence of other productive farm and non-farm investment, as noted in someother micro studies (Oberoi and Singh, 1983; Krishnaiah, 1997; Sharma, 1997) is alsofound among the migrant workers in our study. While 20% of the migrant workersreport similar expenditure in our survey, about 1 in 10 migrants also purchase land.
2.5. Perceptions of Migrant Workers Regarding Living and Working Conditionsat Destination and Origin
To assess the impact of migration, we also asked workers to compare the living andworking conditions in their native places with those in the destinations where theyare living presently.
There is a clear dichotomy in the perception of workers regarding livingconditions including housing on the one hand, and availability of employment andremuneration, on the other. Most workers perceive their housing and livingconditions as generally worse in the destination areas. Only 19% of the workersreport their housing conditions as better at destination, and only 32% report theirgeneral living condition as better at destination.
On the other hand, most workers report their working conditions,remuneration and availability of employment, and overall assessment being betterat the place of destination than their native place. Such contrasts in responses alsoreflect condition of sheer destitution in which they live in their native place and thedecline of availability of livelihoods in the source areas. While responses are broadlysimilar for skilled and unskilled workers, a slightly smaller proportion of skilledworkers reports conditions at the destination as being better.

40 Migrating out of Poverty? A Study of Migrant Construction Sector Workers in India
Table 2.5 Percentage of workers on how they compare present location withnative place across type of project
Housing Better here Same Worse Difficult Totalhere to say
Skilled workers 11.76 17.65 64.71 5.88 100
Unskilled workers 23.23 25.25 51.52 0.00 100
Total 19.33 22.67 56 2 100
Other l iving condition
Skilled workers 27.45 17.65 49.02 5.88 100
Unskilled workers 34.34 16.16 47.47 2.02 100
Total 32 16.67 48 3.33 100
Working condition
Skilled workers 98.04 1.96 0.00 0.00 100
Unskilled workers 96.97 3.03 0.00 0.00 100
Total 97.33 2.67 0.00 0.00 100
Amount of Employment available
Skilled workers 98.99 0.00 0.00 1.01 100
Unskilled workers 98.04 0.00 0.00 1.96 100
Total 98.67 0.00 0.00 1.33 100
Remunerati on/Ear ning
Skilled workers 78.43 1.96 5.88 13.73 100
Unskilled workers 87.88 3.03 2.02 7.07 100
Total 84.67 2.67 3.33 9.33 100
Feeling of security
Skilled workers 15.69 29.41 21.57 33.33 100
Unskilled workers 20.20 41.41 18.18 20.20 100
Total 18.67 37.33 19.33 24.67 100
Freedom from social constraints
Skilled workers 32 20 4 44 100
Unskilled workers 35.71 36.73 3.06 24.49 100
Total 34.46 31.08 3.38 31.08 100
Overal l
Skilled workers 95.83 2.08 0.00 2.08 100
Unskilled workers 92.63 4.21 1.05 2.11 100
Total 93.71 3.50 0.70 2.10 100
Source : Survey Data (Worker Survey in NCR).

Migrating out of Poverty? A Study of Migrant Construction Sector Workers in India 41
Overall, most workers interviewed attest to some positive impact of migrationon the living conditions of workers, perhaps indicating conditions of sheer destitutionin their native places. Most of the workers also agree that the extra income that theyearn as migrant labour in the construction sector allows them better access to foodand schooling for their children.
2.6. Some Conclusions from the Workers Survey in NCR
The survey of migrant construction workers in three sub-sectors: commercialcomplexes, residential complexes, and individual residential construction across threelocations Delhi, Gurgaon, and Noida in the NCR of Delhi reflects on the workingand living conditions of the workers in the construction sector. It also examines howthe remittances are put to use by migrant workers and their families to improvetheir standard of living. The study also relies on a number of qualitative questionson comparative assessment of key indicators both at source and destination areas toassess the impact of migration on their standard of living.
The findings point towards overall benefits of migration to the migrant workers.The channels through which such improvements occur are mainly through highervolumes of employment and earnings than would have been possible in their nativeareas. Although the workers themselves maintain a low level of expenditure, theyare able to save and remit, and use their remittances to improve their condition ofhousing in the native areas, purchase some durables, repay their loans, and spendon their children’s education. One in five migrants also adds to their productiveasset base and one in ten migrants also purchases land. Some of these male workersalso have the possibility of acquiring some skills on the job and thus improve theirwages.
The survey also highlights that there is some significant premium for acquiringskills, as evidenced by higher advances and higher wages obtained by the skilledworkers compared to their unskilled counterparts in both the organized andunorganized sectors. The details of per capita consumption expenditure show thatskilled workers maintain better standard of living compared to the unskilled workers,indicating that acquiring skills can provide a major route out of poverty.
However, such overall benefits accruing to the migrant households are not withoutsignificant trade-offs, as symbolized by poor working conditions of the migrantworkers in the workplace, and the living conditions of the workers and accompanyingfamily members at the destination. Workers achieve higher earnings partly throughsignificantly high work intensities, often working up to 12 hours a day. Safetystandards are lax and the workers are exposed to a number of health risks. There isbrazen violation of labour regulations by employers, in both the organized andunorganized sectors. Few workers have local identification and therefore cannotmake any claim to entitlements. Though the Building and Construction Workers’Welfare Act provides for social security, healthcare, and safety of workers engagedin the construction sector, the workers enumerated in our survey are neitherregistered under the Act, nor do they obtain any social security. The recruitment

42 Migrating out of Poverty? A Study of Migrant Construction Sector Workers in India
pattern, lack of local entitlements, and absence of social security for constructionworkers all stem from a situation in which these seasonally migrant or circularworkers are employed in an informal labour regime, through intermediaries. Theseasonal nature of their migration indicates that they have very tenuous localentitlements.
The demand for such workers has burgeoned due to rapid growth in theconstruction sector especially in and around major centres of agglomeration such asNCR. In a growth pattern marked by agglomeration economies in and around pre-existing growth centres, there are significant and asymmetric costs that are borneby poorer labour migrants and their families. Neither the state nor the employersappear willing to bear and subsidize part of the costs through appropriate policiesand investment in necessary infrastructure. As evidenced by pattern of wages paidand the entitlements of benefits to the construction workers, none of the states, beit Delhi, Haryana, or Uttar Pradesh that cover our survey areas, appears willing orcapable enough to formulate appropriate labour and social policies and enforce themin the interest of the migrant workers. What makes the matter worse is the migrantstatus of construction workers who have little, if any, voice to influence policies intheir favour.
Our study shows that while the labour regime has been characterized byincreasing flexibility, large-scale migration of footloose labour to the constructionsector tends to be highly organized and segmented, resulting in lower wages, oftenfixed at source area, than those generally prevailing in the destination. This facilitatescertain kind of growth and accumulation but through a low or dirt road to capitalism(Srivastava, 2011b). Surprisingly, because of the pattern of recruitment organizedthrough intermediaries, it is the labourers in the formal sector who receive lowerwages compared to their counterparts in the informal sector.
3. IMPACT OF LABOUR MIGRATION ON HOUSEHOLDS AT ORIGIN:RESULTS OF THE TRACER SURVEY
The study has followed up the survey of construction workers in NCR with a tracersurvey to trace these migrant construction workers to their source area and thenexamine the impact of migration on their welfare in the source area. The assessmentof the impact of migration on poverty in the source area involves comparing migrantlabour households with non-migrant labour households who have comparablehousehold characteristics and asset holdings, thus constituting a control group.Moreover, we rely on a number of questions, both quantitative and qualitative, toidentify whether the migrant labour are differently placed to begin with, comparedto their non-migrant neighbours that facilitate their migration to other states insearch of their livelihood.
3.1. Methodology and Survey details
The primary data collected in our first phase of survey in NCR suggests that most ofthe construction workers hail from resource-poor and rain-fed parts of India,
Migrating out of Poverty? A Study of Migrant Construction Sector Workers in India 43
primarily Central and Eastern India including Orissa, West Bengal, Bihar,Bundelkhand in UP and MP, Chhattisgarh, and Jharkhand. Based on the informationobtained from our interviews with workers in NCR, we selected two states, namelyBihar and West Bengal – states which report the most number of sample migrants.We then located those villages in these two states from where a number of sampleworkers have reportedly migrated to the surveyed construction sites. Finally twovillages were selected, Krishnanagar from Malda district of West Bengal andNarayanpur from Samastipur district of Bihar for the tracer survey. In our firstphase of survey in NCR, five labourers reported to be migrating from Narayanpurin Samastipur and eight labourers reported to be migrating from Krishnanagar inMalda district. Apart from the information collected in our NCR survey, othersecondary reports that we have relied on, suggest that the regions selected fortracer survey have a long history of migration, thus providing us with an idealsetting to better map the linkage between poverty and migration. Our focus groupdiscussion with village sarpanch and other stakeholders in these villages suggest thata long history of migration defines the economies of both villages.
Samastipur is one of the most backward districts in the state of Bihar with mostrural households having little option outside agriculture. Situated around 40 kmaway from the Block Head Quarter, Mohinuddin Nagar, Narayanpur is an outskirtvillage with little or no connectivity with pukka road. The region is often ravagedby floods during the monsoon and boats remain the only mode of communicationwith the outside world. Social profile of the population in the village shows severalcastes that include Paswan, Kewat, Yadav, and Kumhar. Among them, Paswan is themost dominant caste economically, socially, and politically. Though most householdsacross castes are engaged in agriculture, some are still persisting with other traditionaloccupations defined by their castes. A case in point is households from Kewat andKumhar caste who are still into fishing and pottery as their part time occupation.Ironically, though the district boasts of one of the oldest agricultural universities inIndia, our survey village, much like many other villages in the district, remainsagriculturally backward because of poor road connectivity and lack of access totransport by majority of native people. Most practices in agriculture still remainbackward. Maize and Tobacco are two major crops in the region. However, regionsnot affected by flood grow other crops such as rice, wheat, and vegetables. Asignificant segment of the village population is landless, with majority of landlesshouseholds leasing in land owned by higher castes living in and around the Block.However, tenancy market has been on decline in the recent times. Informationcollected in our focus group discussion attributes declining tenancy market toincreasing political mobilization of people from lower castes which has caused asense of fear among the rural households with surplus land. Many households fromupper castes with surplus land prefer to cultivate themselves or even keep theirland fallow than risk losing it. A number of other factors related to agriculture suchas little or no irrigation, ever decreasing land holdings and increasing cost ofcultivation, have left a majority of rural household with no option but to bank onmigration as an important livelihood strategy.
44 Migrating out of Poverty? A Study of Migrant Construction Sector Workers in India
Adding to the woes of the rural people is the dysfunctional public deliverysystem. The focus group discussion conducted with different key informants in thevillage that include Sarpanch (village head) and rural households conveys a strongsense of frustration borne out of long-term government apathy towards the village.The lack of concern in the government departments, according to them, is visible inevery sphere of rural life. Though a large number of households in the village possessNREGA job cards, few report actually working on the project. Among the otherpublic delivery programmes, the PDS is also almost nonexistent with most ruralhouseholds reporting receiving subsidized food grains through the programme onlyfor three to four months in a year.
The region has a long history of migration. Many of the migrants either migratedto Kolkata or Punjab. In fact, till early 1980s, Punjab, with its booming agriculture,was a natural destination for much of the village migrant labourers, who traveled tothe state as agricultural labour in the peak season. However, the hostile attitudetowards the migrant labour during separatist movement in the state of Punjab forcedthem to look for other destinations such as Delhi, Mumbai, South India, and urbanHaryana, where many of them were engaged as coolie labour. Migrant labourgradually drifted towards the construction sector, which was growing in size andemployment by then. Some of them managed to migrate to countries such as SaudiArabia, Kuwait, and Libya for higher remunerations. A few later emerged ascontractors who worked as conduits for recruiting the locals and relatives into theconstruction sector. Though some of the rural households work as migrant labour inother sectors, the lure of construction sector for the majority of casual labour in thevillage is undeniable because of easy accessibility of jobs in the sector. The networkinvolving the local contractors plays a crucial role in enhancing accessibility of jobsin this sector.
The migration history of the second selected village, Krishnanagar, makes for aninteresting case study of migration patterns witnessed in the post liberalization periodin India. Located just 15 km away from the Block headquarter, Krishnanagar villagein Malda district boasts of robust connectivity with pukka road, and is well connectedwith the township of Malda. The village economy of Krishnanagar has long beencharacterized by diversification towards non-farm activities, with beedi making andother cottage industries such as embroidery, being the prominent activities outsideagriculture. Many of these cottage industries have faded away over time, particularlysince early 1990s following the import of cheaper products. Increased mechanizationin many of the agricultural operations in the recent times implies that the village,with not enough land to support burgeoning population, has increasingly witnessedmigration to other states as a livelihood strategy. However, the migration history ofthe region can be traced back to much older days. During the course of the survey,the village elders maintained that migrant labour from the region has a well-earnedreputation as skilled construction workers since the British period. They furtherobserve that their contribution in the construction of the large buildings in Kolkataduring the British regime is acknowledged even now.
Migrating out of Poverty? A Study of Migrant Construction Sector Workers in India 45
Apart from mangoes, the village largely grows three crops: rice, wheat, andonion. Though some part of the agriculture has access to irrigation facility, most ofthe cultivation is done using traditional methods only. Income and employmentrealized from the sector are never sufficient to support majority of householdsthroughout the year. Predominantly inhabited by Muslims, the village is characterizedby backwardness in education. Land distribution in the village is also highly unequal,with majority of the village natives possessing little or no land. Most of the agriculturaloperations are rain-fed and the labour requirement in the sector has never been formore than three to four months, thus pushing the labour out of the sector for majorpart of the year. The agricultural operations are still largely managed by malemembers of the household, with the role of women being confined to activities thatcan only be performed at home such as beedi making.
Unlike Narayanpur, the rural people in Krishnanagar have better experience ofpublic delivery programme. Most of the basic facilities such as books, dress, andfood are available in schools. Other government programmes such as PDS andAnganwadi are functioning with regularity. Case studies documented in the villageindicate that awareness among the local public about the government programmedoes contribute to better functioning of the programme. However, the enthusiasmamong the villagers for works under the MNREGA is found to be low, perhaps dueto higher local wages in other sectors, and easy access to jobs at the destination.
The social profile of the village population indicates that disadvantagedcommunities such as scheduled castes and religious minority account for bulk of therural population in these villages. This perhaps reflects a larger pattern that therural poor in India are largely concentrated among socially disadvantagedcommunities, living in the resource-poor regions. Not surprisingly, many poor amongthese communities see migration as the road to economic and social mobility.
We conducted census in both these villages to identify three categories of labourhouseholds: one category from which at least one member has migrated to theconstruction sector (Category 1), the second category from which at least one memberhas migrated to sectors other than construction (Category 2), and the third categoryconsists of non-migrant households from which no labourer is currently migratingout of the village (Category 3). Households who do not rely predominantly oncasual labour for their subsistence are excluded from the categorization. Thus, inour efforts to better understand the cause and effect of migration, we haveconsciously avoided enumeration of farming or salaried households to ensurecomparison across similar types of households. We need to note that the Category 3households may also include households with a past migration history although nomember of the household is currently a labour migrant.
The aim of the tracer survey is to compare a sizeable number of migrant andnon-migrant labour households (preferably up to 20 households and not less than15 in each case and each village). For the purpose of sample selection, we have firstselected those households in Category 1 that include migrant labourers interviewedat destination. We have then selected (subject to availability) the remaining households

46 Migrating out of Poverty? A Study of Migrant Construction Sector Workers in India
in Categories 1 and 2 (combined), and a similar number of households in Category3, using the method of systematic random sampling.
We thus have a sample of 38 households in Narayanpur (Samastipur/Bihar) whichincludes 21 households from Category 1, 9 from Category 2, and 8 from Category 3.In Krishnanagar, we repeated a similar strategy to select a sample of 42 householdswhich include 14 from Category 1, 10 from Category 2, and 18 from Category 3.Thus, a total of 80 households are enumerated during the tracer survey, that include35 sample households from Category 1, 19 sample households from Category 2, and26 sample households from Category 3. We, however, report most of the estimatesof two migrant groups together as one treatment sample and report them separatelyonly when our analysis demands so. For the remainder of the study, we would referNarayanpur and Krishnanagar as V1 and V2 respectively.
The household survey is also supplemented with focus group discussionsconducted with key informants in the village which include contractors/ middlemen and sarpanch to provide the background to the tracer survey. This phase of thesurvey was carried out between February and April 2013.
3.2 Profile of Sample Households
The social profile of the sample households across villages shows that all thehouseholds belong to socially disadvantaged groups such as lower castes and religiousminority, reflecting the predominance of casual labour as livelihood option amongsuch groups. In V1, all the sample households are Hindu, with disadvantagedcommunities such as SC and OBC accounting for the whole of sample households.The SC and OBC account for 42.1% and 57.89% of the total sample of households inthe village. All the sample households from V2 belong to Muslim community.
There is little difference in the size of household between migrant and non-migrant households in V1 with the average household size being 5.77 and 5.88,respectively.14 However, the average household size between the two groups variessignificantly in V2, with migrant households reporting the average household sizeas 5.08 in comparison to 4.28 reported by non-migrant households.
The sex composition of a typical migrant household is found to be in favour ofmales in both the villages, with migrant households in V1 and V2 reporting 56.75%and 61% of their members, respectively, as males. In contrast, the non-migranthouseholds in V2 r village report the share of male members as only 43.87%. In V1,non-migrant households report 63.54% of their members as males.
The age distribution of household members including seasonal migrants is givenin Table 3.2.1. In both villages, the percentage of household members in the agegroup 15 to 39 years is higher among migrant households than among non-migranthouseholds. Further, the percentage of household members who were either below15 years, or over 60 years, is also higher among non-migrants. However, despite ahigher percentage of children below 15 years in non-migrant households, the averageage of members of migrant households in both villages is less than that of non-migrant households, with a typical migrant household in V1 and V2 reporting average

Migrating out of Poverty? A Study of Migrant Construction Sector Workers in India 47
ages of 24.5 years and 24.6 years, respectively. Non-migrant households in V1 andV2 report the average age of their family members as 26.3 years and 26.8 years,respectively.
The education profile of households varies significantly across both villages andmigrant status. The rate of illiteracy in the households does not differ significantlyacross migrant and non-migrant households in V1, with both migrant and non-migrant households reporting illiteracy at 35.08% and 39.38%, respectively. However,the difference is stark in V2 , with migrant households being better placed with43.31% illiteracy in comparison to 55.94% reported by non-migrant households (Table3.2.2). Overall, literacy rate among the migrant households is higher than non-migranthouseholds, indicating better basic human capital among migrant households. Migranthouseholds in both villages retain better educational endeavor up to middle educationlevel.
Table 3.2.2Percentage share of educational qualification of household members five years and
above by migrant status in two villages
V1 Illiterate Primary Middle Matriculate Totalor less education and above
Migrant Households 35.08 55.47 8.23 1.22 100
Non-Migrant Households 39.38 53.54 2.08 5 100
V2
Migrant Households 43.31 43.01 7.15 6.53 100
Non-Migrant Households 55.94 32.11 2.04 9.91 100
Source: Survey Data (Tracer Survey).
However, non-migrant households have a higher percentage of population withTable 3.2.1
Distribution of family members in different age categories across migrants ta tus
Migrant Non-MigrantV1Age Profile0-14 33.2 (20.3) 36.2 (22.8)15-39 44.5 (22.2) 36.9 (12.7)40-59 17.8 (15.9) 21.7 (22.0)60-above 4.5 (8.9) 5.3 (7.8)V20-14 29.9 (21.5) 32.6 (26.8)15-39 49.2 (16.8) 38.3 (26.5)40-59 20.4 (18.0) 28.3 (37.1)60-above 0.5 (2.6) 0.8 (3.4)
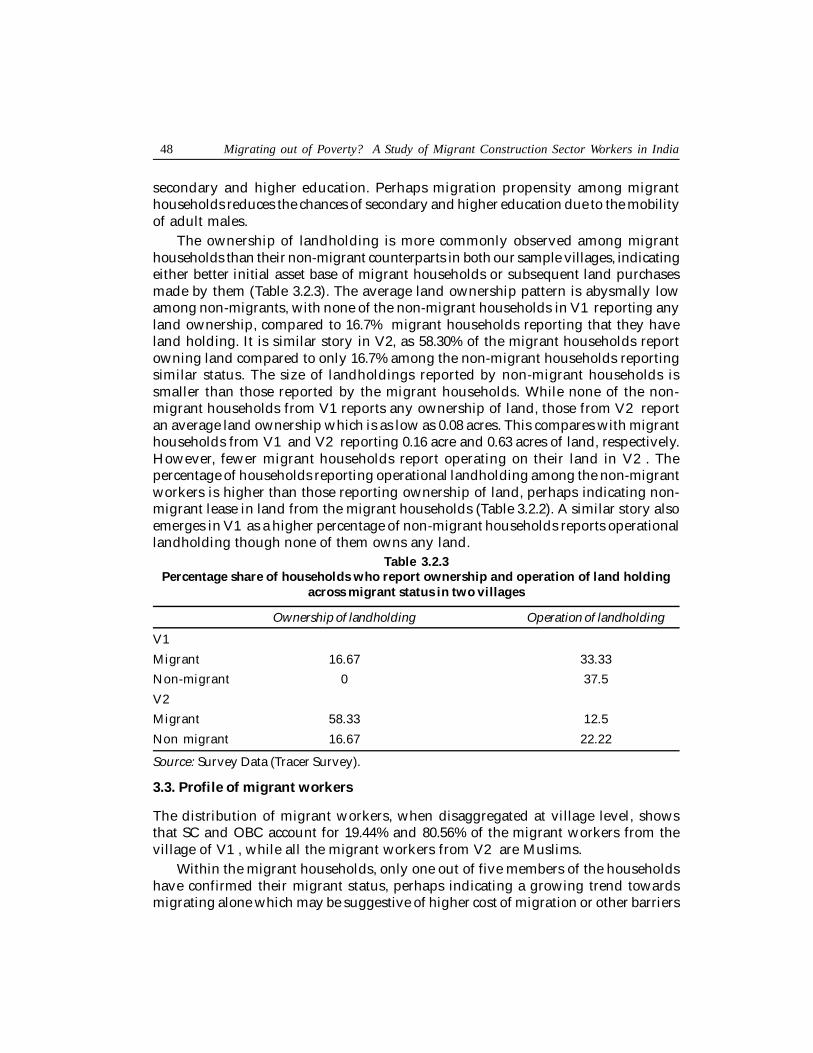
48 Migrating out of Poverty? A Study of Migrant Construction Sector Workers in India
secondary and higher education. Perhaps migration propensity among migranthouseholds reduces the chances of secondary and higher education due to the mobilityof adult males.
The ownership of landholding is more commonly observed among migranthouseholds than their non-migrant counterparts in both our sample villages, indicatingeither better initial asset base of migrant households or subsequent land purchasesmade by them (Table 3.2.3). The average land ownership pattern is abysmally lowamong non-migrants, with none of the non-migrant households in V1 reporting anyland ownership, compared to 16.7% migrant households reporting that they haveland holding. It is similar story in V2, as 58.30% of the migrant households reportowning land compared to only 16.7% among the non-migrant households reportingsimilar status. The size of landholdings reported by non-migrant households issmaller than those reported by the migrant households. While none of the non-migrant households from V1 reports any ownership of land, those from V2 reportan average land ownership which is as low as 0.08 acres. This compares with migranthouseholds from V1 and V2 reporting 0.16 acre and 0.63 acres of land, respectively.However, fewer migrant households report operating on their land in V2 . Thepercentage of households reporting operational landholding among the non-migrantworkers is higher than those reporting ownership of land, perhaps indicating non-migrant lease in land from the migrant households (Table 3.2.2). A similar story alsoemerges in V1 as a higher percentage of non-migrant households reports operationallandholding though none of them owns any land.
Table 3.2.3Percentage share of households who report ownership and operation of land holding
across migrant status in two villages
Ownership of landholding Operation of landholding
V1
Migrant 16.67 33.33
Non-migrant 0 37.5
V2
Migrant 58.33 12.5
Non migrant 16.67 22.22
Source: Survey Data (Tracer Survey).
3.3. Profile of migrant workers
The distribution of migrant workers, when disaggregated at village level, showsthat SC and OBC account for 19.44% and 80.56% of the migrant workers from thevillage of V1 , while all the migrant workers from V2 are Muslims.
Within the migrant households, only one out of five members of the householdshave confirmed their migrant status, perhaps indicating a growing trend towardsmigrating alone which may be suggestive of higher cost of migration or other barriers

Migrating out of Poverty? A Study of Migrant Construction Sector Workers in India 49
to migration noted in some other literature (Kundu, 2009). Such migration trend, asalready noted in our worker survey, may also reflect the long history of migration,with many workers already establishing bridgeheads at the destination.
There is no female worker in the sample of 62 migrant workers in total in twovillages, indicating the male selective nature of labour outmigration in the studyvillages.
Such limited participation of females in the migrant workforce in the constructionsector has also been observed in the construction worker survey in NCR. Amongthe total migrant workers in the two villages, 21.67% of them happen to be those wealready interviewed in the worker survey in NCR.
Further, the age profile of principal earners in the migrant and non-migrantfamilies shows that not only could seasonal migration be age selective, but therecould also be life cycle issues at play, with the older age profile of earners in non-migrant households (which could include former seasonal migrants). In V1, theaverage age of the principal earners in migrant and non-migrant households was34.6 and 40.6 years, respectively, whereas in V2, it was 32.1 years and 40.3 years,respectively. The relatively younger age profile of the migrant workers (who aregenerally the principal earners in migrant households) in the tracer survey confirmsour observation in the NCR worker survey that it is mostly the young and activemembers of the households who participate in migration as a livelihood strategy.
Overall, one-third of the migrant workers are unmarried. The marriage statuswhen disaggregated at the village level, shows that 38.24% and 26.92% of the migrantworkers from V1 and V2 , respectively, report as unmarried.
Most of the migrant workers have reported poor education status, with 65% ofthem reporting their education status as below primary education. The status ofeducation of the migrant workers when disaggregated at the village level shows asimilar dismal picture across villages. As many as 61.76% of the migrant workersfrom V1 report their education status as below primary education, and 69.23% ofthe migrant workers in V2 report a similar status.
Given such poor education status, it is not surprising that only 10.64% of themigrant workers report as skilled workers, indicating that most migrant workersare stuck in low-skilled low-wage work. Such predominance of unskilled workersin the migrant workforce is observed in NCR survey. Most of the migrant workerswork as daily wage workers. While 68.09% of the migrant workers report workingas daily wage workers, another 19.15% reported getting paid on a piece meal basisand the remaining 12.77% workers received payment as monthly wage. As many as97.87% of the migrant workers report working as casual workers, indicating poorand uncertain conditions in which these migrant workers work.
3.4. Impact of Migration
The impact of short-term and seasonal migration on the source area is multi-dimensional. It depends on a number of factors, and their net impact determines thenature and extent of benefits accruing to migrant households. If migration is an
50 Migrating out of Poverty? A Study of Migrant Construction Sector Workers in India
involuntary response to the distress in the source area and workers are locked intodebt migration cycle, benefits normally associated with earning differentials maynot materialize at all and may even result in conditions of neo-bondage (Srivastava,2005, 2009b). If such migration is voluntary and driven by the earning differentialsin the destination, benefits do occur, particularly when the initial endowments ofmigrant households are favourable. The impact on the source area may occur througha number of channels, which include changes in the labour market, income, assets,and how the remittances earned through migration are spent by the migranthouseholds. Some of the less-direct ways through which migration impacts the sourcearea include changes in attitudes and awareness, resulting in better perception ofeducation and other qualities of life. Better exposure in the destination make migrantlabour more assertive in their demand for better conditions and better wages evenin the local labour market. Their attitude towards personalized labour relations alsoundergoes changes (Srivastava, 1999).
The present section considers this question by comparing two groups – migrantand non migrant labour – on a number of indicators which include education, assetprofile, and how the purchase of such assets is financed by two groups. In addition,the study also examines the consequences for the local labour market. The studyalso relies on qualitative data to throw light on how the sample households perceivechanges in the living conditions of their family with respect to their neighbours aswell as their own past more than 5 years ago.
(a) Impact on education
The impact of migration on schooling and education of children is ambiguous. Whilemigration with family seems to limit access to education for the migrating children,the effect on education in the source area seems to be positive. As evident in ourworker surveys, some migrant labourers do migrate with families, including children,which deprives them of education in the local schools. Many of these children areoften taken to the destination to take care of their younger siblings at the workplaceor to assist their parents as an additional help, and may fail to access the schoolingfacilities at destination.
An analysis of the educational status of children in the age groups of 5 to 14years in the source villages shows that the percentage of children who attended butdropped out later is equal across migrant and non-migrant groups in V1 . Thepercentage of children dropping out is no different across migrant status, suggestingthat migration is not associated with positive impact on dropout rates (Table 3.4a.1.).Even in V2 , as many as 6.67% of children in the age group of 5 to 14 years reporteddropout status vis-a-vis 10% of children among the non-migrant reporting similarstatus.
However, the responses by both migrant and non-migrant groups suggest thatthe overall impact of migration on education of children in the source area is positive,as evidenced by a number of indicators explained below. These changes may havetaken place both due to changes in attitudes towards education and higher earnings

Migrating out of Poverty? A Study of Migrant Construction Sector Workers in India 51
due to migration that allows the rural households to send their children to schools.The percentage of school goers in the 5 to 14 age group is higher among migrantgroups compared to non-migrants in both villages. In V1, migrant households report81.25% children in the 5 to 14 age group as schoolgoers. This compares with 75% ofthe children in the same age group being reported by non-migrant households withthe similar status. The percentages of currently enrolled in school in the same agegroup in V2 present a similar picture, with migrant households reporting 87.77%school goers vis-a-vis non-migrants reporting only 76.67% school goers.
Migration by rural households also affects the choice of schooling in favour ofprivate schools. Both migrant and non-migrant families in the villages of V1 sendtheir children to public schools, a choice driven perhaps by the unavailability ofprivate schools in the area, thus limiting the choice of their parents. However, thescenario in V2 gives an interesting picture of what better earnings and better exposureto the outside world through migration does to schooling. While 36.67% of themigrant households access private schools for their wards, no one from the non-migrant households reported such preference.
The average expenses on education incurred per child by sample householdsalso differ across households with different migrant status. Migrant householdsspend more on educating their wards compared to their non-migrant neighbours inboth villages, reflecting better attitudes and higher spending ability. When comparedacross villages, V1, with none of the households accessing private education, notsurprisingly, reported significantly lower expenses on education per child thanhouseholds from V2 (Table 3.4a.2). Interestingly, even within the context of limitedschooling choices, migrant households in V1 spend more than their non-migrantneighbours. Our observation on the importance assigned to education by migranthouseholds has also been confirmed in our worker survey in NCR whereapproximately 68% of the migrant workers reported spending remittances oneducation of their children. Such evidence on the use of remittances has also been
Table 3.4a.1 Educational Status of children in the age group 5 to 14 years by migrantstatus in two villages
Never Attended but Currently Totalattended dropped enrolled in school
V1
Migrant Households 6.25 12.50 81.25 100
Non-Migrant Households 12.50 12.50 75.00 100
V2 �
Migrant Households 5.56 6.67 87.77 100
Non-Migrant Households 13.33 10.00 76.67 100
Source: Survey Data (Tracer Survey).
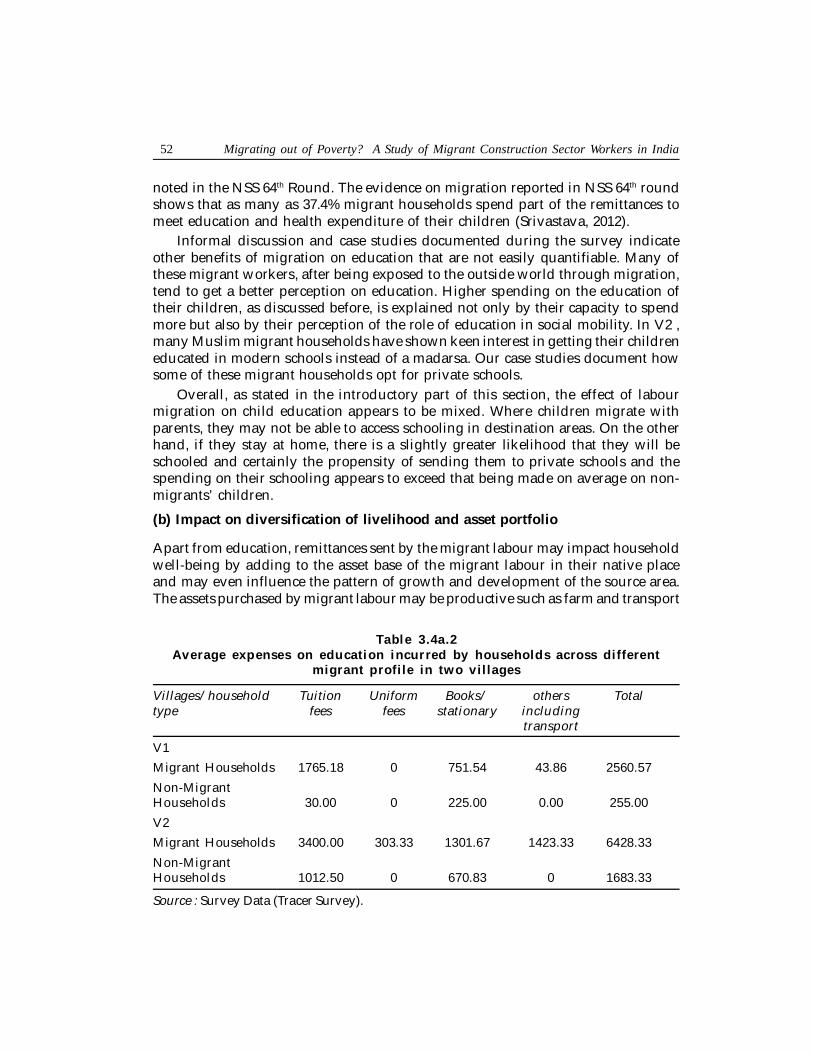
52 Migrating out of Poverty? A Study of Migrant Construction Sector Workers in India
noted in the NSS 64th Round. The evidence on migration reported in NSS 64th roundshows that as many as 37.4% migrant households spend part of the remittances tomeet education and health expenditure of their children (Srivastava, 2012).
Informal discussion and case studies documented during the survey indicateother benefits of migration on education that are not easily quantifiable. Many ofthese migrant workers, after being exposed to the outside world through migration,tend to get a better perception on education. Higher spending on the education oftheir children, as discussed before, is explained not only by their capacity to spendmore but also by their perception of the role of education in social mobility. In V2 ,many Muslim migrant households have shown keen interest in getting their childreneducated in modern schools instead of a madarsa. Our case studies document howsome of these migrant households opt for private schools.
Overall, as stated in the introductory part of this section, the effect of labourmigration on child education appears to be mixed. Where children migrate withparents, they may not be able to access schooling in destination areas. On the otherhand, if they stay at home, there is a slightly greater likelihood that they will beschooled and certainly the propensity of sending them to private schools and thespending on their schooling appears to exceed that being made on average on non-migrants’ children.
(b) Impact on diversification of livelihood and asset portfolio
Apart from education, remittances sent by the migrant labour may impact householdwell-being by adding to the asset base of the migrant labour in their native placeand may even influence the pattern of growth and development of the source area.The assets purchased by migrant labour may be productive such as farm and transport
Table 3.4a.2Average expenses on education incurred by households across different
migrant profile in two villages
Villages/household Tuition Uniform Books/ others Totaltype fees fees stationary including
transport
V1
Migrant Households 1765.18 0 751.54 43.86 2560.57
Non-MigrantHouseholds 30.00 0 225.00 0.00 255.00
V2
Migrant Households 3400.00 303.33 1301.67 1423.33 6428.33
Non-MigrantHouseholds 1012.50 0 670.83 0 1683.33
Source : Survey Data (Tracer Survey).
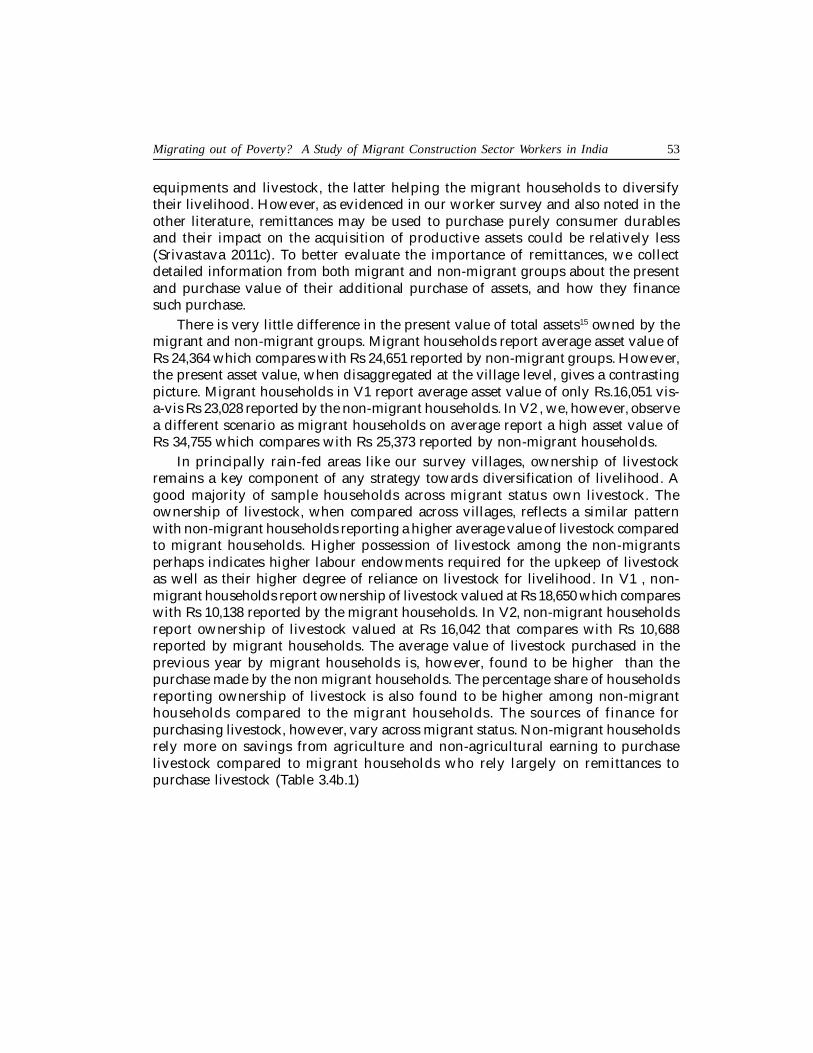
Migrating out of Poverty? A Study of Migrant Construction Sector Workers in India 53
equipments and livestock, the latter helping the migrant households to diversifytheir livelihood. However, as evidenced in our worker survey and also noted in theother literature, remittances may be used to purchase purely consumer durablesand their impact on the acquisition of productive assets could be relatively less(Srivastava 2011c). To better evaluate the importance of remittances, we collectdetailed information from both migrant and non-migrant groups about the presentand purchase value of their additional purchase of assets, and how they financesuch purchase.
There is very little difference in the present value of total assets15 owned by themigrant and non-migrant groups. Migrant households report average asset value ofRs 24,364 which compares with Rs 24,651 reported by non-migrant groups. However,the present asset value, when disaggregated at the village level, gives a contrastingpicture. Migrant households in V1 report average asset value of only Rs.16,051 vis-a-vis Rs 23,028 reported by the non-migrant households. In V2 , we, however, observea different scenario as migrant households on average report a high asset value ofRs 34,755 which compares with Rs 25,373 reported by non-migrant households.
In principally rain-fed areas like our survey villages, ownership of livestockremains a key component of any strategy towards diversification of livelihood. Agood majority of sample households across migrant status own livestock. Theownership of livestock, when compared across villages, reflects a similar patternwith non-migrant households reporting a higher average value of livestock comparedto migrant households. Higher possession of livestock among the non-migrantsperhaps indicates higher labour endowments required for the upkeep of livestockas well as their higher degree of reliance on livestock for livelihood. In V1 , non-migrant households report ownership of livestock valued at Rs 18,650 which compareswith Rs 10,138 reported by the migrant households. In V2, non-migrant householdsreport ownership of livestock valued at Rs 16,042 that compares with Rs 10,688reported by migrant households. The average value of livestock purchased in theprevious year by migrant households is, however, found to be higher than thepurchase made by the non migrant households. The percentage share of householdsreporting ownership of livestock is also found to be higher among non-migranthouseholds compared to the migrant households. The sources of finance forpurchasing livestock, however, vary across migrant status. Non-migrant householdsrely more on savings from agriculture and non-agricultural earning to purchaselivestock compared to migrant households who rely largely on remittances topurchase livestock (Table 3.4b.1)
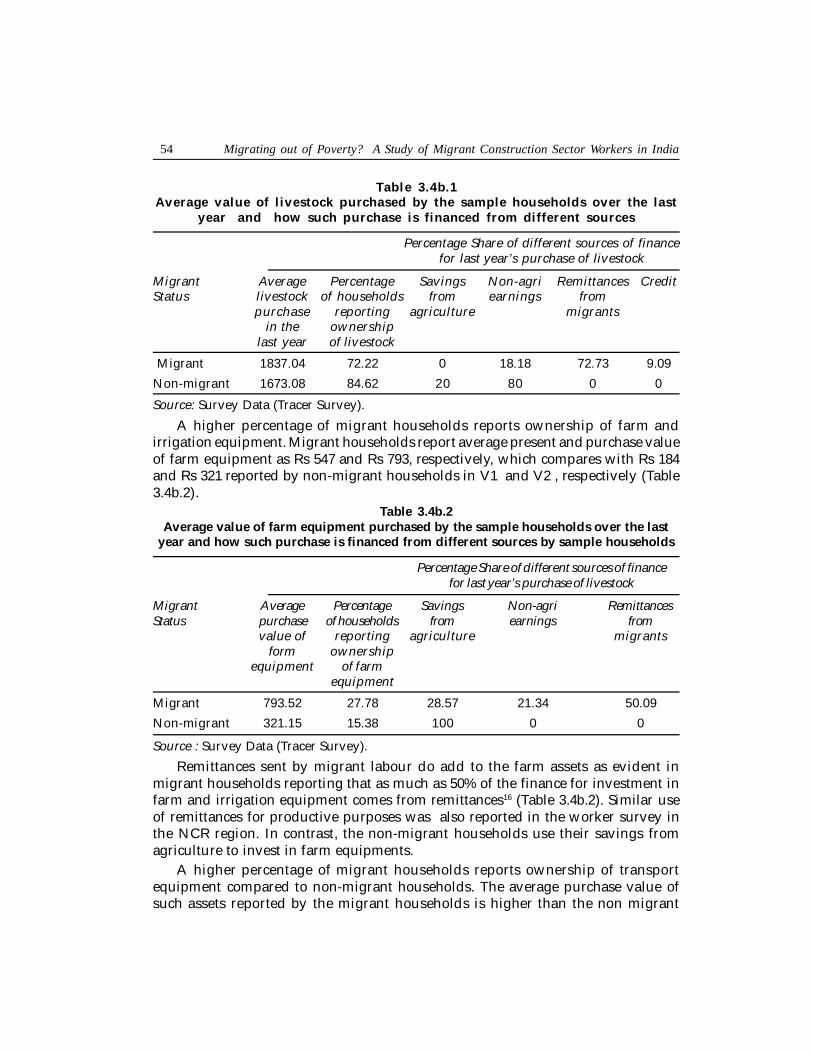
54 Migrating out of Poverty? A Study of Migrant Construction Sector Workers in India
Table 3.4b.1Average value of livestock purchased by the sample households over the last
year and how such purchase is financed from different sources
Percentage Share of different sources of financefor last year’s purchase of livestock
Migrant Average Percentage Savings Non-agri Remittances CreditStatus livestock of households from earnings from
purchase reporting agriculture migrantsin the ownership
last year of livestock
Migrant 1837.04 72.22 0 18.18 72.73 9.09
Non-migrant 1673.08 84.62 20 80 0 0
Source: Survey Data (Tracer Survey).
A higher percentage of migrant households reports ownership of farm andirrigation equipment. Migrant households report average present and purchase valueof farm equipment as Rs 547 and Rs 793, respectively, which compares with Rs 184and Rs 321 reported by non-migrant households in V1 and V2 , respectively (Table3.4b.2).
Table 3.4b.2Average value of farm equipment purchased by the sample households over the last
year and how such purchase is financed from different sources by sample households
Percentage Share of different sources of financefor last year’s purchase of livestock
Migrant Average Percentage Savings Non-agri RemittancesStatus purchase of households from earnings from
value of reporting agriculture migrantsform ownership
equipment of farmequipment
Migrant 793.52 27.78 28.57 21.34 50.09
Non-migrant 321.15 15.38 100 0 0
Source : Survey Data (Tracer Survey).
Remittances sent by migrant labour do add to the farm assets as evident inmigrant households reporting that as much as 50% of the finance for investment infarm and irrigation equipment comes from remittances16 (Table 3.4b.2). Similar useof remittances for productive purposes was also reported in the worker survey inthe NCR region. In contrast, the non-migrant households use their savings fromagriculture to invest in farm equipments.
A higher percentage of migrant households reports ownership of transportequipment compared to non-migrant households. The average purchase value ofsuch assets reported by the migrant households is higher than the non migrant

Migrating out of Poverty? A Study of Migrant Construction Sector Workers in India 55
households (table 3.4b.3). The ownership of transport vehicles, when disaggregatedat village level, reflects a similar story of migrant households reporting higherownership of transport vehicle compared to the non migrant households. In V1 , asmuch as 60 % of the migrant households report owning any transport vehicle ascompared to only 37.50 % of non migrant households possessing transport equipment.Similarly, in V2 , 75 % of migrant households report ownership of transport vehiclesin comparison to 66.67% of non migrant households reporting ownership of suchassets. .
Migrant households report higher purchase and present values of transportequipment compared to non-migrant households. Non-migrant households reportthe present and purchase value of transport equipment at Rs 1107.69 and Rs 1019.23,respectively which compares with Rs 6346.30 and Rs 3969.44 as reported by themigrant households. The present and purchase of transport equipment, whendisaggregated at the village level, shows a similar picture. Migrant households fromV1 ,on average, report Rs 1415.67 and Rs 2908.33 as present and purchase value oftransport equipment, respectively, which compares with Rs 262.50 and Rs 437.50reported by non-migrant households. We observe a similar pattern in V2 . A typicalmigrant household reports Rs 7116.67 and Rs 10,643.80 as the present and purchasevalue of transport equipment which compares with Rs 1355.56 and Rs 1405.56 reportedby a typical non-migrant household. In both villages, remittances play a significantrole in the purchase of transport equipment for migrant households, accounting for55% and 70% of the required finance in V1 and V2 , respectively.
Migrant households are also better placed in terms of values of residentialproperties. They report the present value of their residences at Rs 1,28,872.50 whichcompares with Rs 1,03,076.90 reported by non-migrant households, reflecting their
Table 3.4b.3Average value of transport equipment purchased by the sample households over the
last year and how such purchase is financed from different sources by samplehouseholds
Percentage Share of different sources of financefor last year’s purchase of livestock
Migrant Average Percentage Savings Non-agri RemittancesStatus purchase of households from earnings from
value of reporting agriculture migrantstransport ownershipequipment of transport
equipment
Migrant 6346.3 66.67 11.42 25.9 62.68
Non-migrant 1107.69 57.69 40 60 0
Source : Survey Data (Tracer Survey).

56 Migrating out of Poverty? A Study of Migrant Construction Sector Workers in India
relatively better economic position compared to the non-migrant households. Higherpercentage of migrant households report spending on repair and reconstruction ofhouseholds over the last 10 years when compared to the non-migrant households inthe village. As many as 59.26% of the migrant households report spending onreconstruction/repair of house over the last 10 years. This compares with only 53.27%of the non-migrant households reporting similar expenditure. Migrant householdsreport average expenses on repair/ reconstruction which are higher than the non-migrant households, with the former largely using remittances to finance suchexpenses (Table 3.4b.4). Similar spending behavior of migrant households has alsobeen noted among the migrant workers interviewed in the worker survey in NCR.In our NCR survey, as many as 86% of the workers reported spending theirremittances on improvement of houses.
The growing preference among migrant workers to spend their remittances/savings on consumer durables, as evident in the worker survey, has also beencorroborated in our tracer survey. The migrant households report higher presentand purchase value of consumer durables compared to their non-migrant households(Table 3.4b.5). Migrant households finance much of their purchases of consumerdurables using remittances, with remittances accounting for as much as 76% of suchpurchase.
Table 3.4b.5Average present and purchase value of consumer durables and different
sources of finance over the last 10 years as reported by the sampleho us ehol ds
Percentage Share of different sources of financefor last year’s purchase of livestock
Migrant The Average The average Savings Non-agri RemittancesStatus present purchase from earnings from
value of value of agriculture migrantsconsumer consumerdurables durables
Migrant 10267 10431 8.64 15.57 75.58
Non-Migrant 4949 6841 11.56 88.44 0
Source : Survey Data (Tracer Survey).
The qualitative information documented in the case studies corroborates thefindings of quantitative analysis done so far on the impact of migration on rurallivelihoods. Most migrant households and other key informants such as village headsand senior informants that are interviewed during the course of survey indicateimproved access of migrant households to food, medical treatment, and educationfor their children. Though some of the migrant households interviewed even reportedpurchase of durable assets such as scooter and motorcycle, earnings through migrationare however rarely used, or are enough to enable them to purchase land and othermore productive assets which could lift them out of the migration cycle.

Migrating out of Poverty? A Study of Migrant Construction Sector Workers in India 57
(c) Debt Liabilities of Migrant and Non-migrant Labour Households
The cash income earned or remittances sent by migrant workers may not alwaysadd to the resource base of migrant workers’ households in all cases and may simplybe used to adjust with earlier debts. In our sample of 80 workers, as many as 12households report indebtedness. The share of indebtedness is, however, noted tobe higher among non-migrant households. As many as 26.92% of the non-migranthouseholds report indebtedness which compares with only 9.26% among migranthouseholds reporting such credit status. Money lenders still remain one of thepreferred options of loans for both migrant and non-migrant households, as evidentby the fact that in as many as three-quarters of the indebted households reportmoney lenders as their choice for loans.
The use of remittances for settling debts and loans has also been noted in ourworkers’ survey where as many as 33% of the migrant workers reported usingremittances to settle debts and credit taken from money lenders and other informalsources. Similar evidence has also been found in the extant literature (NCRL1991,Mosse et.al. 2002), raising the question as to whether such migration is itself theresult of debt at home or debt inter-locking involving employers in the destinationareas or their middlemen. Migration triggered by such indebtedness may not addto the welfare of the rural households. Some studies have seen a ‘safety valve’ featurein such migration strategies that serve as a mechanism to preserve a social mode ofproduction or at least reduce the pressure on it (Standing, 1985). Interestingly,expenditure on social occasions is the most cited purpose by both migrant and non-migrant households for availing loans.
Our informal discussion in villages and information collected in the worker surveyin NCR suggests that advances obtained by workers from jamadar or munshi beforethey join the worksites constitutes an important source of credit for them, thusobviating their need for reliance on traditional money lenders. In fact, the local
Table 3.4b.4Average expenses on house repair/construction reported by the sample
households over the last ten years and how such purchase is financed fromdifferent sources by sample households
Percentage Share of different sources of financefor last year’s purchase of livestock
Migrant Average Percentage Savings Non-agri Remittances CreditStatus expense on of households from earnings from
house repair reporting agriculture migrantsrecon repair/recon
struction struction
Migrant 39549 59.26 3.13 9.38 84.38 3.13
Non-migrant 16346 53.57 7.69 92.31 0 0
Source : Survey Data (Tracer Survey).

58 Migrating out of Poverty? A Study of Migrant Construction Sector Workers in India
contractor or middlemen often takes advantage of such advances to secure labourcommitment at cheaper wage than the prevailing wage at the destination. Theseadvances, mostly given as interest-free loans, are not considered as part of the debtfor our analysis.
(d) Impact on Labour Market
One of the major channels through which migration impacts the source area is thelabour market. The changes in labour market due to migration may occur in morethan one ways. While the rural outmigration may help the migrant family smoothemployment over the annual cycle, it may also cause a tightening of the labourmarket, resulting in higher wages and thus benefiting even non-migrant labourhouseholds. However, such benefits may not occur if the migrant households arereplaced by female and even child labour. Apart from tightening of the labour market,migration may bring other qualitative changes in the functioning of the local labourmarket, including better wages and employment conditions. There are a number ofwell-documented studies of how migrant labour, after being exposed to urbanmarkets, refuses to accept poorer working conditions even at the source areas.
In the tracer survey, we make enquiries with both migrant and non-migranthouseholds for details of their participation in different types of work such asemployment in non-agricultural undertakings, salaried and wage employment, togive both a comparative picture of labour market in source and destination areas,and the linkage between the two labour markets. The information collected at thehousehold level also gives key insights into participation of women in labour marketas wage labour, their working condition vis-a-vis male wage workers and how suchparticipation varies across caste and religion.
Non-agricultural undertakings
The involvement of rural households in non-agricultural undertaking is very low,particularly among non-migrant households. While five migrant households andone non-migrant household from V1 report involvement in non-agriculturalundertakings of any type, only one migrant household from the village of V2reported such involvement. No non-migrant household in V2 reports being involvedin a non-agricultural undertaking. The participation of female members in suchventures is very little. Only 5.26% households in V1 report involvement of femalemembers in such undertakings. In V2 , no female member is involved in any non-agricultural undertaking. In most cases, non-agricultural undertaking are small innature and report revenue just enough for subsistence living. In V1 , migrant andnon-migrant households report average net annual income Rs. 19,940 and Rs 25,000respectively. In V2 , the only migrant household that is involved in non-agriculturalundertaking reports a net annual income of Rs. 18,0000.
Regular / Salaried employment
Compared to the non-migrant households, a higher percentage of migrant householdsreport salaried employment, indicating relatively better working condition in the
Migrating out of Poverty? A Study of Migrant Construction Sector Workers in India 59
destination compared to the source area. As many as 26.67% of the migrant workersreport working in some type of salaried jobs vis-a-vis only 1.39% of the non-migrantworkers reporting similar status of employment. The percentage of wage workers,when disaggregated at the village level, shows a similar picture in both the villages.Regular / salaried workers account for 26.47% and 36.84% of the migrant workersin the village of V1 and V2 , respectively. In contrast, only 2.5% and 0.58% of non-migrant workers from V1 and V2 reported themselves as salaried workers.Discrimination against female workers is evident in the workplace as no female hasreported as salaried worker, indicating that women work as causal labour or areself-employed or putting-out workers in uncertain and vulnerable condition. Overall,migrant workers earn higher gross salary than non-migrant workers. A typicalmigrant worker, employed in salaried jobs, earns on average Rs. 1,68,867 annuallyin V1 and Rs 69,929 annually in V2 . The non-migrant counterparts with similaremployment status report Rs 46,000 and Rs 52,000 as annual gross salary in V1 andV2 , respectively. The significant difference in salary income reported by a migrantworker across two villages may be attributed to substantially higher salary reportedby some of the workers in V1 who migrated to Libya to work in constructionprojects that pay higher remunerations.
Wage Income from Agriculture and Non-agriculture Labour
As already mentioned, none of the migrant households surveyed across villagesreport participation of females as migrant labour, pointing to the male selectivenature of labour outmigration in the study villages. However, the rural labour marketin the source area is marked by significant participation of females as wage labour.The presence of women as casual labour is observed across all castes and religions.In V1 , 29.63% and 24.29% women from SC and OBC report participation in the localworkforce. Similar participation of females as casual labour is also noted amongMuslim households in V2. As many as 32.85% of the females from these householdsreport as wage workers. Such participation by female members in the local labourmarket is significant especially when no female member of the sample householdsmigrates for work. This only indicates an increasing trend of migration as livelihoodstrategy adopted by the male members, while women members of these householdstake on a more proactive role in the rural labour market, perhaps also pointingtowards feminization of agriculture.
Migrant workers earn higher wages than non-migrant workers for both skilledand unskilled, indicating that higher wages in the destinations works as a motivationfor households to migrate to urban areas in expectation of higher earnings. A skilledmigrant worker in V1 and V2 reported daily wage of Rs 400 and Rs 475, respectively.This compares with Rs 249 and Rs 150 reported by a skilled non-migrant in therespective villages. The comparison of wage for unskilled workers across migrantstatus gives a similar picture. An unskilled male migrant worker reports daily wageof Rs 236 and Rs 221 in V1 and V2 , respectively, which compares with Rs 151 and Rs130 reported by an unskilled non-migrant male worker in the respective villages.
60 Migrating out of Poverty? A Study of Migrant Construction Sector Workers in India
The average daily earning reported by migrant and non-migrant workers acrossskill status gives a similar picture (Table 3.4d.2 and Table 3.4d.3) also. Interestingly,higher wage claimed by a migrant worker in V1 compared to those paid to migrantworkers in V2 also corresponds to the higher wage claimed by a non-migrant labourin the former, indicating that there is probably a link between the wages paid at thedestination and those at the source area.
The gender discrimination in the local labour market is clearly evidenced bywages reported by the female workers, both skilled and unskilled, in both thevillages, V2 and V2 . A skilled female non-migrant worker reports wage of Rs 110and Rs 70, respectively which is much lower than their male counterparts in respectivevillages. In a case of similar discrimination in unskilled works, an unskilled femalenon-migrant worker reports daily wage of Rs 93 and Rs 70 in V1 and V2 , respectively,which is much lower than the wages received by male non-migrant workers withthe same skill status. Our case studies documenting low wages for women in V2indicate that strong cultural norms deter women from working outside their home,partly explaining why wages earned by women are as low as Rs 70 per day in thevillage. The gender discrimination is also evident among the non-migrant workersin the acquisition of skills. A higher percentage of male workers reported as skilledworkers compared to their female counterparts. In V1 , the skilled workers accountfor 22.58% and 8.70% of the male and female workers, respectively which compareswith 5.26% and 2.86% of male and female workers reported as skilled in V2 .
Majority of workers, both migrant and non-migrant, receive payment on dailybasis, with few of them receiving payment as monthly wage, indicating the casualnature of the jobs undertaken by these workers (Table 3.4d.1). However, thedistribution of how the workers are paid varies considerably across villages. Majorityof the non-migrant workers from V1 receive payment on daily wage basis. In V1 , ahigher percentage of migrant workers receive wage on piece rate compared to theirnon-migrant counterparts, perhaps indicating efforts by the migrant workers toundertake work that maximizes their earning over a short time. The case studies inthe worker survey in NCR also indicate preference among the contractors to assignwork on piece rate basis. However, a higher percentage of migrant workers fromV1 receive monthly wage compared to none of the non-migrant workers reportingsuch payment. In V2 , most migrant workers receive payment on daily basis, withfew of them receiving wage on piece rate basis and none reporting monthly wage.Interestingly, majority of non-migrants from V2 also receive wage on piece ratebasis, perhaps indicating the presence of what may be termed as putting out thesystem in the beedi making industry in Malda. The industry outsources much of itswork to women workers who are provided with raw materials at home by theindustry agent.
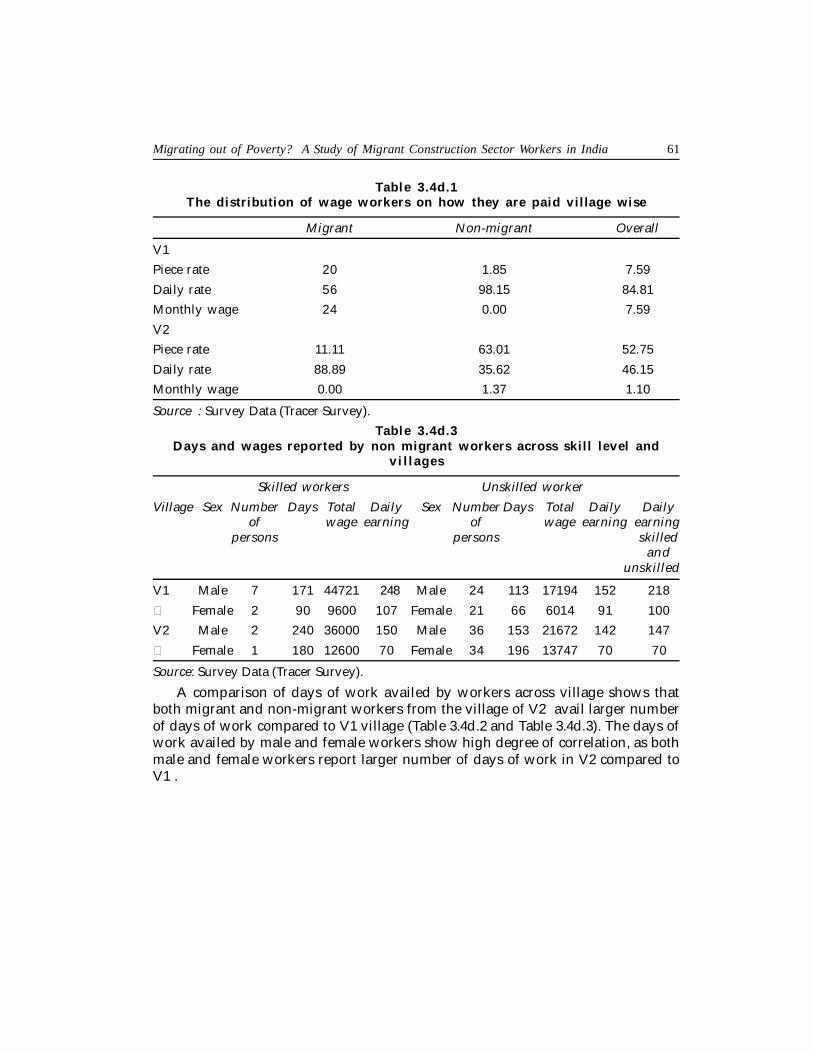
Migrating out of Poverty? A Study of Migrant Construction Sector Workers in India 61
Table 3.4d.1The distribution of wage workers on how they are paid village wise
Migrant Non-migrant Overall
V1
Piece rate 20 1.85 7.59
Daily rate 56 98.15 84.81
Monthly wage 24 0.00 7.59
V2
Piece rate 11.11 63.01 52.75
Daily rate 88.89 35.62 46.15
Monthly wage 0.00 1.37 1.10
Source : Survey Data (Tracer Survey).
Table 3.4d.3Days and wages reported by non migrant workers across skill level and
vi l l ages
Skilled workers Unskilled worker
Village Sex Number Days Total Daily Sex Number Days Total Daily Dailyof wage earning of wage earning earning
persons persons skilledand
unskilled
V1 Male 7 171 44721 248 Male 24 113 17194 152 218
� Female 2 90 9600 107 Female 21 66 6014 91 100
V2 Male 2 240 36000 150 Male 36 153 21672 142 147
� Female 1 180 12600 70 Female 34 196 13747 70 70
Source: Survey Data (Tracer Survey).
A comparison of days of work availed by workers across village shows thatboth migrant and non-migrant workers from the village of V2 avail larger numberof days of work compared to V1 village (Table 3.4d.2 and Table 3.4d.3). The days ofwork availed by male and female workers show high degree of correlation, as bothmale and female workers report larger number of days of work in V2 compared toV1 .

62 Migrating out of Poverty? A Study of Migrant Construction Sector Workers in India
Tabl
e 3.
4d.2
Day
s an
d w
ages
rep
orte
d m
igra
nt w
orke
rs a
cros
s sk
ill l
evel
and
vil
lage
s
Skill
ed w
orke
rsU
nski
lled
wor
ker
Vill
age
Sex
Num
ber
Day
sTo
tal
Dai
lyR
emitt
ance
/Se
xN
umbe
rD
ays
Tota
lD
aily
Rem
ittan
ce/
Skill
and
of p
erso
nsw
age
earn
ing
savi
ngs
of p
erso
nsw
age
earn
ing
savi
ngs
unsk
illed
wor
kers
com
bine
d
V1
Mal
e1
9036
000
400
2700
0M
ale
2417
241
164
239
2902
329
5
V2
Mal
e4
265
1250
0047
295
300
Mal
e14
233
5151
122
138
286
354
Sour
ce :-
Surv
ey D
ata
(Tra
cer
Sur
vey)
.

Migrating out of Poverty? A Study of Migrant Construction Sector Workers in India 63
Table 3.4d.4Total wage income and remittances reported by migrant and non-migrant
ho us ehol ds
Over all Over reportinghouseholds households
Number of Total Total Total wage Totalhouseholds wage remittance remittance
V1 Migrant Households 8 60638 42199 72765 50639
Non migrant households 30 38900 38900
All households 38 56061 64555
V2 Migrant Households 18 82402 69738 89893 76077
Non migrant households 24 44881 50491
All households 42 66322 73303
Source: Survey Data (Tracer Survey).
The total wage income reported by both migrant and non-migrant households(in Table 3.4d.4) underlies the importance of casual labour as an important livelihoodoption among the rural households in the resource poor areas in Bihar and WestBengal. There is, however, significant difference in the total wage income reportedby the rural households across villages, with sample households from V2 reportinghigher wage income compared to those from V1, perhaps indicating stronger presenceof the non-farm sector in the relatively better connected V2 . Comparison ofremittances reported by migrant households also gives a similar picture, with migranthouseholds from V2 sending higher amount of remittances. In V2, the number ofpersons per family engaged as wage labour is found to be higher for both migrant(3.44) and non-migrant households (2.46) compared to those reported by migrant(3) and non-migrant households (2.10), respectively, in V1 . This, together with largernumber of days of work availed by workers in V2 (Table 3.4d.2 and Table3.4d.3),results in higher realization of wage income by both migrant and non-migranthouseholds in V2 compared to their counterparts in V1 .
Overall, a comparison of labour markets, in both source and destination areas,suggests that both the labour markets are conspicuous by the absence of regularjobs, even among skilled workers. The mode of payments, wages, the number ofemployment days available all attest to poorer working condition in the sourcearea, confirming what we already noted in the worker survey in NCR region. Inwhat may be characterized as slightly better working conditions at destination, thepercentage of skilled labour and those getting monthly wages is higher among migranthouseholds than non-migrant households. Both wage levels and employment levelsare also higher among migrant labourers. Comparison of wages as reported byworkers in construction worker survey in NCR and those earned by non-migrantlabour in the source area suggests that though wages in the destination fail to meetthe minimum wages criteria set by the respective states in the NCR regions, they are

64 Migrating out of Poverty? A Study of Migrant Construction Sector Workers in India
clearly higher than those earned by the non-migrant in the source area. In otherwords, the migration out of the village is clearly driven by the earning differentialbetween the source and destination. However, the wages received by migrantlabourers at destination, as pointed out in the earlier section, bear little relation tothe local labour market at destination, confirming the growing trend of organizedand segmented migration facilitated by the contractors as middlemen in therecruitment process. .
Some of the case studies documented during the course of field survey andinformal discussion with local farmers and villagers show that both migrant andnon-migrant households do attest to the tightening of labour market in the nativevillage though we do not have enough quantitative data to verify their claims. Thereare instances of migrant labour asking for higher wages once they return to thenative village. In what may be construed as signals of labour tightening, complaintsby farmers about shortage of farm labour during the peak season have becomemore common occurrences recently.
(e) Impact on consumption expenditure
The impact of remittances is quite diverse and they are usually deployed to addressa hierarchy of needs but consumption is one of the prime objects for which remittancesare utilized (Deshingkar, et al. 2006, 2008; Srivastava, 2011c). Evidences from NSSO64th round and several micro studies indicate that expenditure on consumption andother basic necessities occupies high importance in the agenda of the migranthouseholds. The data collected from migrant households covered under NSSO 64th
round suggest that as many as 75% of migrant households use remittance to purchasefood and 45.1% of households purchase other essential consumption items (Srivastava2012).
We have collected data on current expenditure on food and non-food itemsfrom the sample households. The blocks on consumption expenditure are longerthan the abbreviated schedule used by the NSSO but are less detailed than thedetailed consumption expenditure schedule used by that organization. The estimateof expenditure so obtained would therefore be a slight underestimate compared tothe detailed schedule. We use this data in the next section to assess income povertyamong migrant and non-migrant households. In this section, we simply assess averageconsumption expenditure among these two groups of households.
Though we do not have direct data to know whether and how much ofremittances are used by migrant households to purchase food and other essentialconsumption items, the per capita expenses reported by both migrant and non-migrant households on food, fuel, and non-food consumption items suggest thatmigrant households spend more than their non-migrant counterparts (Table 3.4e.1.).The data on consumption of food and non-food even when disaggregated at thesub-migration stream at the village level indicates an interesting pattern. Migrantworker households from construction sector report higher expenditure, followed
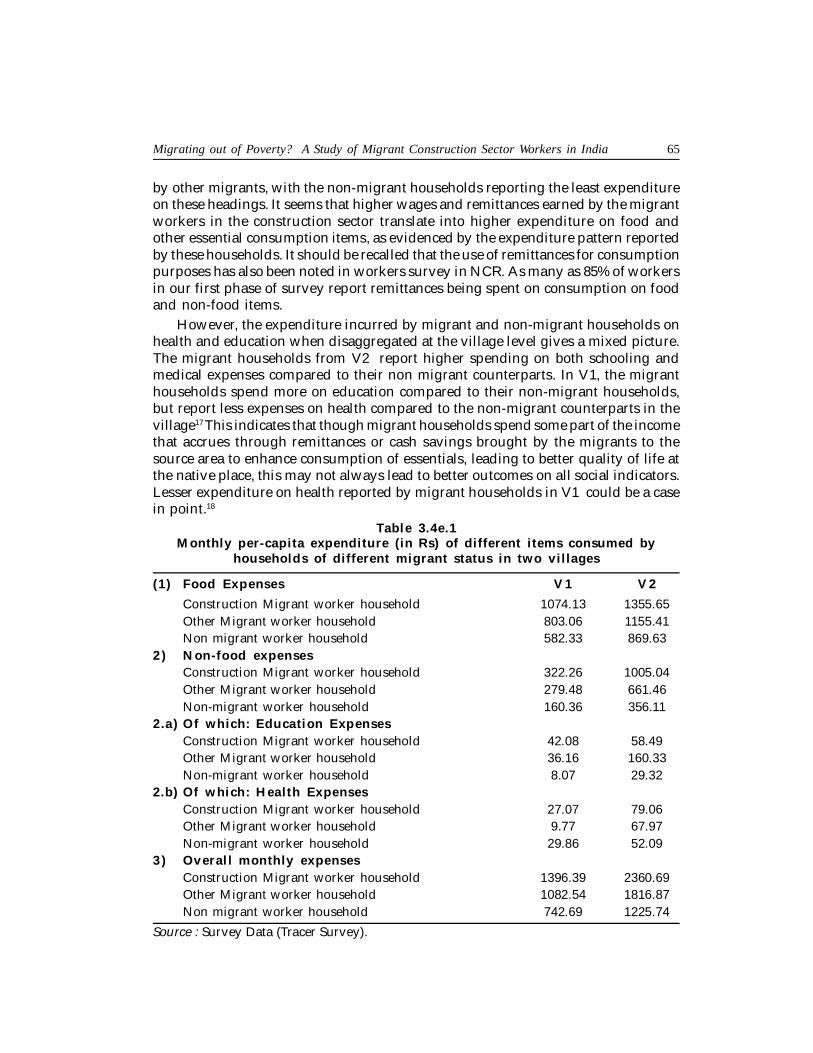
Migrating out of Poverty? A Study of Migrant Construction Sector Workers in India 65
by other migrants, with the non-migrant households reporting the least expenditureon these headings. It seems that higher wages and remittances earned by the migrantworkers in the construction sector translate into higher expenditure on food andother essential consumption items, as evidenced by the expenditure pattern reportedby these households. It should be recalled that the use of remittances for consumptionpurposes has also been noted in workers survey in NCR. As many as 85% of workersin our first phase of survey report remittances being spent on consumption on foodand non-food items.
However, the expenditure incurred by migrant and non-migrant households onhealth and education when disaggregated at the village level gives a mixed picture.The migrant households from V2 report higher spending on both schooling andmedical expenses compared to their non migrant counterparts. In V1, the migranthouseholds spend more on education compared to their non-migrant households,but report less expenses on health compared to the non-migrant counterparts in thevillage17 This indicates that though migrant households spend some part of the incomethat accrues through remittances or cash savings brought by the migrants to thesource area to enhance consumption of essentials, leading to better quality of life atthe native place, this may not always lead to better outcomes on all social indicators.Lesser expenditure on health reported by migrant households in V1 could be a casein point.18
Table 3.4e.1Monthly per-capita expenditure (in Rs) of different items consumed by
households of different migrant status in two villages
(1 ) Food Expenses V 1 V 2
Construction Migrant worker household 1074.13 1355.65Other Migrant worker household 803.06 1155.41Non migrant worker household 582.33 869.63
2 ) Non-food expensesConstruction Migrant worker household 322.26 1005.04Other Migrant worker household 279.48 661.46Non-migrant worker household 160.36 356.11
2 .a ) Of which: Education ExpensesConstruction Migrant worker household 42.08 58.49Other Migrant worker household 36.16 160.33Non-migrant worker household 8.07 29.32
2.b) Of which: Health ExpensesConstruction Migrant worker household 27.07 79.06Other Migrant worker household 9.77 67.97Non-migrant worker household 29.86 52.09
3 ) Overal l monthly expensesConstruction Migrant worker household 1396.39 2360.69Other Migrant worker household 1082.54 1816.87Non migrant worker household 742.69 1225.74
Source : Survey Data (Tracer Survey).

66 Migrating out of Poverty? A Study of Migrant Construction Sector Workers in India
(f) Impact on working life span and life expectancy
One aspect that often gets overlooked in most migration studies is the impact ofmigration on the working life span and life expectancy of seasonal migrant workers.As already noted in the worker survey in NCR, most of these workers are unskilledand work in poor working conditions, marked by inadequate breaks/ holidays andsafety equipments and high exposure to health hazards such as dust particles. Theyalso live in poor living conditions. This brings in the question whether higher earningsreported by the migrant workers at destination represent a transient increase or theextent to which these can be sustained over time once workers go back to the sourceareas. Overlooking such aspects of migration may also pose the danger ofoverestimating the impact of migration. Ideally one needs a panel data of age profileof migrant households, compared to non-migrant households, to be able to objectivelyassess the impact of migration on such issues. In our tracer survey, we have data ondetailed age profile of family members of both migrant and non-migrant households.We carefully identify active household members of each of the sample householdsin the source area and compare their ages across migrant status. The average age ofeconomically most active member of non-migrant households is 40.39 years thatcompares with 33.50 years reported by the migrant households. The average age ofmigrant households, when disaggregated at different migration status, shows thatthe average ages of the most active member of construction migrant households andother migrant households are 32.71 years and 34.94 years, respectively, which is notsurprising given that working in construction industries is physically highlydemanding. While we can’t make any definitive conclusion on life expectancy withthe present survey data set, we can make a tentative conclusion that the active workinglife of migrant workers is probably shorter than of non-migrants, due to the physicallyand otherwise demanding nature of work in the construction industry and otherindustries to which seasonal migrants migrate. We have little knowledge of how thephysical hardship in the period of migration affects the life of the migrant workerafter he/she ceases to migrate. This constitutes an interesting research agenda forfuture.
3.5. Perception among rural households on change in socio-economic status
To assess the impact of migration on the quality of life, we also ask the samplehouseholds, both migrant and non-migrants, a few questions on their subjectiveevaluation of socio-economic position, health, sanitation, and hygiene status vis-a-vis their non-migrating neighbours, as well as vis-a-vis their own status 5 and 10years ago. Their responses throw up an interesting picture.
In terms of their overall socio-economic status, households of all sample householdcategories perceive improvements in their socio-economic position over the last 10years (Table 3.5.1). However, on a closer look, the responses by migrant and non-migrants reflect disparate levels of improvement in their relative well-being acrosstime. There are higher percentage of households among the migrant households

Migrating out of Poverty? A Study of Migrant Construction Sector Workers in India 67
who think that they are in the lower and high middle class. Interestingly, the rate ofchange in the perception of change from low class to middle class over the last 10years is much higher among the migrant households compared to the nonmigrantones, perhaps indicating positive impact of migration on their quality of life.
Our questions on the subjective evaluation of the sample households also includehow they perceive changes in their family’s and community’s status on three separatemajor dimensions viz. a) health, sanitation, and hygiene; b) education of children; c)food adequacy, at present, in comparison to 5 and 10 years ago.
The responses by the sample households again give impression of not only themigrant households being better placed compared to non-migrants, but also thatthey have witnessed faster change in their status compared to the non-migranthouseholds.
Table 3.5.2 gives the perceived changes in relation to health and sanitation.Migrant households did perceive their status to be better off even 10 years ago.Only 43.75% of the migrant households perceived their health and sanitation statusto be poor compared to 84.6% of non-migrant households having similar opinionabout their health status. Non-migrant households have, by and large, extricatedthemselves from the poor status in which they found themselves 10 years ago.However, one can see that currently more than two-thirds among the migranthouseholds now see their health status to be good or very good compared to anegligible percentage 10 years ago, whereas less than a quarter of the non-migranthouseholds see their current health and sanitation status as being good.
Table 3.5.2Percentage share of how households rate their health, sanitation and
hygiene compared to their past
Migrant status Poor Somewhat better Good Very good Total
NowMigrant worker household 0.00 31.25 62.50 6.25 100Non-migrant worker household 3.85 73.08 23.08 0 1005 years agoMigrant worker household 14.58 56.25 29.17 0 100Non-migrant worker household 61.54 38.46 0 0 10010 years agoMigrant worker household 43.75 54.17 2.08 0 100Non-migrant worker household 84.62 15.38 0 0 100
Source : Survey Data (Tracer Survey).
Strangely enough, the perceptions of the migrant households on their status onparameters such as health and hygiene are not reflected in how they think abouttheir community on similar indicators, perhaps underscoring higher inequality amongthose who are left behind (Table 3.5.3). This is in sharp contrast to how non-migrantsfeel about infrastructure, sanitation and hygiene of their community. Their perceptions
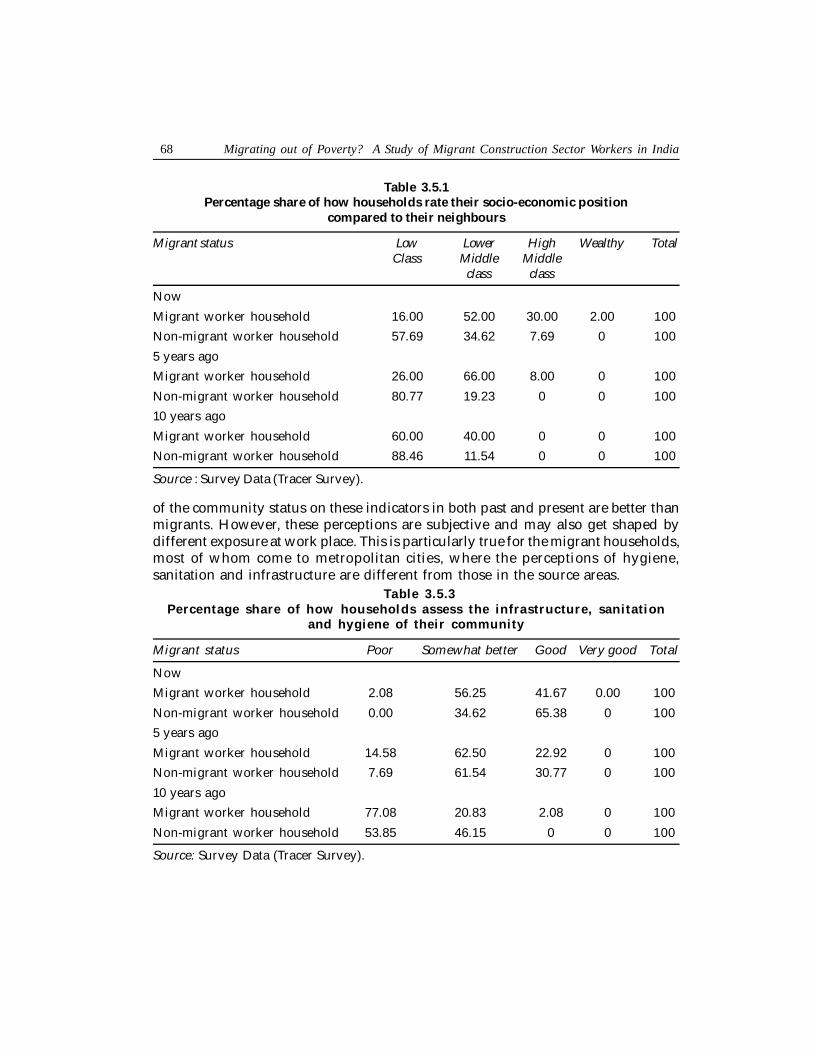
68 Migrating out of Poverty? A Study of Migrant Construction Sector Workers in India
of the community status on these indicators in both past and present are better thanmigrants. However, these perceptions are subjective and may also get shaped bydifferent exposure at work place. This is particularly true for the migrant households,most of whom come to metropolitan cities, where the perceptions of hygiene,sanitation and infrastructure are different from those in the source areas.
Table 3.5.3Percentage share of how households assess the infrastructure, sanitation
and hygiene of their community
Migrant status Poor Somewhat better Good Very good Total
Now
Migrant worker household 2.08 56.25 41.67 0.00 100
Non-migrant worker household 0.00 34.62 65.38 0 100
5 years ago
Migrant worker household 14.58 62.50 22.92 0 100
Non-migrant worker household 7.69 61.54 30.77 0 100
10 years ago
Migrant worker household 77.08 20.83 2.08 0 100
Non-migrant worker household 53.85 46.15 0 0 100
Source: Survey Data (Tracer Survey).
Table 3.5.1Percentage share of how households rate their socio-economic position
compared to their neighbours
Migrant status Low Lower High Wealthy TotalClass Middle Middle
class class
Now
Migrant worker household 16.00 52.00 30.00 2.00 100
Non-migrant worker household 57.69 34.62 7.69 0 100
5 years ago
Migrant worker household 26.00 66.00 8.00 0 100
Non-migrant worker household 80.77 19.23 0 0 100
10 years ago
Migrant worker household 60.00 40.00 0 0 100
Non-migrant worker household 88.46 11.54 0 0 100
Source : Survey Data (Tracer Survey).
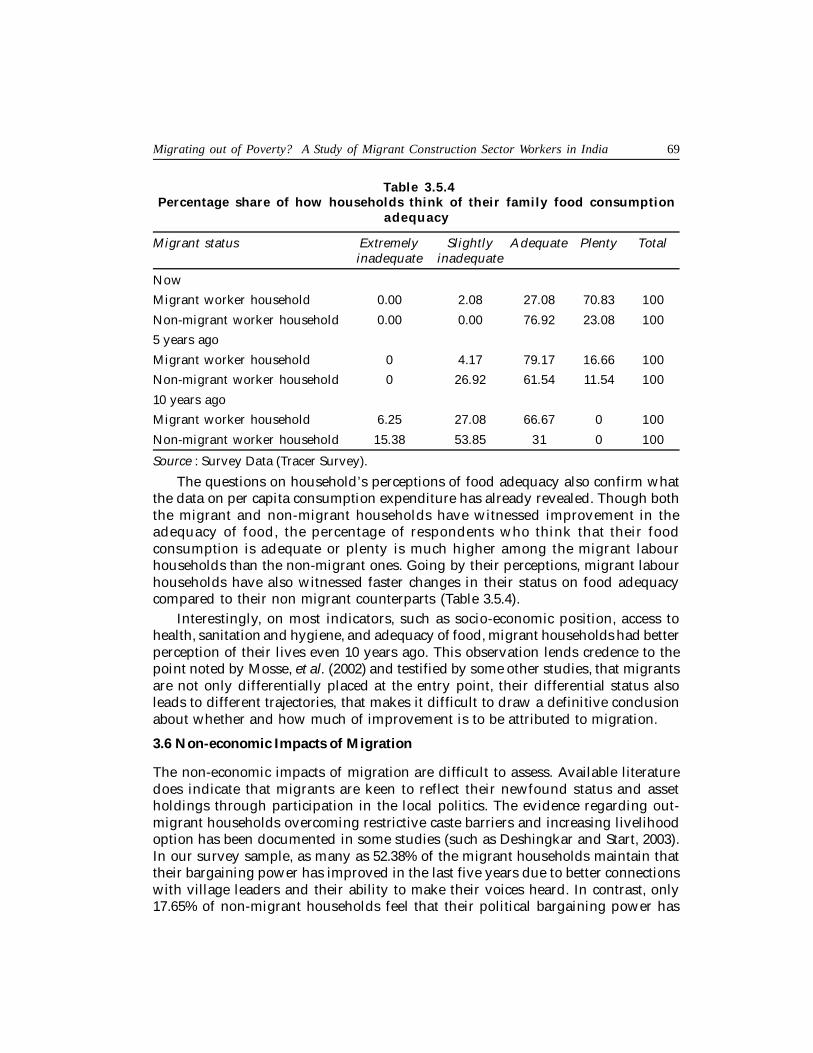
Migrating out of Poverty? A Study of Migrant Construction Sector Workers in India 69
Table 3.5.4Percentage share of how households think of their family food consumption
a dequac y
Migrant status Extremely Slightly Adequate Plenty Totalinadequate inadequate
Now
Migrant worker household 0.00 2.08 27.08 70.83 100
Non-migrant worker household 0.00 0.00 76.92 23.08 100
5 years ago
Migrant worker household 0 4.17 79.17 16.66 100
Non-migrant worker household 0 26.92 61.54 11.54 100
10 years ago
Migrant worker household 6.25 27.08 66.67 0 100
Non-migrant worker household 15.38 53.85 31 0 100
Source : Survey Data (Tracer Survey).
The questions on household’s perceptions of food adequacy also confirm whatthe data on per capita consumption expenditure has already revealed. Though boththe migrant and non-migrant households have witnessed improvement in theadequacy of food, the percentage of respondents who think that their foodconsumption is adequate or plenty is much higher among the migrant labourhouseholds than the non-migrant ones. Going by their perceptions, migrant labourhouseholds have also witnessed faster changes in their status on food adequacycompared to their non migrant counterparts (Table 3.5.4).
Interestingly, on most indicators, such as socio-economic position, access tohealth, sanitation and hygiene, and adequacy of food, migrant households had betterperception of their lives even 10 years ago. This observation lends credence to thepoint noted by Mosse, et al. (2002) and testified by some other studies, that migrantsare not only differentially placed at the entry point, their differential status alsoleads to different trajectories, that makes it difficult to draw a definitive conclusionabout whether and how much of improvement is to be attributed to migration.
3.6 Non-economic Impacts of Migration
The non-economic impacts of migration are difficult to assess. Available literaturedoes indicate that migrants are keen to reflect their newfound status and assetholdings through participation in the local politics. The evidence regarding out-migrant households overcoming restrictive caste barriers and increasing livelihoodoption has been documented in some studies (such as Deshingkar and Start, 2003).In our survey sample, as many as 52.38% of the migrant households maintain thattheir bargaining power has improved in the last five years due to better connectionswith village leaders and their ability to make their voices heard. In contrast, only17.65% of non-migrant households feel that their political bargaining power has

70 Migrating out of Poverty? A Study of Migrant Construction Sector Workers in India
improved in the last five years. We thus have some evidence of the positive impactof migration on political empowerment as noted in the extant literature.
A number of case studies, documented during the course of survey, point towardspositive impact of migration on social and political awareness of migrant households.The experiences of migrant workers in other states raise their aspirations, makingthem more active politically to achieve better quality of life in the native village.Some of these migrant families cite their successful political initiatives with a greatdeal of zeal and enthusiasm. To cite a few, in V1, villagers led by some of the migranthouseholds have put enormous pressure on the sarpanch and village panchayat andheld them accountable for a number of projects to good effect. They have managedto get the main road in the village rebuilt with funds from the panchayat and haveeven managed to add some extra rooms to the village school. Some of them evenfeel that the school teachers in the village have become more regular following thepressure put on them by these migrant households. Their role in the social life extendsto the village elections where some even fund the election expenses to help elect thecandidate of their choice. In V2, migration seems to have the impact of empoweringwomen, most of whom were until recently confined to veil. Migration by the malemember of the households in search of better livelihoods has forced these womento come out of the veil and take more active part in the village economy.
3.7 Some Conclusions from the Tracer Survey
The tracer survey, covering the migrant and non-migrant households, the formerconsisting of two sub groups of migrants, migrants to the construction sector andmigrants to other sectors, reflects on the local labour market and living conditionsamong the different groups of households in the source area.
Among other things, the study examines the link between the wages at thesource area and those paid to the migrant labour at the destination. The evidenceanalysed in our tracer survey confirms what we already observed in the workersurvey in NCR: wages paid at the destination bear little resemblance to those in thelocal labour market and often reflect the lack of availability of livelihoods in thesource area, as evidenced by even lower wages and lesser number of labour daysavailable to non-migrant workers. The evidence from both worker and tracer surveyssuggests that the wages realized by migrant workers, particularly in the constructionsector, are higher than those prevailing wages in the source area but do not meetthe minimum wages set by the legislation in the destination areas. Moreover, theexamination of local labour market at the source area, characterized by low wagesand small number of employment days available, does not give us any convincingevidence of general tightening of labour market. Similar evidence has been noted inthe extant literature (Connell et al., 1976, Srivastava 1999). We, however, do nothave sufficient evidence to examine temporal changes.
The study also looks at the what impact migration has on rural poverty in thesource area by exploring a number of questions related to the education profile ofchildren of the rural households, their asset holdings, and how such purchase of
Migrating out of Poverty? A Study of Migrant Construction Sector Workers in India 71
assets is financed. These questions are supplemented by a number of qualitativequestions on comparative assessment of some key indicators of well-being such asthe socio-economic position of migrant households both with respect to neighboursas well as their own conditions 5 and 10 years ago.
The findings point towards overall benefits of migration to the rural householdsto which migrant workers belong, perhaps leading to positive impact on the currentrural poverty status of the migrant households. Most of these benefits occur throughhigher income accruing to the migrants’ households due to both remittances andsavings brought by the migrant to the source area. Migration appears to providesome evidence of an improvement in the productive potential in the source areas asevidenced by a significant number of migrant households spending increased incomeon better schooling of their children, and investing part of their income in farmequipment, transport equipments and livestock. Given that we don’t know muchabout when such migration by the rural households in the source area started, ex-post cross-sectional analysis may overestimate the effect of migration. The qualitativequestions relating to the perception among sample households about the health,sanitation, socio-economic position, and adequacy of food now, 5 years and 10 yearsago indicate that migrant households may have been somewhat differently placedthan non-migrant labour households even to begin with, which may have facilitatedtheir migration in search of better livelihoods.
4. CONCLUSION AND POLICY IMPLICATIONS
This study analyses the conditions of migration and the impacts of migration in oneof the sectors of the Indian economy (construction) which has seen a rapid expansionin workforce, mainly as a result of rural-urban migration. It focuses on differenttypes of construction sites in NCR Delhi (organized sector housing complexes andcommercial complexes, and unorganized sector housing construction). Weinterviewed 50 workers each in the three different construction sites (a total of 150workers). Apart from the long working hours and no off-days which made access toworkers difficult, organized sector sites, including residential sites of the workersare guarded sites, leading to numerous problems in obtaining access to workers forinterviews. In some cases, interviews had to be abandoned half-way due to thehostility of security staff and/or contractors. These problems have led to some under-sampling of female labourers in the sites, who are more difficult to access than theirmale counterparts.
4.1 The Labourers’ Survey
All labourers in these sites, skilled or unskilled, were found to be migrant. However,there were differences in the patterns of migration and the patterns of recruitment.In the organized sector sites, recruitment of migrant workers tended to be morelarge scale and was usually organized through a network of labour contractors.Labourers were usually recruited from distant states such as West Bengal, Bihar,and Chhatisgarh. The terms and conditions of their employment varied between

72 Migrating out of Poverty? A Study of Migrant Construction Sector Workers in India
the different migration streams but in all cases it was decided at origin. In somecases, as with migrants from Malda and neighbouring areas in West Bengal, themigration was for a fixed period, and the amount of advance payable, the contributiontowards transport and food to be borne by the contractor was determined inadvance In other cases, there was more fluidity in the period of migration and thecontribution made by the contractor, sometimes prolonging the period ofemployment to several years as the migrant workers were rotated between tasksand sites. In the unorganized sector sites, recruitment was local and usually madeby contractors also responsible for executing the construction related tasks. Themigrant workers usually come to the NCR through social networks and were alsodrawn from neighbouring states (Uttar Pradesh, Madhya Pradesh, and Rajasthan).They had either remained in touch with the contractors or were recruited by themat the labour crossings which functioned as local labour markets.
Unskilled construction workers are more likely to be drawn from lower socialstatus groups. In the sample, 36.7% workers were Muslims and the remaining wereHindu. Among the latter, more than half the Hindu workers were SC. This meansthat any favourable impact of migration is likely to affect some of the poorest socialstrata of workers. The workers’ survey gives the following salient results:
(i) The eight-hour wages of unskilled workers were below the legislatedminimum in all the three administrative regions (Delhi, Gurgaon and Noida);
(ii) Surprisingly, eight-hour wages were higher for workers in the unorganizedsector than in the organized sector;
(iii) Actual working hours per day were, however, higher than eight in theorganized sector – usually about 12 hours, raising the workers’ remunerationon a per day basis;
(iv) There is virtually no impact of labour regulation. Provisions of various labourlaws such the Interstate Migrant Workmen’s Act; Contract Labour Act,Minimum Wages Act, Workmen’s Compensation Act, Payment of WagesAct etc. remain unimplemented;
(v) Apart from the normal social security provisions, which are also applicableto construction workers, they are also eligible to be covered under theBuilding and Construction Workers’ Welfare Act, specifically meant for theseworkers. However, the survey did not find any instance of coverage of theinterviewed workers under any of the social security acts;
(vi) Knowledge among the workers of their legal labour-related entitlementswas very low. Workers were neither unionized nor did they show any stronginclinations towards forming or joking unions or associations;
(vii) The migrant workers were accompanied by one or more family members in27.3% of the cases and by their spouses in 20.7% cases. Living conditionswere uniformly poor at destination with workers (and families) living inmakeshift, kucha accommodation or jhuggis in more than 80 percent cases;

Migrating out of Poverty? A Study of Migrant Construction Sector Workers in India 73
(viii) Most workers lacked local identity papers and did not have any localentitlements;
(ix) However, workers saved and remitted part of their incomes in almost allcases. These remittances were used to bolster their families consumptionand quality of housing in the maximum number of cases; but was also spentin children’s education and, in some cases, on land and other productiveinvestment;
(x) On comparing their conditions at destination with those at their native places,workers generally found the destinations wanting in terms of housing andliving conditions, but the destination areas compared more favourably interms of employment availability and wages.
The survey conclusions bring out the contradictory nature of the labour migrationprocess in the construction sector. In the destination areas, the working period islengthened, working and living conditions are poor, and workers in organizedmigration streams and those who are employed in the unorganized sector earn lessthan their counterparts who operate in the unorganized sector and in the local marketsegment. However, their employment period is longer and daily earnings are higherthan their places of origin. By squeezing local subsistence, assisted by the fact thatthey usually stay in housing sites provided by the employers, they are generallyable to save and remit or take back varying amounts of income which are used torepay loans and/or to improve the conditions of living at origin.
4.2 The Tracer Survey
In order to compare the condition of migrant and non-migrant labourers, we havealso surveyed labour households in two villages, one in Malda district of West Bengaland the other is Samastipur district of Bihar. The survey included both non-migrantand migrant labour households, including those households from which we hadsurveyed several workers in the NCR. Since our survey in the NCR was only confinedto those few workers from these villages who happened to be part of our sample,we have also included other migrant labour households (both in the constructionsectors as well as other sectors) in the category of migrant households.
The report highlighted the findings of the tracer survey. Briefly, the main resultsof the survey are the following.
• Labour outmigration in both villages is of seasonal and short-term nature (threeto six months)
• Literacy and education levels are slightly better among migrant householdsthan among non-migrant labour households.
• The migrant households have a higher percentage of members in the age groupof 15 to 39 years and a lower percentage of young dependent members. Theaverage age of the principal earners in the migrant households is significantlyless than that of principal earners in non-migrant households.
• A slightly higher percentage of children from migrant households attend school

74 Migrating out of Poverty? A Study of Migrant Construction Sector Workers in India
and a smaller percentage of children are those who had never attended.However, both migrant and non-migrant households have comparable drop-out rates. There is greater preference among migrants for private schools andthese households also show higher private expenditures per school going child.
• A higher percentage of migrant households own land in both villages but ahigher proportion of non-migrants operate land.
• There are little overall differences in total productive assets per households(excluding land and residential housing) (although there are variations acrossthe two villages). But in both villages, non-migrants own a higher value oflivestock per household while migrants own a higher average value of irrigationand transport equipment, durable household goods, and residential housing.They have also spent more on repairs and construction activity. Migranthouseholds also show higher average income from non-agricultural enterprises.
• In all investment by migrants, remittances are an important source of finance.• Both employment days and daily earnings are higher for migrants than for
non-migrants. As a result, total wage earnings are also higher for migrantlabourers compared to non-migrant labourers.
• Monthly per capita food and non-food expenses are higher on average amongmigrant households than among non-migrant households.
• A sizeable proportion of both migrant and non-migrant labour households seean improvement in their (a) socio-economic position; (b) access to basicinfrastructure and sanitation; (c) health services; (d) education services,compared to 5 and 10 years ago. However, migrants perceive themselves to bebetter off even at the outset.
• Migrant households perceive themselves to be more capable of bargainingwith functionaries at the local level.
Thus, first, both the perception questions and the asset ownership questions arenot able to conclusively establish that the migrant households were no differentfrom the non-migrant households initially. As noted above, the value of residentialhousing and land, which are the two biggest assets owned by households, are higherfor migrant households. This may be because many households have been participatingin migration for several years. Second, the asset ownership pattern and the patternof land operation reflects the labour endowments of the two types of households.Non-migrant households are more likely to own livestock and operate land (generallyleased). Third, however, wage incomes are distinctly higher for migrant workersand this is both due to higher days of employment and higher wages. This has alsoled to higher remittance income which in turn has meant higher consumptionstandards, and higher levels of expenditure on education, residential housing andland, and has also been ploughed into other assets.
4.3 Impact of Migration to the Construction Sector on Poverty
The main objective of this study is to examine the impact on labour migration in theconstruction sector on the poverty status of the migrant workers and their
Migrating out of Poverty? A Study of Migrant Construction Sector Workers in India 75
households. However, the concept of poverty can be approached from differentperspectives. In a narrow sense, poverty is defined as low and insufficient income,or more specifically as low and insufficient consumption expenditure, which isconsidered more stable and easier to measure. In common parlance, this definitionis known as income or economic poverty wherein a person’s actual consumptionexpenditure may be compared to a threshold level of ‘minimum’ expenditure(‘poverty line’) considered adequate to buy a minimum necessary bundle of goodsand services.
In recent years, it is usual to describe poverty in a broader sense variouslyencompassing the whole spectrum of deprivation, ill-being or lack of capabilitiesand/or human rights. Dreze and Sen (1995) make a distinction between ‘poverty’which they describe “not merely as the impoverished state in which people live, butalso to the lack of real opportunity” and ‘economic poverty’ (“low income, meagrepossessions and other aspects”). They (ibid.) refer to the sequence of things a persondoes or achieves as a collection of ‘functionings’. ‘Capability’ refers to the alternativecombination of functionings from which a person can choose. The notion of capabilityis essentially one of freedom - the range of options a person has in deciding whatkind of life to lead. Poverty refers to the lack of real opportunity, due to socialconstraints and personal circumstances, to choose other types of living. Poverty isthus a matter of “capability deprivation”. Economic poverty which refers to lowincomes, meagre possessions and other related aspects also has to be seen in its rolein severely restricting the choices people have to lead valuable and valued lives(ibid. p.10-11).
Lipton and Ravallion (1995) provide useful counter-arguments outlining thelimitations of the “capability approach”. The “basic needs” approach has the strengthof taking into account merit-goods which have an impact on well-being. There aremulti-dimensional measures of poverty which take into account deficits in relationto basic needs, or in some cases, combine these indicators with outcome or capabilityindicators.
Chambers makes further distinction between poverty and other forms ofdeprivation. He describes poverty as ‘lack of physical necessities, assets and income.It includes but is more than being income poor. Poverty can be distinguished fromother dimensions of deprivation such as physical weakness, isolation, vulnerabilityand powerlessness with which it interacts.” (Chambers, 1983) Deprivation refers tolacking what is needed for well-being and a full and good life. Its dimensions arephysical, social, economic, political, and psychological. It includes forms ofdisadvantage such as physical weakness, isolation, poverty, vulnerability andpowerlessness. Well-being is the experience of good quality of life. Thus, well-beingand ill-being refer to experience, poverty more to physical lack and deprivation to amuch wider range of lacks and disadvantages. ‘Poverty and deprivation’ is shortfor ‘poverty and other forms of deprivation’. (Chambers, 1995, p. 5)Chambers mentions eight criteria of deprivation, of which poverty (defined as lackof physical necessities, assets and income) is only one. The others include social
76 Migrating out of Poverty? A Study of Migrant Construction Sector Workers in India
inferiority, isolation, physical weakness, vulnerability, seasonality, powerlessnessand humiliation. In the case of the poor, many of these dimensions may be quiteimperfectly correlated with income poverty. For instance, vulnerability may increaseeven if there is an increase in income, and for poor people there may be trade-offsbetween income and security. Programmes designed to raise incomes may raiseincomes but may also increase the vulnerability of the poor. Seasonality is anotherdimension the implications of which may be underplayed in conventional treatmentsof poverty.
None of these approaches directly considers the perceptions of the “actors”themselves who may have a different understanding of deprivation and their ownpriorities.
Mukherjee (1993) points out that using measured income as an indicator of povertyposes several problems in the case of rural households who follow diverse andcomplex livelihood strategies which overlap and fluctuate virtually from day to day.The economic evaluation of many of these activities is a difficult task. Moreover,using income as a single criterion of poverty ignores the complex inter-relationshipbetween the different strategies and processes which influence poverty. Further,many dimensions fall outside the purview of economic measurability but may beimportant indicators of a household’s well-being.
This study points to the contradictory outcomes of labour migration and themany dilemmas associated with conceptualizing its impact on poverty in the broadersense.
In destinations, workers have poor living and working conditions, lack citizenshiprights, entitlements and voice. Their wages are lower than the legal minimum.However, at the cost of hardship and low consumption levels, they manage to savea good portion of their income which they remit or take back home. At origin, it isclear that migrants are able to secure employment for longer duration as well asreceive higher wages than non-migrants. Their remittances are used to boostconsumption, the condition of residential housing, expenditure on children’seducation, and selective investment in other assets. Although it is not possible tocontrol differences in initial conditions, higher wage incomes among migrants,compared to non-migrants indicate that migrant labourers have more income todeploy in order to improve living conditions of family members.
The surveys collected data on the monthly consumption expenditure of migrantand non-migrant households at destination and at source.19 These results are presentedin Table 4.1 which also estimates the percentage of sample households and populationwhich were below the poverty line based on the Tendulkar Committee methodologyand also the proportion of households who were found to be below the $2PPPfigure used by the World Bank as a poverty benchmark.20
These results show that the current (consumption) poverty level of migranthouseholds in both Samastipur and Malda is significantly less than the correspondinglevel among non-migrant households. These differences persist even at the higher
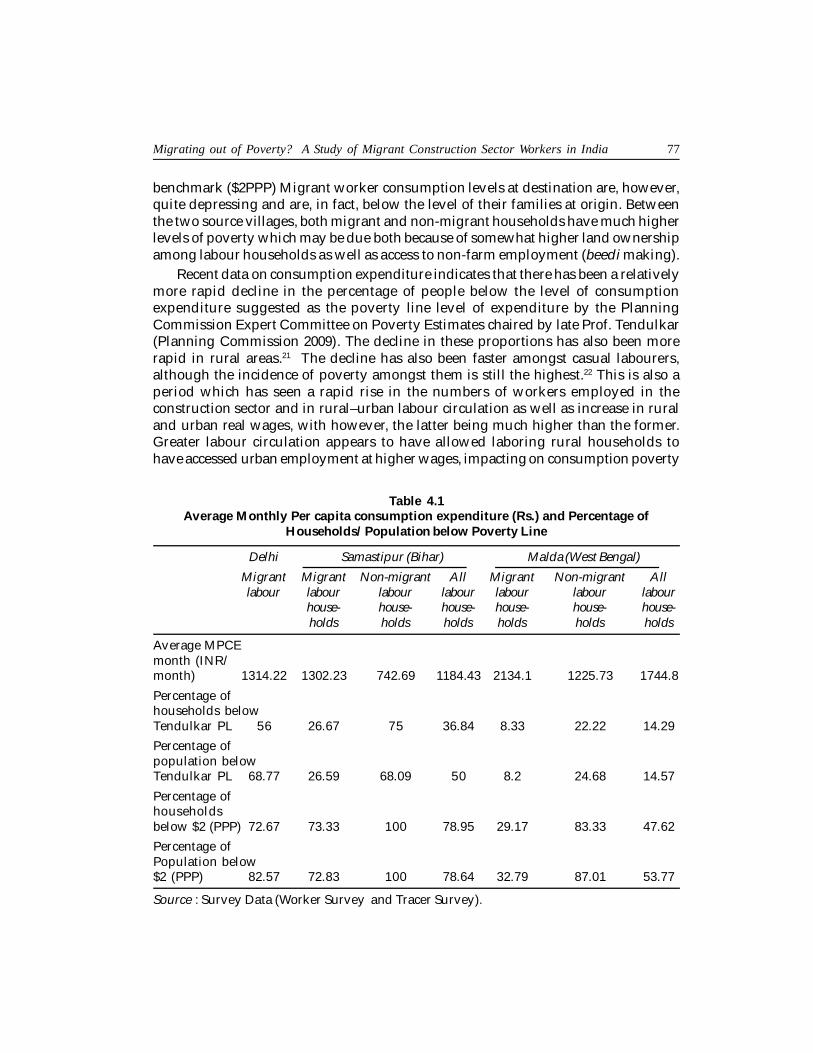
Migrating out of Poverty? A Study of Migrant Construction Sector Workers in India 77
benchmark ($2PPP) Migrant worker consumption levels at destination are, however,quite depressing and are, in fact, below the level of their families at origin. Betweenthe two source villages, both migrant and non-migrant households have much higherlevels of poverty which may be due both because of somewhat higher land ownershipamong labour households as well as access to non-farm employment (beedi making).
Recent data on consumption expenditure indicates that there has been a relativelymore rapid decline in the percentage of people below the level of consumptionexpenditure suggested as the poverty line level of expenditure by the PlanningCommission Expert Committee on Poverty Estimates chaired by late Prof. Tendulkar(Planning Commission 2009). The decline in these proportions has also been morerapid in rural areas.21 The decline has also been faster amongst casual labourers,although the incidence of poverty amongst them is still the highest.22 This is also aperiod which has seen a rapid rise in the numbers of workers employed in theconstruction sector and in rural–urban labour circulation as well as increase in ruraland urban real wages, with however, the latter being much higher than the former.Greater labour circulation appears to have allowed laboring rural households tohave accessed urban employment at higher wages, impacting on consumption poverty
Table 4.1Average Monthly Per capita consumption expenditure (Rs.) and Percentage of
Households/Population below Poverty Line
Delhi Samastipur (Bihar) Malda (West Bengal)
Migrant Migrant Non-migrant All Migrant Non-migrant Alllabour labour labour labour labour labour labour
house- house- house- house- house- house-holds holds holds holds holds holds
Average MPCEmonth (INR/month) 1314.22 1302.23 742.69 1184.43 2134.1 1225.73 1744.8
Percentage ofhouseholds belowTendulkar PL 56 26.67 75 36.84 8.33 22.22 14.29
Percentage ofpopulation belowTendulkar PL 68.77 26.59 68.09 50 8.2 24.68 14.57
Percentage ofhouseholdsbelow $2 (PPP) 72.67 73.33 100 78.95 29.17 83.33 47.62
Percentage ofPopulation below$2 (PPP) 82.57 72.83 100 78.64 32.79 87.01 53.77
Source : Survey Data (Worker Survey and Tracer Survey).
78 Migrating out of Poverty? A Study of Migrant Construction Sector Workers in India
levels. In turn, this may also have affected growth in rural wages, thereby alsoimpacting non-migrant labour households, although to a smaller degree, sinceemployment in rural areas is meagre. In summary, the main reason for the observeddecline in the proportion of the population below the Tendulkar poverty line appearsto be the rising wage rates in the rural and urban areas, the latter trickling back tothe rural areas through the savings and remittances of migrant workers.
Given the scale of this study, its results can only be termed as exploratory.However, they suggest that labour migrants are able to improve their income dueto higher employment and wages, compared to non-migrant labourers. An increasein consumption expenditure of households, relative to non-migrants, is the mostobvious outcome of higher incomes due to such migration. However, these gainsare subject to the availability of employment in the construction industry, and lifecycle issues. We have noted that construction labourers are young, and workers inmigrant households tend to significantly younger than workers in non-migranthouseholds. The accrual of long term gains would depend upon the continued growthof non-farm employment and productive investment of current savings. Our evidenceshows that the other gains over time appear to be larger levels of expenditure onhousing and, in some cases, on land. There are no marked differentials in investmentin other productive assets, but there are some differences in the pattern of investmentin children’s education. Labourers who acquire skills are much better placed, withhigher earnings compared to low skilled workers. But the probability of skillacquisition is still low and differentiated across social groups, despite skill shortagesin the industry. Together, the changes described in this study suggest that theimproved incomes of labour migrants may be one factor accounting for lower ruralconsumption poverty estimated in macro-surveys in India for recent years. However,these improvements are likely to mark a sustained increase out of income povertyonly in cases where land and other productive assets, or skills, have been acquired.However, both in this section and in earlier sections, we have also analysed the flipside of higher incomes that labour migrants face in terms of working and livingconditions at destination.
4.4 Policy Issues
This section discusses some policy issues which emerge from the findings of thisstudy. While these findings may have some general relevance to labour migrationgenerally, they focus on labour migration in the construction sector in India.
1. As has been pointed out, most migrant workers in our sample lack localidentification. The absence of any form of official local identity for the bulkof construction labourers constrains their access to services and benefits whichthey would be normally entitled to as local citizens. This includes access tolocal schools, health clinics, food rations, pensions (in the case of old-agedependents) and so on. Further, their migratory status and temporaryresidence makes them more vulnerable to communicable diseases while atthe same time deprives them and their families of health inspections,
Migrating out of Poverty? A Study of Migrant Construction Sector Workers in India 79
vaccinations etc. These issues have been discussed in Srivastava (2012). TheGovernment of India is implementing a form of resident identification byissuing a unique identification number (UID). However, the UID is associatedwith residential location and is unlikely to facilitate the acquisition ofentitlements. If seasonal migrants are to secure local entitlements, these mustbe universal and portable and must be delivered in a fashion that they canreach migrants working in isolated spatial settings. It helps if theseentitlements are delivered as a legal right and if there are penalties forobstructing the realization of these rights. The Right to Education Act makesit mandatory for schools to admit children who are moving from one area orstate to another for any reason, and for schools at origin to grant transfercertificates expeditiously (Clause 5(2) and 5(3) of the Act.23. Thus no child canbe denied education at destination under the Act and it is for the jurisdictionsto evolve a suitable modality. As a next step, modalities should be workedout by the central and state governments so that the right of the migrantchild to education can be protected. However, the movement of childrenwith migratory parents exposes them to harsh environments and thealternative is to provide them with schooling at origin through stayarrangements in seasonal hostels. In contrast to the Right to Education Act,the National Food Security Act does not provide for portability.
2. Labour migration is almost entirely unregulated and, in the construction sector,mediated by (a chain of) intermediaries. There are, however, a plethora oflabour laws that apply to migrant labour. apart from the laws that apply tounorganized labourers generally (these include the Minimum Wages Act, thepayment of Wages Act, and the Contract Labour Act), there is a specificlegislation that regulates the conditions of recruitment, transportation andwork of interstate migrants (the Interstate Migrant Workmen Act, 1979). Theselaws remain unimplemented because of lack of emphasis, a debilitated labourdepartment machinery, and because most recruitment is through intermediarychains making it difficult to fix responsibility on the principal employer, asrequired by law.24 A proper implementation of existing laws would improvethe working and living conditions and wages of the workers.
3. At the same time, it is also recognized that these laws are cumbersome andcomplex, making implementation difficult. Various tripartite bodies as wellas expert commissions, including the Second National Commission on Labour(2002) and the National Commission on Enterprises in the Unorganised Sector(NCEUS, 2009) have suggested simplification of labour laws and restructuringinto fewer comprehensive laws. The NCEUS recommended a comprehensivelaw for workers in the unorganized sector with a simple tri-partite structurefor more effective implementation (NCEUS 2007). Implementation of theserecommendations would provide for a much better legislative architectureand environment for the protection of labour.
4. The revolution in communication technologies and improvement in transportinfrastructure has the potential of lowering search costs and transaction costs
80 Migrating out of Poverty? A Study of Migrant Construction Sector Workers in India
and eliminating labour intermediaries. But this has not happened. This isbecause these intermediaries also play other roles for both employers andlabourers. For labourers, contractors may help smooth income/ consumptionover lean periods by extending loans. among other things, they also reduceunemployment risk due to their contacts with firms / employers. However,much more important, as long as employers use contractors to recruit batchesof workers and to extract work from them, labourers do not have the optionof seeking employment without them. The Contract Labour and the InterstateMigrant Workmen’s Act needs serious reconsideration. Non-registration ofcontractors, on-issuance of wage slips, and non-payment of full dues bycontractors must attract serious penalties for both employers and contractors.The worker’s dues and working conditions must be treated as a joint liabilityof contractors and outsourcers
5. The Building and Construction Workers’ Welfare Act is a historic Act whichaims at providing social security to construction workers. Under the Act acess of up to 1% of cost is imposed on building costs above a certain projectcost. More than Rs. 200 billion has accumulated as cess under the Act whichcan be used for social security measures. But there are serious problems ofimplementation due to the isolated and segmented nature of the workforceas well as its migratory nature. Workers cannot be easily registered and ifregistered cannot be easily traced as they move from one place to another.Moreover, many of these workers oscillate between countryside and urbanareas. Some recent amendments have been suggested to the Act. These willmake registration easier and also allow the fund to be used for purposes thatbenefit the collectivity of such workers. While the former may also open thesystem to abuse, the latter change can easily be used to benefit constructionworkers and their families through creation of shelters, crèches, health camps,health clinics, etc.
6. Given its size, and the incidence of injury and accidents, safety and injurycompensation should be covered under a separate legislation for this sector.
7. Migration is mainly a response to the uneven spread of economic opportunity.However, it is also precipitated by displacement or other cataclysmic events.While such migration mitigates adversity, regional and urban developmentstrategies can obviate distress migration as well as lower the costs of migrationand increase opportunity-led migration.
8. As shown in this paper, skill acquisition provides a major route out of poverty.In this study, the limited amount of skill upgradation observed has been onaccount of on the job learning and has been made possible due to the scarcityof skilled labour. Such skill upgradation is limited, patchy, and subject to socialinequities. Although the government and the National Skill developmentCorporation have initiated support for skill building in the construction sector,the outcomes of these moves were not observable in this fieldwork.

Migrating out of Poverty? A Study of Migrant Construction Sector Workers in India 81
Notes
1. See, for example, PRAXIS, 2002, Mosse et al., 2002, Hirway et al., 2002, Haberfeld et al.,1999; Rogaly et al., 2001, Srivastava and Sasikumar, 2005; Srivastava, 1998, 2011a.
2. The share of migrant in the construction workers, based on estimates from NSS 64th
round may be underestimates to the extent such survey underestimates the short-termmigrants.
3. The terms “organized” and “unorganized” sector in India are used to differentiatebetween firms and establishments on the basis of size, registration, and social securityentitlements. In the manufacturing sector, organized sector firms are those that employ10 or more workers with power, or 20 or more workers without power, and are registeredunder the Factories Act, 1948. In the case of other establishments, the definition variesfrom sector to sector, but usually establishments employing 20 or more workers aredeemed to be in the organized sector (see NCEUS 2008 and National StatisticalCommission 2012). NCEUS (2008) suggests that the terms “organized” and“unorganized” can be considered as “formal” and “informal” with some distinctions.
4. Construction activity takes place in different stages and involves different skill typesand workers. In this study, we have focused on the initial stages, in which the proportionof unskilled workers is higher. In the initial interviews, an attempt has been made toassess the proportion of workers belonging to different skill levels and to differentmigration streams. Thereafter, although snow balling was used to contact other workers,the effort was to sample workers roughly representing the broad universe to the extentthat this was operationally possible.
5. This corroborates findings of several other studies which also conclude that there is ahigh preponderance of illiterate or semi-literate among seasonal migrants (Connell, etal., 1976; Rogaly et al., 2001 Haberfeld, et al., 1999; Srivastava, 2011a)
6. In our definition, workers engaged as manual labourer and concrete worker are consideredas unskilled workers and workers engaged in other works are considered as skilledworkers. The other works include carpenter, steel bender, electric welder, scaffolder,electrician, crane operators, signalman, painter, plumber, mason and other
7. In this study, workers who oscillate between destination and source at the end of eachwork-period (less than a year, but usually more than a few weeks), are considered to beseasonal migrants. Workers who oscillate between destination and source at the end ofan irregular and undefined period, usually more than a year, and who may also movefrom one job to another, or from one destination to another, during their period ofemigration, are considered to be circular migrants.
8. The 8 hours minimum wages set by the government of Delhi, UP, and Haryana are asfollows:-Noida (UP) valid till 31-03-2013 unskilled worker –Rs 149, skilled worker - Rs187.08Gurgaon (Haryana) valid till 31-12-2012 Unskilled workers - Rs 191.04 , Delhi valid till31-03-2013 Unskilled worker Rs 279 Skilled Worker Rs 339
9. Similar pattern of recruitment in the sector through organized migration and its effecton segmentation of workforce has been noted in the earlier literature (see, for example,Mazumdar, 1983; Dasgupta 1987; Mehta, 1987; and Piore 1983)

82 Migrating out of Poverty? A Study of Migrant Construction Sector Workers in India
10. In the unorganized sector, wherever wages are time rates, an eight-hour work day iscommon. Exceptions to this are tasks which are piece rated and where skilled workersor sub-contractors are involved.
11. Migrant workers facing lack of access to formal training in the jobs, thus limiting thepossibility of economic mobility through acquisition of skills has been extensivelydocumented in the earlier literature (Haberfeld Y, 1999; Moss et al. 1997; Mitra 2010)
12. The estimates are calculated by dropping 25 observations, based on our observation asoutliers which are either less than half or more than twice the average per capita expensesreported by the workers.
13. Throughout this study, remittances refer both to amounts remitted by workers to theirfamilies in source areas, in cash or kind, through formal or informal channels, as well assavings taken back periodically on home visits, in cash or in kind.
14. In this study, both resident and non-resident (migrant) members are enumerated asmembers of the household. However, the computation of per capita consumptionexpenditure is based on the number of ordinarily resident household members.
15. Total assets include livestock, farming and irrigation equipments, transport equipmentsand consumer durables possessed by rural households.
16. The use of remittances by migrant households for purchase of farm assets has been alsodocumented in the earlier literature (Oberoi and Singh, 1983, Krishnaiah 1997, Sharma1997)
17. The monthly per capita expenditure on education estimated from the details of expenseson education incurred by the households on children of the age group of 5 to 14 yearsroughly gives the similar picture. In V1 , the per capita monthly expenses on educationincurred by construction migrant worker household, other migrant worker householdand non-migrant worker households are Rs 49.85, Rs 36.16, and Rs 4.27, respectively.Similarly, the expenses reported by the construction migrant worker households, othermigrant worker households, and other non-migrant worker households in V2 are Rs80.12, Rs 208.67, and Rs 29.32, respectively. Thus, both villages confirm the trend ofmigrant households spending higher on education than their non migrant counterparts.
18. Using NSS data, Deshingkar and Sandi (2011) report that migrants report higher averagespending on food and health, but lower (average) spending on housing and education.They also note that the marginal spending effects of higher total consumption are negativefor both food expenditure and education expenditure. The former can be understood interms of the Engel’s effect. They, thus single out food and health expenditure as the twomain components of expenditure on which migrants spend more, on average. However,these conclusions pertain to migrants documented by the NSS, who are permanent orsemi-permanent migrants and who face different choices and constraints on spending.
19. As explained earlier, the schedules used in the collection of information on consumptionexpenditure were quite detailed, but less elaborate than that used by the NSSO in itsconsumption expenditure surveys. Hence, estimates of expenditure obtained in thisstudy are likely to be slight underestimates and our estimates of poverty may, therefore,be slightly biased upwards. The results reported here need to keep this caveat in mind.
20. The estimates of households and population living below $2PPP poverty line are basedon the purchasing parity conversion of 0.3 in the year 2005. The rational for consideringPPP rupee dollar conversion ratio not later than 2005 is that the series thereafter is basedon projection and not actual survey. We however updated the PPP value of rupee based

Migrating out of Poverty? A Study of Migrant Construction Sector Workers in India 83
on difference of CPI in United states and CPI for Industrial worker and Agriculturallabour in India as the case may be. The poverty lines thus obtained for industrial workerand agricultural labour at all-India level are then adjusted for state specific poverty linebased on the Tendulkar estimates of poverty line for respective states. This exercise givesus a $2 PPP poverty benchmark (per capita per month) of Rs 1501 for agricultural workersin rural Bihar, Rs 1507 for rural Bengal and Rs 1596 for industrial workers in Delhi.
21. Although the Tendulkar-revised poverty line led to a one-time increase in the ruralpoverty line and the corresponding HCR, the rates of decline in rural poverty beenhigher. According to Planning Commission estimates, the all-India HCR (using povertylines based on the Tendulkar committee methodology) declined by 8.1 percentage pointsin 11 years between 1993 and 1994 and 2004 and 2005 (8.3% in rural areas and 6.1% inurban areas) and 7.3 percentage points from 37.2% in 2004/05 to 29.8% in 2009/10,with rural poverty declining by 8.0 percentage points (from 41.8% to 33.8%) and urbanpoverty declining by 4.8 percentage points (from 25.7% to 20.9%). More recent PlanningCommission estimates (Planning Commission 2013) show a much sharper declinebetween 2004 and 2005 and 2011 and 2012. According to these estimates, between 2004and 2005 and 2011 and 2012, rural poverty declined by 16.1 percent points and urbanpoverty 12 percent points. The period since 2004 and 2005 also coincides with anacceleration in rural and urban wage rates.
22. Nearly 50% of agricultural labourers and 40% of other labourers are below the povertyline in rural areas, whereas in urban areas, the poverty ratio for casual labourers is47.1% (Planning Commission, 2012). Thorat and Dubey (2012) have used the 1993Expert Group derived poverty lines (updated till 2009/10) to analyse inter-group changesin population below this poverty line. Between 2004 and 2005 and 2009 and 2010, thispercentage declined by 4.4% per year compared to a rate of 2.2% between 1993 and 1994and 2009 and 2010. While the rate of decline in poverty was lower than average forlabour households during 1993 and 1994 and 2004 and 2005, it became on par with thelatter during 2004 and 2005 and 2009 and 2010 suggesting a faster rate of decline inpoverty for this occupational group. This is no doubt partly due to improvement in localwages, but our survey also suggests that remittances/savings of rural-urban labourmigrants has led to a greater impact on migrant households in the rural areas.
23. http://www.education.nic.in/elementary/free%20and%20compulsory.pdf24. For a fuller discussion of these laws, the interested reader may refer to NCEUS (2007),
especially chapters 6, 11, and 13.

84 Migrating out of Poverty? A Study of Migrant Construction Sector Workers in India
REFERENCES
Breman Jan and Isabelle Guerin (2009): Introduction: On Bondage: Old and New inJan Breman, Isabelle Guerin and Aseem Prakash, (ed.), India’s Unfree Workforceof Bondage Old and New, Oxford University Press. New Delhi.
Chambers, Robert, 1983, Rural Development: Putting the Last First, London: LongmanScientific and Technical.
Chambers, Robert, 1992, “Poverty in India: Concepts, Research and Reality”, in Harriset. al. (eds.).
Chambers, Robert, 1995, “Poverty and Livelihoods: Whose Reality Counts”, UNDP(mimeo).
Connell, J. Dasgupta, B. , Laishley, R. and Lipton, M. (1976): Migration from RuralAreas: The Evidence from Village Studies, Delhi: Oxford University Press.
Dasgupta, B (1987), Issues of Migration and Employment with Reference to Calcutta’in Alam S.M. and Alikhan, F (1987): Perspectives on Urbanization and Migration:India and USSR. Delhi. Allied Publisher
Deshingkar, Priya and Shaheen Akter (2009):Migration and Human Development inIndia: Human Development Research Paper 2009/13, April.
Deshingkar, Priya and Matteo Sandi (2011): Migration and Human Development inIndia-New Challenges and Opportunities, National Workshop on InternalMigration and Human Development in India, Indian Council of Social ScienceResearch (ICSSR), New Delhi, India 6-7 December.
Drèze, Jean and Amartya Sen, 1995, India: Economic Development and SocialOpportunity, Delhi /Oxford: Oxford University Press.
Government of India, Planning Commission (2009). Report of the Expert Group toReview the Methodology for Estimation of Poverty, Planning Commission, NewDelhi, November.
Government of India, Planning Commission (2012) “Press Note on Poverty Estimates,2009-10”, New Delhi, March.
Government of India, Planning Commission (2013) “Press Note on Poverty Estimates,2011-12”, New Delhi, July.
Haberfeld, Y., Menaria, R.K., Sahoo, B.B. and Vyas, R.N.(1999): Seasonal migrationof rural labour in India, Population Research and Policy Review, 18(6), pp.471-87.
Himanshu (2007). “Recent Trends in Poverty and Inequality: Some PreliminaryResults”, Economic and Political Weekly, 10-16 February.
Hirway, I (2001): How far can Poverty Alleviation Program can go? An assessmentof PAPs in Gujarat, Ahmedabad, India, Centre for Development Alternatives.
Jodha, N. S. (1988) “Poverty Debate in India: A Minority View”, Economic and PoliticalWeekly, Special Number, November.
Migrating out of Poverty? A Study of Migrant Construction Sector Workers in India 85
Joshi, V and Joshi, H (1976): Surplus labour and the City: A study of Bombay. Delhi:Oxford University Press
Krishnaiah, M (1997): Rural migrant labour systems in semi-arid areas: A study oftwo villages in Andhra Pradesh. The Indian Journal of Labour Economics, 40(1).
Kundu, A. (2009) “Urbanisation and Migration: An Analysis of Trends, Patterns andPolicies in Asia”, Human Development Research Paper No. 16. New York. UnitedNations Development Programme. Human Development Report.
Lipton, Michael and Martin Ravallion (1995). “Poverty and Policy”, in Jere Behrmanand T.N. Srinivasan (eds), Handbook of Development Economics, Vol. 3, NorthHolland, Amsterdam.
Mazumdar, D (1983): Segmented labour markets in LDCs, American EconomicReview, 73(2).pp.254-59.
Mehta, M (1987). Segmented labour market: A case study of lower strata of workersin and Indian metropolis. In Alam S.M. and Alikhan, F (1987): Perspectives onUrbanization and Migration: India and USSR. Delhi. Allied Publisher
Moss, David, 1995, “Authority, Gender and Knowledge: Theoretical Reflections onParticipatory Rural Appraisal”, Economic and Political Weekly, March 1, pp. 569-578.
Mosse, D., Gupta. S., Mehta, M., Shah, V, Rees, J. and KRIBP Team (2002): Brokeredlivelihoods: Debts, labour migration and development in tribal Western India.Journal of Development Studies, 38(5). pp.59-88
Mosse, D., Gupta. S., Mehta, M., Shah, V, Rees, J.(1997): Seasonal Labour Migrationin Tribal (Bhil) Western India, Sawnsea: Centre for Development Studies,University of Wales.
Mukherjee, Neela, 1993, Participatory Rural Appraisal.National Statistical Commission (2012): Report of the Committee on Unorganized
Sector Statistics, Government of India, FebruaryNCEUS (2007): “Report of the Conditions of Work and Promotion of Livelihoods in
the Unorganized Sector” National Commission for Enterprise in the UnorganizedSector, Government of India, August.
NCEUS (2008): “Report on Definition and Statistical Issues Relating to InformalEconomy” National Commission for Enterprise in the Unorganized Sector,Government of India, November
Oberai, A.S. and Singh, M.H.K (1983): Causes and Consequences of InternalMigration: A study in the Indian Punjab. Delhi. Oxford University Press.
Oxford Economics (2013). Global Construction 2020. Global Construction PerspectiveReport. Oxford.
Piore, M.J. (1983): Labour Market Segmentation: To what paradigm does it belong?American Economic Review 73(2). Pp.249-53.
PRAXIS (Institute for Participatory Practices) 2002 MP Participatory PovertyAssessment. Report prepared for ADB.
86 Migrating out of Poverty? A Study of Migrant Construction Sector Workers in India
RBI(2012): “Handbook of Statistics on the Indian Economy 2011-12”, Reserve bankof India, available online at http: www.rbi.org.in/scripts/AnnualPublications.aspx?head=Hand-book%200f%20Statistics%20on%20Indian
Rogaly Ben, J. Biswas, Daniel C., Abdur. R , Kumar R, and A. Sengupta (2001):‘Seasonal Migration, Social change and Migrant Rights, Lessons from WestBengal’, Economic and Political Weekly, pp.4547-4558.
Sharma, A.N. (1997) People on the move: Nature and implication of Migrations in aBackward Economy, Delhi Vikas
Smita and Panjiar, Prashant (2007). Locked Homes, Empty Schools: The Impact ofDistress Seasonal Migration on the Rural Poor. New Delhi: Zubaan.
Soundararajan Vidhya (2013): Construction Workers -Amending the Law for moresafety, Economic and Political Weekly, June8 Vol.XLVIII, No. 23
Srivastava, Ravi (2012) “Changing Employment Conditions of the Indian Workforceand Implications for Decent Work,” Global Labour Journal: Vol. 3: Iss. 1, p. 63-90.
Srivastava, Ravi (2011a) “Internal Migration in India: An Overview of its Features,trends, and Policy Challenges”. UNESCO, Social and Human Sciences Sector &UNICEF, New Delhi.
Srivastava, Ravi (2011b) “Labour Migration, Inequality, and Development Dynamicsin India: An Introduction”, The Indian Journal of Labour Economics, Vol. 54,No. 3, pp. 373-385.
Srivastava, Ravi (2011c) “Labour Migration in India: Recent Trends, Patterns andPolicy Issues”. The Indian Journal of Labour Economics, Vol. 54, No. 3, pp. 411-440.
Srivastava, Ravi (2009a) “Conceptualising Continuity and Change in Emerging Formsof Labour Bondage in India”, in Jan Breman, Isabelle Guerin & Aseem Prakash(eds.) India’s Unfree Workforce: Of Bondage Old and New, pp. 129-146. NewDelhi: Oxford University Press.
Srivastava, R.S, (2009b): “Economic Geography and Development: Some observationson India’s experience”, Annual conference of the Indian Economic Association.Bhubaneswar, December, Invited Keynote paper.
Srivastava, R.S (2003): Regional growth and disparities. In :Alternative Survey Groupeds(2003) Alternative Economic Survey 2001-02, Economic Reform: DevelopmentDenied. New Delhi. Rainbow Publishers,
Srivastava, Ravi 1999) “People’s Own Perception and Assessment of Poverty”,contributed paper (Chapter 8) in Raja J. Chellaiah and R. Sudershan (eds.) IncomePoverty and Beyond: Human Development in India, New Delhi: Social SciencePress, pp. 172-192 (initially contributed as background paper to the South AsiaPoverty Monitor: India Country Report , New Delhi: United NationsDevelopment Programme, 1997).
Srivastava, Ravi (1998) “Migration and the Labour Market in India”, Invited Keynote

Migrating out of Poverty? A Study of Migrant Construction Sector Workers in India 87
paper, Conference issue, The Indian Journal of Labour Economics, Vol. 41, No. 4,Oct.-Dec. pp. 583-617.
Srivastava Ravi .S. (1997a): ‘Informalisation’ of the Workforce, Economic and PoliticalWeekly, February1.
Srivastava, Ravi (1997b). “Poverty in India: A Review of Nature, Trends andEradication Strategies”, Status Paper for the European Union Research Projecton Poverty Reduction in India, Commissioned by the Centre for DevelopmentResearch, Copenhagen.
Srivastava, Ravi and Dasgupta, Rajashri (2010), Small Steps, Large Beginnings. NewDelhi: The America India Foundation.
Srivastava, Ravi and Sasikumar, S. K. (2005) “An Overview of migration in India, itsimpacts and key issues”, in Tasneem Siddiqui (ed.) Migration and Development:Pro-poor Policy Choices, Dhaka: The University Press, pp. 157-216
Standing, G (1985): Circulation and the labour process In: Standing G ed(1985): LabourCirculation and the labour Process, London: Croom Helm.
Suryanarayanan, S S (2004): “Labour Laws, Contractual Parameters and Conditionsof Construction Workers: A Study in Chennai”, NLI Research Studies SeriesNo50/2004, VV Giri National Labour Institute, Noida, Uttar Pradesh.
The Economic Times (2011): “Rs 32-a-day poverty line had Plan panel in controversy”in 2011, http://articles.economictimes.indiatimes.com/2011-12-31/news/30576678_1_capita-per-day-poverty-rs-32-a-day-poverty-line accessed on 9th June, 2013.
Vaid (1997): “Contract Labour in the Construction Industry in India”, NICMAR Publication Bureau,National Institute of Construction Management and Research, Mumbai.

