midwest economic outlook -...
TRANSCRIPT

Instructor: William Strauss, [email protected] – 312-322-8151
Economics
Market IndicatorsSession 2
National Association of Credit Management
Graduate School of Credit
and Financial Management
American University
Washington, DC
June 23, 2018
1
Instructor: William Strauss, [email protected] – 312-322-8151
What you will learn in this session
• Labor productivity and Unit Labor Costs
• Producer Price Index
• Cost/Price Dynamics in the Business Cycle
• Business Capital Expenditures
• Inventories
• Consumers represent a large share of the U.S. Economy
• Consumer Price Index (CPI)
• Inflation versus deflation
• Employment
• Leading Economic Indicators
• Activity Index
2
Instructor: William Strauss, [email protected] – 312-322-8151
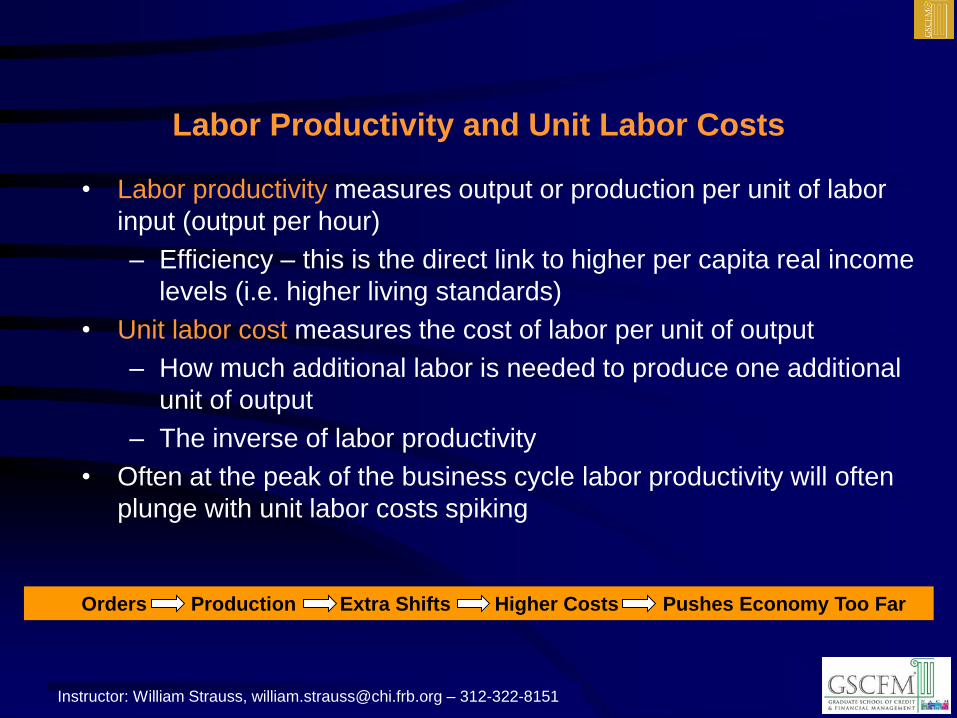
• Labor productivity measures output or production per unit of labor
input (output per hour)
– Efficiency – this is the direct link to higher per capita real income
levels (i.e. higher living standards)
• Unit labor cost measures the cost of labor per unit of output
– How much additional labor is needed to produce one additional
unit of output
– The inverse of labor productivity
• Often at the peak of the business cycle labor productivity will often
plunge with unit labor costs spiking
Labor Productivity and Unit Labor Costs
Orders Production Extra Shifts Higher Costs Pushes Economy Too Far
Instructor: William Strauss, [email protected] – 312-322-8151
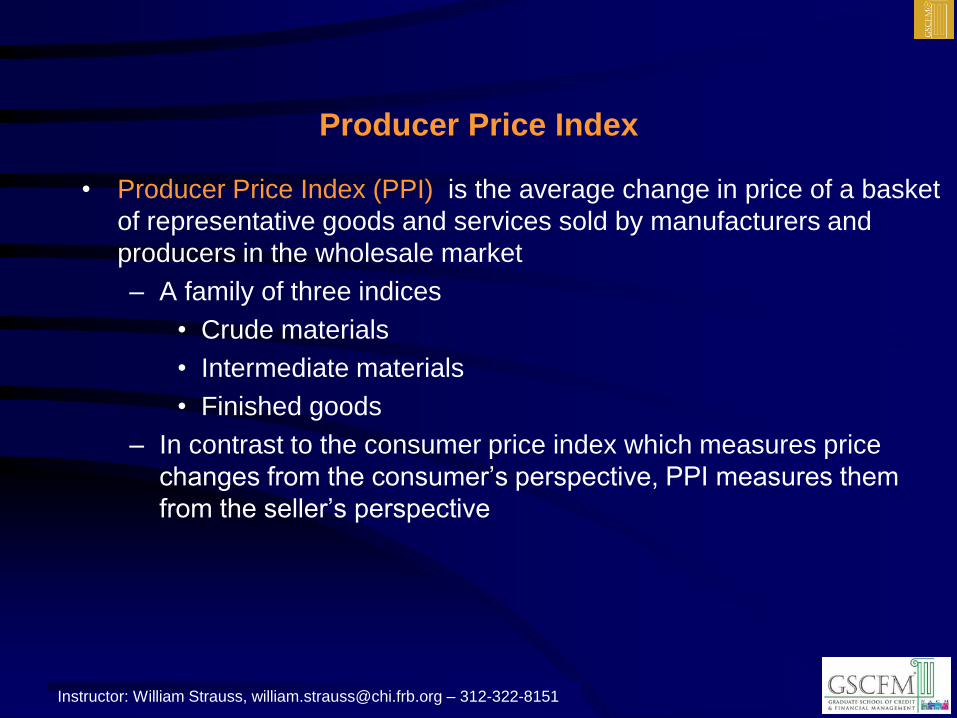
• Producer Price Index (PPI) is the average change in price of a basket
of representative goods and services sold by manufacturers and
producers in the wholesale market
– A family of three indices
• Crude materials
• Intermediate materials
• Finished goods
– In contrast to the consumer price index which measures price
changes from the consumer’s perspective, PPI measures them
from the seller’s perspective
Producer Price Index
Instructor: William Strauss, [email protected] – 312-322-8151
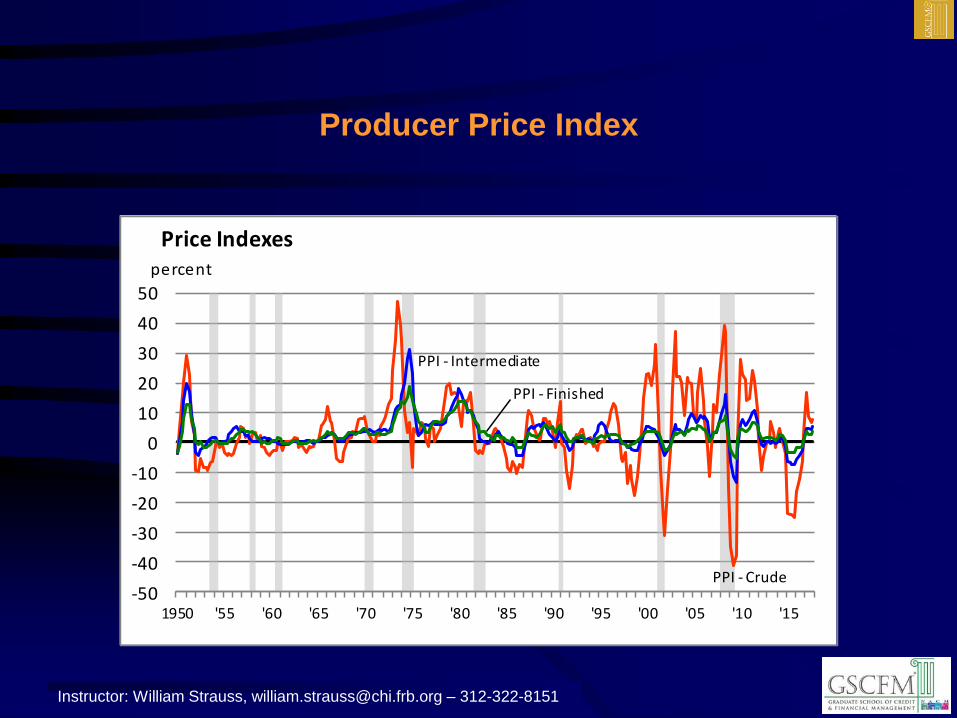
Producer Price Index
-2
0
2
4
6
8
Real gross domestic product
percent
-2
0
2
4
6
8
Real gross domestic product
percent
-50
-40
-30
-20
-10
0
10
20
30
40
50
1950 '55 '60 '65 '70 '75 '80 '85 '90 '95 '00 '05 '10 '15
Price Indexespercent
PPI - Finished
PPI - Crude
PPI - Intermediate

Instructor: William Strauss, [email protected] – 312-322-8151
• This same path is followed by the non-manufacturing sector of the
economy
Cost/Price Dynamics in the Business Cycle
GDP IP PMI CU Labor Productivity
Unit Labor Costs PPI
GDP IP PMI CU Labor Productivity
Unit Labor Costs PPI
Instructor: William Strauss, [email protected] – 312-322-8151
• Investment is the key reason for growth in the economy over time
– Why invest?
• In order to be able to produce more/consume more in the future
• Necessary evil
– Six reasons to invest
1) Depreciation
– Factories/plants and equipment wear out and need to be
replaced
2) If output rises to a point where in order to produce more,
more capital is needed
Business Capital Expenditures
Instructor: William Strauss, [email protected] – 312-322-8151
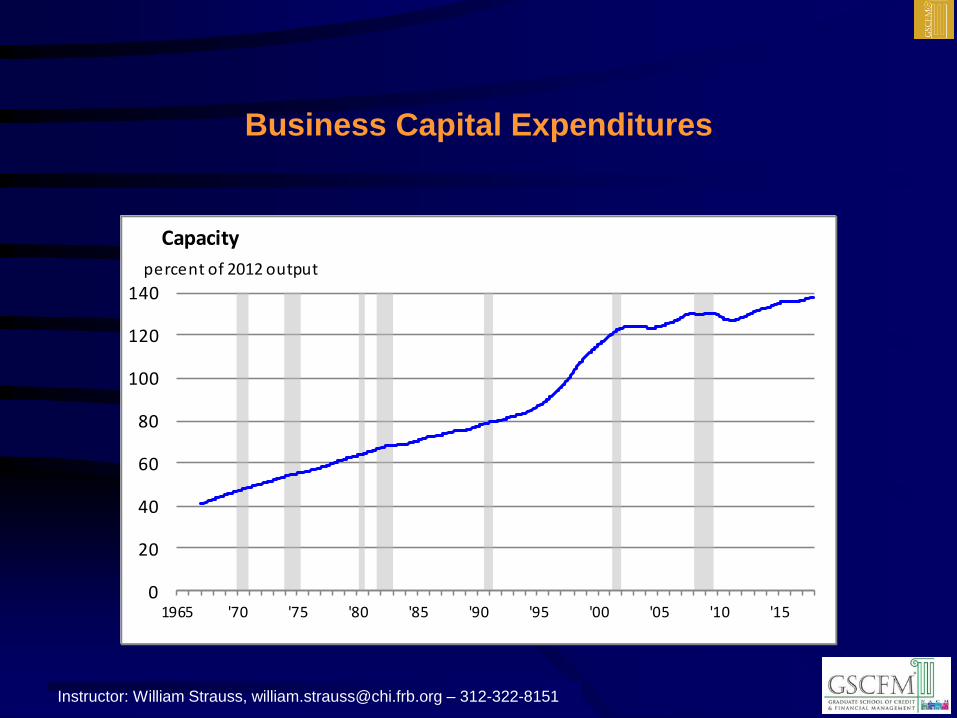
Business Capital Expenditures
0
20
40
60
80
100
120
140
1965 '70 '75 '80 '85 '90 '95 '00 '05 '10 '15
Capacity
percent of 2012 output
Instructor: William Strauss, [email protected] – 312-322-8151
• Investment is the key reason for growth in the economy over time
– Six reasons to invest
3) Innovation
– Even functional equipment will be replaced if newer
equipment reduces operating costs sufficiently to justify the
investment
» Electronic technology (e.g. computers and smart
phones)
4) New products or redesigned products force the replacement
of existing equipment
– PC equipment : Desktop Laptop Mobile
– Auto dies
Business Capital Expenditures
Instructor: William Strauss, [email protected] – 312-322-8151
• Investment is the key reason for growth in the economy over time
– Six reasons to invest
5) Profits growth in the long-run future is anticipated for the
company’s business
6) Interest rates
– Since investment is a durable good (having a useful life of
more than three years), financing the purchase is a
reasonable way to finance the acquisition of this asset
– The lower the interest rate the lower the cost of carrying
the equipment (improving the rate of return)
Business Capital Expenditures
Instructor: William Strauss, [email protected] – 312-322-8151
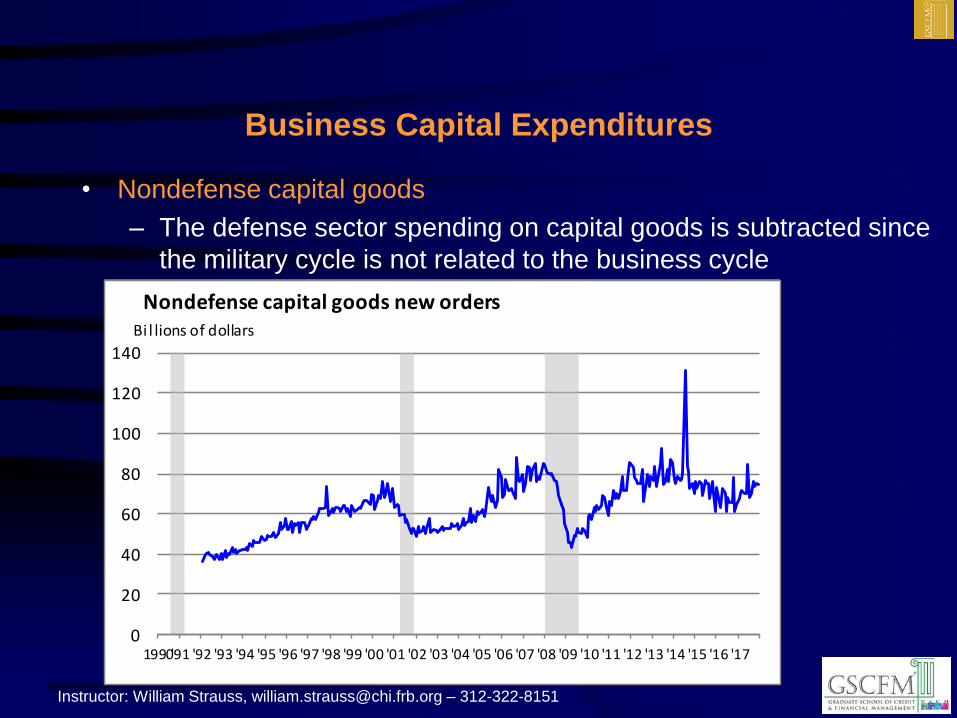
• Nondefense capital goods
– The defense sector spending on capital goods is subtracted since
the military cycle is not related to the business cycle
Business Capital Expenditures
0
20
40
60
80
100
120
140
1990'91 '92 '93 '94 '95 '96 '97 '98 '99 '00 '01 '02 '03 '04 '05 '06 '07 '08 '09 '10 '11 '12 '13 '14 '15 '16 '17
Nondefense capital goods new ordersBi l lions of dollars
Instructor: William Strauss, [email protected] – 312-322-8151
• Nondefense capital goods less aircraft
– Aircraft are extremely expensive items and even the swing of
1 or 2 aircraft can move the numbers in a significant way
• Boeing 737: $78-$113 million
• Boeing 767: $194 million
• Boeing 787: $218-$298 million
• Boeing 777: $270-$389 million
• Boeing 747: $368 million
Business Capital Expenditures
Instructor: William Strauss, [email protected] – 312-322-8151
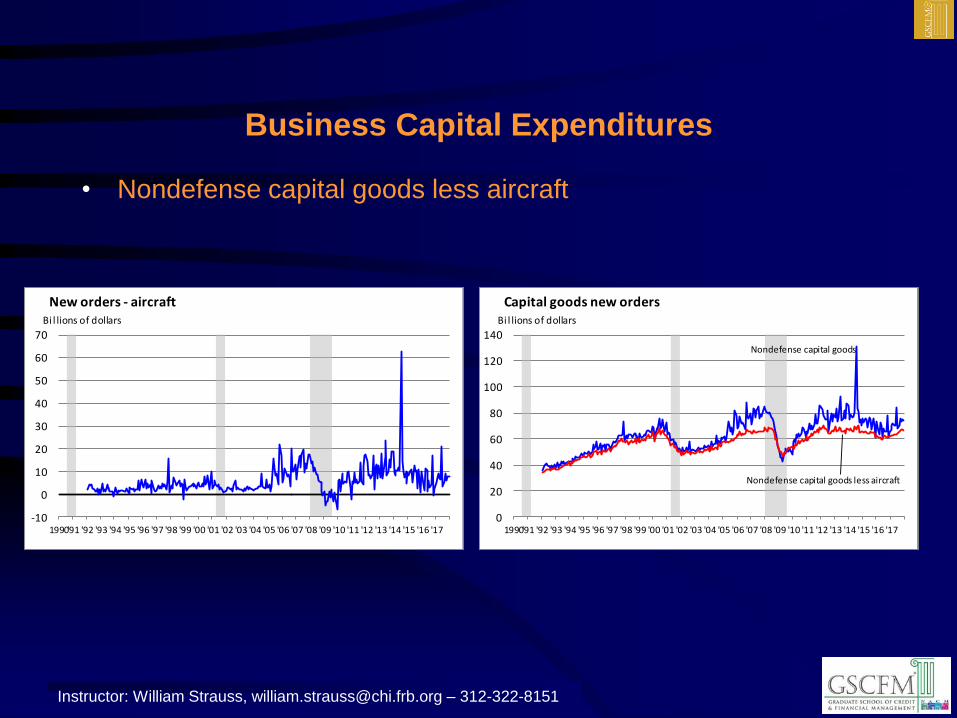
• Nondefense capital goods less aircraft
Business Capital Expenditures
0
20
40
60
80
100
120
140
1990'91 '92 '93 '94 '95 '96 '97 '98 '99 '00 '01 '02 '03 '04 '05 '06 '07 '08 '09 '10 '11 '12 '13 '14 '15 '16 '17
Capital goods new ordersBi l lions of dollars
Nondefense capital goods less aircraft
Nondefense capital goods
-10
0
10
20
30
40
50
60
70
1990'91 '92 '93 '94 '95 '96 '97 '98 '99 '00 '01 '02 '03 '04 '05 '06 '07 '08 '09 '10 '11 '12 '13 '14 '15 '16 '17
New orders - aircraftBi l lions of dollars
Instructor: William Strauss, [email protected] – 312-322-8151
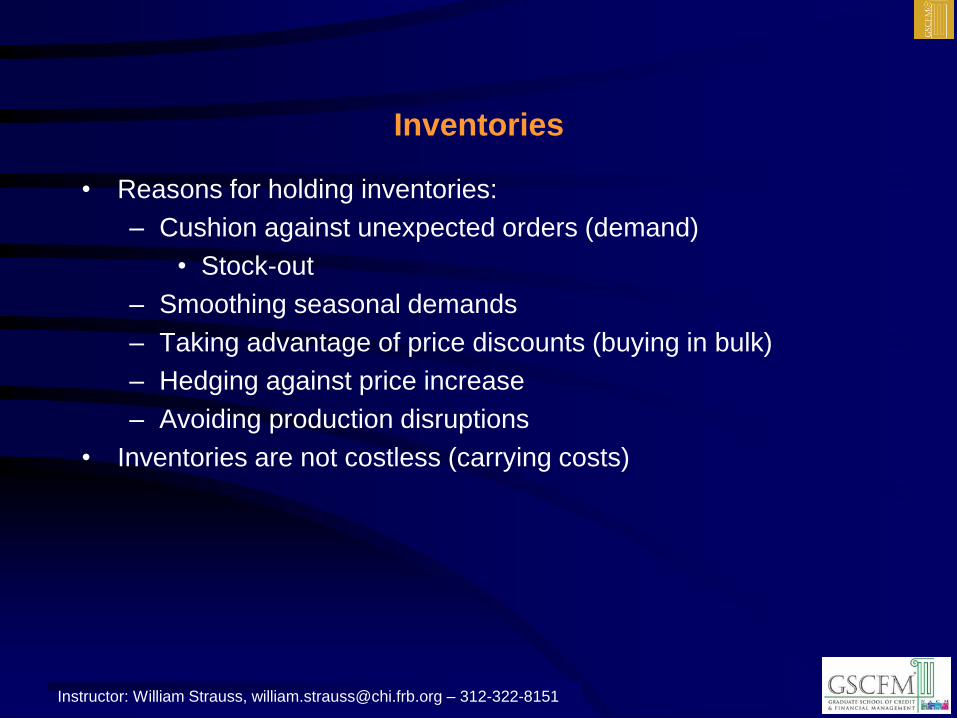
• Reasons for holding inventories:
– Cushion against unexpected orders (demand)
• Stock-out
– Smoothing seasonal demands
– Taking advantage of price discounts (buying in bulk)
– Hedging against price increase
– Avoiding production disruptions
• Inventories are not costless (carrying costs)
Inventories
Instructor: William Strauss, [email protected] – 312-322-8151
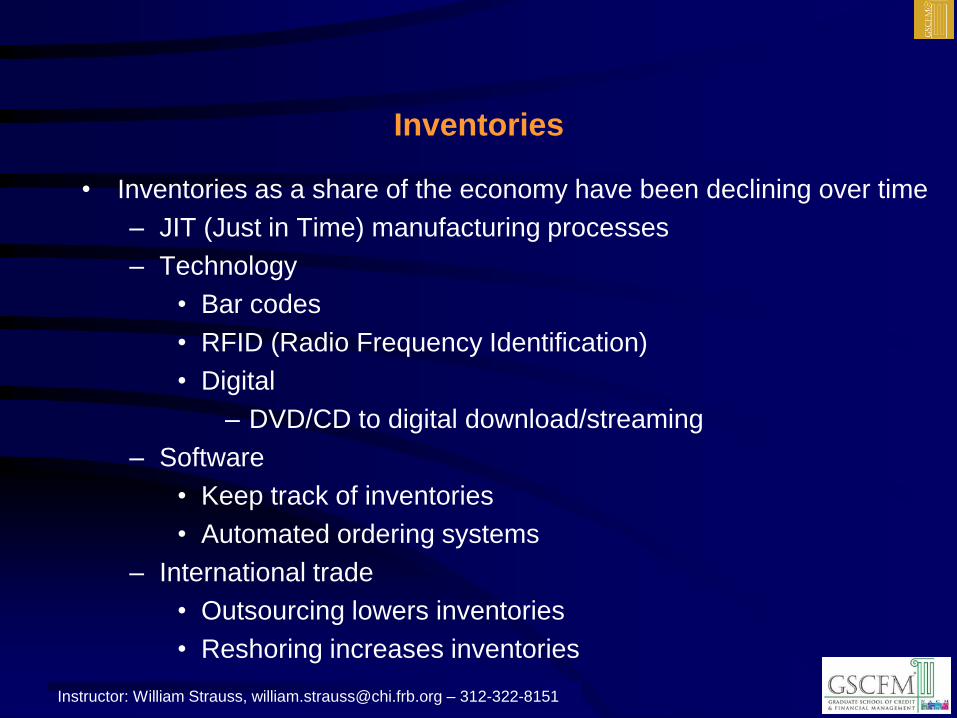
• Inventories as a share of the economy have been declining over time
– JIT (Just in Time) manufacturing processes
– Technology
• Bar codes
• RFID (Radio Frequency Identification)
• Digital
– DVD/CD to digital download/streaming
– Software
• Keep track of inventories
• Automated ordering systems
– International trade
• Outsourcing lowers inventories
• Reshoring increases inventories
Inventories

Instructor: William Strauss, [email protected] – 312-322-8151
Inventories
1214161820222426283032343638
1950 '55 '60 '65 '70 '75 '80 '85 '90 '95 '00 '05 '10 '15
Inventory to GDP ratioratio
Instructor: William Strauss, [email protected] – 312-322-8151
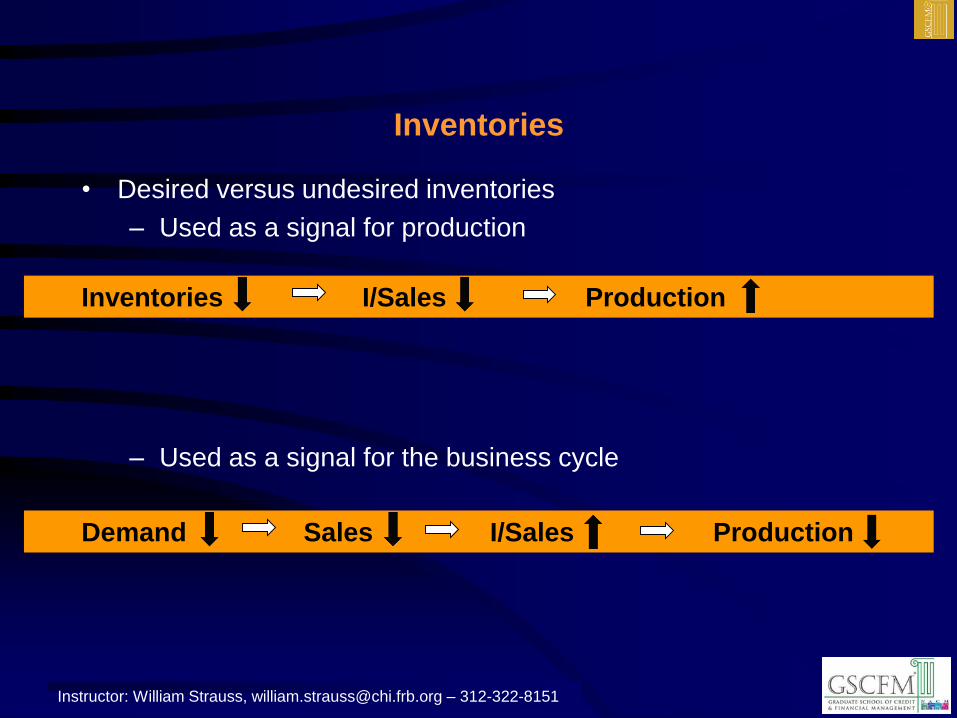
• Desired versus undesired inventories
– Used as a signal for production
– Used as a signal for the business cycle
Inventories
Inventories I/Sales Production
Demand Sales I/Sales Production
Instructor: William Strauss, [email protected] – 312-322-8151
Consumers Represent a Large Share of the U.S. Economy
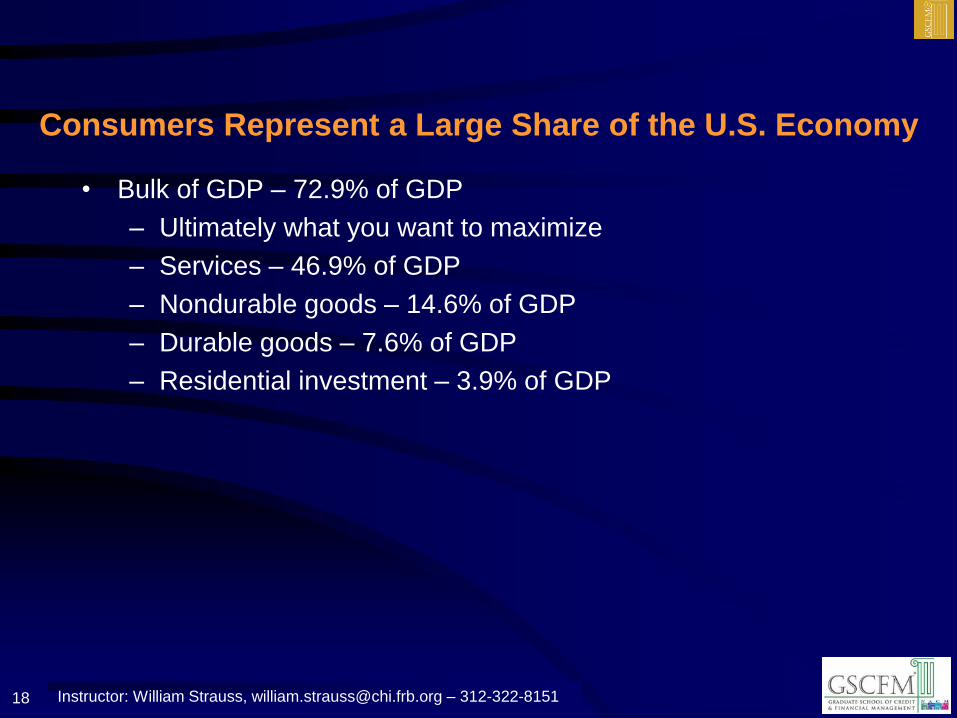
• Bulk of GDP – 72.9% of GDP
– Ultimately what you want to maximize
– Services – 46.9% of GDP
– Nondurable goods – 14.6% of GDP
– Durable goods – 7.6% of GDP
– Residential investment – 3.9% of GDP
18
Instructor: William Strauss, [email protected] – 312-322-8151
-30
-20
-10
0
10
20
30
40
50
60
1945 '50 '55 '60 '65 '70 '75 '80 '85 '90 '95 '00 '05 '10 '15
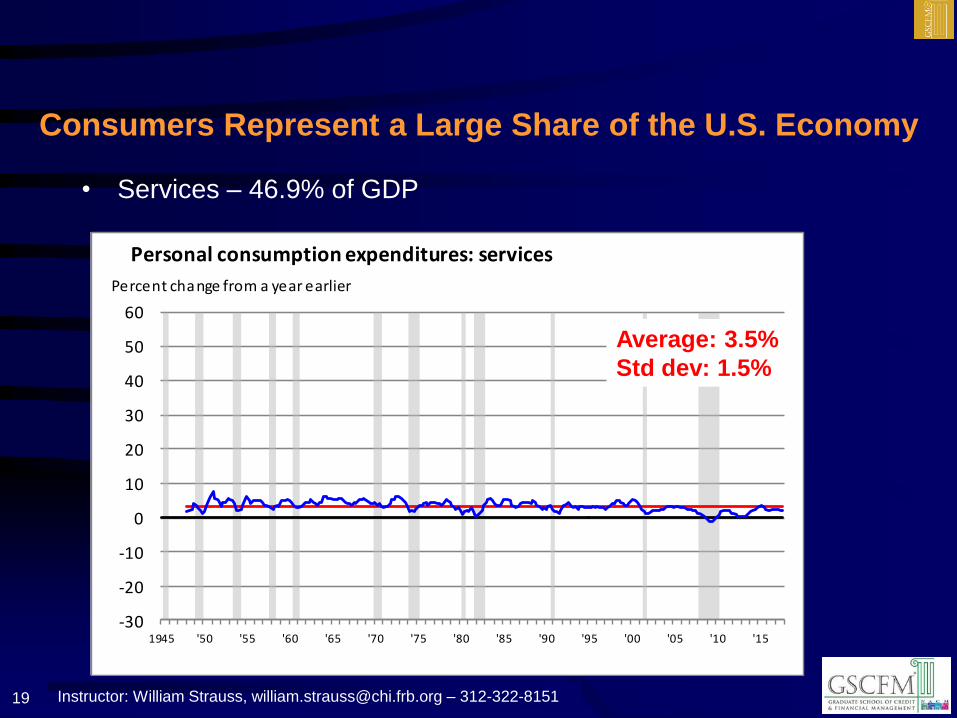
Personal consumption expenditures: services
Percent change from a year earlier
Consumers Represent a Large Share of the U.S. Economy
• Services – 46.9% of GDP
19
Average: 3.5%
Std dev: 1.5%
Instructor: William Strauss, [email protected] – 312-322-8151
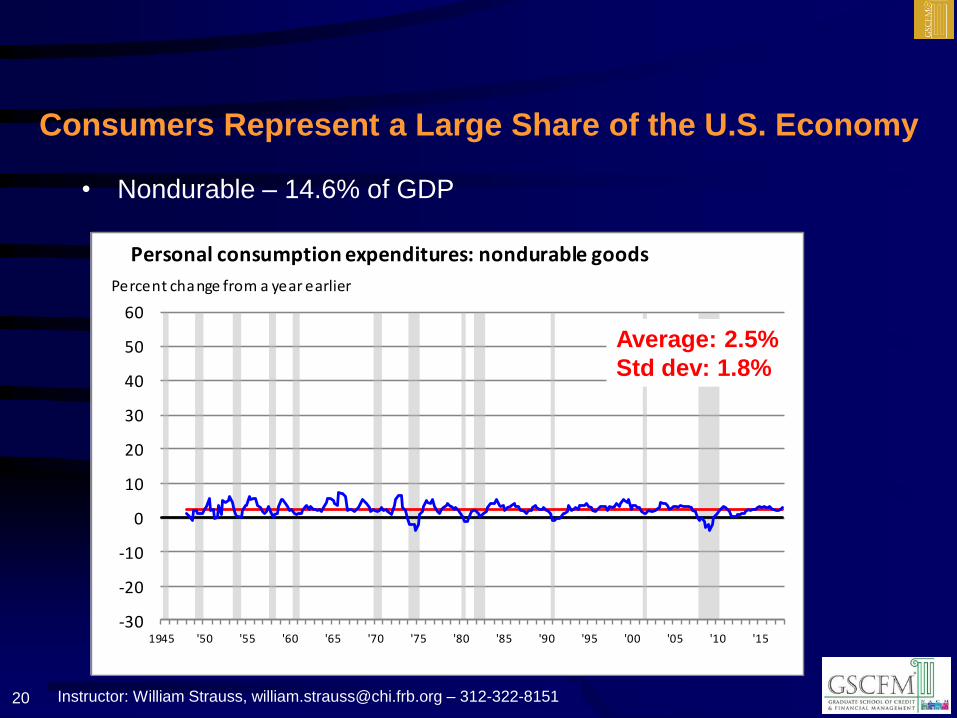
-30
-20
-10
0
10
20
30
40
50
60
1945 '50 '55 '60 '65 '70 '75 '80 '85 '90 '95 '00 '05 '10 '15
Personal consumption expenditures: nondurable goods
Percent change from a year earlier
Consumers Represent a Large Share of the U.S. Economy
• Nondurable – 14.6% of GDP
20
Average: 2.5%
Std dev: 1.8%
Instructor: William Strauss, [email protected] – 312-322-8151
-30
-20
-10
0
10
20
30
40
50
60
1945 '50 '55 '60 '65 '70 '75 '80 '85 '90 '95 '00 '05 '10 '15
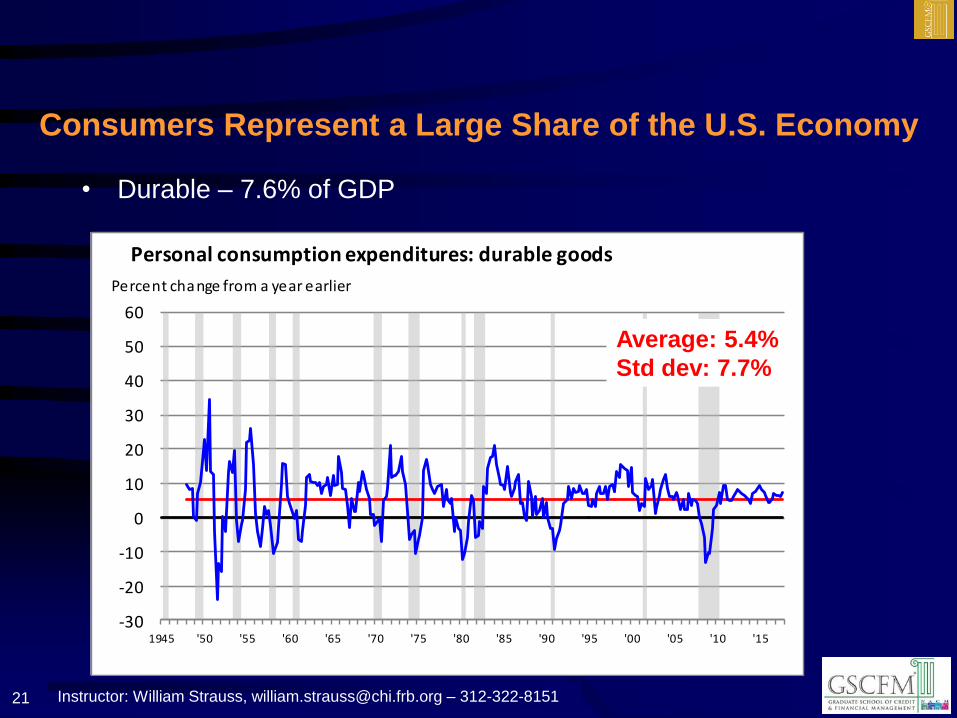
Personal consumption expenditures: durable goods
Percent change from a year earlier
Consumers Represent a Large Share of the U.S. Economy
• Durable – 7.6% of GDP
21
Average: 5.4%
Std dev: 7.7%
Instructor: William Strauss, [email protected] – 312-322-8151
-30
-20
-10
0
10
20
30
40
50
60
1945 '50 '55 '60 '65 '70 '75 '80 '85 '90 '95 '00 '05 '10 '15
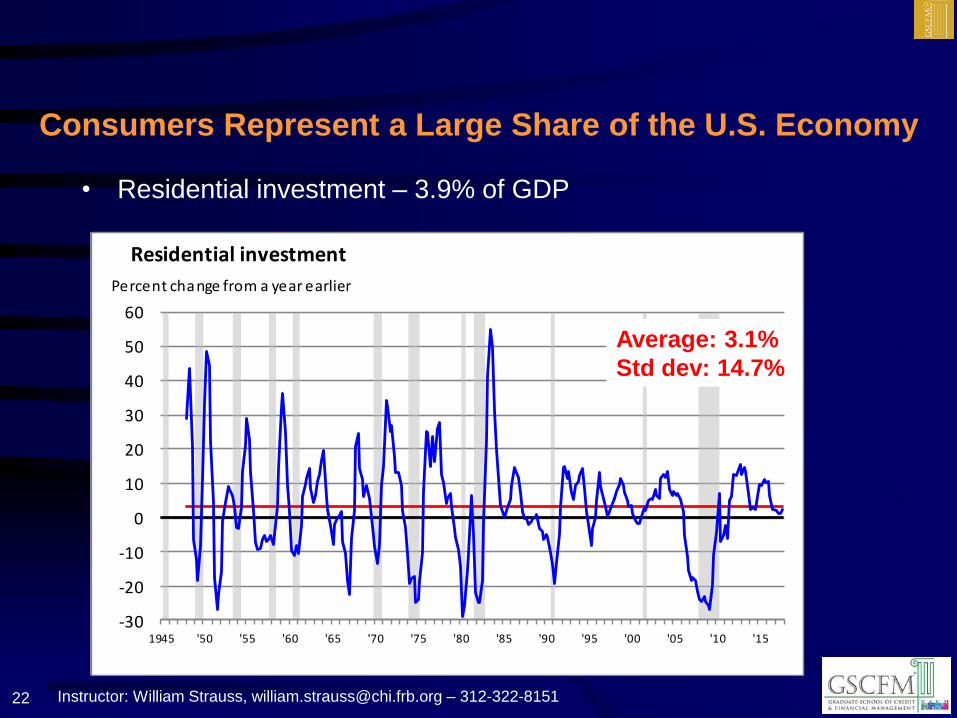
Residential investment
Percent change from a year earlier
Consumers Represent a Large Share of the U.S. Economy
• Residential investment – 3.9% of GDP
22
Average: 3.1%
Std dev: 14.7%
Instructor: William Strauss, [email protected] – 312-322-8151
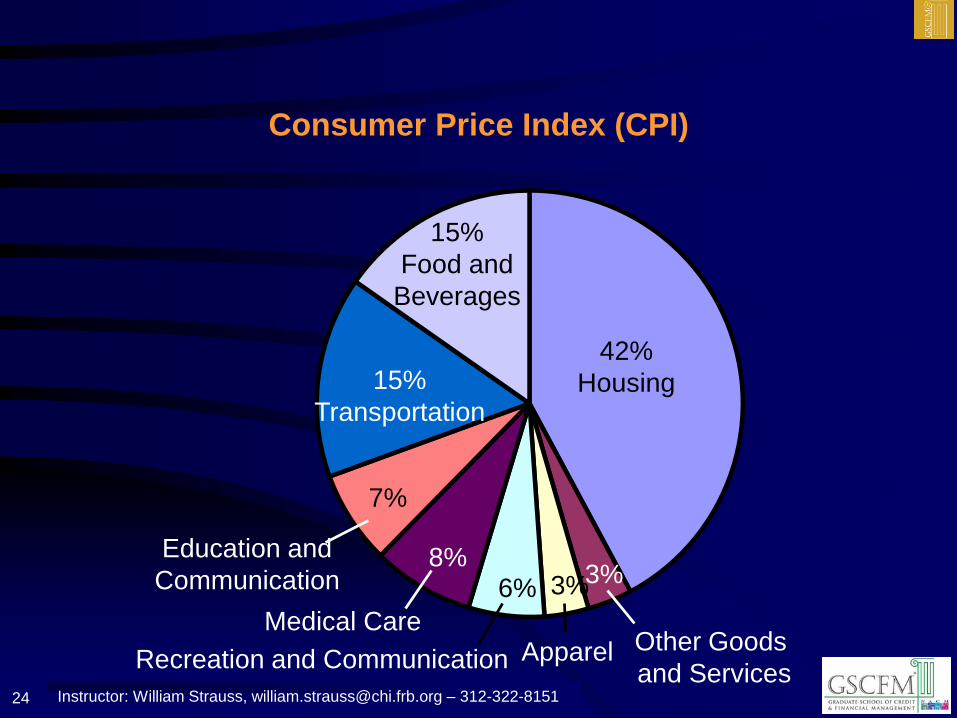
Consumer Price Index (CPI)
• Consumer Price Index (CPI)
– A measure is a measure of the overall cost of the goods and
services bought by a typical consumer
– The Bureau of Labor Statistics (BLS) reports the CPI each month
– The BLS identifies a market basket of goods and services the
typical consumer buys
23
Instructor: William Strauss, [email protected] – 312-322-8151
Consumer Price Index (CPI)
24
42%
Housing
Other Goods
and Services
3%3%
Apparel
6%
Recreation and Communication
Medical Care
8%
7%
Education and
Communication
15%
Transportation
15%
Food and
Beverages

Instructor: William Strauss, [email protected] – 312-322-8151
Consumer Price Index (CPI)
• Find the prices of each of the goods and services in the basket for
each point in time
• Use the data on prices to calculate the cost of the basket of goods
and services at different times
• Designate one year as the base year, making it the benchmark
against which other years are compared.
• Compute the index by dividing the price of the basket in one year by
the price in the base year and multiplying by 100
25
Consumer price index =Price of basket of goods and services
Price of basket in base year
× 100
Instructor: William Strauss, [email protected] – 312-322-8151
Consumer Price Index (CPI)
• It is used to monitor changes in the cost of living over time
• When the CPI rises, the typical family has to spend more dollars to
maintain the same standard of living
• Allows comparisons of dollar amounts over time
• Adjust many contracts for inflation (“COLAs”)
– Primary reason why the top-line CPI is not revised
26
Instructor: William Strauss, [email protected] – 312-322-8151
Consumer Price Index (CPI)
• The CPI is an accurate measure of the selected goods that make up
the typical bundle, but it is not a perfect measure of the cost of living
– Your cost living can vary independently of any change in the CPI
• Substitution bias
– The basket does not change to reflect consumer reaction to
changes in relative prices
• Consumers substitute toward goods that have become
relatively less expensive
• The index overstates the increase in cost of living by not
considering consumer substitution
27
Instructor: William Strauss, [email protected] – 312-322-8151
Consumer Price Index (CPI)
• Introduction of new goods
– The basket does not reflect the change in purchasing power
brought on by the introduction of new products
• New products result in greater variety, which in turn makes
each dollar more valuable
• Consumers need fewer dollars to maintain any given standard
of living
• Unmeasured quality changes
– If the quality of a good rises from one year to the next, the value of
a dollar rises, even if the price of the good stays the same
– If the quality of a good falls from one year to the next, the value of
a dollar falls, even if the price of the good stays the same
– The BLS tries to adjust the price for constant quality, but such
differences are hard to measure
28
Instructor: William Strauss, [email protected] – 312-322-8151
Inflation versus Deflation
• Inflation is a rise in the general price level
– It is not the increase in a particular good
– Inflation occurs when demand exceeds supply at current prices
and prices are bid up
– Inflation rises due to “too many dollars chasing too few goods”
– When an economy’s growth exceeds its potential (long-run)
growth inflation tends to rise
– When an economy’s growth is below its potential growth,
creating slack in the economy, inflation tends to fall (disinflation)
• Deflation is a decline in the general price level
– Occurs during times of extreme weakness in the economy or
during times of extreme constraint in the amount of money
29
Instructor: William Strauss, [email protected] – 312-322-8151
Employment
• Current Employment Statistics (CES)
– Establishment Survey
• Each month the CES program surveys approximately
144,000 businesses and government agencies, representing
approximately 554,000 individual worksites
– Provides detailed industry data on employment, hours,
and earnings of workers on nonfarm payrolls
30
Instructor: William Strauss, [email protected] – 312-322-8151
Employment
• Current Population Survey (CPS)
– Household Survey
• The CPS is a monthly survey of approximately 60,000
households conducted by the Bureau of Census for the
Bureau of Labor Statistics
– Provides a comprehensive body of data on the labor force,
employment, unemployment, persons not in the labor
force, hours of work, earnings, and other demographic and
labor force characteristics
31

Instructor: William Strauss, [email protected] – 312-322-8151
Employment
32
0
20
40
60
80
100
120
140
160
1950 '55 '60 '65 '70 '75 '80 '85 '90 '95 '00 '05 '10 '15
Employment (Establishment Survey)
mil lions
-6
-4
-2
0
2
4
6
8
10
1950 '55 '60 '65 '70 '75 '80 '85 '90 '95 '00 '05 '10 '15
Employment (Establishment Survey)
percent change from a year earlier
0
20
40
60
80
100
120
140
160
180
1950 '55 '60 '65 '70 '75 '80 '85 '90 '95 '00 '05 '10 '15
Employment (Household Survey)
mil lions
-6
-4
-2
0
2
4
6
8
10
1950 '55 '60 '65 '70 '75 '80 '85 '90 '95 '00 '05 '10 '15
Employment (Household Survey)
percent change from a year earlier
Instructor: William Strauss, [email protected] – 312-322-8151
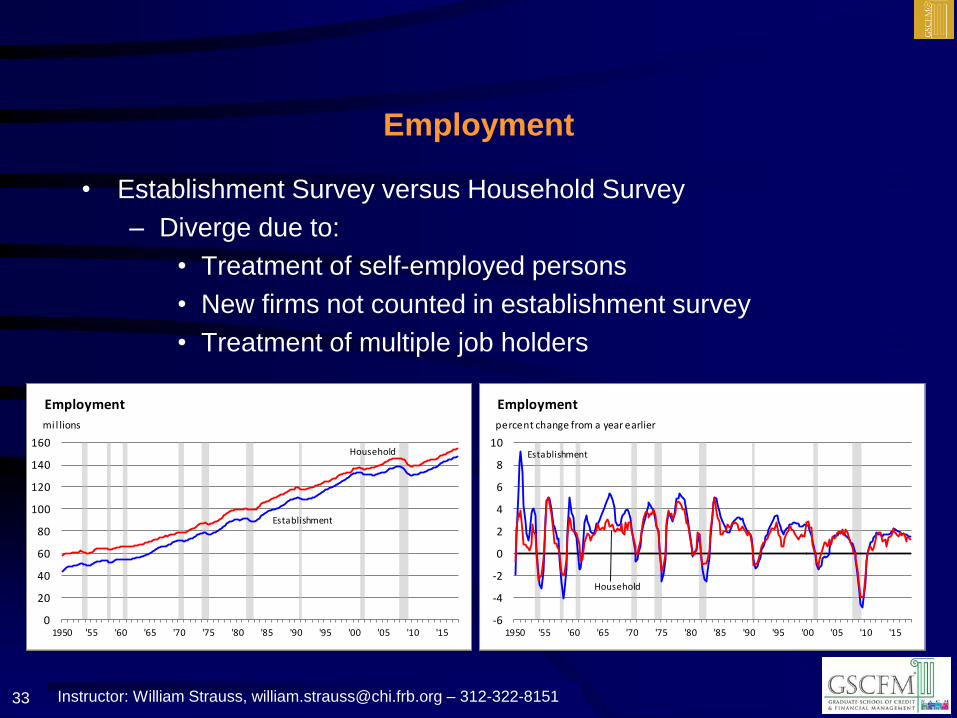
Employment
• Establishment Survey versus Household Survey
– Diverge due to:
• Treatment of self-employed persons
• New firms not counted in establishment survey
• Treatment of multiple job holders
33
0
20
40
60
80
100
120
140
160
1950 '55 '60 '65 '70 '75 '80 '85 '90 '95 '00 '05 '10 '15
Employment
mil lions
Household
Establishment
-6
-4
-2
0
2
4
6
8
10
1950 '55 '60 '65 '70 '75 '80 '85 '90 '95 '00 '05 '10 '15
Employment
percent change from a year earlier
Establishment
Household
Instructor: William Strauss, [email protected] – 312-322-8151
Employment
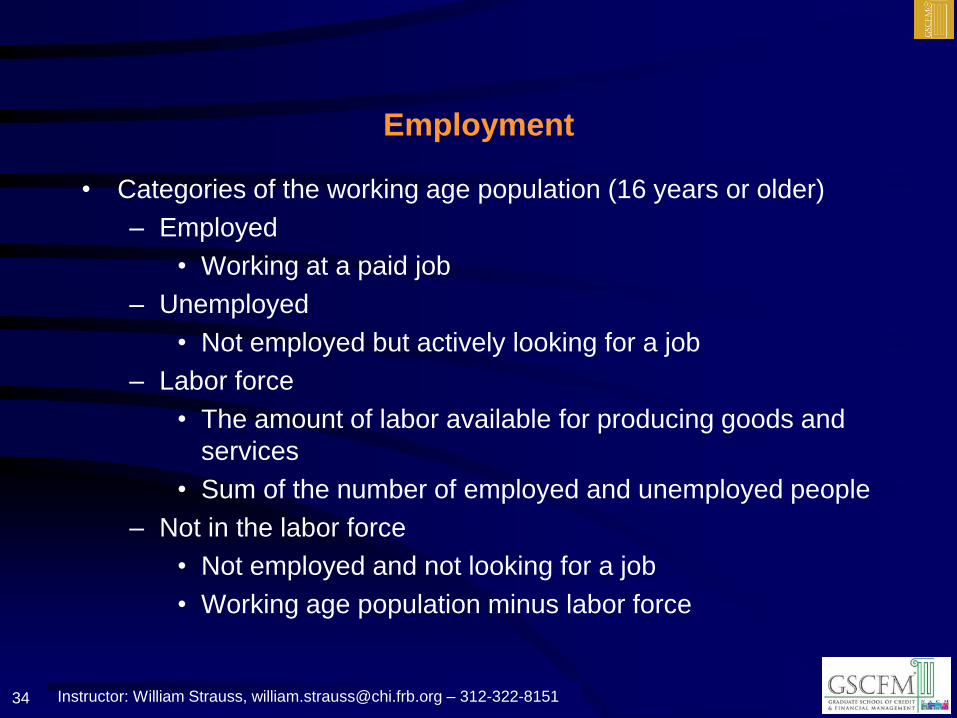
• Categories of the working age population (16 years or older)
– Employed
• Working at a paid job
– Unemployed
• Not employed but actively looking for a job
– Labor force
• The amount of labor available for producing goods and
services
• Sum of the number of employed and unemployed people
– Not in the labor force
• Not employed and not looking for a job
• Working age population minus labor force
34
Instructor: William Strauss, [email protected] – 312-322-8151
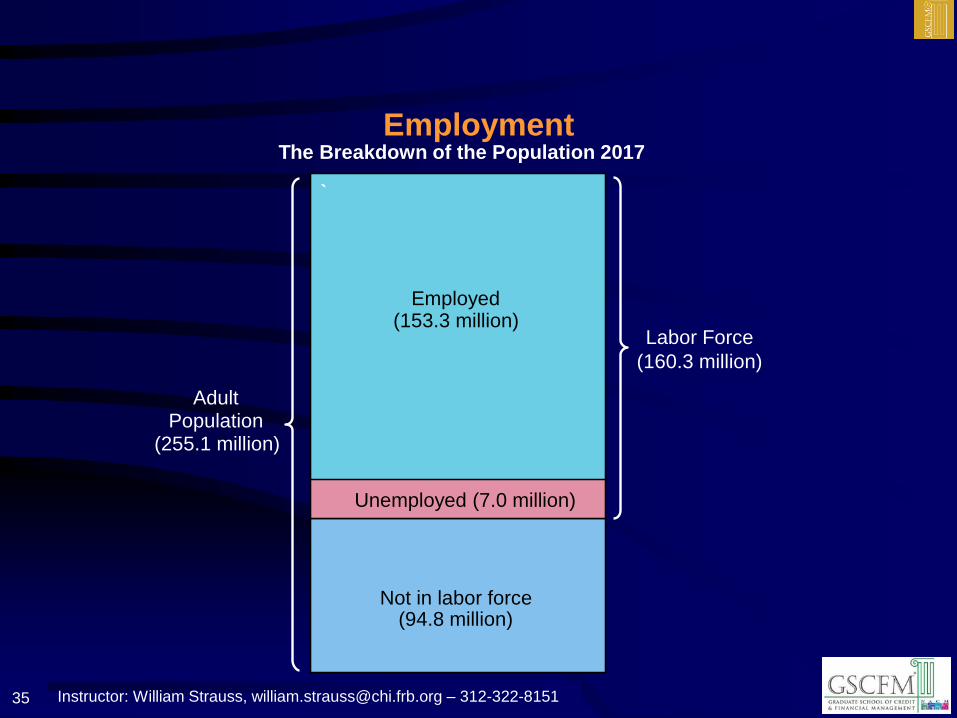
Employment
35
AdultPopulation
(255.1 million)
Labor Force
(160.3 million)
`
Employed(153.3 million)
Not in labor force(94.8 million)
Unemployed (7.0 million)
The Breakdown of the Population 2017
Instructor: William Strauss, [email protected] – 312-322-8151
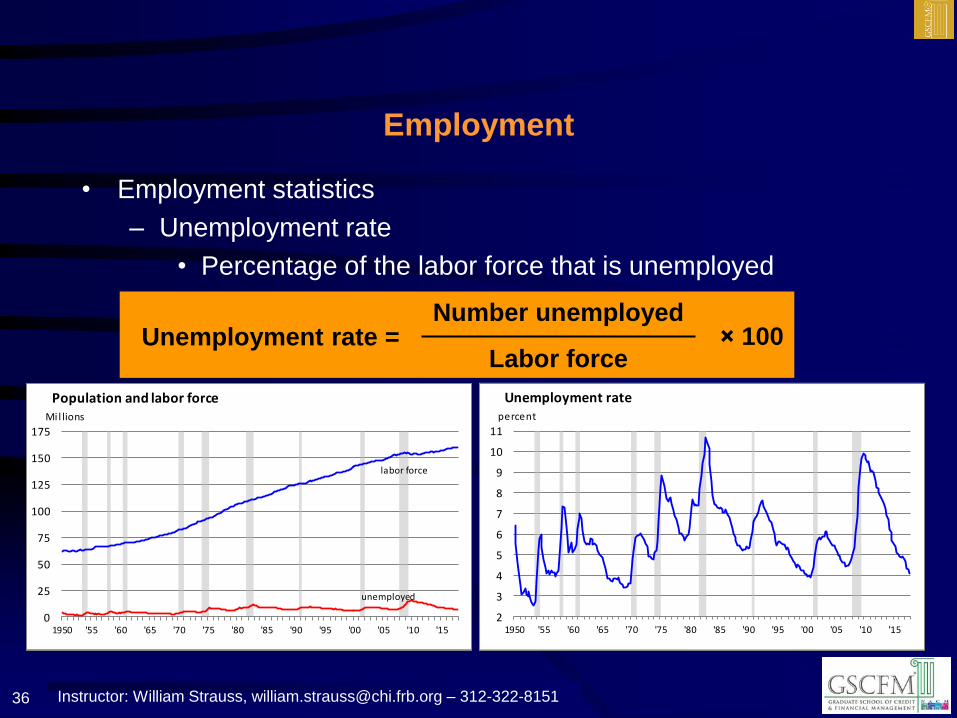
Employment
• Employment statistics
– Unemployment rate
• Percentage of the labor force that is unemployed
36
Unemployment rate =Number unemployed
Labor force× 100
2
3
4
5
6
7
8
9
10
11
1950 '55 '60 '65 '70 '75 '80 '85 '90 '95 '00 '05 '10 '15
Unemployment ratepercent
0
25
50
75
100
125
150
175
1950 '55 '60 '65 '70 '75 '80 '85 '90 '95 '00 '05 '10 '15
Population and labor forceMil lions
labor force
unemployed
Instructor: William Strauss, [email protected] – 312-322-8151
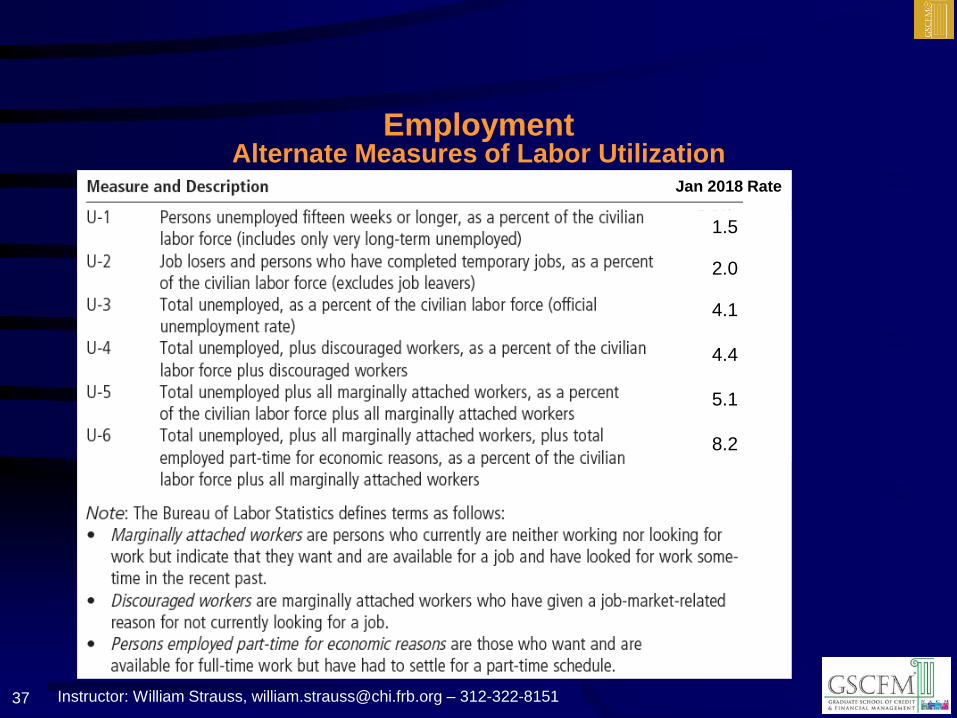
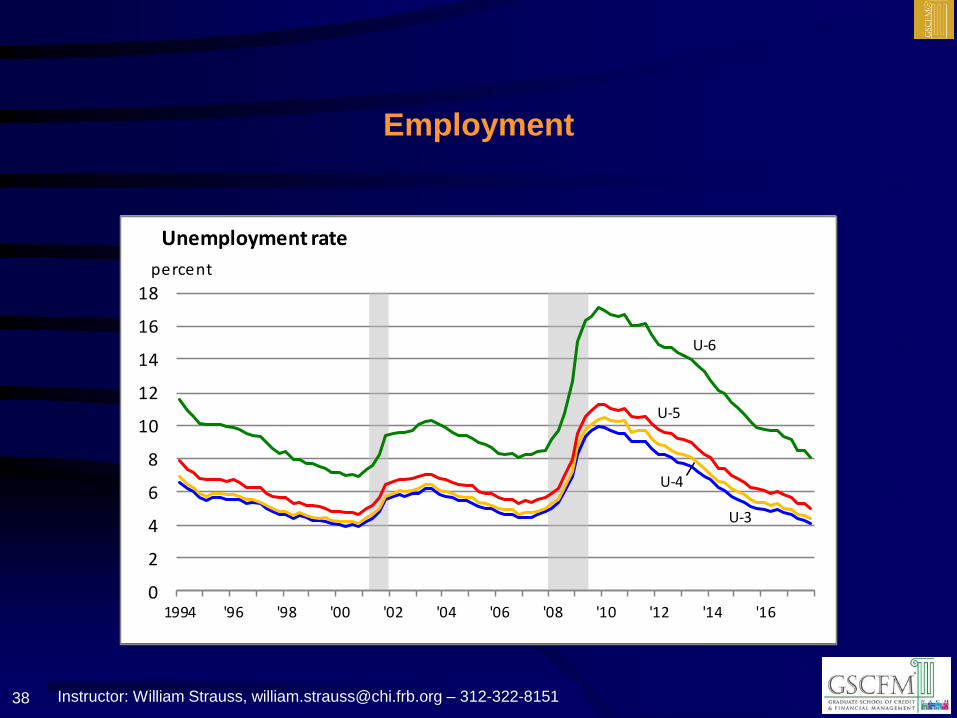
Employment
37
Show chart of unemployment rate
Jan 2018 Rate
1.5
2.0
4.1
4.4
5.1
8.2
Alternate Measures of Labor Utilization
Instructor: William Strauss, [email protected] – 312-322-8151
Employment
38
0
2
4
6
8
10
12
14
16
18
1994 '96 '98 '00 '02 '04 '06 '08 '10 '12 '14 '16
Unemployment rate
percent
U-3
U-6
U-5
U-4
Instructor: William Strauss, [email protected] – 312-322-8151
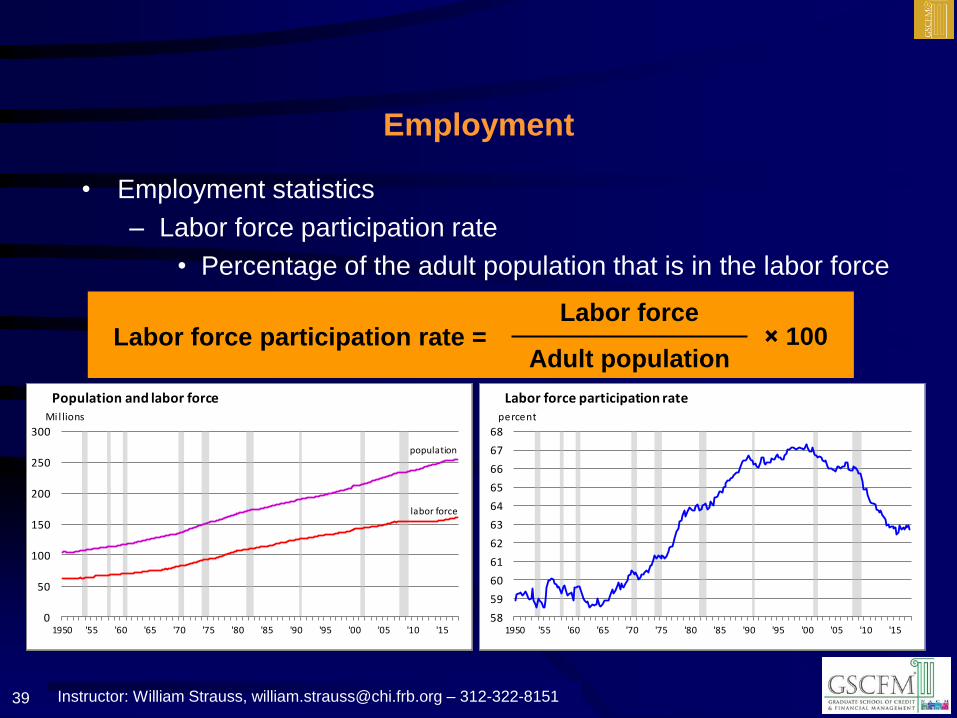
Employment
• Employment statistics
– Labor force participation rate
• Percentage of the adult population that is in the labor force
39
Labor force participation rate = Labor force
Adult population× 100
58
59
60
61
62
63
64
65
66
67
68
1950 '55 '60 '65 '70 '75 '80 '85 '90 '95 '00 '05 '10 '15
Labor force participation ratepercent
0
50
100
150
200
250
300
1950 '55 '60 '65 '70 '75 '80 '85 '90 '95 '00 '05 '10 '15
Population and labor forceMil lions
labor force
population
Instructor: William Strauss, [email protected] – 312-322-8151
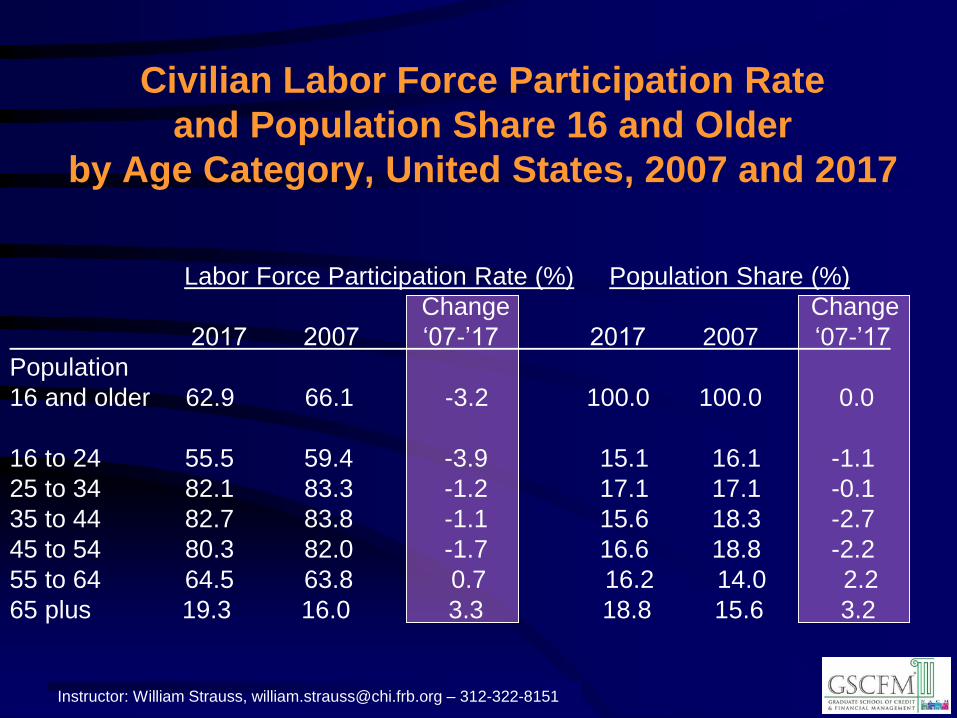
Civilian Labor Force Participation Rate
and Population Share 16 and Older
by Age Category, United States, 2007 and 2017
Labor Force Participation Rate (%) Population Share (%)
Change Change
2017 2007 ‘07-’17 2017 2007 ‘07-’17
Population
16 and older 62.9 66.1 -3.2 100.0 100.0 0.0
16 to 24 55.5 59.4 -3.9 15.1 16.1 -1.1
25 to 34 82.1 83.3 -1.2 17.1 17.1 -0.1
35 to 44 82.7 83.8 -1.1 15.6 18.3 -2.7
45 to 54 80.3 82.0 -1.7 16.6 18.8 -2.2
55 to 64 64.5 63.8 0.7 16.2 14.0 2.2
65 plus 19.3 16.0 3.3 18.8 15.6 3.2
Instructor: William Strauss, [email protected] – 312-322-8151
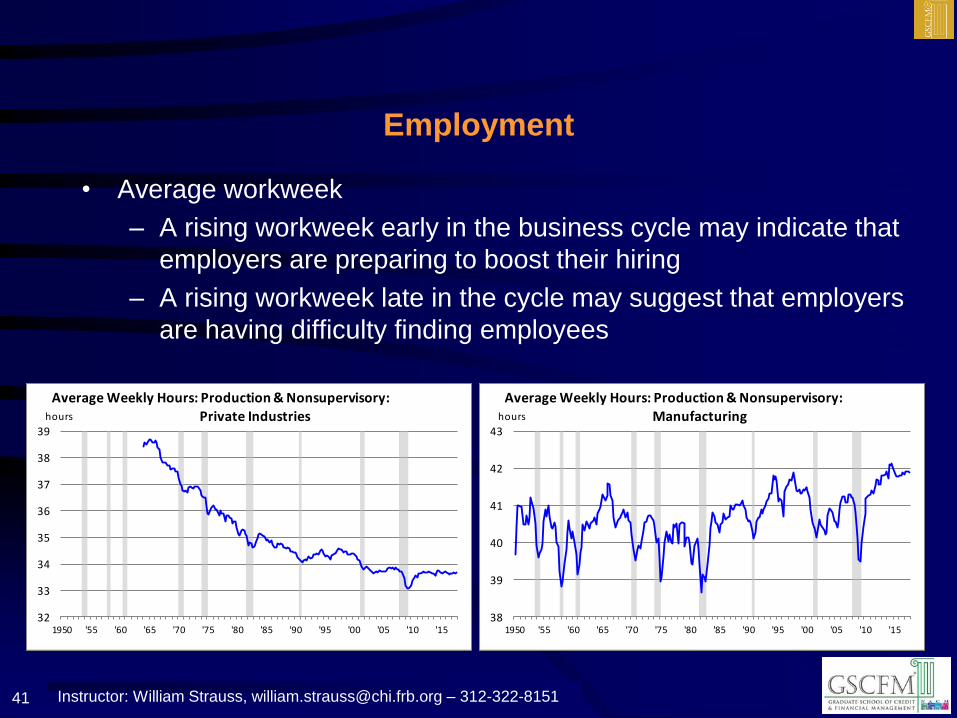
Employment
• Average workweek
– A rising workweek early in the business cycle may indicate that
employers are preparing to boost their hiring
– A rising workweek late in the cycle may suggest that employers
are having difficulty finding employees
41
32
33
34
35
36
37
38
39
1950 '55 '60 '65 '70 '75 '80 '85 '90 '95 '00 '05 '10 '15
Average Weekly Hours: Production & Nonsupervisory:
Private Industrieshours
38
39
40
41
42
43
1950 '55 '60 '65 '70 '75 '80 '85 '90 '95 '00 '05 '10 '15
Average Weekly Hours: Production & Nonsupervisory:
Manufacturinghours
Instructor: William Strauss, [email protected] – 312-322-8151
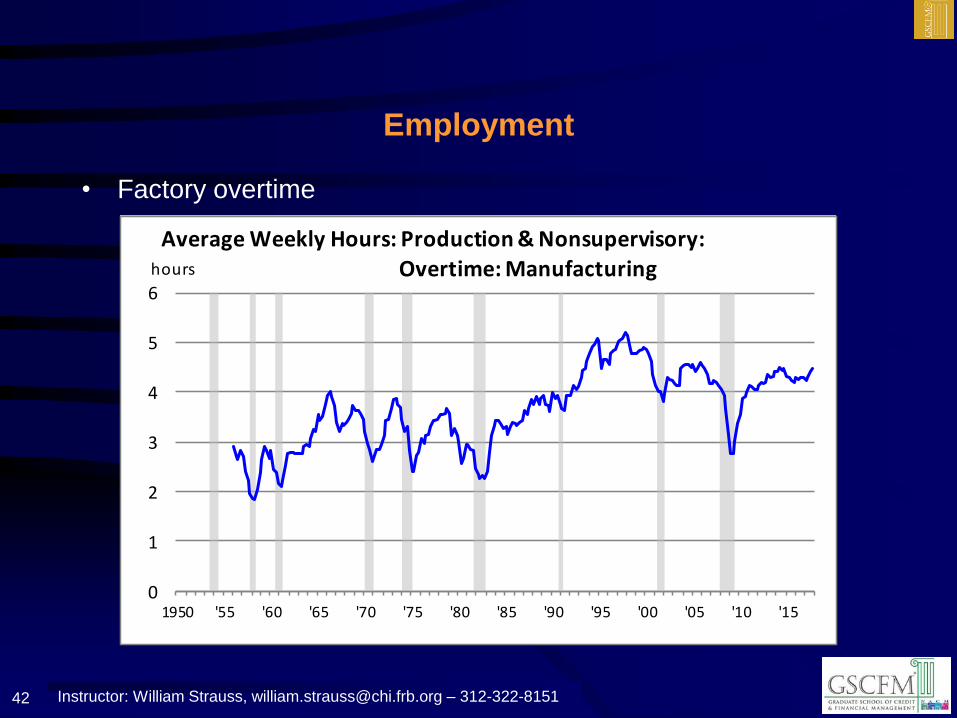
Employment
• Factory overtime
42
0
1
2
3
4
5
6
1950 '55 '60 '65 '70 '75 '80 '85 '90 '95 '00 '05 '10 '15
Average Weekly Hours: Production & Nonsupervisory:
Overtime: Manufacturinghours
Instructor: William Strauss, [email protected] – 312-322-8151
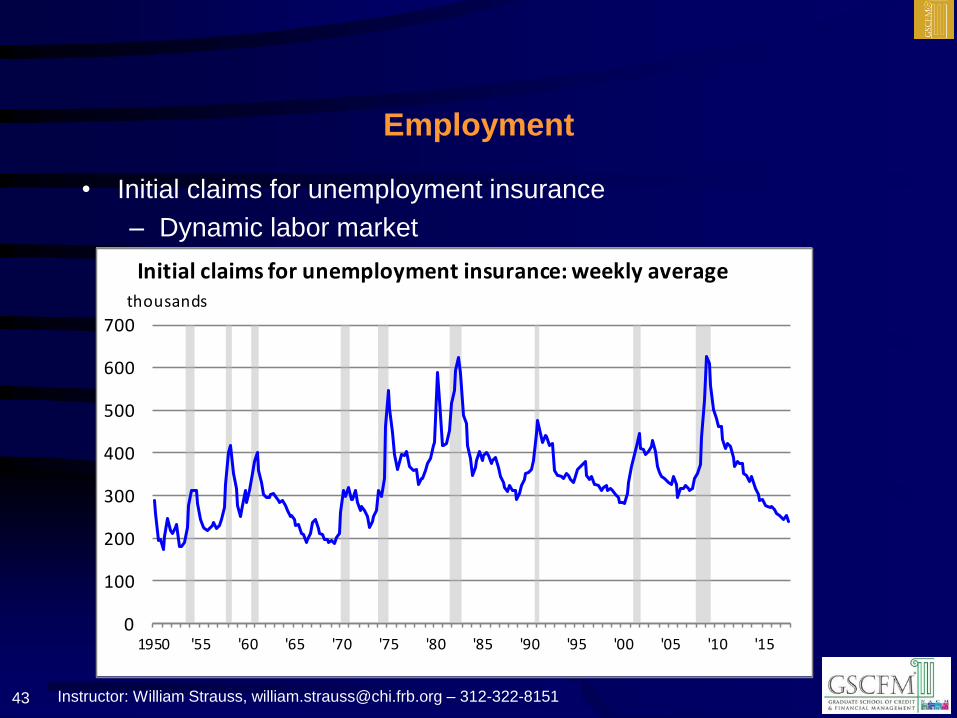
Employment
• Initial claims for unemployment insurance
– Dynamic labor market
43
0
100
200
300
400
500
600
700
1950 '55 '60 '65 '70 '75 '80 '85 '90 '95 '00 '05 '10 '15
Initial claims for unemployment insurance: weekly averagethousands
Instructor: William Strauss, [email protected] – 312-322-8151
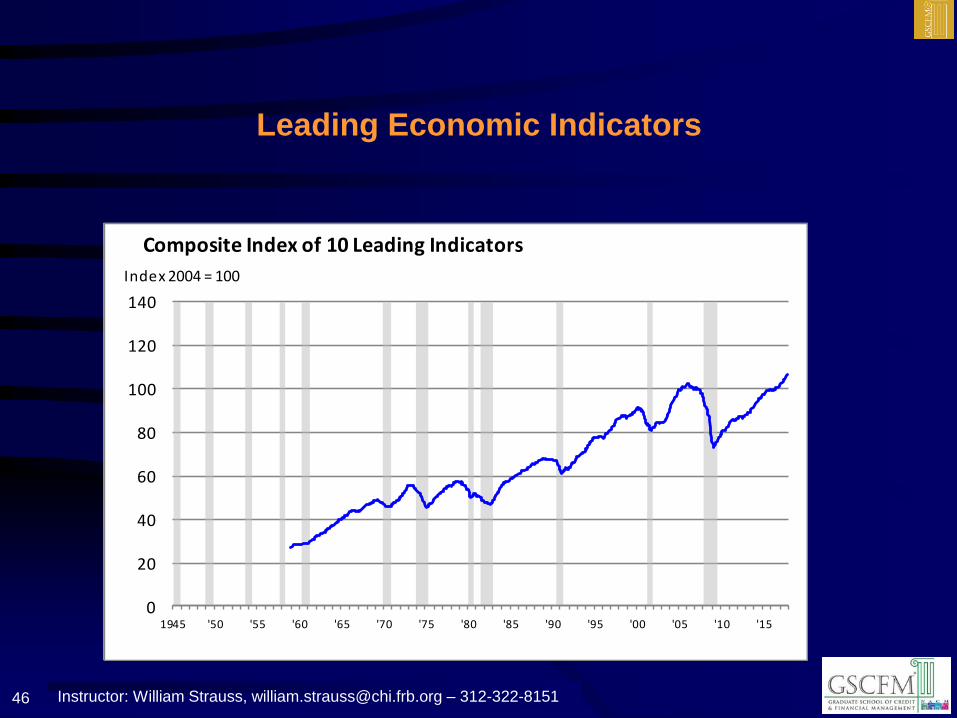
Leading Economic Indicators
• Directional changes in economic data tend to either lead, lag or
coincidently change with movements of the overall economy
• A leading economic indicator is an economic data series that changes
direction ahead of a directional change in the overall economy
• When you group several different series together, combining them
into an index (weighting by the importance each series offers to
explaining changes in the overall economy), you have created an
Index of leading economic indicators
• The Conference Board has created the most cited Leading Economic
Index
• They also create a Coincident Economic Index and a Lagging
Economic Index
44
Instructor: William Strauss, [email protected] – 312-322-8151
Leading Economic Indicators
• The ten series that comprise the Leading Economic Index:
1) Average weekly hours, manufacturing
2) Average weekly initial claims for unemployment insurance
3) Manufacturers’ new orders, consumer goods and materials
4) ISM® Index of New Orders
5) Manufacturers' new orders, nondefense capital goods excluding
aircraft orders
6) Building permits, new private housing units
7) Stock prices, 500 common stocks
8) Leading Credit Index™
9) Interest rate spread, 10-year Treasury bonds less federal funds
10) Average consumer expectations for business conditions
45
Instructor: William Strauss, [email protected] – 312-322-8151
Leading Economic Indicators
46
0
20
40
60
80
100
120
140
1945 '50 '55 '60 '65 '70 '75 '80 '85 '90 '95 '00 '05 '10 '15
Composite Index of 10 Leading Indicators
Index 2004 = 100
Instructor: William Strauss, [email protected] – 312-322-8151
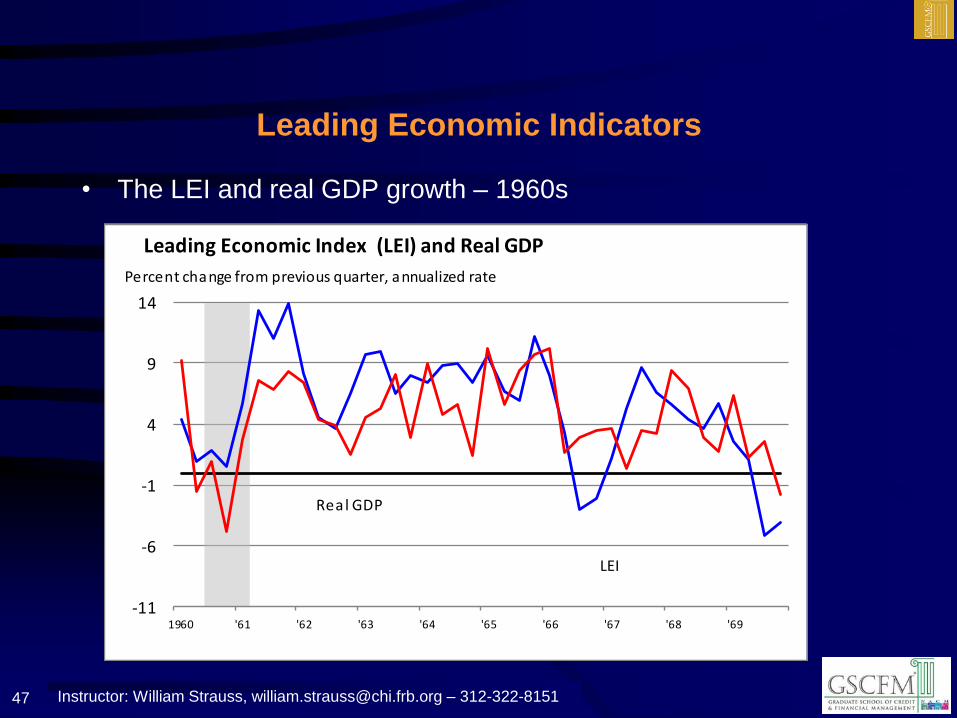
Leading Economic Indicators
• The LEI and real GDP growth – 1960s
47
-11
-6
-1
4
9
14
1960 '61 '62 '63 '64 '65 '66 '67 '68 '69
Leading Economic Index (LEI) and Real GDP
Percent change from previous quarter, annualized rate
LEI
Real GDP
Instructor: William Strauss, [email protected] – 312-322-8151
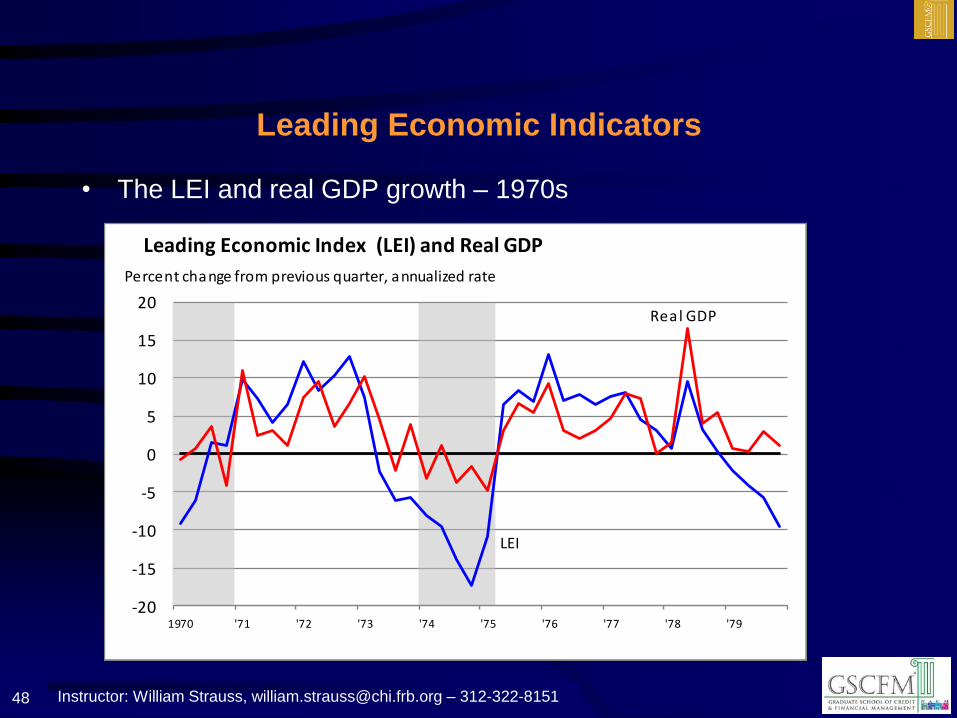
Leading Economic Indicators
• The LEI and real GDP growth – 1970s
48
-20
-15
-10
-5
0
5
10
15
20
1970 '71 '72 '73 '74 '75 '76 '77 '78 '79
Leading Economic Index (LEI) and Real GDP
Percent change from previous quarter, annualized rate
LEI
Real GDP
Instructor: William Strauss, [email protected] – 312-322-8151
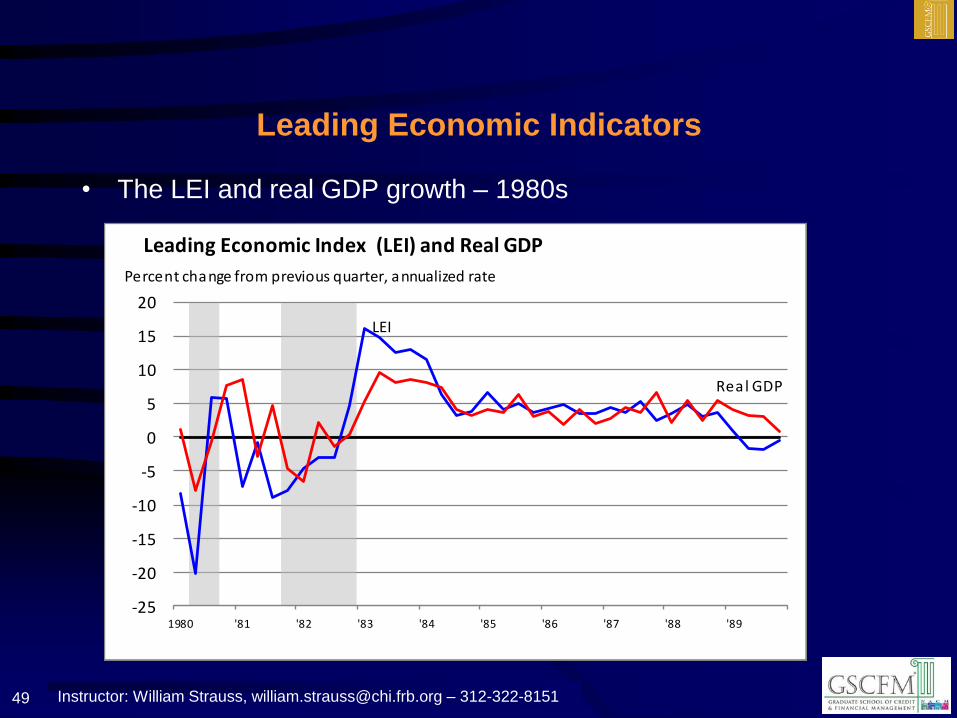
Leading Economic Indicators
• The LEI and real GDP growth – 1980s
49
-25
-20
-15
-10
-5
0
5
10
15
20
1980 '81 '82 '83 '84 '85 '86 '87 '88 '89
Leading Economic Index (LEI) and Real GDP
Percent change from previous quarter, annualized rate
LEI
Real GDP
Instructor: William Strauss, [email protected] – 312-322-8151
Leading Economic Indicators
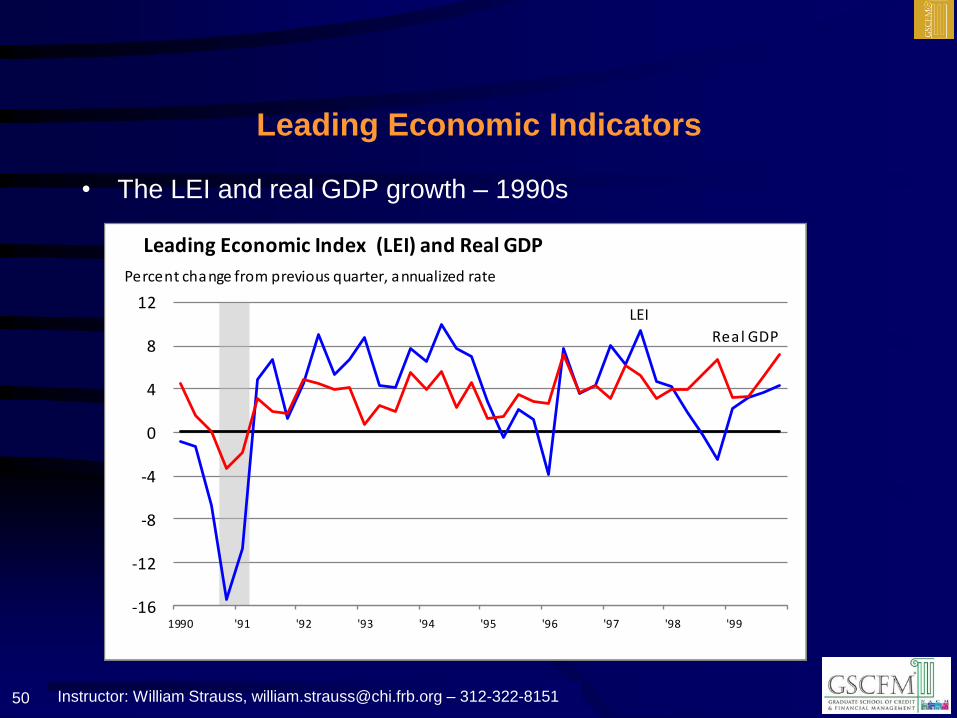
• The LEI and real GDP growth – 1990s
50
-16
-12
-8
-4
0
4
8
12
1990 '91 '92 '93 '94 '95 '96 '97 '98 '99
Leading Economic Index (LEI) and Real GDP
Percent change from previous quarter, annualized rate
LEI
Real GDP
Instructor: William Strauss, [email protected] – 312-322-8151
Leading Economic Indicators
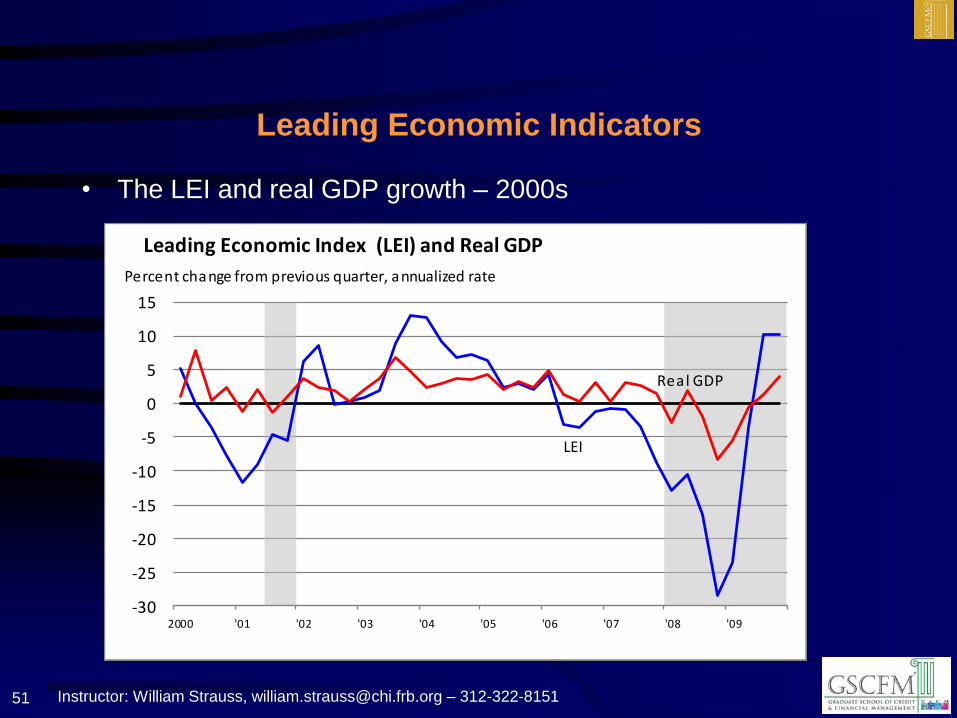
• The LEI and real GDP growth – 2000s
51
-30
-25
-20
-15
-10
-5
0
5
10
15
2000 '01 '02 '03 '04 '05 '06 '07 '08 '09
Leading Economic Index (LEI) and Real GDP
Percent change from previous quarter, annualized rate
LEI
Real GDP
Instructor: William Strauss, [email protected] – 312-322-8151
Leading Economic Indicators
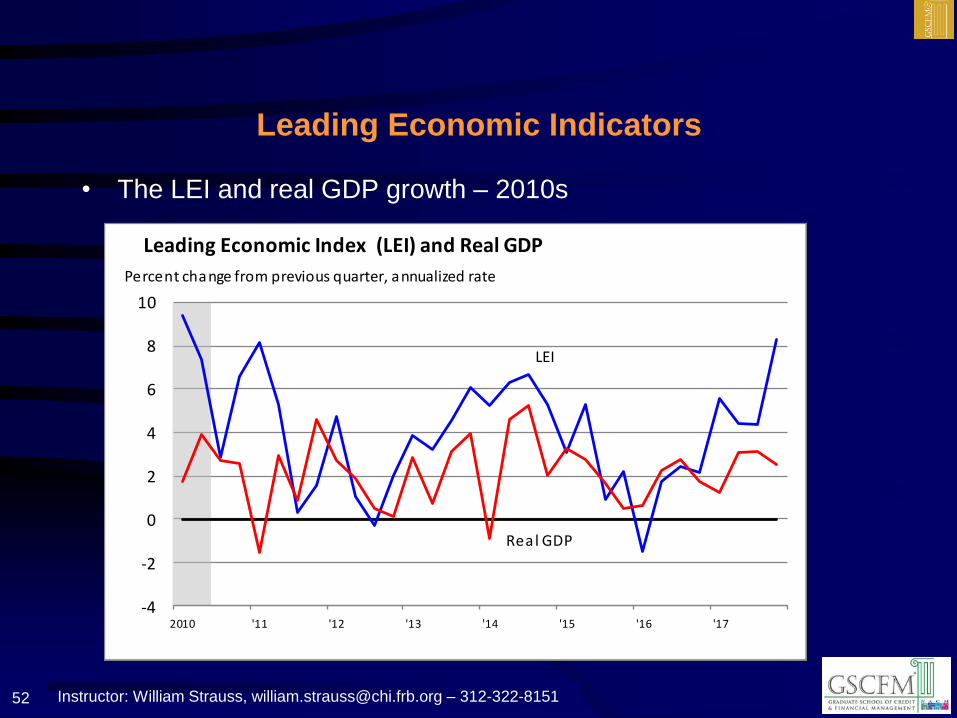
• The LEI and real GDP growth – 2010s
52
-4
-2
0
2
4
6
8
10
2010 '11 '12 '13 '14 '15 '16 '17
Leading Economic Index (LEI) and Real GDP
Percent change from previous quarter, annualized rate
LEI
Real GDP
Instructor: William Strauss, [email protected] – 312-322-8151
Activity Index
• An activity index is an econometric model (often times based on
methodology developed by James Stock of Harvard University and
Mark Watson of Princeton University)
• The idea behind the Stock-Watson approach is that there is some
factor common to all of the various inflation indicators, and it is
this common factor, or index, that is useful for predicting inflation
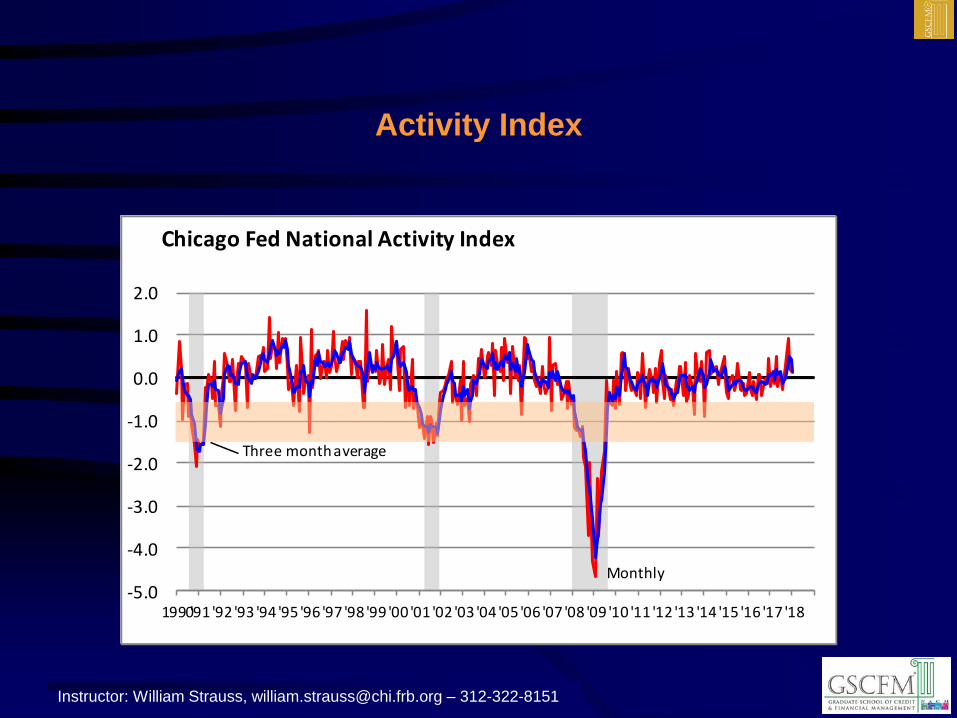
• The Chicago Fed National Activity Index (CFNAI ) is a weighted
average of 85 monthly indicators of national economic activity
• It is constructed to have an average value of zero and a standard
deviation of one
– A positive index reading corresponds to growth above trend and a
negative index reading corresponds to growth below trend
53
Instructor: William Strauss, [email protected] – 312-322-8151
Activity Index
• The 85 economic indicators that are included in the CFNAI are drawn
from four broad categories of data
1) Production and income
2) Employment, unemployment, and hours
3) Personal consumption and housing
4) Sales, orders, and inventories.
• Research has found that the CFNAI provides a useful gauge on
current and future economic activity and inflation in the United States
54
Instructor: William Strauss, [email protected] – 312-322-8151
-5.0
-4.0
-3.0
-2.0
-1.0
0.0
1.0
2.0
1990'91 '92 '93 '94 '95 '96 '97 '98 '99 '00 '01 '02 '03 '04 '05 '06 '07 '08 '09 '10 '11 '12 '13 '14 '15 '16 '17 '18
Monthly
Chicago Fed National Activity Index
Three month average
Activity Index

Instructor: William Strauss, [email protected] – 312-322-8151
Summary
• Labor productivity and Unit Labor Costs
• Producer Price Index
• Cost/Price Dynamics in the Business Cycle
• Business Capital Expenditures
• Inventories
• Consumers represent a large share of the U.S. Economy
• Consumer Price Index (CPI)
• Inflation versus deflation
• Employment
• Leading Economic Indicators
• Activity Index
56