midtown bus master planning update€¦ · midtown bus master planning update ... • funding of...
TRANSCRIPT
Midtown Bus Master Planning Update Public Session March 19, 2015

Midtown Bus Master Planning Update
• Planning team has been at work for a year and a half.
• Addresses trans-Hudson buses today and into 2040.
• Includes commuter buses from NJ, NY, and PA and intercity buses (which are non-commuter buses traveling longer distances).
• Consultant team: • Kohn Pedersen Fox Associates (Architects) • Parsons Brinckerhoff (Engineering) • Skanska (Construction Staging) • Thornton Tomasetti (Structural Engineering) • VJ Associates (Estimating)
2

Goals for Bus Master Planning
• Improve customer experience • Increase capacity and operational efficiency • Modernize terminal • Reduce neighborhood impacts • Develop funding and phasing strategies • Strengthen role of buses as most flexible, resilient link in
trans-Hudson network
3

Major Issues at the PABT
• Quality of service – lines, delays, reliability. • Current peak demand exceeds capacity and spills over onto city
streets. • Queuing buses affect air quality and generate traffic congestion. • Operating deficit of over $100 million per year.
4

Major Issues at the PABT
• The structural slabs supporting bus operations will need to be replaced in 15-25 years.
• Addressing structural issues requires replacing the terminal.
• Terminal was not built for taller, longer, heavier modern buses.
• Inadequate bus parking, staging, circulation space.
5

Early Actions in Place
PABT $90 million Quality of Commute Improvement Program
• Improved Trip Reliability/Reduced Terminal Crowding
• Improved Communications
• Improved Terminal Conditions
6
May 29, 2014 @5:52 PM October 29, 2014 @5:47 PM
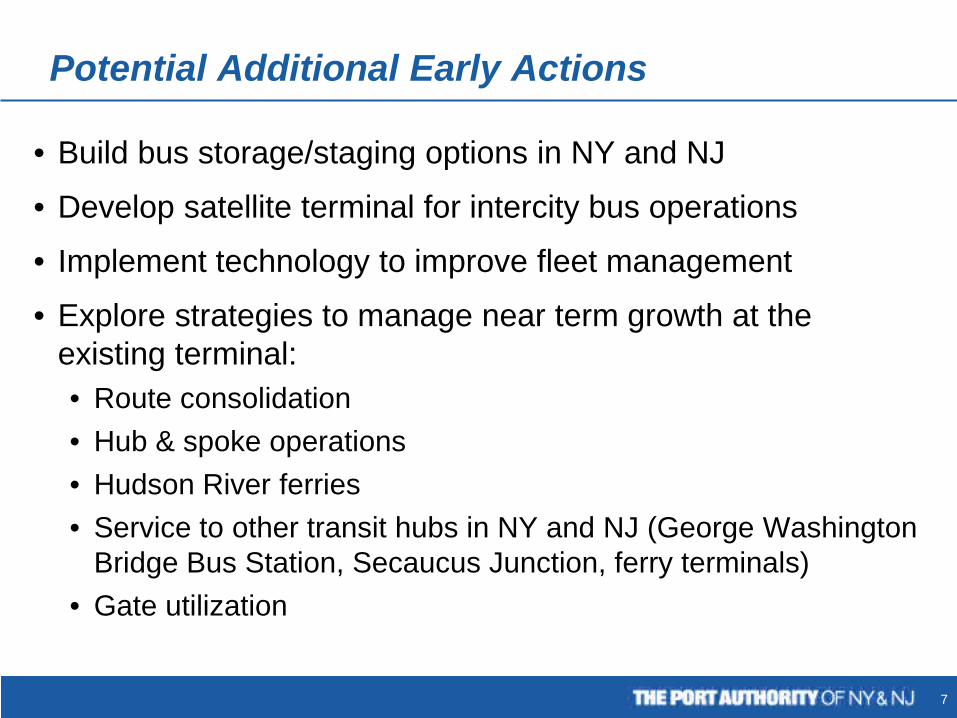
Potential Additional Early Actions
• Build bus storage/staging options in NY and NJ
• Develop satellite terminal for intercity bus operations
• Implement technology to improve fleet management
• Explore strategies to manage near term growth at the existing terminal: • Route consolidation • Hub & spoke operations • Hudson River ferries • Service to other transit hubs in NY and NJ (George Washington
Bridge Bus Station, Secaucus Junction, ferry terminals) • Gate utilization
7

Why not rehabilitate the existing PABT?
• Impractical to keep the PABT operational during a phased rehabilitation of the bus level floor slabs.
• Meeting code and accessibility requirements would reduce capacity below current levels.
• Expansion required to address lost capacity, current deficiencies and growing demand.
• Major capital investment needed over the next 25 years to keep the PABT in operation without addressing structural slabs and without expanding capacity.
8

Midtown Bus Master Planning Update
• Building blocks for the plan: • Population and employment projections • Travel demand forecasts in coordination with NJ Transit • Interviews with bus operators, bus passenger surveys • Requirements for bus gates, staging, parking, passenger circulation • Survey of West Midtown properties
• 20 initial alternatives screened down to 5 working concepts. • Developed construction staging and cost estimates. • Work is in progress. Additional alternatives are being
analyzed and must be reviewed by stakeholders before the Port Authority and our regional partners settle on a course of action.
9

Growing Demand
Source: NYMTC Hub Bound Travel Report
Trans-Hudson Travel, Manhattan below 60th St.
10

Major Manhattan Transit Terminals
11

Importance of the Trans-Hudson Bus System
• Over 115,000 west of Hudson residents commute via bus to jobs in Manhattan.
• They collectively earn $9.5 billion a year, supporting economic activity equivalent to 3% of NJ’s economy.
• More than 8,000 NYC residents commute by bus to jobs west of the Hudson.
• Access to expanding West of Hudson workforce is critical to NYC’s competitiveness as an office location.
• The PABT is a resilient regional lifeline when the rail system is disrupted.
12

Forecasted PABT Passenger Growth 2011-2040
PM Peak: + 9%
to +18%
PM Peak: + 16%
to +29%
Up to 270,000 passengers
daily by 2020
Up to 294,000 passengers
daily by 2030
Up to 337,000 passengers
daily by 2040
PM Peak: + 35%
to +51%
13
232,000 passengers daily in 2011

Magnitude of New Facilities
• 2040 projections indicate up to 42,000 passengers in the PM peak hour, up from 28,000 today. The facility must handle the seating capacity of the Mets’ Citi Field ballpark each peak hour.
• 1,000 27-ton buses per hour in the PM peak, up from 770 today. Placed end to end, these buses would stretch over 8½ miles.
• Accommodating these buses requires one of the largest, most complex transit terminals in the country – 5 levels of terminal, ramps, staging, and parking covering 3½ city blocks and bridging streets and active tunnel portals.
14

Planning, Design, Environ-mental Review,
Permitting, Financing (6 years)
Build bus annex west of the PABT
with temporary terminal
functionality (4 years)
Relocate bus operations
on temporary basis to bus annex, the GWB Bus
Station, and other
locations
Demolish PABT and
build replacement
(4 years)
Open new terminal and convert bus
annex to staging/
storage use (1 year)
Possible Project Timeline and Staging Approach
15
15 years to design, approve, finance, and build

Concept Review: Concept 1
16
• Largest terminal – sufficient to serve all projected bus ridership to 2040 • Nearest to subways and employment locations • Requires interim bus facility • Least funding from development rights
Estimated Project Cost: $10.5 +/- billion Estimated Project Duration: 15 +/- years

Concept Review: Concept 2
17
• Terminal set back from 8th Avenue • Capacity to serve projected commuter bus demand • Intercity buses relocated off-site • Requires interim bus facility • Development along 8th Avenue generates more funding
Estimated Project Cost: $10.0 +/- billion Estimated Project Duration: 15 +/- years

Concept Review: Concept 3
18
• Terminal moved to west of 9th Avenue – longer connection to subways • Capacity to serve projected commuter bus demand • Intercity buses relocated off-site • Does not require interim bus facility • More funding from development
Estimated Project Cost: $9.0 +/- billion Estimated Project Duration: 13 +/- years

Concept Review: Concept 4
19
• Terminal set back from 8th Avenue • Bus staging and storage moved east of 10th Av.
and south of 39th Street • Capacity to serve projected commuter bus demand • Intercity buses relocated off-site • Requires interim bus facility • More funding from development
Estimated Project Cost: $10.0 +/- billion Estimated Project Duration: 15 +/- years

Concept Review: Concept 5
20
• Smaller terminal between 9th and 11th Avenues • Bus staging housed within terminal • Accommodates 73% of current commuter demand (53-59% in 2040) • Intercity and some commuter buses relocated off-site • Requires additional facilities at other locations to meet projected demand • Does not require interim bus facility
Estimated Project Cost: $7.5 +/- billion Estimated Project Duration: 11-12 +/- years

Concept Summary
Concept 1 Concept 2 Concept 3 Concept 4 Concept 5
Terminal Location and Commute
Quality
On-site Intercity Yes No No No No
Development Opportunities
Estimated Total Project Cost $10.5 billion $10.0 billion $9.0 billion $10.0 billion $7.5 billion
Meets Commuter Passenger
Demand Yes Yes Yes Yes No
Project Duration (Including 6 year pre-construction
period)
15 years 15 years 13 years 15 years 11-12 years
21

Total Project Costs – Order of Magnitude
Bus Facilities (3.7 M sf @ $1,230/sf pre-escalation) New Terminal (2.1 M sf) $2.8 B Parking and Staging Facility and Ramps (1.6 M sf) $1.7 B Escalation $1.4 B Hard Construction Cost $5.9 B Planning, Engineering, Legal, Professional $1.3 B Financing and Insurance $1.4 B Soft Costs $2.7 B
Program Contingency $1.9 B
Total Project Cost $10.5 B
Construction costs estimated by KPF/PB Joint Venture, Skanska and VJ Associates
22

Cost Estimation
Construction cost estimates account for: • Unusually heavy gauge of construction
• Phasing plans that keep bus terminal operational at all stages of construction
• Restricted work schedules to maintain Lincoln Tunnel access and egress
• Site limitations
• Escalation to the mid-year of construction
• $500 million for satellite intercity facility (Concepts 2-5 only)
Soft costs, program contingency, and other factors consistent with Port Authority experience and industry standards.
23

Public Transportation Projects of Similar Magnitude
Project Cost Estimate (Current) Federal Share Construction
Timeline
Current Regional Projects
WTC Transportation Hub ~$4 billion $2.9 billion 2006 - 2015
East Side (Rail) Access $10.2 billion $2.6 billion 2007 - 2022 Second Avenue Subway
(Phase 1) $4.5 billion $1.3 billion 2007 - 2016
Proposed Regional Projects
Second Avenue Subway (Phase 2) ~ $4.5 billion TBD TBD
Amtrak’s Gateway Project ~ $15 billion TBD TBD
Current National Projects
Washington Metro Dulles Corridor $5.7 billion $900 million (Phase 1)
$1.9 billion (TIFIA, Phase 2) 2010 - 2018
LA Purple Line Subway Extension (Phase 1&2) $5.4 billion $1.3 billion
(Phase 1) 2015 - 2023
Honolulu Transit Corridor $5.1 billion $1.6 billion 2012 - 2019
24
Sources: FTA, USDOT, and other government websites

Funding
• PABT replacement program requires a funding strategy that addresses capital costs and operating loses.
• Funding of new bus facilities requires participation from the Port Authority; local, regional and federal government; and the private sector.
• Decisions about bus facility investments must be part of a comprehensive, multi-modal interstate network strategy.
25

Potential Funding Sources
• Port Authority Capital Plan
• Monetizing Port Authority Development Rights
• Federal Grants and Loans
• Participation by Other Agencies and Localities
• Private Investment
26

Next Steps
27
Constructing a new bus terminal requires broad regional support and robust federal, state, and local participation.
In the next phase, the Port Authority will:
• Discuss alternatives with the community and commuters.
• Engage key stakeholders.
• Study additional alternatives in context of the full range of needs on the multimodal trans-Hudson network.
• Develop a funding strategy for capital and operating costs.