midlothian isd · builders start 114 and close 100 new homes in the district during the 2nd quarter...
TRANSCRIPT

Midlothian ISD
District Housing
Activity Report 2Q 2016
Solutions Through Demographics

DFW: STARTS, CLOSINGS & LOT DELIVERIES
0
5,000
10,000
15,000
20,000
25,000
30,000
35,000
40,000
45,000
50,000
55,000
60,000
20
03 2 3 4
20
04 2 3 4
20
05 2 3 4
20
06 2 3 4
20
07 2 3 4
20
08 2 3 4
20
09 2 3 4
20
10 2 3 4
20
11 2 3 4
20
12 2 3 4
20
13 2 3 4
20
14 2 3 4
20
15 2 3 4
20
16 2
An
nu
al R
ate
Starts Closings Lot Deliveries
Year-Over-Year Change
Annual Starts +13.7%
Annual Closings +18.0%
Annual Starts: 29,492
Annual Closings: 26,631
Current Cycle
2

3
HOUSING GROWTH DRIVERS: TEXAS ECONOMY
-500,000
-400,000
-300,000
-200,000
-100,000
0
100,000
200,000
300,000
400,000
500,000
'01 '02 '03 '04 '05 '06 '07 '08 '09 '10 '11 '12 '13 '14 15 16
Annual Texas Employment GrowthJob growth
June, 2015 – June, 2016
United States
– +2.522 million +1.77%
Texas
– +172,600 +1.45%
# of Jobs Created in Past 5 Years
– DFW 516,300
– Houston 367,800
– Austin 192,400
– San Antonio 136,100
Annual Job Growth in Major Texas Markets (June, 2016)
– DFW +114,100
– Austin +38,400
– San Antonio +23,40
– Houston +5,200
Source: TWC – CES (Not Seasonally
Adjusted)
6/2015 - 6/2016+172,600 net new jobs
+1.45% growth rate12,035,500 employed
4
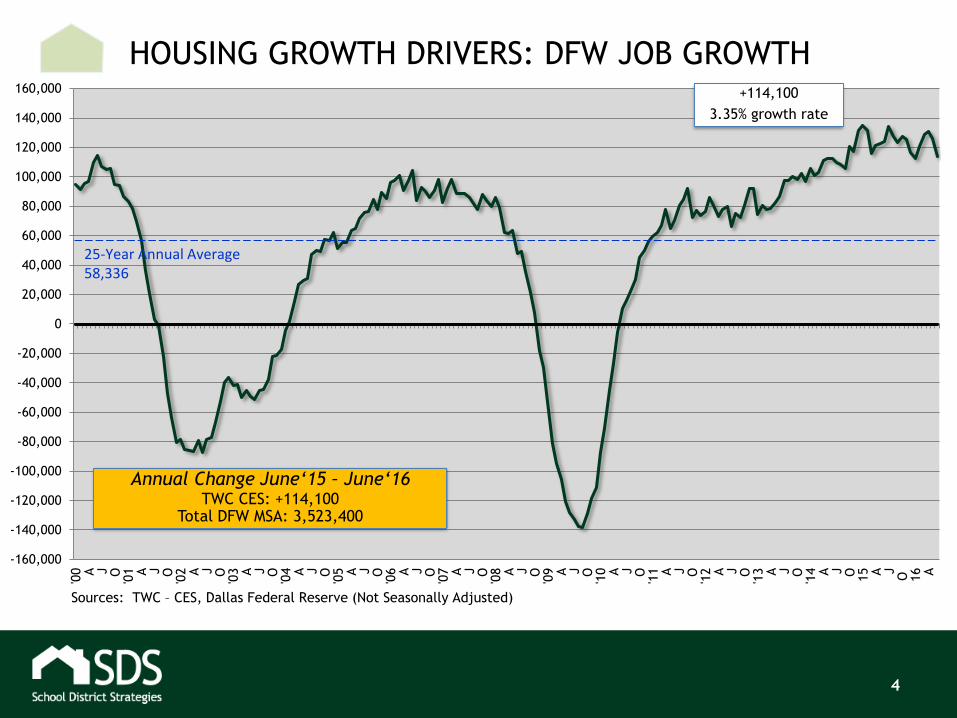
HOUSING GROWTH DRIVERS: DFW JOB GROWTH
-160,000
-140,000
-120,000
-100,000
-80,000
-60,000
-40,000
-20,000
0
20,000
40,000
60,000
80,000
100,000
120,000
140,000
160,000'0
0 A J O'0
1 A J O'0
2 A J O'0
3 A J O'0
4 A J O'0
5 A J O'0
6 A J O'0
7 A J O'0
8 A J O'0
9 A J O'1
0 A J O'1
1 A J O'1
2 A J O'1
3 A J O'1
4 A J O 15 A J
O 16 A
Sources: TWC – CES, Dallas Federal Reserve (Not Seasonally Adjusted)
Annual Change June‘15 – June‘16TWC CES: +114,100
Total DFW MSA: 3,523,400
+114,100
3.35% growth rate
25-Year Annual Average58,336

5
HOUSING GROWTH DRIVERS: LOW MORTGAGE RATES
3
3.5
4
4.5
5
5.5
6
6.5
7
2008
2009
2010
2011
2012
2013
2014
2015
2016
Source: Freddie Mac
July 21, 2016
30YR : 3.45%
15YR : 2.75%
1YR ARM : 2.78%
30-Yr Fixed Rate Outlook
Mortgage Bankers
AssociationConforming Rates: 7/14/16 Forecast
3Q16 3.6%
4Q16 3.8%
1Q17 4.0%
2Q17 4.1%
30-Yr Conforming Rates (Freddie Mac)
30-Yr rate has been under 4% for
most of the current housing cycle
6
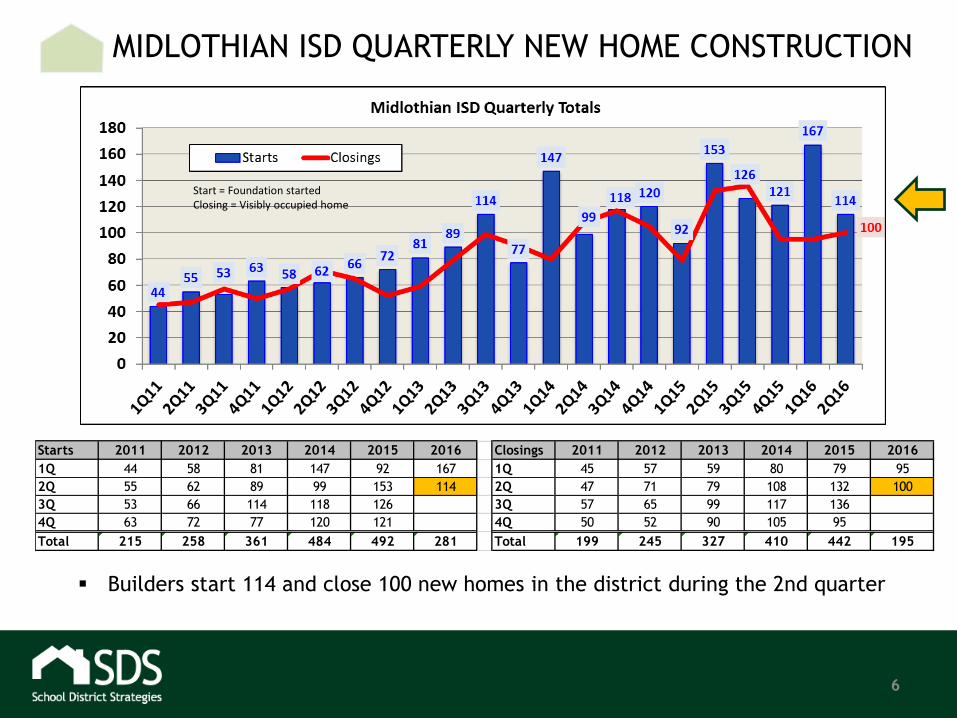
MIDLOTHIAN ISD QUARTERLY NEW HOME CONSTRUCTION
Start = Foundation started Closing = Visibly occupied home
Builders start 114 and close 100 new homes in the district during the 2nd quarter
Starts 2011 2012 2013 2014 2015 2016 Closings 2011 2012 2013 2014 2015 2016
1Q 44 58 81 147 92 167 1Q 45 57 59 80 79 95
2Q 55 62 89 99 153 114 2Q 47 71 79 108 132 100
3Q 53 66 114 118 126 3Q 57 65 99 117 136
4Q 63 72 77 120 121 4Q 50 52 90 105 95
Total 215 258 361 484 492 281 Total 199 245 327 410 442 195

7
MIDLOTHIAN ISD ANNUAL NEW HOME CONSTRUCTION
& LOT DELIVERIES
Annual Starts: 528
Annual Closings: 426
Year-Over-Year Change
Annual Starts +9.3%
Annual Closings -1.6%
Builders start construction on 528 new homes in the district over the past 12 months
New home closings fall back to 426 annual units (-1.6% Y-o-Y)
Developers deliver 715 new single-family lots in MISD over the past year
Start = Foundation started Closing = Visibly occupied home

Rank District
Total Starts
3Q15-2Q16
Total Closings
3Q15-2Q16
ESC
Region
1 Frisco 2,570 2,600 10
2 Denton 2,146 1,858 11
3 Prosper 2,489 1,835 10
4 Northwest 1,366 1,243 11
5 Lewisville 1,310 1,197 11
6 Little Elm 1,016 1,077 11
7 Keller 806 942 11
8 Eagle Mtn.-Saginaw 858 941 11
9 Rockwall 951 741 10
10 Crowley 851 719 11
11 Mansfield 759 668 11
12 McKinney 842 643 10
13 Wylie 724 597 10
14 Dallas 717 562 10
15 Forney 574 500 10
16 Allen 551 492 10
17 Burleson 452 491 11
18 Plano 483 464 10
19 H.E.B. 432 455 11
20 Midlothian 528 426 10
8
DFW DISTRICT RANKINGS
BY NEW HOME CLOSINGS 3Q15-2Q16
• Midlothian ISD
ranked 17th in total
new home starts and
20th in total closings
over the past year
compared to the
other 81 DFW school
districts
9
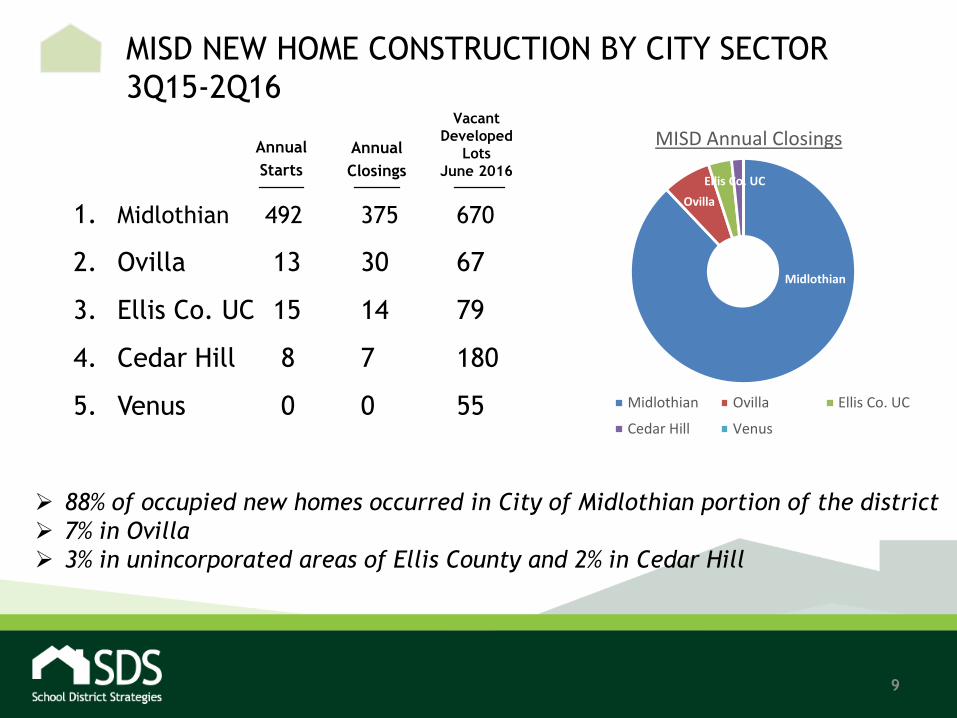
MISD NEW HOME CONSTRUCTION BY CITY SECTOR
3Q15-2Q16
1. Midlothian 492 375 670
2. Ovilla 13 30 67
3. Ellis Co. UC 15 14 79
4. Cedar Hill 8 7 180
5. Venus 0 0 55
Annual
Starts
Annual
Closings
Vacant
Developed
Lots
June 2016
88% of occupied new homes occurred in City of Midlothian portion of the district
7% in Ovilla
3% in unincorporated areas of Ellis County and 2% in Cedar Hill
Midlothian
Ovilla
Ellis Co. UC
MISD Annual Closings
Midlothian Ovilla Ellis Co. UC
Cedar Hill Venus
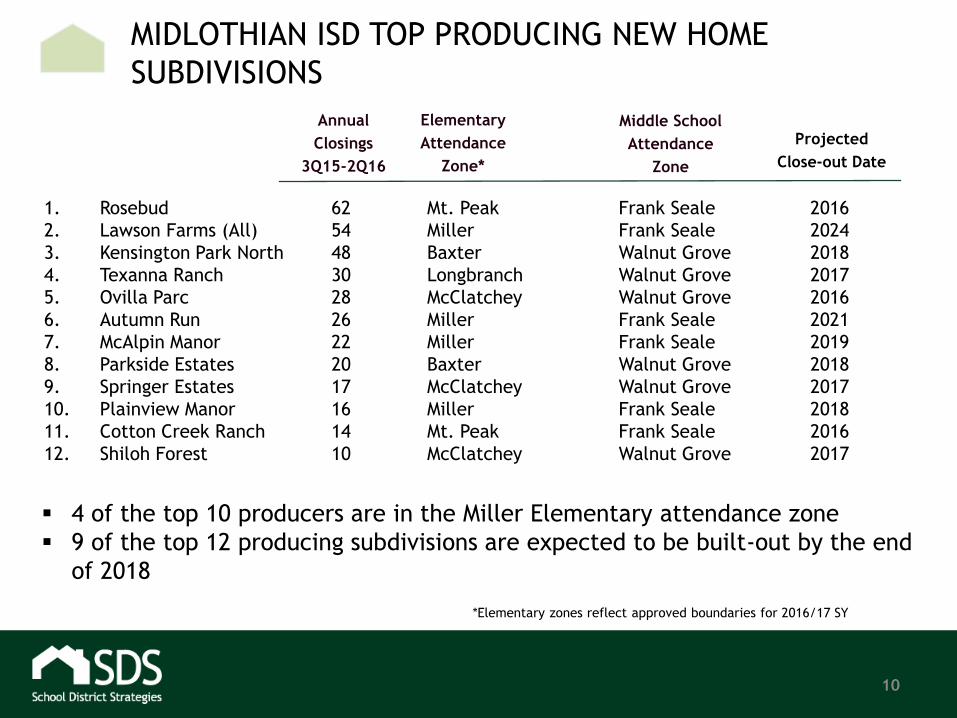
1. Rosebud 62 Mt. Peak Frank Seale 2016
2. Lawson Farms (All) 54 Miller Frank Seale 2024
3. Kensington Park North 48 Baxter Walnut Grove 2018
4. Texanna Ranch 30 Longbranch Walnut Grove 2017
5. Ovilla Parc 28 McClatchey Walnut Grove 2016
6. Autumn Run 26 Miller Frank Seale 2021
7. McAlpin Manor 22 Miller Frank Seale 2019
8. Parkside Estates 20 Baxter Walnut Grove 2018
9. Springer Estates 17 McClatchey Walnut Grove 2017
10. Plainview Manor 16 Miller Frank Seale 2018
11. Cotton Creek Ranch 14 Mt. Peak Frank Seale 2016
12. Shiloh Forest 10 McClatchey Walnut Grove 2017
10
MIDLOTHIAN ISD TOP PRODUCING NEW HOME
SUBDIVISIONS
Annual
Closings
3Q15-2Q16
Elementary
Attendance
Zone*
Middle School
Attendance
Zone
Projected
Close-out Date
4 of the top 10 producers are in the Miller Elementary attendance zone
9 of the top 12 producing subdivisions are expected to be built-out by the end
of 2018
*Elementary zones reflect approved boundaries for 2016/17 SY
11
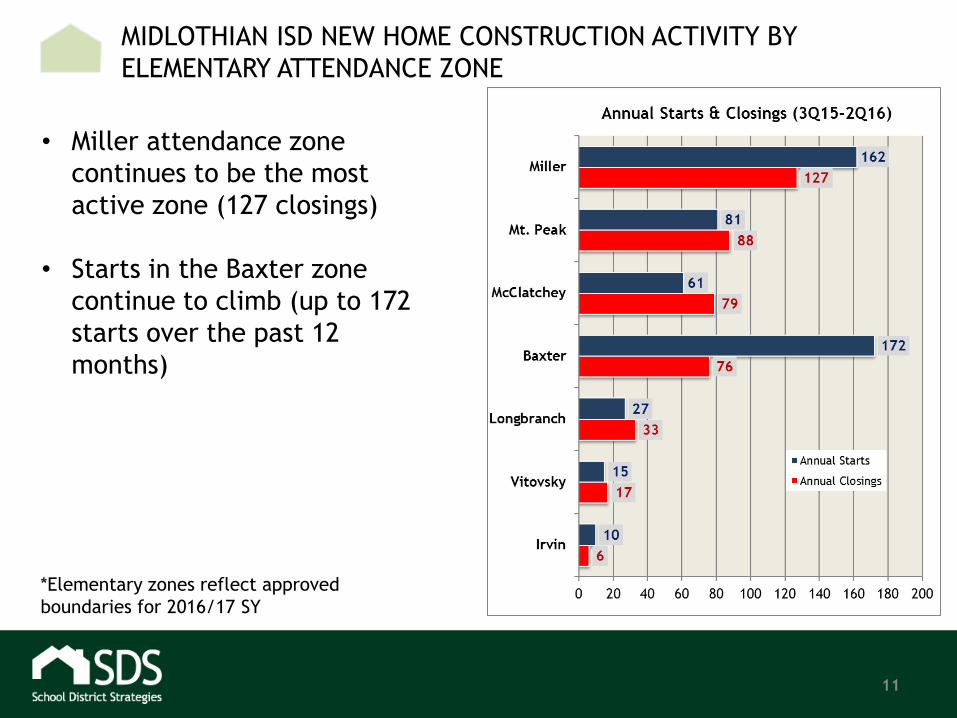
MIDLOTHIAN ISD NEW HOME CONSTRUCTION ACTIVITY BY
ELEMENTARY ATTENDANCE ZONE
• Miller attendance zone
continues to be the most
active zone (127 closings)
• Starts in the Baxter zone
continue to climb (up to 172
starts over the past 12
months)
*Elementary zones reflect approved
boundaries for 2016/17 SY
12
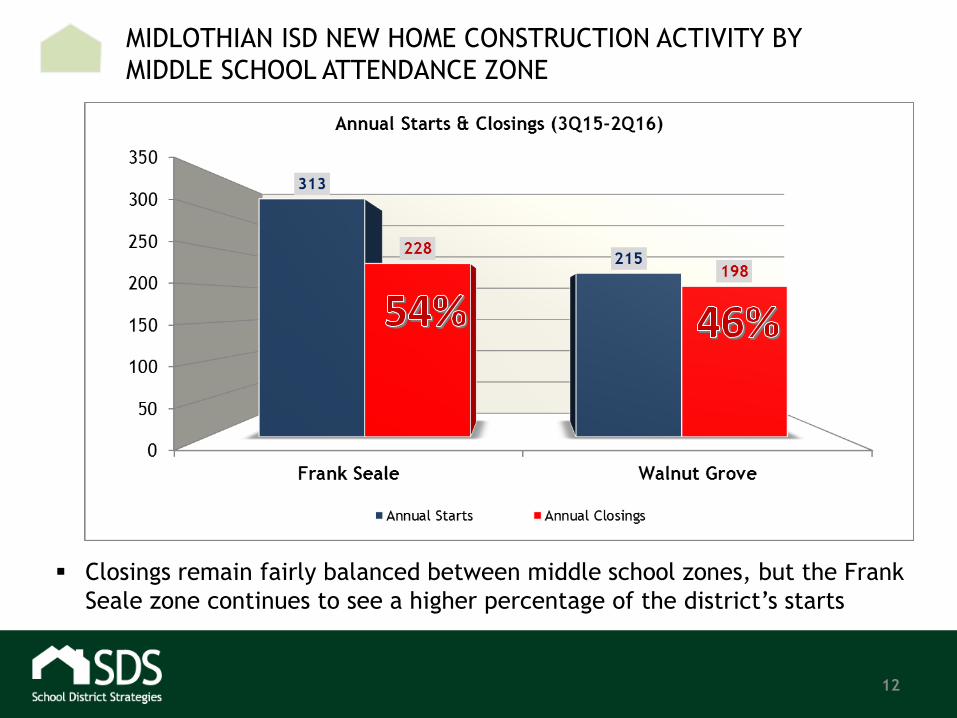
MIDLOTHIAN ISD NEW HOME CONSTRUCTION ACTIVITY BY
MIDDLE SCHOOL ATTENDANCE ZONE
Closings remain fairly balanced between middle school zones, but the Frank
Seale zone continues to see a higher percentage of the district’s starts
13
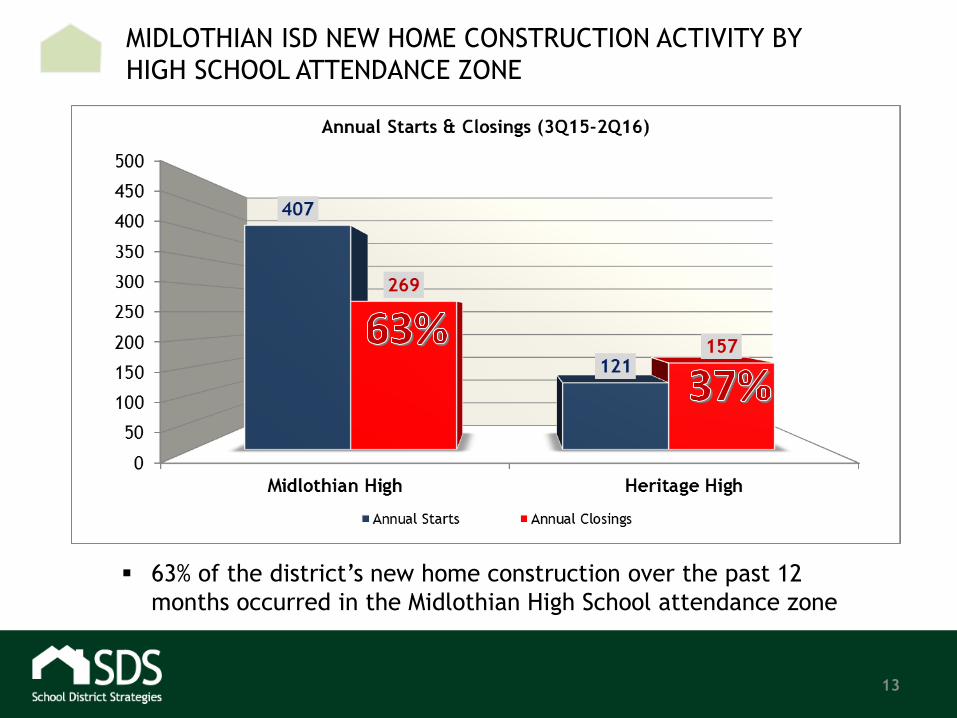
MIDLOTHIAN ISD NEW HOME CONSTRUCTION ACTIVITY BY
HIGH SCHOOL ATTENDANCE ZONE
63% of the district’s new home construction over the past 12
months occurred in the Midlothian High School attendance zone
14
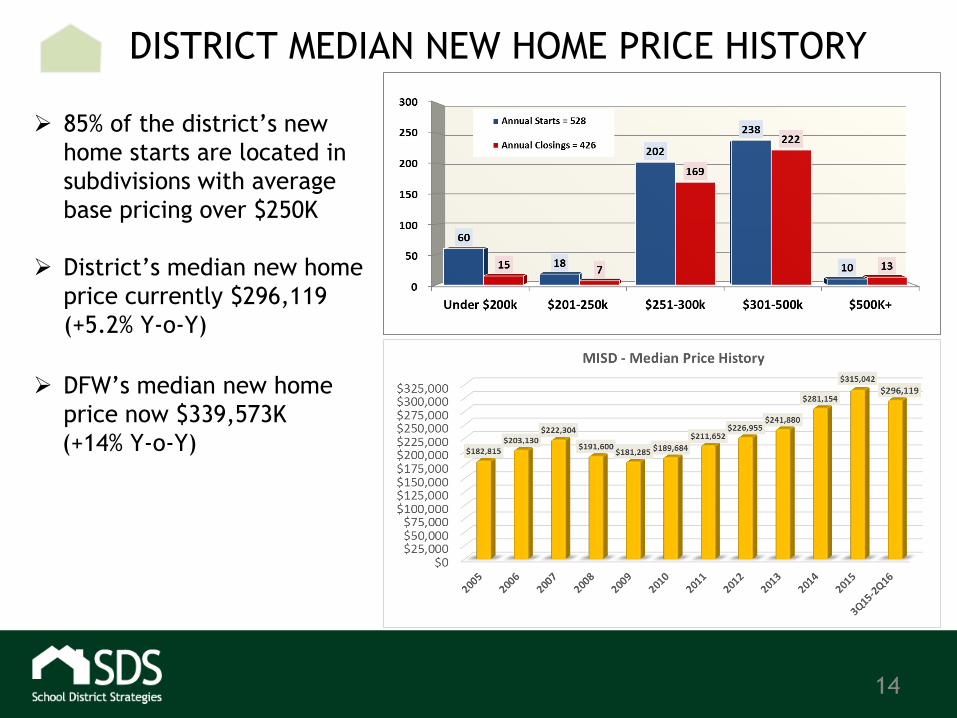
DISTRICT MEDIAN NEW HOME PRICE HISTORY
85% of the district’s new
home starts are located in
subdivisions with average
base pricing over $250K
District’s median new home
price currently $296,119
(+5.2% Y-o-Y)
DFW’s median new home
price now $339,573K
(+14% Y-o-Y)

15
MIDLOTHIAN ISD RESIDENTIAL DEVELOPMENT
1,218 future single-family residential lots currently under
development in MISD (New record for 12-month period)
© School District Strategies

16
MIDLOTHIAN ISD RESIDENTIAL DEVELOPMENT
118 new lots delivered in 2Q16 Bryson Manor Ph. 1 – 59 lots (McClatchey/Walnut Grove/Heritage)
Dove Creek Ph.1A – 59 lots (Mt. Peak/Seale/MHS)
1,051 total vacant developed lots on the ground in the district as June 2016
1,218 Future Lots Under Development Skyview – 120 duplexes (Irvin)
Summit at Lake Ridge Ph. 22-B – 33 lots (Vitovsky)
Kensington Park North Ph. 2 – 81 lots (Baxter)
Jordan Run Ph. 3 – 27 lots (Mt. Peak)
Autumn Run Ph. 2 – 53 lots (Miller)
Hawkins Meadow Ph.1 – 123 lots (Miller)
Hillstone Estates Ph.1 – 78 lots (Miller)
Lawson Farms Ph. 2A – 314 lots (Miller)
Enclave at Lawson Farms – 60 lots (Miller)
Four Trees – 138 lots (McClatchey)
Bryson Springs Ph.1 – 36 lots (McClatchey)
Horizon Estates – 81 lots (Longbranch)
Bob White Estates – 74 lots (Longbranch)
52% (628 lots) are under development in the Miller Elementary zone
*Blue = New or updated in 2Q16
Note: In July, lot development started at Thomas Trail Estates (89 lots in Mt. Peak) and Mockingbird Lane Addition (73 lots in McClatchey)

Baxter ES Zone:
The Grove South – 176 lots
Townhome tract Z11-2015-48
(rezoning denied by City)
Irvin ES Zone:
Pandera Point Apartments – 199 units
Longbranch ES Zone:
Diamond J Ranch (+/- 2,700 lots)
Heritage Crossing – 272 lots
Hayes Crossing – 338 lots (plat denied
by City)
Legacy Estates – 116, 1-acre lots
Shady Valley Estates – 91 lots
Spring Creek Estates – 104 lots
Clifton Place – 21 lots
Miller ES Zone:
Tract Z14-2015-65 – 50 lots
17
MISD PROPOSED RESIDENTIAL PROJECTS
McClatchey ES Zone:
Mockingbird Lane Addition (76, 1-acre
lots)
Stonewood Lake Estates – 143 lots
Wilson Crossing – 86 lots (W. of La Rinconada)
Mt. Peak ES Zone:
Thomas Trail Estates - 89 lots
La Paz Ranch – 128 lots
Vitovsky ES Zone:
Windsor Hills (Ellis Co. FWSD No. 2)
Lakeview Hills
Greenway Trails (Walton) - 669 lots
Prairie Ridge - 1,286 lots
Highland Meadows – 747 lots
Cottonwood Creek - 325 lots
Cashmere Ranch Apartments
28.8 acre tract south of Overlook Est.
*Blue = New or updated in 2Q16

18
Aerial Photos
June 30, 2016

19
NSH 360 Toll Road
Mansfield ISD
Midlothian ISD

20
NKensington Park North
21
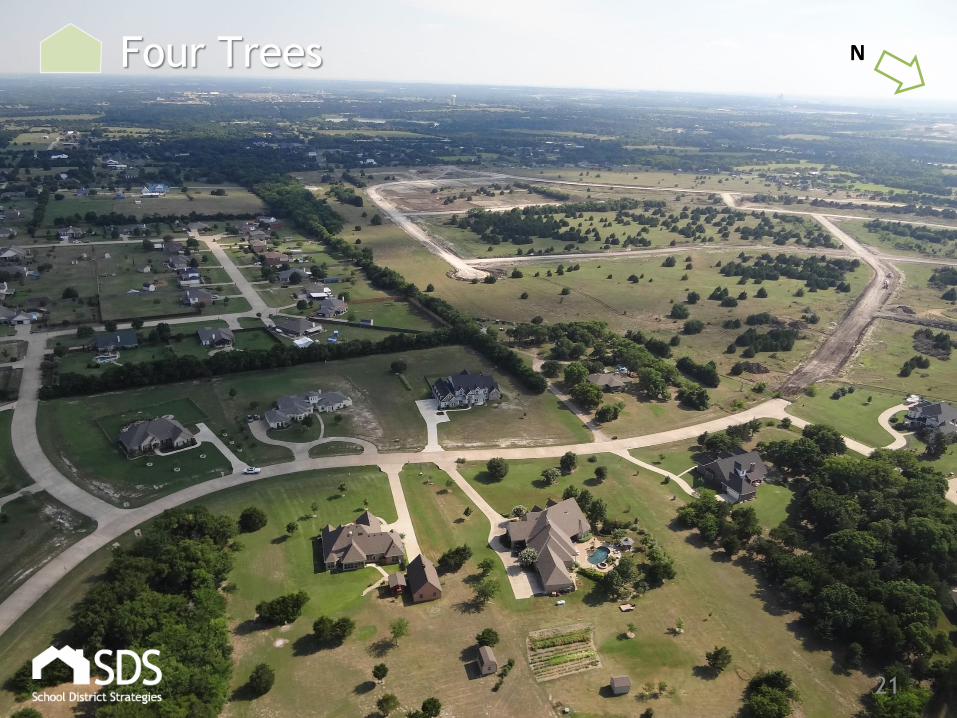
NFour Trees

22
NParkside Estates
Mockingbird Estates
Baxter Elem.

23
NWindermere Estates
Kensington Park
Mockingbird Estates

24
NMaple Ridge Townhomes
Proposed Rezoning for Townhomes
Timber Oaks Apts.
N. 14th St.
25
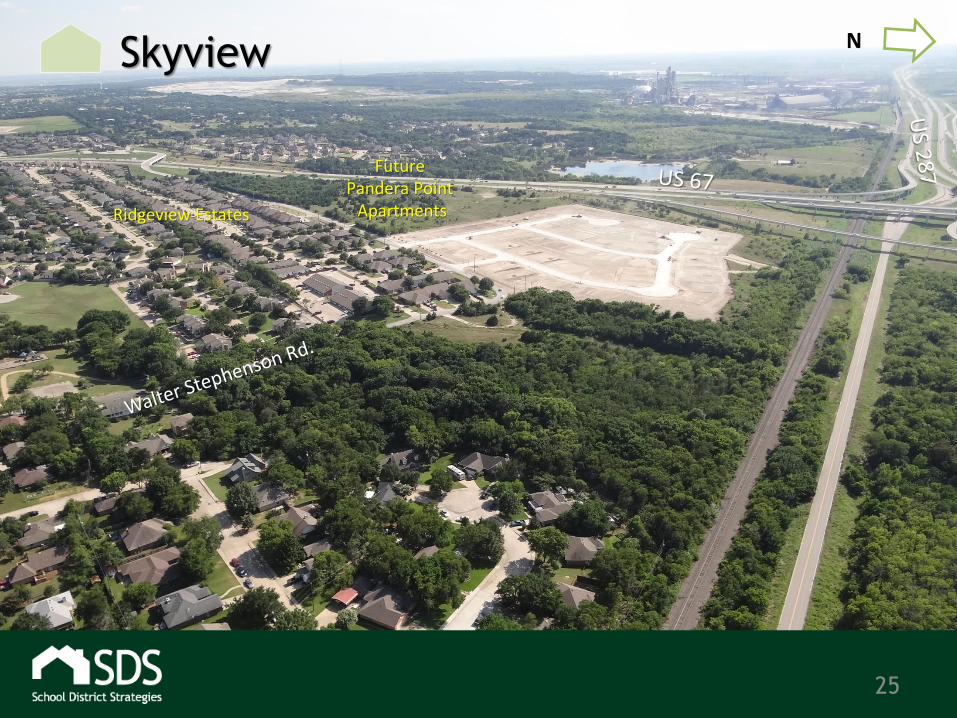
NSkyview
Future Pandera Point
ApartmentsRidgeview Estates

26
NHawkins Meadow / Midlothian
Towne Crossing Retail
Lawson Farms
Hawkins Meadow
Future Kroger
SH 287
27
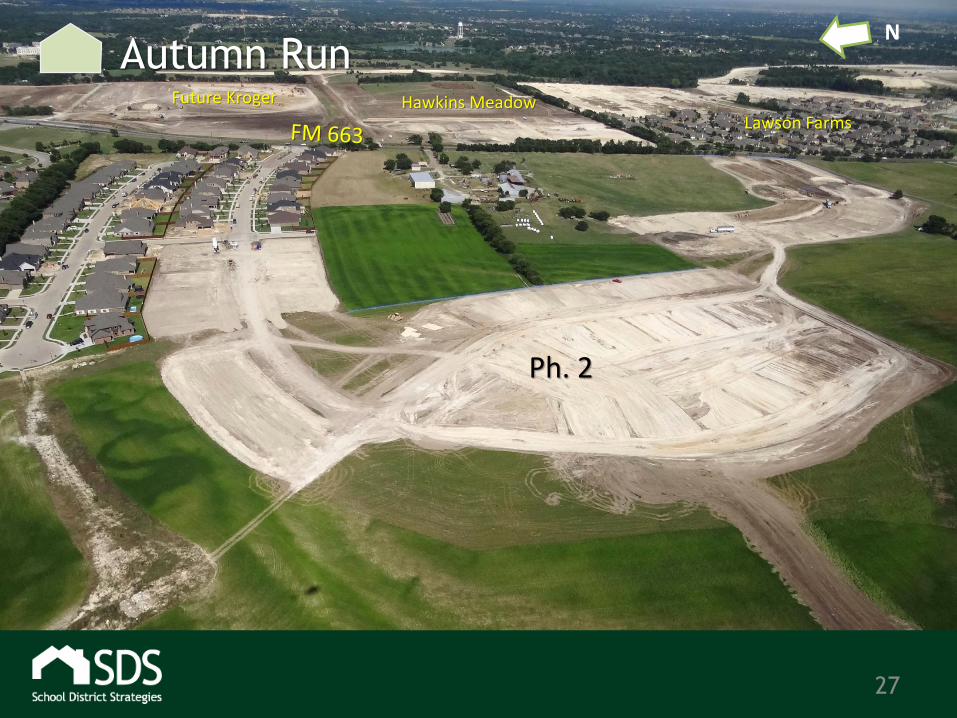
NAutumn Run
Lawson Farms
Ph. 2
Hawkins MeadowFuture Kroger
28
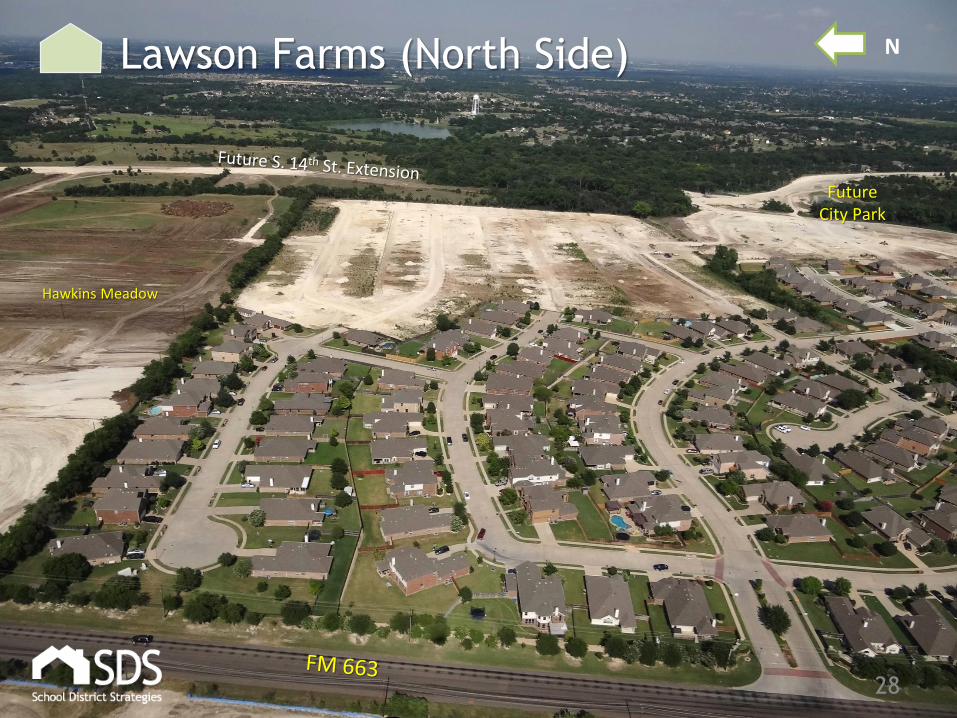
NLawson Farms (North Side)
FutureCity Park
Hawkins Meadow

29
NLawson Farms (South Side)
FutureCity Park

30
NHillstone Estates

31
N
Dove Creek
McAlpin Rd
Future Coventry Crossing Ph. 2

32
NCoventry Crossing
Hill Crest Addition
33
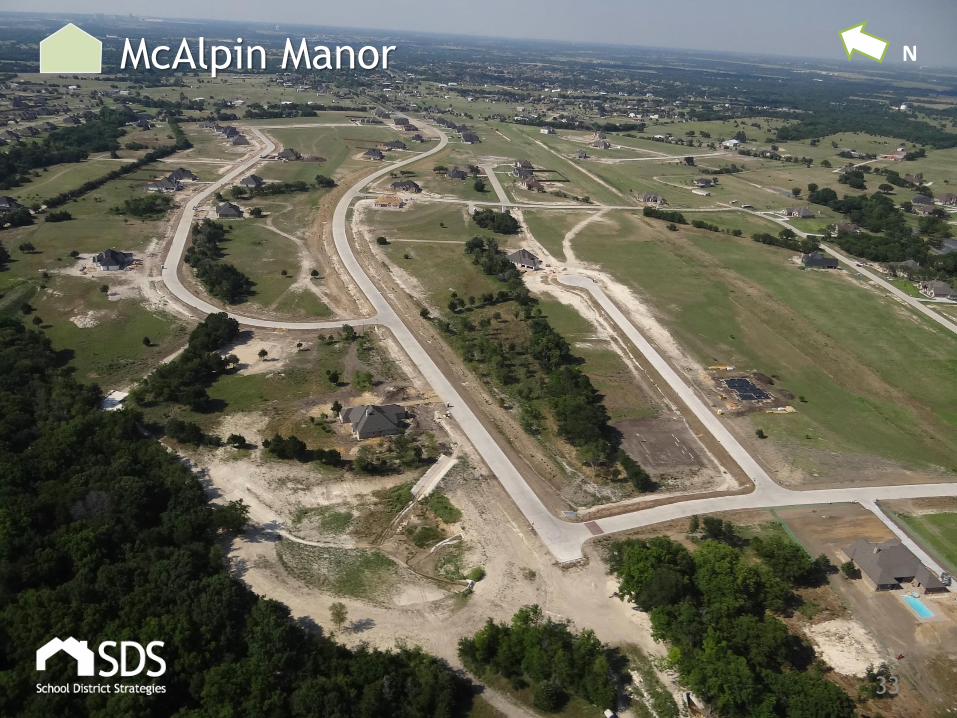
NMcAlpin Manor

34
MIDLOTHIAN ISD RESIDENTIAL LOT INVENTORY BY ELEM. ZONE
ATTENDANCE ZONE* ANNUAL STARTS3Q15-2Q16
DEVELOPED LOTS
REMAINING(VDL)
FUTURE & PRELIM
PLANNED SINGLE FAMILY
LOTS
PLANNED FUTURE
APARTMENT UNITS
BAXTER 172 261 413 0
IRVIN 10 21 485 199
LONGBRANCH 27 16 3,834 0
McCLATCHEY 61 189 665 0
MILLER 162 186 1,085 0
MT. PEAK 81 138 801 0
VITOVSKY 15 240 12,034 95
TOTAL 528 1,051 19,317 294
*Elementary
zones reflect
approved
attendance
zones for
2016/17 SY

35
MIDLOTHIAN ISD RESIDENTIAL LOT INVENTORY BY
MIDDLE AND HIGH SCHOOL ZONE
ATTENDANCE ZONE ANNUAL STARTS3Q15-2Q16
DEVELOPED LOTSREMAINING
(VDL)
FUTURE & PRELIM PLANNED
SINGLE FAMILY LOTS
PLANNED FUTURE APARTMENT UNITS
FRANK SEALE 313 582 5,684 199
WALNUT GROVE 215 469 13,633 95
TOTAL 528 1,051 19,317 294
ATTENDANCE ZONE ANNUAL STARTS3Q15-2Q16
DEVELOPED LOTSREMAINING
(VDL)
FUTURE & PRELIM PLANNED
SINGLE FAMILY LOTS
PLANNED FUTURE APARTMENT UNITS
MIDLOTHIAN HS 407 820 14,667 294
HERITAGE HS 121 231 4,650 0
TOTAL 528 1,051 19,317 294
36
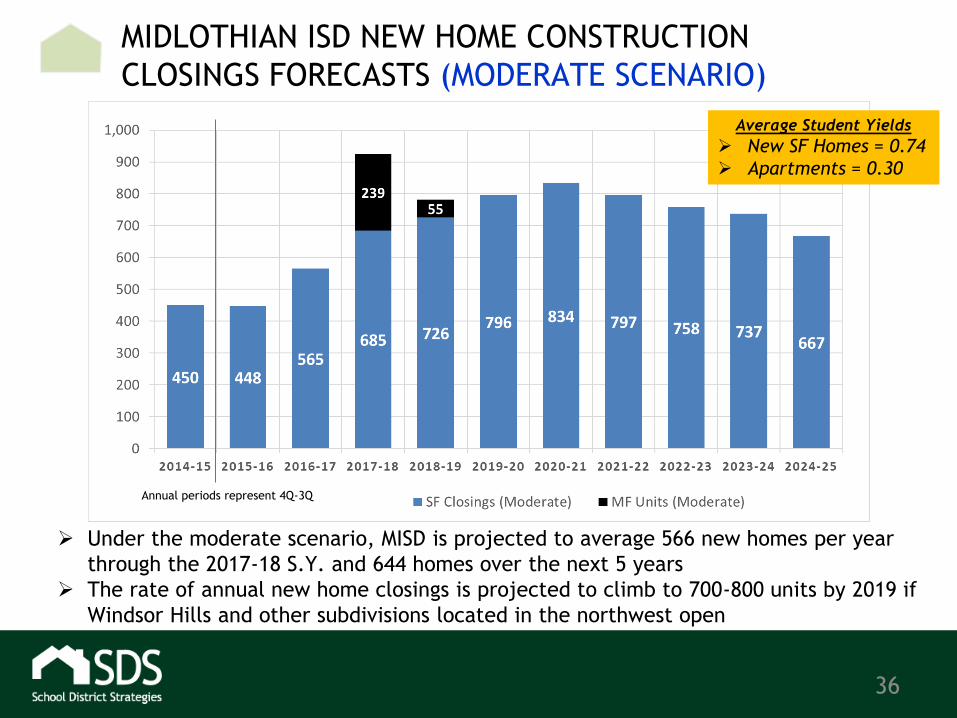
MIDLOTHIAN ISD NEW HOME CONSTRUCTION
CLOSINGS FORECASTS (MODERATE SCENARIO)
Under the moderate scenario, MISD is projected to average 566 new homes per year
through the 2017-18 S.Y. and 644 homes over the next 5 years
The rate of annual new home closings is projected to climb to 700-800 units by 2019 if
Windsor Hills and other subdivisions located in the northwest open
Annual periods represent 4Q-3Q
Average Student Yields
New SF Homes = 0.74
Apartments = 0.30

37
MIDLOTHIAN ISD NEW HOME CONSTRUCTION
CLOSINGS FORECAST (HIGH SCENARIO)
Under the high growth scenario, new home closings in the district would average
639 per year over the next 3 years and then climb to 900 homes per year by 2020
(averaging 744 per year over the next 5 years)
Annual periods represent 4Q-3Q
Average Student Yields
New SF Homes = 0.74
Apartments = 0.30

38
MIDLOTHIAN ISD PRE-OWNED HOME SALES
• 166 resales in the district during the 2nd quarter of 2016
• 615 total resales over the past 12 months (+14% year-over-year)
• 3Q15-2Q16 Median resale price = $225,000 (+13.7% Y-o-Y)
Source: NTREIS – SF detached, non-builder sales only

39
MIDLOTHIAN ISD PRE-OWNED HOME SALES 3Q15-2Q16
Source: NTREIS – SF detached, non-builder sales only 7/1/2015-6/30/2016

40
Projected
Historical
Moderate Projected Enrollment Growth
3 Year = +1,3015 Year = +2,390
10 Year = +5,066
Low =2.7%Avg. AnnualGrowth

41
MISD FACILITY CAPACITY TIMELINE 2Q 2016 (MODERATE)
Current
2015/16 2016/17 2017/18 2018/19 2019/20 2020/21 2021/22 2022/23 2023/24 2024/25 2025/26
Baxter Elementary Campus Capacity = 750
Total Enrollment 647 602 654 706 729 752 771 784 797 809 822
Capacity Utilization 86% 80% 87% 94% 97% 100% 103% 105% 106% 108% 110%
Space Remaining 103 148 96 44 21 -2 -21 -34 -47 -59 -72
Irvin Elementary Campus Capacity = 400
Total Enrollment 365 360 367 412 420 428 437 441 444 447 450
Capacity Utilization 91% 90% 92% 103% 105% 107% 109% 110% 111% 112% 112%
Space Remaining 35 40 33 -12 -20 -28 -37 -41 -44 -47 -50
Longbranch Elementary Campus Capacity = 750
Total Enrollment 730 544 548 561 581 613 645 679 712 746 777
Capacity Utilization 97% 73% 73% 75% 78% 82% 86% 90% 95% 100% 104%
Space Remaining 20 206 202 189 169 137 105 71 38 4 -27
Miller Elementary Campus Capacity = 750
Total Enrollment 585 547 602 671 744 807 866 919 962 990 1,002
Capacity Utilization 78% 73% 80% 89% 99% 108% 115% 123% 128% 132% 134%
Space Remaining 165 203 148 79 6 -57 -116 -169 -212 -240 -252
Mt. Peak Elementary Campus Capacity = 750
Total Enrollment 786 668 695 727 762 806 851 888 918 943 965
Capacity Utilization 105% 89% 93% 97% 102% 107% 113% 118% 122% 126% 129%
Space Remaining -36 82 55 23 -12 -56 -101 -138 -168 -193 -215Vitovsky Elementary Campus Capacity = 750
Total Enrollment 635 635 648 673 702 748 814 900 1,001 1,119 1,244
Capacity Utilization 85% 85% 86% 90% 94% 100% 109% 120% 134% 149% 166%
Space Remaining 115 115 102 77 48 2 -64 -150 -251 -369 -494
McClatchey Elementary Campus Capacity = 750
Total Enrollment n/a 502 533 573 618 665 707 738 759 777 785
Capacity Utilization 67% 71% 76% 82% 89% 94% 98% 101% 104% 105%
Space Remaining 248 217 177 132 85 43 12 -9 -27 -35
Elementary Totals Total Elementary Capacity = 4,900
Total Enrollment 3,748 3,858 4,047 4,323 4,557 4,819 5,090 5,348 5,593 5,831 6,045
Capacity Utilization 76% 79% 83% 88% 93% 98% 104% 109% 114% 119% 123%
Space Remaining 1,152 1,042 853 577 343 81 -190 -448 -693 -931 -1,145
Midlothian ISD - Campus
Projections (Moderate
Scenario)
Projected Fall Enrollment

42
MISD FACILITY CAPACITY TIMELINE 2Q 2016 (MODERATE)
Current
2015/16 2016/17 2017/18 2018/19 2019/20 2020/21 2021/22 2022/23 2023/24 2024/25 2025/26
Midlothian ISD - Campus
Projections (Moderate
Scenario)
Projected Fall Enrollment
Frank Seale Middle Campus Capacity = 1,200
Total Enrollment 968 1,007 1,057 1,136 1,194 1,258 1,334 1,405 1,470 1,531 1,586
Capacity Utilization 81% 84% 88% 95% 99% 105% 111% 117% 122% 128% 132%
Space Remaining 232 193 143 64 6 -58 -134 -205 -270 -331 -386
Walnut Grove Middle Campus Capacity = 1,200
Total Enrollment 1,017 1,003 1,043 1,099 1,158 1,224 1,289 1,349 1,409 1,469 1,524
Capacity Utilization 85% 84% 87% 92% 96% 102% 107% 112% 117% 122% 127%
Space Remaining 183 197 157 101 42 -24 -89 -149 -209 -269 -324
Middle School Totals Total Middle School Capacity = 2,400
Total Enrollment 1,985 2,010 2,100 2,235 2,351 2,482 2,623 2,754 2,879 3,000 3,109
Capacity Utilization 83% 84% 87% 93% 98% 103% 109% 115% 120% 125% 130%
Space Remaining 415 390 300 165 49 -82 -223 -354 -479 -600 -709
Heritage High Campus Capacity = 1,000
Total Enrollment 567 801 834 880 935 999 1,059 1,115 1,164 1,209 1,246
Capacity Utilization 57% 80% 83% 88% 93% 100% 106% 112% 116% 121% 125%
Space Remaining 433 199 166 120 65 1 -59 -115 -164 -209 -246
Midlothian High Campus Capacity = 2,500
Total Enrollment 1,847 1,803 1,888 2,011 2,116 2,237 2,362 2,483 2,598 2,710 2,812
Capacity Utilization 74% 72% 76% 80% 85% 89% 94% 99% 104% 108% 112%
Space Remaining 653 697 612 489 384 263 138 17 -98 -210 -312
High School Totals Total High School Capacity = 3,500
Total Enrollment 2,414 2,604 2,721 2,890 3,051 3,236 3,421 3,598 3,762 3,919 4,059
Capacity Utilization 69% 74% 78% 83% 87% 92% 98% 103% 107% 112% 116%
Space Remaining 1,086 896 779 610 449 264 79 -98 -262 -419 -559
District Totals (PK-12) Total District Capacity = 10,800
Total Enrollment 8,147 8,472 8,869 9,448 9,959 10,537 11,134 11,700 12,235 12,750 13,213
Capacity Utilization 75% 78% 82% 87% 92% 98% 103% 108% 113% 118% 122%
Space Remaining 2,653 2,328 1,931 1,352 841 263 -334 -900 -1,435 -1,950 -2,413

43
Copyright 2016 School District Strategies.
Disclaimer - Although School District Strategies (SDS) has used commercially reasonable efforts to obtain information from sources in a manner that
SDS believes to be reliable, we do not guarantee its accuracy and such information may be incomplete, condensed or interpolated. Information
presented in this report represents our estimates as of the date of the publication and is subject to change without notice. This report is not
intended as a recommendation or endorsement for any action taken by others. In no event will School District Strategies be liable for direct,
indirect, incidental or consequential lost profits, lost savings, damages or other liabilities resulting from any information provided herein.
16980 Dallas Parkway
Suite 101
Dallas, Texas 75248
www.schooldistrictstrategies.com