midea group co., ltd. semi-annual report...
TRANSCRIPT

Midea Group Co., Ltd.
Semi-Annual Report 2017
August 2017
Midea Group Co., Ltd. Semi-Annual Report 2017
- 2 -
Part I Important Statements, Contents and Definitions
The board of directors (the “Board of Directors” or the “Board”), the Supervisory Board (the
“Supervisory Board”), as well as the directors, supervisors and senior management of
Midea Group Co., Ltd. (hereinafter referred to as the “Company”) hereby guarantee that the
information presented in this report is free of any false representation, misleading
statements or material omissions, and shall together be wholly liable for the truthfulness,
accuracy and completeness of its contents.
All directors of the Company attended the Board meeting to review this report.
The Company plans not to distribute cash dividends or bonus shares or convert capital
reserves into share capital for the first half of 2017.
Mr. Fang Hongbo, chairman of the Board and president of the Company and Mr. Xiao
Mingguang, responsible person for the Company’s financial affairs have represented and
warranted that the financial statements in this report are true, accurate and complete.
The financial statements in this report are unaudited by a CPAs firm.
The future plans and other forward-looking statements mentioned in this report shall NOT
be considered as virtual promises of the Company to investors. Therefore investors are
kindly reminded to pay attention to investment risk.
This report has been prepared in both Chinese and English. Should there be any
discrepancies or misunderstandings between the two versions, the Chinese version shall
prevail.
Midea Group Co., Ltd. Semi-Annual Report 2017
- 3 -
Table of Contents
Part I Important Statements, Contents and Definitions .............................. - 2 -
Part II Company Profile and Key Financial Results .................................... - 5 -
Part III Business Profile ............................................................................. - 9 -
Part IV Performance Discussion and Analysis ......................................... - 13 -
Part V Significant Events ......................................................................... - 34 -
Part VI Changes in Shares and Information about Shareholders ............. - 51 -
Part VII Preference Shares ...................................................................... - 56 -
Part VIII Information about Directors, Supervisors & Senior Management - 57 -
Part IX Financial Report ........................................................................... - 58 -
Part X Documents Available for Reference ............................................ - 147 -

Midea Group Co., Ltd. Semi-Annual Report 2017
- 4 -
Definitions
Term Definition
Company, the Company, Midea, Midea Group, Group or the
Group Midea Group Co., Ltd.
Midea Holding Midea Holding Co., Ltd.
Little Swan Wuxi Little Swan Company Limited
Toshiba Toshiba Corporation
TLSC Toshiba Lifestyle Products & Services Corporation
KUKA KUKA Aktiengesellschaft
MECCA MECCA International (BVI) Limited
SMC Servotronix and its subsidiaries
The Reporting Period The period from 1 January 2017 to 30 June 2017

Midea Group Co., Ltd. Semi-Annual Report 2017
- 5 -
Part II Company Profile and Key Financial Results
1. Corporate Information
Stock name Midea Group Stock code 000333
Stock exchange where the
shares of the Company are
listed
Shenzhen Stock Exchange
Name of the Company in
Chinese 美的集团股份有限公司
Abbr. of the Company name
in Chinese (if any) 美的集团
Name of the Company in
English (if any) Midea Group Co., Ltd.
Abbr. of the Company name
in English (if any) Midea Group
Legal representative Fang Hongbo
2. Contact Us
Board Secretary Securities Representative
Name Jiang Peng Ou Yunbin
Address Midea Headquarters Building, No. 6 Midea Avenue, Beijiao Town, Shunde
District, Foshan City, Guangdong Province, China
Tel. 0757-22607708 0757-23274957
Fax 0757-26605456
E-mail [email protected]
3. Other Information
3.1 Ways to Contact the Company
Changes in the Reporting Period to the registered address, office address and their zip codes, website
address and email address of the Company:
□ Applicable √ N/A
No such changes in the Reporting Period. The said information can be found in the 2016 Annual Report.

Midea Group Co., Ltd. Semi-Annual Report 2017
- 6 -
3.2 About Media for Information Disclosure and Place where Materials Carrying Disclosed
Information such as this Report are Kept
Changes in the Reporting Period to the media for information disclosure and the place where materials
carrying disclosed information such as this Report were kept:
□ Applicable √ N/A
The newspapers designated by the Company for information disclosure, the website designated by the
CSRC for disclosing this Report and the place where materials carrying disclosed information such as
this Report were kept did not change in the Reporting Period. The said information can be found in the
2016 Annual Report.
3.3 Other Information
Changes in the Reporting Period to other information:
□ Applicable √ N/A
4. Key Accounting Data and Financial Indicators
Whether the Company performed any retroactive adjustment to or restatement of accounting data:
□ Yes √ No
H1 2017 H1 2016 Change (%)
Operating revenues (RMB'000) 124,450,065 77,522,287 60.53%
Net profits attributable to shareholders
of the Company (RMB'000) 10,811,322 9,496,493 13.85%
Net profits attributable to shareholders
of the Company before non-recurring
gains and losses (RMB'000)
9,891,766 9,100,244 8.70%
Net cash flows from operating activities
(RMB'000) 13,895,932 8,129,163 70.94%
Basic earnings per share (RMB/share) 1.67 1.48 12.84%
Diluted earnings per share
(RMB/share) 1.66 1.48 12.16%
Weighted average ROE (%) 16.46% 17.64% -1.18%
End of H1 2017 End of 2016 Change (%)
Total assets (RMB'000) 231,016,492 170,600,711 35.41%
Net assets attributable to shareholders
of the Company (RMB'000) 66,314,017 61,126,923 8.49%
Note: For H1 2017, Midea Group, exclusive of its recently acquired international subsidiaries, achieved operating revenue

Midea Group Co., Ltd. Semi-Annual Report 2017
- 7 -
of RMB103,877,094,000, up 34% compared to H1 2016; and net profits attributable to the Company’s shareholders of
RMB11,457,951,000, representing a 21% year-on-year increase. According to an international professional evaluation
agency and the accounting standards for business enterprises, the amortization from purchase price allocation (PPA) of
the acquired assets for H1 2017 was recognized at RMB1,360,091,000.
In H1 2017, KUKA achieved operating revenue of RMB13,512,870,000 and net profits of RMB451,080,000, with the YoY
increase of respetively 35% and 98% (if exclusive of the extrordinary expense effect in H1 2016, net profit represents 35%
YoY growth). In the same period, TLSC earned operating revenue of RMB7,531,196,000 and net profits of RMB-
92,027,000, showing a continual improvement over H2 2016.
Total share outstanding of the Company on the last trading session before disclosure:
Number of total share outstanding of the Company on
the last trading session before disclosure (share) 6,542,190,987
Fully diluted earnings per share based on latest number
of total share outstanding above (RMB/share) 1.65
5. Differences in Accounting Data under Domestic and Foreign Accounting
Standards
5.1 Differences in Net Profits and Net Assets Disclosed in Financial Reports Prepared under
Domestic and International Accounting Standards
□ Applicable √ N/A
No such differences for the Reporting Period.
5.2 Differences in Net Profits and Net Assets Disclosed in Financial Reports Prepared under
Domestic and Foreign Accounting Standards
□ Applicable √ N/A
No such differences for the Reporting Period.
5.3 Reasons for Differences in Accounting Data under Domestic and Foreign Accounting
Standards
□ Applicable √ N/A
6. Non-recurring Gains and Losses
√ Applicable □ N/A

Midea Group Co., Ltd. Semi-Annual Report 2017
- 8 -
RMB'000
Item H1 2017 Note
Gains/Losses on disposal of non-current assets (inclusive of offset asset
impairment provisions) 759,055
Government grants accounted for, in gains or losses for current period
(exclusive of government grants closely related to the Company’s business
and given at fixed quotas or amounts as per government’s uniform
standards)
843,198
Gains/Losses on fair value changes of financial assets and liabilities held for
trading & investment income from disposal of financial assets and liabilities
held for trading as well as financial assets available for sale (exclusive of
effective hedges related to normal business operations of the Company)
-135,031
Other non-operating income and expenditure except above-mentioned
items -185,909
Less: Income tax effects 297,237
Minority interests effects (after tax) 64,520
Total 919,556 --
Explain the reasons if the Company classifies an item as a non-recurring gain/loss according to the
definition in the <Explanatory Announcement No. 1 on Information Disclosure for Companies Offering
Their Securities to the Public—Non-Recurring Gains and Losses>, or classifies any non-recurring
gain/loss item mentioned in the said explanatory announcement as a recurring gain/loss item:
□ Applicable √ N/A
No such cases for the Reporting Period.

Midea Group Co., Ltd. Semi-Annual Report 2017
- 9 -
Part III Business Profile
1. Business Scope for Reporting Period
Midea boasts a diversified offering, including consumer appliances centered on kitchen appliances,
refrigerators, washing machines and various small appliances; HVAC centered on household AC,
commercial AC, heating and ventilation systems; robots and automation systems with KUKA and joint
ventures with YASKAWA as the main producers; and smart supply chain systems centered on smart
integrated logistics solutions. Midea has approximately 130,000 employees around the world, about 200
subsidiaries and 11 strategic business units. Midea is also the largest shareholder of KUKA
Aktiengesellschaft (KUKA), a globally leading robot company in Germany, with an approximately 95%
stake in it. Upholding the principle of “Create Value for Customers”, Midea is committed to continual
technical innovations, the improvement of products and services, as well as a better life for consumers. It
provides satisfactory products and services for around 300 million consumers across the globe every
year.
Midea ranks No. 450 on the 2017 Fortune Global 500 list, a big step forward compared to No. 481 in
2016. And it is the only Chinese home appliance manufacturer who has made it on to the list twice in a
row. On the Forbes 2017 Global 2000 list, Midea is No. 335, beating down another 67 competitors on the
list from where it was last year. In addition, Midea has climbed to No. 30 on the WPP 2017 BrandZ™ Top
100 Most Valuable Chinese Brands list, making it the highest-ranking home appliance brand on that list
for a second consecutive year. Also, in the “National Brand Plan” launched by CCTV, China’s national
state-run television broadcaster, Midea is selected as one of the top 10 brands.
2. Significant Changes in Main Assets
2.1 Significant Changes in Main Assets
Main assets Reasons for any significant change
Equity assets Up 16.94% YoY, mainly due to acquisition of subsidiaries
Intangible assets Up 137.49% YoY, mainly due to acquisition of subsidiaries

Midea Group Co., Ltd. Semi-Annual Report 2017
- 10 -
Construction in progress Up 51.7% YoY, mainly due to acquisition of subsidiaries
2.2 Main Assets Overseas
□ Applicable √ N/A
3. Core Competitiveness Analysis
3.1 As one of the leaders among the global household appliance makers and a dominator in the
major appliance sectors, Midea Group provides high-quality, one-stop home solutions through
its wide product range, complete with full specifications.
As a white goods and HVAC enterprise with a whole industrial chain and full product line, Midea Group
has developed a complete industrial chain combining R&D, manufacturing and sales of key components
and finished products, supported by an industry-leading R&D centre and the manufacturing technology
of core components (such as compressors, electrical controls and magnetrons), and ultimately based on
its powerful capabilities in logistics and services. Midea is widely known as a top appliance and HVAC
brand in China. Its dominance in the major appliance and HVAC markets means that it can provide a
wide range of competitive product sets. It also means internal synergies in brand awareness, price
negotiation as a whole, customers’ needs research and R&D investments. Compatibility, coordination
and interaction among household appliances have become increasingly important since smart home is
gaining popularity. With a full product line, Midea has had a head start in providing a combined and
compatible e-home platform with integrated home solutions for customers.
3.2 Global R&D resource integration capabilities, continuing lead in R&D and technical
innovation
The Group is focused on building a competitive, multi-layered global R&D system centering on user
experience and product functions, which represents world-class R&D input and strength. With more than
RMB20 billion invested in R&D over the past five years, the Group has set up a total of 17 research
centers in eight countries, with its R&D employees over 10,000 and senior foreign experts over 300. And
the applications the Group has filed for white goods-related patents are second to none worldwide. While
building its own research centers around the world, the Group has also signed technical cooperation
agreements with scientific research institutions at home and abroad, such as MIT, UC Berkeley, UIUC,
Stanford, Purdue University, Tsinghua University and the Chinese Academy of Sciences, to establish

Midea Group Co., Ltd. Semi-Annual Report 2017
- 11 -
joint labs and build a global innovation ecosystem. The Group’s long-term focus on building technology,
marketing, product and open innovation systems, building a cutting-edge research system and building
reserves in technology for the mid and long term, has helped lay a solid foundation for the Group to
maintain technical superiority across the globe.
3.3 A stronger network of global operations developed and designed with Midea’s continual
global resource allocation and investments, globally-advanced manufacturing capabilities and
enormous business size
The success of a series of global acquisitions and new business expansion moves has further solidified
Midea’s global operations and leading advantages in robot manufacturing and automation. With the
world’s leading production capacity and experience, and a wide variety of products as well as its
production bases all over the world, the Group has been able to expand rapidly into the emerging
overseas markets and is becoming a stronger competitor in those mature markets. The Group is one of
the biggest manufacturers in the world for many product categories, which gives it its competitive edges
in efficiency and cost, that its overseas competitors are unable to compete with or replicate. Overseas
sales have accounted for nearly 50% of the Group’s total sales. Its products are exported to over 200
countries. In addition, with a deep knowledge and understanding about the characteristics and needs of
overseas markets, it is promoting overseas branding and expansion through overseas joint ventures set
up by seizing opportunities. In this way, it is increasing its global competitiveness step by step.
3.4 Broad channel networks ensuring the steady growth of Midea’s online and off-line sales
By virtue of years of development and investments, Midea Group has formed an all-dimensional market
coverage. In the mature first and second-tier markets, the Company has developed and maintained
good partnerships with large home appliance retail chains. While in the broad third and fourth-tier
markets, the Company uses flagship stores, specialty shops, traditional channels and new channels as
effective supplements. Already, the Company has achieved 100% coverage in first and second-tier
markets, as well as over 95% coverage in third and fourth-tier markets. Additionally, the Company's
dominance in branding, products, offline channels and logistics distribution have also created powerful
guarantees for the Company's rapid expansion of its e-commerce business and channels. Achieving the
highest online sales among China’s household appliance manufacturers, Midea’s online retail sales
exceeded RMB20 billion (around 25% of Midea’s total domestic sales) in H1 2017, a year-on-year

Midea Group Co., Ltd. Semi-Annual Report 2017
- 12 -
growth of 80%.
3.5 Sound corporate governance mechanism and effective incentive mechanism to provide a
solid foundation for Midea’s sustained and steady development
Paying close attention to the construction of a governance framework, regarding its corporate control,
centralization and decentralization systems, the Group formed a mature management system for
professional managers. The divisional system has been in operation for many years, and its
performance-oriented evaluation and incentive mechanism featuring full decentralization has become a
training and growth platform for the Group's professional managers. The Group's senior management
team consists of professional managers who have been trained and forged in the operational practices
of Midea Group. They have been working for Midea on average for more than 15 years, so they all have
rich industry and professional experience, a deep understanding of the home appliance industry
throughout both China and the world, and an accurate understanding of the industry’s functioning
environment and corporate operations management. The Company's advantages in systems and
mechanisms have laid a solid foundation for the efficient and effective business operations, as well as
the promising, stable and sustainable future development of the Company.
So far, the Company has launched four stock option incentive plans, one restricted stock incentive plan
and three senior management “partner” stock ownership plans for key managerial and technical
personnel, marking the establishment of a governance structure aligning the interests of management
and shareholders, as well as the formulation of an incentive scheme comprising long and short-term
incentives and restrains.

Midea Group Co., Ltd. Semi-Annual Report 2017
- 13 -
Part IV Performance Discussion and Analysis
1. Overview
1.1 Industry Overview
A. Home Appliance Industry
In H1 2017, with a stable domestic economy and a continued recovery in the world economy, home
appliance manufacturers carried on the supply-side structural reform by stimulating technical innovation
and adjusting product mix according to the shift in home appliance consumption. Despite pressure from
higher raw material costs, more stringent real estate control, etc., the KPIs of this industry registered
steady improvements in this period.
According to the China Household Electrical Appliance Association, H1 2017 saw stable retail sales of
home appliances, with the industry-wide sales revenue reaching RMB804.6 billion and the profits
generated amounting to RMB50.48 billion, recording impressive year-on-year growth of 16.02% and
9.63% respectively. With regard to white goods, data from China Market Monitor show that comparing
H1 2017 to H1 2016, air conditioners registered a fast sales growth of 31.9% due to re-stocking, high
temperature and previous low sales effects; washing machines recorded a solid 10.3% growth in retail
sales; refrigerators experienced flat retail sales with a 4.81% increase; and the sales of kitchen
appliances continued to see stable growth, with the retail sales of kitchen ranges and range hoods
expanding 11.34% and 12.42% respectively.
In 2017, the online retail sales of home appliances have continued to expand at a high speed, with the
H1 2017 figure accounting for 24.88% of the total retail sales. According to AVC, a research firm, as of
June 2017, major appliances such as air conditioners, refrigerators, washing machines, range hoods,
gas ranges and water heaters had recorded over 50% year-on-year growth in both online sales volume
and value, with the corresponding figures for air conditioners even exceeding 100%. In the H1 2017
Online Home Appliance Sales Analysis report released by China’s Ministry of Industry and Information
Technology, the country’s B2C online sales of home appliances reached RMB216 billion in H1 2017,
expanding 16.9% compared to H1 2016. It is also indicated in the report that there has been a marked
shift to high-end products on the home appliance market and domestic brands are gaining dominance.
Midea Group Co., Ltd. Semi-Annual Report 2017
- 14 -
China’s home appliance industry reported export sales of USD31.05 billion in H1 2017, up 7.7% from a
year earlier, hitting a historical high, which was mainly resulted by recovering foreign economies and
upgraded product mix. It is expected that China’s home appliance manufacturers will continue to seize
opportunities arising from the ongoing deep change in manufacturing worldwide, so as to promote their
brands and products across the world, and bring about a shift in export mix and growth driver from
products alone to combination of products, services, technology and capital, as well as from the price
advantage alone to comprehensive advantages in technology, brand, quality and service. With better
products and services, they will be able to explore the global market for new sources of growth.
B. Robotics Industry
Currently, there are more than 1,500,000 industrial robots in use around the world, and the number is
expected to surpass 2,300,000 by 2018, of which Asia will have 1,400,000 such robots, more than half of
the global number. As shown in the World Robotics Report 2016 unveiled by the International Federation
of Robotics, since 2013, China has been the world’s biggest robot consumer for five years in a row. With
a basically above 20% growth in size every year, China’s robot industry plays a significant role in the
growing size of the global robot industry. With regard to industrial robots, in particular, China saw an
output of 59,000 units in H1 2017, a year-on-year increase of 52%, indicating that China’s share of the
global industrial robot market has increased from a quarter to a third.
According to the International Federation of Robotics, China’s expected surging demand for robots is
attributed in part to its low robot density (only around 30 robots for every 10,000 workers, and for
comparison, that number for Germany is about 300). In this respect, South Korea leads with 531 robots
for every 10,000 workers, followed by Singapore (398 robots) and Japan (305 robots). The global
average is 69 robots for every 10,000 workers.
The World Health Organization has predicted that China may become, by 2050, the country that faces
the most serious problems caused by aging, with 35% of its population over 60 years old. These
problems may include labor shortages and rising labor costs, which will stimulate demand among
manufacturing enterprises for smart equipment including industrial robots. Prospects look promising for
China’s robot industry. In addition to carmaking, robots will be used increasingly in manufacturing of
general-purpose equipment, home appliances, electronics and rubber and plastic products. Robots are
also needed in labor-intensive textile and logistics industries, dangerous military and commercial
Midea Group Co., Ltd. Semi-Annual Report 2017
- 15 -
explosive sectors, pharmaceutical, semi-conductor and food industries that require a clean production
environment, as well as hazardous ceramic- and brick-making. Therefore, China’s industrial robot
market is expected to experience dramatic growth to become a market worth hundreds of billions in
RMB in the foreseeable future.
The output of homemade industrial robots is experiencing an explosion, with over 40 robot industrial
parks built or being built, as well as more than 800 robot companies, across China. But this is not
enough to send the country to the top of the global value chain for China has fewer six-or-more-joint
robots. The Japan-based FANUC and YASKAWA, KUKA controlled by Midea Group and the
Switzerland-based ABB, are the world’s four major robot manufacturers that control core components
and technologies for robots (electronic control systems, servomotors and decelerators), with their
products combined taking up over 65% of the Chinese market.
1.2 Analysis of the Company’s Main Business
In H1 2017, guided by the three main strategies of “Leading Products, Operational Efficiency and Global
Operations”, Midea focused on improving products, investigating customers’ needs, increasing inputs to
technology, promoting lean management and improving operations throughout the value chain. As a
result, all the business objectives set for the half year have been accomplished. The products have seen
fast growth in sales, indicators such as profits, operating cash flows, cash conversion cycle and channel
inventory have continued to improve, and the product quality and reputation have kept increasing.
Meanwhile, the effective integration of the newly acquired international subsidiaries has further solidified
Midea’s competitive edges with an enriched product range and global operations synergies. For the six
months ended 30 June 2017, Midea achieved, on a consolidated basis, operating revenues of
RMB124.964 billion, up 60.19% compared to H1 2016; and net profits of RMB10.811 billion attributable
to Midea exclusive of subsidiaries, a 13.85% year-on-year increase. The operating revenue and the net
profits attributable to Midea’s shareholders achieved by Midea exclusive of its recently acquired
international subsidiaries recorded 34% and 21% increases from a year earlier. According to an
international professional evaluation agency and the accounting standards for business enterprises, the
amortization of the M&A expense for H1 2017 was recognized at RMB1,360,091,000.
What Midea has accomplished in H1 2017 is summarized as follows:
A. Focusing on customers’ needs, Midea continued to optimize its product mix and steadily
Midea Group Co., Ltd. Semi-Annual Report 2017
- 16 -
improved product competitive advantages.
With regard to its residential air-conditioner business, Midea continuously increased R&D investment to
develop differentiated products tailored for consumers’ needs. The Midea iYouth Smart Cloud Air
Conditioner has won favor among young people for its smart control and slightest noise; the Midea
Power Saving King Air Conditioner has perfectly solved customers’ problems with better power saving
and dry cleaning functions, as well as a high cooling capacity; and the Midea Pure Wind Cloud Smart
Free Standing Air Conditioner is cleverly designed with strong cooling and a triple purification system to
provide surprisingly comfortable experience for customers. Relying on solid technological advantages
and bold innovations, Midea’s residential air conditioners have won recognition and awards from home
and abroad. Three of them have won the German iF Design Award, the highest award for product design
worldwide. During an EU conference on upgrading energy efficiency standards, Midea actively
participated in the establishment of new EU standards and called for energy efficiency upgrade for the
home appliance industry. In 2017, the Ministry of Science and Technology of China has granted Midea
the “Outstanding Private S&T Enterprise Award” and the “First Prize on Innovation”. At the 14th Top
China Real Estate Oscar, Midea was honored with the title of “First-Choice Residential Air Conditioner
Brand for China’s Real Estate Sector”. In addition, the two projects for research and industrialization of
key technology respectively of air conditioners for highly smart rooms and of noise-free one-piece air
conditioners completed by Midea’s residential air conditioner division have been recognized by a team of
experts gathered by the China National Light Industry Council at an “internationally leading level”.
In its commercial air conditioner business, with years of accumulation in technology, outstanding product
advantages and brand influence, Midea possesses over 1,000 patents and has won bids for a lot of
substantial projects worldwide, including 2014 FIFA World Cup, Games of the XXXI Olympiad, European
Youth Olympic Games and Milan EXPO 2015. And in 2017, we won the bid for 2018 FIFA World Cup,
which, once again, showcased our strong competitiveness. According to the online data, in the first half
of 2017, our market share of commercial air-conditioners was 18.7%, continuously taking a leading
position in this field. In the auxiliary market of real estate, we provided MDV X series commercial air
conditioner for villa and TR series for duplex apartment and big house. Besides, we also offered a string
of products tailored for customers differentiated needs, namely, the water heater driven by air energy,
integral AIO air purifier, household wall-hanging stove with gas as its energy and “electricity replacing

Midea Group Co., Ltd. Semi-Annual Report 2017
- 17 -
coal” ultra low temperature heater with air source heat pump. Midea offered professional solutions
covering air conditioner, water heater, new wind and heating in an all-round manner. During the
evaluation of the 14th Top China Real Estate Oscar, Midea commercial air conditioner was awarded the
title of “Excellent and First-choice Brand for Real Estate”. In the field of rail transit, Midea commercial air
conditioner became the outstanding brand which occupied the biggest market share in the high speed
train market. According to statistics, Midea commercial air conditioner covered 650 high-speed railway
stations in over 300 cities. And we also blanketed over 50% of the heating project for high-speed train.
Among the 44 cities which were entitled to build metro, we got orders from 20 cities, a coverage of 18
provinces with a percentage of 45% of its total. And hence, we claimed our fame as a brand of “entering
the most cities, covering the longest mileage in metro and enjoying the biggest blanket order”.
In terms of its washing machine business, Midea boasted many core technologies, including converter
technique, smart drive control, physical design and industrial design. With over 2,000 patents at hand,
we boasted the leading position in the washing machine industry. We, under the wing of excellent quality,
continued to push forward outstanding projects, increased investment in technical innovation and R&D,
improved product structure and enriched product layout of middle and high-end products. We tried to
find out the thorny problems of customers and the market demand through enhancing customer
research. We launched various products featured in cold water washing, antianaphylaxis, BLDC smart
frequency conversion, iclean smart cleaning, ultrasonic washing and classified washing. In 2017, Midea
fast&clean washing machine won the “Appliance Prize”, Little Swan roller washing machine with
integrated function of washing and dry-cleaning got the certification of allergen tests. Beverly roller
washing machine won the China Household Appliance Innovation Award and the wall-hanging washing
machine won a gold award of the 10th Jiangsu Patent Awards.
Regarding its refrigerator business, Midea continued to make new competitive products and took a
leading role in product up-gradation. Midea variable frequency BCD-629 refrigerator can provide the
customers with brand new experience through 360°sensitive temperature sensor, optimal cooling
capacity adjustment, long distance temperature control, expiry date reminder and online warranty. Midea
Vandelo BCD-532French-style refrigerator was the winner of Red Dot Design Award 2017with its
features of 90°door-opening, independent multifunction area, on-door make-up box, dedicate control of
temperature and humidity, full-open locker and hook face dynamic sterilized indicator. In China

Midea Group Co., Ltd. Semi-Annual Report 2017
- 18 -
Refrigerator Industry Symposium, 2017, Midea gained the title of 2016-2017 annual leading innovation
brand of the smart refrigerator industry. Midea 532 refrigerator obtained one prize of 2016-2017 annual
leading brand of the fresh refrigerator industry. Midea BCD-525 won the online award of “2016-2017
annual high-end smart bestseller”.
As for Midea’s small appliance business, with the improvement on technical innovation and the product
capacity, many small household appliances won the honor of IF design award, Red Dot award and
Appliance Prize, etc, which showcased our competitiveness. Midea “Aurora” kitchen cleaner with
“Skyeye detector”, featured in real time temperature variation, automatic adjustment, overall automation,
strong suction (20m³/min) and high-temperature steam cleaning, could solve the thorny problem for
customers. Midea M-box “cooking robot” electronic cooker, combined functions of rice recognition, rice
access, cleaning, water access and cooking, won a gold award of the Appliance Awards. Midea 105kpa
electronic pressure cooker with the function of fast cooking within 19 minutes and 121℃
high-temperature sterilization, ranked No. 1 of its kind from its launching day till now. Midea “Ironman”
and “Hot Hatch”, high-end cell wall breaker, was warmly welcomed by the market, because it has
multiple functions and highly efficiency on breaking the cell walls of food materials for cooking. And it
also ranked No.1 of its kind from its launching day till now. Midea “Qingyu” smart fan was tailored for the
needs and the children and the elderly with its double fan blade which enabled a gentle wind. It could be
used as a helper of the air conditioner in different temperatures. Midea installation-free dish washer with
many washing modes was specially designed for small families, because it can finish washing within 29
minutes and no need for installation. Midea Beverly G400E water purifier could provide water flow of
1L/min with its dedicate and small body and it provided users with water of 2 different quality. Midea
Beverly I8 water heater optimized customers’ experience for shower, since it had functions of 3.0T zero
cool water, constant temperature system and sine sound wave for denoising, and it also won the
Appliance Award 2017.
B. Midea continuously increased investment in and focused on R&D to improve its global R&D
network.
We continuously increased investment on R&D and R&D mechanism innovation. We pushed forward
the innovation on technology, users and products. What’s more, we also conducted opening innovation
system and technical innovation planning system. The 4th grade R&D systematic management model

Midea Group Co., Ltd. Semi-Annual Report 2017
- 19 -
was further enhanced. We focused on prior research and paid attention to middle and long term
technical reserve and long term competitiveness. Apart from research on core technology, we gave full
play to the transformation of R&D result, which helped us win many prizes and awards. In the first half of
2017, altogether 14 technologies got “the global advanced level” awards, including research and
industrialization on key integral mute technology, research and industrialization on key technology of IH
electronic cooker with nuclear boiling and cooking supply function, application of all-variable frequency
second-grade compression technique on multi-split air conditioner, research and application of
household kitchen ventilator smart steam cleaning technology, research on microwave oven variable
frequency power technology, modularizing easy-cleaning material and its application in the kitchen
appliance and AC no-polar variable frequency technology. In the industrial field, we had 14 industrial
designs got the IF award 2017, and 16 industrial designs won the Red Dot Award 2017.
In the first half of 2017, the company continued to drive international R&D arrangement, integrated
global R&D resources, and speeded up technical research and localized development. Hence, we made
many achievements, for example, in April, the office building of Silicon Valley Future Technology Center
was completed and unveiled its plaque. Louisville R&D Center moved into new office. In May, R&D
Research Institute was established and Midea RDICE Europe was set up at Graz, Austria. In June,
Midea User Experience Innovation (Shanghai) Lab unveiled its plaque. In July, R&D Center in Singapore
was established, up till now, we have 17 R&D Centers all around the world. Beside our arrangement on
the R&D Centers, we also signed technical cooperation agreement with top research institutes from
home and abroad, including MIT, UC Berkeley, UIUC, Stanford, Purdue University, Tsinghua University
and Chinese Academy of Sciences, and established joint labs for in-depth cooperation to create global
innovative ecosystem.
C. Midea continued to promote marketing and channel reform to improve its channel efficiency
and eventually realize fast growth in online sales.
The Company persistently promoted channel transformation, decreased offline channel hierarchy,
pushed forward direct sales on e-commerce and reduced channel inventory to improve the efficiency
substantially. In the first half of 2017, our product models declined for 24%, offline inventory decreased
for 51%, and channel circulation increased by 1.6 times compared to the same period of last year. Only
70 out of over 2,000 agencies had subletting. We advanced the operating system for our flagship stores,
Midea Group Co., Ltd. Semi-Annual Report 2017
- 20 -
in the first half of 2017, 200 new flagship stores were opened, and the sales revenue enjoyed a
year-on-year growth of 45%. With the TOP Club reaching its scale of 10 billion, we were committed to
creating the V200 Club for small and medium-sized chain stores to increase our coverage and enhance
terminal sales. In the first half of this year, the sales of V200 enjoyed a year-on-year growth of 27%. We
also promoted the sharing of distributors, sales channel, terminal resources, shopping guide, inventory
and logistics. Many commercial centers were set up to reduce the costs and expenses in a coordinated
manner. We gave full play to various advantages of different products to gain the common growth.
In the first half of 2017, with the help of overall arrangement of “online customer & order + offline flagship
store + logistic storage”, the big data platform supported by various products, improvement on users
operation system, exploration of targeted digital marketing assisted by users and big data, coupled with
the all-round marketing strategy of the readiness of offline products and the connectivity of orders and
users, our e-commerce retail revenue reached over 20 billion RMB, a year-on-year growth of 80%. We
maintained ranking the 1st on the network, and online sales accounted for 25% of the total income of our
company.
D. Midea improved its entire logistics platform, with the focus on building a shared inventory
system for all channels.
With the help of Annto smart platform, we positively caught the trend of “new retail”. We improved prompt
response of the whole value chain and the efficiency of channel inventory by online &offline inventory,
one set of system, one set of SKU, the “T+3”distribution mode, as well as integrated and shared
inventory resources. In the first half of 2017, the number of Annto logistic center increased from 78 to 111.
The establishment of new logistic centers further boosted the inner and outer inventory for customers
and fastened the efficiency of inventory and capital circulation. In the first half of this year, inventory area
decreased by 27% on a year-on-year basis, and the delivery and timeliness ratio reached 98%, which
showcased the capacity of smart logistics under the requirement of supply chain management.
The smart logistic system was further developed and applied. We carried out in-depth research on
integrated storage of big products, highly efficient sorting process for small products, automatic loading,
moveable AGV and analog simulation. Moreover, the Magic Center order management system, Magic
Space warehouse management system and Magic Control warehouse control system was delicately
created. Besides, we also conducted overall connectivity with the consignor, third party logistic company
Midea Group Co., Ltd. Semi-Annual Report 2017
- 21 -
(transport company/ driver) and the consignee. Hence, a modern and visible information system with
balanced core procedure was formed to provide integral service of software and hardware, and hence a
multi-win result was ensured. As for data operation, we successfully developed “KUNPENG” transparent
business analysis system, and it covered various scenarios, including warehouse, main delivery, branch
delivery, allocation, e-commerce and international business. Consequently, we could offer customers
smart order management, decision-making analysis, cloud arrangement and mobile transformation, by
doing so , we optimized the traditional IT information flow for customers.
E. Midea improved its smart home operations and carried on its smart home strategy.
In 2017, Midea continued to advance its smart home strategy, persistently optimized its cloud platform,
beautified homeware, communication module, smart security and after sale service to improve the
customer’s satisfaction. In 2017, Guangdong Provincial Department of Science and Technology named
Midea Smart Technology Co., Ltd as the IOT Smart Technology Research Center of Guangdong.
We continued to tap the market potential of smart household appliance, increased investment in R&D of
smart household appliance, maintained input on market resource and carried out the IOT Wi-Fi security
chip. Midea M-Smart security system was a forerunner in obtaining level-A certification from the “Smart
Household Appliance Information Security” program. We persistently boosted the development of
M-smart platform ecosystem and further opened the M-smart system to the outside world. Besides, we
also enhanced the cooperation on cloud matching, third party mobile terminal management, smart
access of hardware and bringing in resources from the third parties. The number of our accumulated
M-smart partners reached 105. We maintained strategic partnership with China Mobile, Huawei, State
Grid Corporation of China, COFCO and Onstar. We positively explored the overall arrangement for
full-house smart houseware and provided comprehensive solution in this regard. The nationwide sales
system was established, which had already entered the real estate companies, including Hengda,
Country Garden, and Vanke. And the solution for smart homeware package, smart sharing & renting,
smart hardware and smart core module was formed.
F. Midea improved its overseas operations by promoting better compliance with laws and
regulations, as well as by beefing up the integration of the newly acquired international
subsidiaries.
We insisted on the global business strategy, explored the overseas market for self-owned brands, gave

Midea Group Co., Ltd. Semi-Annual Report 2017
- 22 -
full play to the coordination of overseas subsidiaries and product management department, enhanced
the localized and individualized design with customers as its core and optimized product structure to
ensure that the overseas income could enjoy a solid growth. In the first half of 2017, sales from the
targeted market witnessed a double-digit growth. At the same time, the overseas operation capacity
gained a solid development and the popularity of our brand increased.
The global compliance system was enhanced. We applied the international standard on anti-damping,
anti-corruption, export control and product liability. We drew a limitation to prevent serious compliance
risks from happening. The overseas operation organization and the marketing management system was
advanced, while the operation mode was localized. We established offices, sole proprietorship
marketing company and JV marketing company, which covered the world market. Meanwhile, we
systematized and processed the management of brand establishment, product launching, distribution
channel, retail store and terminal shopping guidance, and hence, we were determined to improve the
overall capacity of the value chain.
We insisted on boosting the merger and acquisition of Toshiba home appliance, Italian Clivet, Israel
Servotronix and Eureka in North America. The process reengineering was advanced, and the
coordination on brand, channel, R&D innovation and supply chain of the acquisition project and product
department was accelerated. Among all of them, 50 complementary projects between Toshiba home
appliance and Midea product department were carried out. In the first half of this year, we successfully
launched washing machine, dust collector, refrigerator, microwave oven and freezer. Meanwhile, we
established a business division for cleaning appliance with the industrial forerunner as our benchmark.
We made a market layout, and gave full play to the complementary advantages of Midea products and
technology of Toshiba. By doing so, we expected our income from dust collector could reach 10 billion
RMB by 2021, and making us a front runner in this field.
G. Midea seized opportunities arsing from the thriving robot and automation industry across the
world, and achieved rapid growth in its robot business as a result.
We comprehensively promoted the fast growth of KUKA robot. In the first half of 2017, it enjoyed a
year-on-year growth of 34.9%, reaching a historic high. And we received on-going orders and the
increase rate was 16%. We boomed the business by smart manufacturing application, clients resource
sharing, logistics and medical treatment automation and coordinating the resource and support from the

Midea Group Co., Ltd. Semi-Annual Report 2017
- 23 -
government.
Midea Robotics Co., Ltd was established to give full play to smart logistics robots and the market of
rehabilitation and caring for the elderly. Besides, we also integrated the inner and outer resources to
develop products with market potential. Currently, the model machine of the logistic robots was under
testing, and later, we would allocate them in the nationwide warehouses of Annto. Furthermore, 2
products tailored for rehabilitation and caring of the elderly obtained the medical equipment certificates,
and they were deeply favored by the market.
H. Midea improved its operations throughout the value chain.
We put market and users first and continued to boost “T+3” production and marketing transformation, as
well as product development on CDOC(Concept, Design, Optimize, Capability). And we also promoted
MBS (Midea Business System) lean manufacturing, simplified our operation, optimized supply chain,
improved our terminal and flattened our channel. We boosted digitization, on-line normalization and
standardization for all of our business to polish our advantages on remarkable operation.
I. Midea improved its corporate governance sysem and long-term incentive mechanism.
In 2017, besides the 1st term of restricted stock plan and the 4
thterm of stock option incentive plan for its
medium and high-level executives as well as key-business employees, Midea continued to carry out the
3rd
term of “partner” stock ownership plan for its core management personnel that played a significant
role in the Company’s medium and long-term business performance, to encourage them to develop and
grow with the company together. Besides, we established a mechanism to ensure the long-term and
consistent benefit among the executives, core business personnel and all of the shareholders, and
hence, the company governance would welcome in further improvement.
Midea’s main work plans for H2 2017 are summarized as follows:
A. increasing investments in and strengthening R&D of products needed by users in the ongoing
structural upgrade in consumption, to ensure the steady improvement of product competitiveness;
seizing opportunities in the rise of new home appliances to maintain advantages in differentiation and
size by organic means;
B. further improving operations throughout the value chain by focusing on inventory structure
optimization, cash conversion cycle shortening, overheads reduction, profitability increase, cost and
efficiency improvement and synergies tapping;
Midea Group Co., Ltd. Semi-Annual Report 2017
- 24 -
C. continuously carrying on the global operations through effective integration of the newly acquired
international subsidiaries and prevention of irregularities, to increase brand awareness and
competitiveness across the globe; and
D. continuously improving corporate structure and systems, paying attention to the training of talents and
recruitment of professionals, improving the corporate atmosphere and innovating long term incentive
plans.
2. Analysis of Main Business
Overview:
Same with the contents presented in “1. Overview” of this part:
√ Yes □ No
See “1. Overview” of this part.
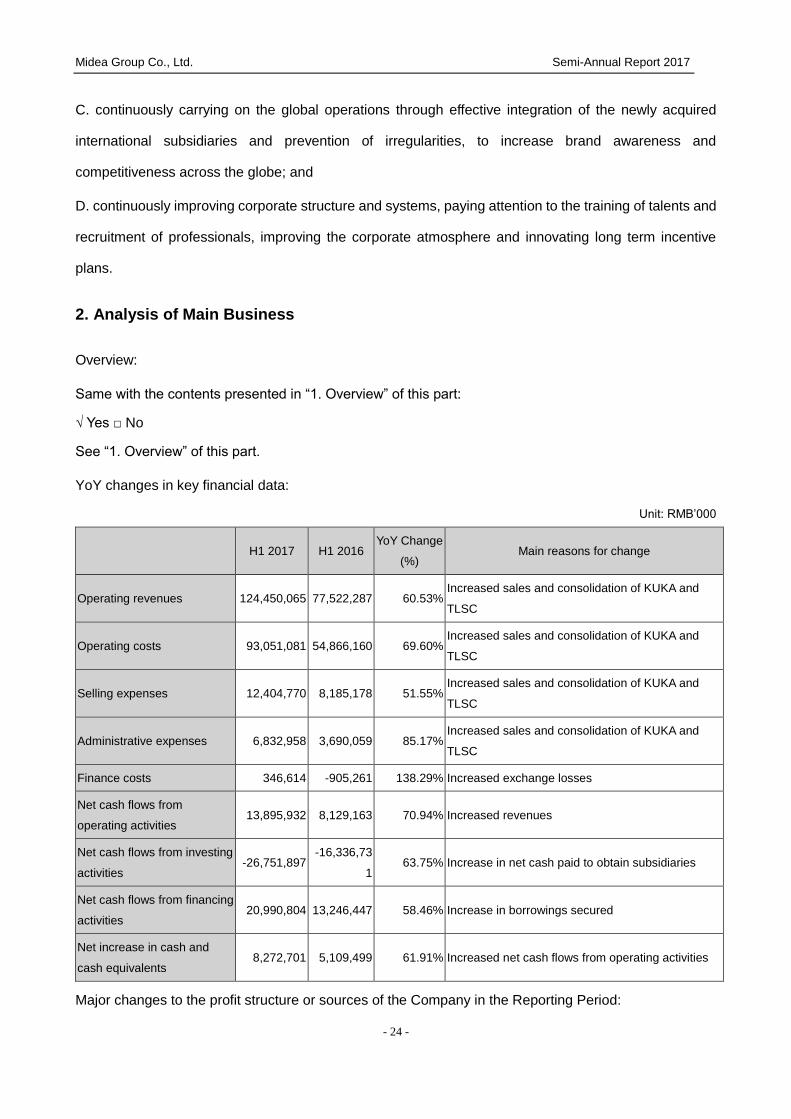
YoY changes in key financial data:
Unit: RMB’000
H1 2017 H1 2016 YoY Change
(%) Main reasons for change
Operating revenues 124,450,065 77,522,287 60.53% Increased sales and consolidation of KUKA and
TLSC
Operating costs 93,051,081 54,866,160 69.60% Increased sales and consolidation of KUKA and
TLSC
Selling expenses 12,404,770 8,185,178 51.55% Increased sales and consolidation of KUKA and
TLSC
Administrative expenses 6,832,958 3,690,059 85.17% Increased sales and consolidation of KUKA and
TLSC
Finance costs 346,614 -905,261 138.29% Increased exchange losses
Net cash flows from
operating activities 13,895,932 8,129,163 70.94% Increased revenues
Net cash flows from investing
activities -26,751,897
-16,336,73
1 63.75% Increase in net cash paid to obtain subsidiaries
Net cash flows from financing
activities 20,990,804 13,246,447 58.46% Increase in borrowings secured
Net increase in cash and
cash equivalents 8,272,701 5,109,499 61.91% Increased net cash flows from operating activities
Major changes to the profit structure or sources of the Company in the Reporting Period:

Midea Group Co., Ltd. Semi-Annual Report 2017
- 25 -
□ Applicable √ Inapplicable
No such cases in the Reporting Period.
Breakdown of Midea’s main business:
Unit: RMB'000
Operating
revenue Operating cost
Gross
margin (%)
YoY change in
operating
revenue (%)
YoY change in
operating cost
(%)
YoY change
in gross
margin (%)
By business segment
Manufacturing 115,456,202 84,704,701 26.63% 63.39% 73.27% -4.18%
Others 1,078,404 1,033,539 4.16% 19.15% 23.59% -3.44%
By product
HVAC 50,022,802 35,410,252 29.21% 41.52% 48.64% -3.39%
Consumer appliances 51,827,140 37,688,678 27.28% 46.75% 50.38% -1.75%
Robotics and automatic
systems 13,606,260 11,605,771 14.70% - - -
Others 1,078,404 1,033,539 4.16% 19.15% 23.59% -3.44%
By geographical segment
PRC 61,071,521 41,470,376 32.10% 51.76% 58.51% -2.88%
Other countries and regions 55,463,085 44,267,864 20.18% 77.05% 87.91% -4.62%
Note: Consumer appliances primarily include refrigerators, washing machines, kitchen appliances and certain small home
appliances.
3. Analysis of Non-Core Business
□ Applicable √ N/A
4. Assets and Liabilities
4.1 Material Changes of Asset Items
Unit: RMB'000
30 June 2017 31 December 2016 Change in
percentage
(%)
Explanation
about any
material change Amount
As a percentage of
total assets (%) Amount
As a percentage
of total assets
(%)
Cash at bank
and on hand 34,219,018 14.81% 27,169,118 15.93% -1.12%

Midea Group Co., Ltd. Semi-Annual Report 2017
- 26 -
Accounts
receivable 19,380,874 8.39% 13,454,511 7.89% 0.50%
Inventories 20,885,038 9.04% 15,626,897 9.16% -0.12%
Investment
property 480,814 0.21% 494,122 0.29% -0.08%
Long-term
equity
investments
2,586,329 1.12% 2,211,732 1.30% -0.18%
Fixed assets 22,603,151 9.78% 21,056,791 12.34% -2.56%
Construction in
progress 880,939 0.38% 580,729 0.34% 0.04%
Short-term
borrowings 32,391,950 14.02% 3,024,426 1.77% 12.25%
Long-term
borrowings 4,036,714 1.75% 2,254,348 1.32% 0.43%
4.2 Assets and Liabilities Measured at Fair Value
√ Applicable □ N/A
Unit: RMB'000
Item Opening
balance
Gain/loss
on
change in
fair value
during
the
period
Cumulative
fair value
change
charged to
equity
Other
Purchased
in the
period
Sold in the
period
Closing
balance
Financial assets
1. Financial assets at fair value
through gains/losses (exclusive of
derivative financial assets)
2. Derivative financial assets 424,163 -156,236 176,121 74,433 - - 518,481
3. Financial assets available for sale 33,627,760 628,641 69,063 -3,453,92
8 17,374,199 17,163,908
31,081,82
7
Sub-total of financial assets 34,051,923 472,405 245,184 -3,379,49
5 17,374,199 17,163,908
31,600,30
8
Investment property
Productive living assets
Others

Midea Group Co., Ltd. Semi-Annual Report 2017
- 27 -
Sub-total of above 34,051,923 472,405 245,184 -3,379,49
5 17,374,199 17,163,908
31,600,30
8
Financial liabilities 96,102 -146,713 -6,023 100,609 - - 43,975
Whether there were any material changes on the measurement attributes of major assets of the
Company during the Reporting Period:
□ Yes √ No
4.3 Restricted Asset Rights as of End of Reporting Period
As of the end of the Reporting Period, there were no such circumstances where any main assets of the
Company were sealed, distrained, frozen, impawned, pledged or limited in any other way.
5. Analysis of Investments
5.1 Total Investments Made
√ Applicable □ N/A
Investments made in H1 2017
(RMB’000)
Investments made in H1 2016
(RMB’000) YoY Change
69,512,207 46,226,607 50.37%
5.2 Significant Equity Investments Made in Reporting Period
√ Applicable □ N/A
Unit: RMB'000
Investe
e
Main
busine
ss of
investe
e
Way of
invest
ment
Amount of
investment
The
Compa
ny’s
shareho
lding
percent
age
Sourc
e of
invest
ment
funds
Join
t
hold
er
Term
of
invest
ment
Type
of
invest
ee’s
produ
cts
Progres
s as of
balance
sheet
date
Projec
ted
earnin
gs
Gain/lo
ss for
the
period
Laws
uits
involv
ed
Disclo
sure
date
(if
any)
Index
to
discl
osed
infor
matio
n (if
any)
KUKA
Smart
autom
ation
Acquis
ition in
cash
27,001,856 81.04% Borro
wings
Non
e
Longl
asting
Smart
autom
ation
Comple
ted N/A 451,080 None - -
SMC
Motion
control
system
s
Acquis
ition in
cash
901,794 79.37% Borro
wings
Non
e
Longl
asting
Motio
n
contro
l
Comple
ted N/A -4,137 None - -
Midea Group Co., Ltd. Semi-Annual Report 2017
- 28 -
syste
ms
Total -- -- 27,903,650 -- -- -- -- -- -- - 446,943 -- -- --
5.3 Significant Non-Equity Investments Ongoing in Reporting Period
□ Applicable √ N/A
5.4 Financial Investments
5.4.1 Securities Investments
□ Applicable √ N/A
No such cases in the Reporting Period.
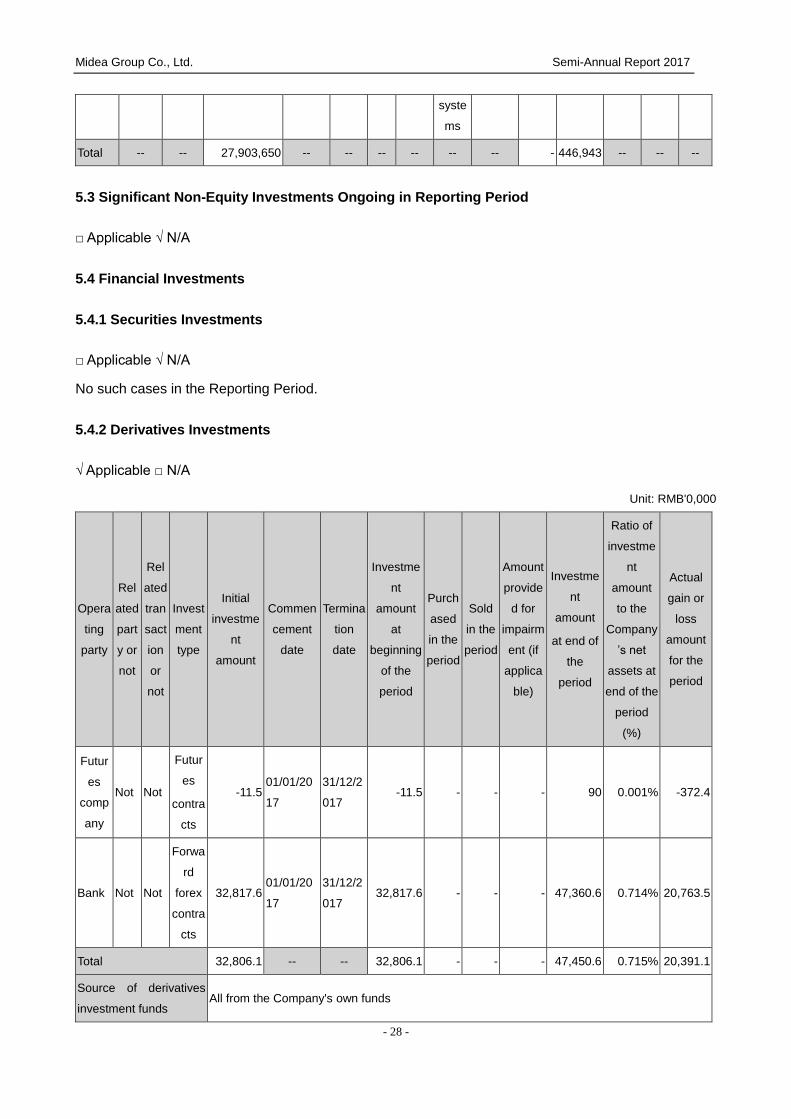
5.4.2 Derivatives Investments
√ Applicable □ N/A
Unit: RMB'0,000
Opera
ting
party
Rel
ated
part
y or
not
Rel
ated
tran
sact
ion
or
not
Invest
ment
type
Initial
investme
nt
amount
Commen
cement
date
Termina
tion
date
Investme
nt
amount
at
beginning
of the
period
Purch
ased
in the
period
Sold
in the
period
Amount
provide
d for
impairm
ent (if
applica
ble)
Investme
nt
amount
at end of
the
period
Ratio of
investme
nt
amount
to the
Company
’s net
assets at
end of the
period
(%)
Actual
gain or
loss
amount
for the
period
Futur
es
comp
any
Not Not
Futur
es
contra
cts
-11.5 01/01/20
17
31/12/2
017 -11.5 - - - 90 0.001% -372.4
Bank Not Not
Forwa
rd
forex
contra
cts
32,817.6 01/01/20
17
31/12/2
017 32,817.6 - - - 47,360.6 0.714% 20,763.5
Total 32,806.1 -- -- 32,806.1 - - - 47,450.6 0.715% 20,391.1
Source of derivatives
investment funds All from the Company's own funds
Midea Group Co., Ltd. Semi-Annual Report 2017
- 29 -
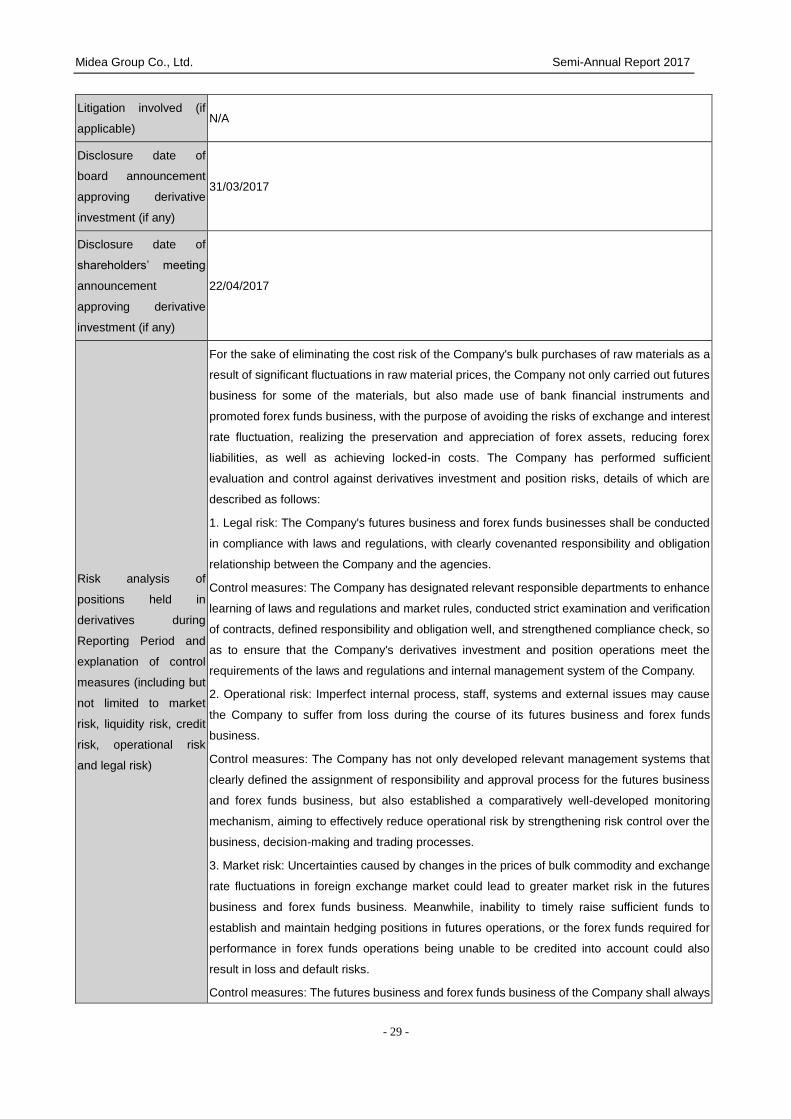
Litigation involved (if
applicable) N/A
Disclosure date of
board announcement
approving derivative
investment (if any)
31/03/2017
Disclosure date of
shareholders’ meeting
announcement
approving derivative
investment (if any)
22/04/2017
Risk analysis of
positions held in
derivatives during
Reporting Period and
explanation of control
measures (including but
not limited to market
risk, liquidity risk, credit
risk, operational risk
and legal risk)
For the sake of eliminating the cost risk of the Company's bulk purchases of raw materials as a
result of significant fluctuations in raw material prices, the Company not only carried out futures
business for some of the materials, but also made use of bank financial instruments and
promoted forex funds business, with the purpose of avoiding the risks of exchange and interest
rate fluctuation, realizing the preservation and appreciation of forex assets, reducing forex
liabilities, as well as achieving locked-in costs. The Company has performed sufficient
evaluation and control against derivatives investment and position risks, details of which are
described as follows:
1. Legal risk: The Company's futures business and forex funds businesses shall be conducted
in compliance with laws and regulations, with clearly covenanted responsibility and obligation
relationship between the Company and the agencies.
Control measures: The Company has designated relevant responsible departments to enhance
learning of laws and regulations and market rules, conducted strict examination and verification
of contracts, defined responsibility and obligation well, and strengthened compliance check, so
as to ensure that the Company's derivatives investment and position operations meet the
requirements of the laws and regulations and internal management system of the Company.
2. Operational risk: Imperfect internal process, staff, systems and external issues may cause
the Company to suffer from loss during the course of its futures business and forex funds
business.
Control measures: The Company has not only developed relevant management systems that
clearly defined the assignment of responsibility and approval process for the futures business
and forex funds business, but also established a comparatively well-developed monitoring
mechanism, aiming to effectively reduce operational risk by strengthening risk control over the
business, decision-making and trading processes.
3. Market risk: Uncertainties caused by changes in the prices of bulk commodity and exchange
rate fluctuations in foreign exchange market could lead to greater market risk in the futures
business and forex funds business. Meanwhile, inability to timely raise sufficient funds to
establish and maintain hedging positions in futures operations, or the forex funds required for
performance in forex funds operations being unable to be credited into account could also
result in loss and default risks.
Control measures: The futures business and forex funds business of the Company shall always

Midea Group Co., Ltd. Semi-Annual Report 2017
- 30 -
be conducted by adhering to prudent operation principles. For futures business, the futures
transaction volume and application have been determined strictly according to the
requirements of production & operations, and the stop-loss mechanism has been implemented.
Besides, to determine the prepared margin amount which may be required to be
supplemented, the futures risk measuring system has been established to measure and
calculate the margin amount occupied, floating gains and losses, margin amount available and
margin amount required for intended positions. As for forex funds business, a hierarchical
management mechanism has been implemented, whereby the operating unit which has
submitted application for funds business should conduct risk analysis on the conditions and
environment affecting operating profit and loss, evaluate the possible greatest revenue and
loss, and report the greatest acceptable margin ratio or total margin amount, so that the
Company can update operating status of the funds business on a timely basis to ensure proper
funds arrangement before the expiry dates.
Changes in market
price or fair value of
derivatives product
invested during
Reporting Period:
specific methods used
and relevant
assumption and
parameter settings shall
be disclosed for
analysis of fair value of
derivatives
1. Gains/losses on futures hedging contracts incurred during the Reporting Period were
RMB-3,724,000.
2. Gains/losses on forward forex contracts incurred during the Reporting Period were
RMB207,635,000.
3. Public quotations in futures market or forward forex quotations announced by the Bank of
China are used in the analysis of derivatives fair value.
Explanation of
significant changes in
accounting policies and
specific financial
accounting principles in
respect of the
Company's derivatives
for Reporting Period
compared to last
reporting period
No change
Special opinions
expressed by
independent directors
concerning the
Company's derivatives
investment and risk
control
The Company's independent directors are of the view that the futures hedging business is an
effective instrument for the Company to eliminate price volatility and implement risk prevention
measures through enhanced internal control, thereby improving the operation and
management of the Company; the Company's foreign exchange risk management capability
can be further improved through the forex funds business, so as to maintain and increase the
value of foreign exchange assets and the abovementioned investment in derivatives can help
the Company to fully bring out its competitive advantages. Therefore, it is practicable for the
Company to carry out derivatives investment business, and the risks are controllable.

Midea Group Co., Ltd. Semi-Annual Report 2017
- 31 -
6. Sale of Major Assets and Equity Interests
6.1 Sale of Major Assets
□ Applicable √ N/A
No such cases in the Reporting Period.
6.2 Sale of Major Equity Interests
□ Applicable √ N/A
7. Analysis of Major Subsidiaries
√ Applicable □ N/A
Main subsidiaries and joint stock companies with an over 10% influence on the Company’s net profit:
Company name Company
type
Business
scope Industry
Registered
capital
(RMB'0,000)
Total
assets
(RMB
million)
Net
assets
(RMB
million)
Operating
Revenue
(RMB
million)
Operating
profit
(RMB
million)
Net
profit
(RMB
million)
Guangdong Midea
Kitchen Appliances
Manufacturing Co.,
Ltd.
Subsidiar
y
Manufact
uring of
home
appliance
s
Home
appliance USD7,200
10,367.1
9 2,091.78 7,750.85 1,059.93 930.12
Guangdong Midea
Refrigeration
Equipment Co., Ltd.
Subsidiar
y
Manufact
uring of
air
condition
ers
Home
appliance RMB85,400
34,918.7
0 3,346.66
19,448.6
4 351.00 405.83
Foshan Shunde
Midea Electric
Appliance
Manufacturing Co.,
Ltd.
Subsidiar
y
Manufact
uring of
home
appliance
s
Home
appliance USD4,200 6,010.46 2,741.25 4,532.67 764.51 652.38
Wuhu Midea
Kitchen & Bathroom
Electric Appliances
Manufacturing Co.,
Ltd.
Subsidiar
y
Manufact
uring of
water
heaters
Home
appliance RMB6,000 4,331.85 800.74 4,028.40 693.75 653.33
Acquisition and disposal of subsidiaries during the Reporting Period:

Midea Group Co., Ltd. Semi-Annual Report 2017
- 32 -
√ Applicable □ N/A
For the Reporting Period, the newly consolidated subsidiaries are: Guangdong Midea Electric Co., Ltd.,
Guangdong Midea Smart Robots Co., Ltd., Chongqing Midea Microcredit Co., Ltd., Guangdong Midea
GiMAY Technology Co., Ltd., Hefei Midea Smart Technology Co., Ltd., Guangdong Midea Kafei Coffee
Machine Manufacturing Co., Ltd., Midea Electric Netherlands (I) B.V., KUKA Aktiengesellschaft and its
subsidiaries, Easy Conveyors B.V. and Servotronix and its subsidiaries. For details, see (1) and (2) (a) in
Note 5 to the financial statements herein. Meanwhile, subsidiary Wuhu Bainian Technology
Development Co., Ltd. has been dissolved and thus deconsolidated. See (2) (b) in Note 5 to the financial
statements herein for details.
8. Structured Bodies Controlled by the Company
□ Applicable √ N/A
9. Forecast of Business Performance from January to September in 2017
Warning about an estimated major change in the aggregate net profit from the beginning of the year to
the end of the next reporting period compared with the same period in the previous year and explanation
for the change:
□ Applicable √ N/A
10. Risks Facing the Company and Countermeasures
A. Risk of Macro Economy Fluctuation
Owing to uncertain recovery in the global economy, the downward pressure on domestic economic
growth, China’s tightening real estate controls, political and economic chaos across the world, etc., the
sluggish consumer market may continue, which could lead to a lack of momentum in growth of the home
appliance industry.
B. Risks in Fluctuation of Production Factors
The raw materials required by Midea Group to manufacture its consumer appliances and core
components primarily include different grades of copper, steel, aluminum, and plastics. At present, the
household appliance manufacturing sector belongs to a labor intensive industry. If the price of raw
materials fluctuate largely, or there is a large fluctuation in the cost of production factors (labor, water,

Midea Group Co., Ltd. Semi-Annual Report 2017
- 33 -
electricity, and land) caused by a change to the macroeconomic environment and policy change, or the
cost reduction resulted from lean production and improved efficiency, as well as the sale prices of end
products cannot offset the total effects of cost fluctuations, the Company’s business will be influenced to
some degree.
C. Risk in Global Asset Allocation and Overseas Market Expansion
Internationalization and global operations is a long-term strategic goal of the Company. The Company
has built joint-venture manufacturing bases in many countries around the world. It has also conducted a
series of significant acquisitions to promote new business, enlarge its global market share, expand its
channels and seek greater brand recognition. However, its efforts in global resource integration may not
be able to produce expected synergies; and in overseas market expansion, there are still unpredictable
risks such as local political and economic situations, significant changes in law and regulation systems,
and sharp increases in production costs.
D. Risk in Product Export and Foreign Exchange Losses Caused by Exchange Rate Fluctuation
As Midea carries on with its overseas expansion plan, its export revenue is expected to account for over
50% of the total revenues. Any sharp exchange rate fluctuation might not only bring negative effects on
the export of the Company, but could also lead to exchange losses and increase its finance costs.

Midea Group Co., Ltd. Semi-Annual Report 2017
- 34 -
Part V Significant Events
1. Annual and Special Meetings of Shareholders Convened during Reporting Period
1.1 Meetings of Shareholders Convened during Reporting Period
Meeting Type
Investor
participati
on ratio
Convened date Disclosure date Index to disclosed information
2016 Annual
Meeting of
Shareholders
Annual 45.2524
% 21/04/2017 22/04/2017
Announcement No. 2017-017 on
Resolutions of 2016 Annual Meeting
of Shareholders, disclosed on
www.cninfo.com.cn
1.2 Special Meetings of Shareholders Convened at Request of Preference Shareholders with
Resumed Voting Rights
□ Applicable √ N/A
2. Proposal on Profit Distribution and Converting Capital Reserves into Share Capital
for Reporting Period
□ Applicable √ N/A
The Company plans not to distribute cash dividends or bonus shares or convert capital reserves into
share capital for the first half of 2017.
3. Undertakings of the Company’s Actual Controller, Shareholders, Related Parties
and Acquirer, as well as the Company and Other Commitment Makers Fulfilled in
Reporting Period or Overdue as of Period-End
□ Applicable √ N/A
No such cases in the Reporting Period.
4. Engagement and Disengagement of CPAs Firm
Have the H1 2017 financial statements been audited by a CPAs firm?
□ Yes √ No
The H1 2017 financial statements are unaudited by a CPAs firm.
Midea Group Co., Ltd. Semi-Annual Report 2017
- 35 -
5. Explanation of Board of Directors and Supervisory Board Regarding "Modified
Audit Opinion" for Reporting Period
□ Applicable √ N/A
6. Explanation of Board of Directors Regarding "Modified Audit Opinion" for Last
Year
□ Applicable √ N/A
7. Bankruptcy and Reorganization
□ Applicable √ N/A
No such cases in the Reporting Period.
8. Legal Matters
Material litigations and arbitrations involved:
□ Applicable √ N/A
No such cases in the Reporting Period.
Other legal matters:
□ Applicable √ N/A
9. Punishments and Rectifications
□ Applicable √ N/A
No such cases in the Reporting Period.
10. Credit Conditions of the Company as well as Its Controlling Shareholder and
Actual Controller
□ Applicable √ N/A
11. Implementation of Equity Incentive Plans, Employee Stock Ownership Plans or
Other Incentive Measures for Employees
√ Applicable □ N/A
A. Overview of First Stock Option Incentive Plan
Midea Group Co., Ltd. Semi-Annual Report 2017
- 36 -
a. The Company convened the 20th Meeting of the 2
nd Board of Directors on 29 March 2017, at which the
Proposal for the Adjustments to the Incentive Receivers and Their Exercisable Stock Options of the First
Stock Option Incentive Plan was reviewed and approved. As such, it was agreed to adjust the incentive
receivers and their exercisable stock options for the First Stock Option Incentive Plan due to the
departure, positional changes, low performance appraisals or other factors of some incentive receivers.
Upon the adjustments, the number of incentive receivers decreased from 562 to 518, and the number of
locked-up stock options granted to them was also reduced from 40,957,500 to 37,518,750.
The Proposal for Matters Related to the Stock Option Exercise for the Third Exercise Period of the First
Stock Option Incentive Plan was also considered and approved. Because the exercise conditions have
grown mature for the third exercise period, a total of 514 incentive receivers who have ascertained and
verified the First Stock Option Incentive Plan have been allowed to exercise 37,518,750 stock options in
the third exercise period (ended 17 February 2019).
b. On 3 May 2017, the Announcement on the 2016 Annual Profit Distribution was disclosed by the
Company, with a decision to distribute a cash dividend of RMB10.00 per 10 shares to all the
shareholders based on the total of 6,465,677,368 shares of the Company. The book closure date was 9
May 2017 and the ex-dividend date was 10 May 2017.
The Company convened the 22nd
Meeting of the 2nd
Board of Directors on 12 May 2017, at which the
Proposal for the Adjustments to the Exercise Price for the First Stock Option Incentive Plan was
reviewed and approved. As the 2016 Annual Profit Distribution had been carried out, the exercise price
for the First Stock Option Incentive Plan was revised from RMB11.01 to RMB10.01 per share.
c. On 24 May 2017, the exercise conditions grew mature for the third exercise period of the First Stock
Option Incentive Plan. Upon examination by the Shenzhen Stock Exchange and the Shenzhen branch of
China Securities Depository and Clearing Co., Ltd., the third exercise period of the First Stock Option
Incentive Plan started on 24 May 2017. In the Reporting Period, 23,706,509 stock options have been
exercised.
B. Overview of Second Stock Option Incentive Plan
a. The Company convened the 22nd
Meeting of the 2nd
Board of Directors on 12 May 2017, at which the
Proposal for the Adjustments to the Exercise Price for the Second Stock Option Incentive Plan was
reviewed and approved. As the 2016 Annual Profit Distribution had been carried out, the exercise price
Midea Group Co., Ltd. Semi-Annual Report 2017
- 37 -
for the Second Stock Option Incentive Plan was revised from RMB19.56 to RMB18.56 per share.
b. The Company convened the 23rd
Meeting of the 2nd
Board of Directors on 1 June 2017, at which the
Proposal for the Adjustments to the Incentive Receivers and Their Exercisable Stock Options of the
Second Stock Option Incentive Plan was reviewed and approved. As such, it was agreed to adjust the
incentive receivers and their exercisable stock options for the Second Stock Option Incentive Plan due to
the departure, positional changes, low performance appraisals or other factors of some incentive
receivers. Upon the adjustments, the number of incentive receivers decreased from 639 to 583, and the
number of locked-up stock options granted to them was also reduced from 72,810,000 to 66,195,000.
The Proposal for Matters Related to the Stock Option Exercise for the Second Exercise Period of the
Second Stock Option Incentive Plan was also considered and approved. Because the exercise
conditions have grown mature for the second exercise period, a total of 577 incentive receivers who
have ascertained and verified the Second Stock Option Incentive Plan have been allowed to exercise
32,940,000 stock options in the second exercise period (ended 27 May 2019).
c. On 9 June 2017, the exercise conditions grew mature for the second exercise period of the Second
Stock Option Incentive Plan. Upon examination by the Shenzhen Stock Exchange and the Shenzhen
branch of China Securities Depository and Clearing Co., Ltd., the second exercise period of the Second
Stock Option Incentive Plan started on 9 June 2017. In the Reporting Period, 22,027,187 stock options
have been exercised.
C. Overview of Third Stock Option Incentive Plan
a. The Company convened the 22nd
Meeting of the 2nd
Board of Directors on 12 May 2017, at which the
Proposal for the Adjustments to the Exercise Price for the Third Stock Option Incentive Plan was
reviewed and approved. As the 2016 Annual Profit Distribution had been carried out, the exercise price
for the Third Stock Option Incentive Plan was revised from RMB21.35 to RMB20.35 per share.
b. The Company convened the 24th Meeting of the 2
nd Board of Directors on 29 June 2017, at which the
Proposal for the Adjustments to the Incentive Receivers and Their Exercisable Stock Options of the
Third Stock Option Incentive Plan was reviewed and approved. As such, it was agreed to adjust the
incentive receivers and their exercisable stock options for the Third Stock Option Incentive Plan due to
the departure, positional changes, low performance appraisals or other factors of some incentive
receivers. Upon the adjustments, the number of incentive receivers decreased from 929 to 891, and the

Midea Group Co., Ltd. Semi-Annual Report 2017
- 38 -
number of locked-up stock options granted to them was also reduced from 127,290,000 to 121,485,000.
The Proposal for Matters Related to the Stock Option Exercise for the First Exercise Period of the Third
Stock Option Incentive Plan was also considered and approved. Because the exercise conditions have
grown mature for the first exercise period, a total of 887 incentive receivers who have ascertained and
verified the Third Stock Option Incentive Plan have been allowed to exercise 40,395,000 stock options in
the first exercise period (ended 27 June 2019).
c. On 6 July 2017, the exercise conditions grew mature for the first exercise period of the Third Stock
Option Incentive Plan. Upon examination by the Shenzhen Stock Exchange and the Shenzhen branch of
China Securities Depository and Clearing Co., Ltd., the first exercise period of the Third Stock Option
Incentive Plan started on 7 July 2017. In the Reporting Period, 14,419,891 stock options have been
exercised.
D. Overview of Fourth Stock Option Incentive Plan
a. On 29 March 2017, the Fourth Stock Option Incentive Plan (Draft) and its abstract were reviewed and
approved at the 20th Meeting of the 2
nd Board of Directors, and the incentive receiver list for the Fourth
Stock Option Incentive Plan (Draft) was examined at the 14th Meeting of the 2
nd Supervisory Board.
b. On 21 April 2017, the Company convened the 2016 Annual Meeting of Shareholders, at which the
Fourth Stock Option Incentive Plan (Draft) and its abstract, the Implementation and Appraisal Measures
for the Fourth Stock Option Incentive Plan, the Proposal for Asking the Meeting of Shareholders to
Authorize the Board to Handle Mattes Related to the Fourth Stock Option Incentive Plan and other
relevant proposals were reviewed and approved.
For this incentive plan, the Company intended to grant 98,982,000 stock options to 1,476 receivers with
the exercise price being RMB33.72 per share.
c. In light of the authorization given at the 2016 Annual Meeting of Shareholders, the Company
convened the 22nd
Meeting of the 2nd
Board of Directors on 12 May 2017, at which the Proposal for the
Adjustments to the Exercise Price, Incentive Receiver List and Number of Stock Options to Be Granted
for the Fourth Stock Option Incentive Plan, the Proposal for the Determination of the Grant Date for the
Fourth Stock Option Incentive Plan and the Proposal for the Grant-Related Matters for the Fourth Stock
Option Incentive Plan were reviewed and approved. As such, the Company agreed to grant 98,274,000
stock options to 1,463 receivers on 12 May 2017 with the exercise price being RMB32.72 per share. The

Midea Group Co., Ltd. Semi-Annual Report 2017
- 39 -
incentive receiver list and the number of stock options to be granted were revised by the Company’s
Board of Directors because 13 incentive receivers were no longer eligible due to their departure or
positional changes.
E. Overview of First Employee Stock Ownership Plan
According to the first and second Core Management and “Midea Group Partner” Stock Ownership Plans
(draft) (“Employee Stock Ownership Plans” for short), the number of shares for every intended receiver
should be determined based on how well the performance objectives of the Company, its business
divisions and operating units for the appraisal year are achieved and how much an intended receiver
contributes to that. The shares will be granted to an intended receiver by three installments (40% for the
first installment and 30% for the second and third respectively). The first 70% shares (the first and
second installments combined) granted to a receiver will be locked up when these shares are until the
final 30% is put under the name of the receiver, and the third installment will not be subject to lock-up
(tradable as soon as they are put under the name of the receiver).
Where an intended receiver is no longer eligible during the period of such a stock ownership plan due to
positional changes or departure, the administrative committee for the stock ownership plan will take back,
with no compensation, those shares that have not yet granted to the receiver.
Because two such partners (Yuan Liqun and Wu Wenxin) had left the Company before the second
installment of the First Employee Stock Ownership Plan could be granted to them, their unreceived
shares of 216,000 and the corresponding dividends (if any) have been taken back by the administrative
committee for no compensation, and will be sold before the First Employee Stock Ownership Plan
expires. The earnings on the sale will belong to the Company.
A total of 774,900 shares (30% of the total shares to be granted for the First Employee Stock Ownership
Plan) have been granted as the second installment, of which 335,250 shares were granted to senior
executives Fang Hongbo, Zhu Fengtao, Gu Yanmin and Wang Jinliang while the remaining 439,650
shares to other nine core management personnel.
F. Overview of Second Employee Stock Ownership Plan
a. The company performance requirement for the Second Employee Stock Ownership Plan is a
weighted average ROE not lower than 20% for 2016. According to the 2016 Annual Auditor’s Report for
Midea Group Co., Ltd. issued by PricewaterhouseCoopers China (LLP), this ROE requirement has been
Midea Group Co., Ltd. Semi-Annual Report 2017
- 40 -
met at 26.88%.
b. A total of 3,874,590 of the Company’s shares have been purchased for the Second Employee Stock
Ownership Plan. As per the Second Employee Stock Ownership Plan (Draft), the administrative
committee has confirmed the number of shares to be granted to each intended receiver, with the total
shares to be granted being 3,248,790 shares (1,732,800 shares for senior executives Fang Hongbo, Gu
Yanmin, Yin Bitong, Zhu Fengtao and Wang Jinliang and the remaining 1,515,990 shares for other eight
core management personnel). The committee has also confirmed the first installment for this employee
stock ownership plan (1,299,516 in total).
c. There were 625,800 shares left due to the departure of two Midea Group Partners (Yuan Liqun and
Wu Wenxin) in the period of the Second Employee Stock Ownership Plan. As per the Second Employee
Stock Ownership Plan (Draft), these shares and their dividends (if any) have been taken back by the
administrative committee for no compensation, and will be sold before the Second Employee Stock
Ownership Plan expires. The earnings on the sale will belong to the Company.
G. Overview of Third Employee Stock Ownership Plan
a. The Proposal for the Third Core Management and “Midea Group Partner” Stock Ownership Plan
(Draft) of Midea Group Co., Ltd. & Its Abstract was considered and approved at the 20th Meeting of the
2nd
Board of Directors on 29 March 2017. As resolved by a meeting of the intended receivers of the Third
Employee Stock Ownership Plan, China International Capital Corporation Limited (CICC) was entrusted
to conduct the “CICC Directional Asset Management Plan for the Third Midea Group Partner Stock
Ownership Plan” with Midea Group shares purchased from the secondary market.
b. On 18 May 2017, CICC, the stock ownership plan administrator, purchased a total of 2,846,445 Midea
Group shares at an average price of RMB34.77/share from the secondary market. The funds used for
the share purchase were sourced from Midea Group’s special fund for the Third Employee Stock
Ownership Plan of RMB99 million. As such, the shares needed by the Third Employee Stock Ownership
Plan have been purchased, with a statutory lock-up period from 19 May 2017 to 18 May 2018.
H. Overview of 2017 Restricted Share Incentive Plan
a. On 29 March 2017, the 2017 Restricted Share Incentive Plan (Draft) and its abstract were reviewed
and approved at the 20th Meeting of the 2
nd Board of Directors, and the incentive receiver list for the
2017 Restricted Share Incentive Plan (Draft) was examined at the 14th Meeting of the 2
nd Supervisory

Midea Group Co., Ltd. Semi-Annual Report 2017
- 41 -
Board.
b. On 21 April 2017, the Company convened the 2016 Annual Meeting of Shareholders, at which the
2017 Restricted Share Incentive Plan (Draft) and its abstract, the Implementation and Appraisal
Measures for the 2017 Restricted Share Incentive Plan, the Proposal for Asking the Meeting of
Shareholders to Authorize the Board to Handle Mattes Related to the 2017 Restricted Share Incentive
Plan and other relevant proposals were reviewed and approved.
For this restricted share incentive plan, the Company intended to grant, for the first phase, 24,240,000
restricted shares to 140 receivers at the price of RMB16.86 per share.
c. In light of the authorization given at the 2016 Annual Meeting of Shareholders, the Company
convened the 22nd
Meeting of the 2nd
Board of Directors on 12 May 2017, at which the Proposal for the
Adjustments to the Grant Price, Incentive Receiver List and Number of Restricted Shares to Be Granted
for the First Phase of the 2017 Restricted Share Incentive Plan, the Proposal for the Determination of the
Grant Date for the First Phase of the 2017 Restricted Share Incentive Plan and the Proposal for the
Grant-Related Matters for the First Phase of the 2017 Restricted Share Incentive Plan were reviewed
and approved. As such, the Company agreed to grant 23,130,000 restricted shares to 133 receivers on
12 May 2017 at the price of RMB15.86 per share. The incentive receiver list and the number of restricted
shares to be granted were revised by the Company’s Board of Directors because seven incentive
receivers were no longer eligible due to their departure or positional changes.
12. Significant Related Transactions
12.1 Related Transactions Arising from Routine Operation
√ Applicable □ N/A
Related
transac
tion
party
Relatio
n with
the
Compa
ny
Type of
trans-
action
Content
s of
trans-
action
Pricing
principl
e
Tran
s-
actio
n
price
Trans-
action
amount
(RMB
’0,000)
Propo
rtion
in
total
amou
nt of
same-
type
transa
ctions
Approv
ed
transact
ion line
(RMB
’0,000)
Over
approved
line
Way of
settlem
ent
Obtaina
ble
market
price
for
same-t
ype
transac
tion
Disclos
ure
date
Index
to
disclo
sed
inform
ation

Midea Group Co., Ltd. Semi-Annual Report 2017
- 42 -
(%)
Infore
Environ
ment
Technol
ogy
Group
Co.,
Ltd.
Controll
ed by
family
membe
r of
Compa
ny’s
actual
controll
er
Procure
ment
Procure
ment of
goods
Market
price -
54,087.6
0 0.65% 110,000 No
Payme
nt after
delivery
- 31/03/2
017
www.
cninfo
.com.
cn
Orinko
Plastics
Group
Controll
ed by
family
membe
r of
Compa
ny’s
actual
controll
er
Procure
ment
Procure
ment of
goods
Market
price -
24,138.0
0 0.29% 40,000 No
Payme
nt after
delivery
- 31/03/2
017
www.
cninfo
.com.
cn
Total -- -- 78,225.6
0 -- 150,000 -- -- -- -- --
Details of significant sales return Zero
Give actual situation in Reporting
Period (if any) where forecast had
been made for total amounts of
routine related transactions by
type to occur in Reporting Period
The associated amount limit between the Company and the related parties and the
subsidiaries did not exceed the estimated total amounts of routine related-party
transactions by type.
Reason for significant difference
between transaction price and
market reference price (if
applicable)
N/A
12.2 Related Transactions Regarding Purchase or Sales of Assets or Equity Interests
□ Applicable √ N/A
No such cases in the Reporting Period.
12.3 Related Transitions Arising from Joint Investments in Third Parties
□ Applicable √ N/A

Midea Group Co., Ltd. Semi-Annual Report 2017
- 43 -
No such cases in the Reporting Period.
12.4 Credits and Liabilities with Related Parties
□ Applicable √ N/A
No such cases in the Reporting Period.
12.5 Other Significant Related Transactions
□ Applicable √ N/A
No such cases in the Reporting Period.
13. Occupation of the Company’s Capital by Controlling Shareholder or Its Related
Parties for Non-Operating Purposes
□ Applicable √ N/A
No such cases in the Reporting Period.
14. Significant Contracts and Their Execution
14.1 Trusteeship, Contracting and Leasing
14.1.1 Trusteeship
□ Applicable √ N/A
No such cases in the Reporting Period.
14.1.2 Contracting
□ Applicable √ N/A
No such cases in the Reporting Period.
14.1.3 Leasing
□ Applicable √ N/A
No such cases in the Reporting Period.

Midea Group Co., Ltd. Semi-Annual Report 2017
- 44 -
14.2 Major Guarantees
√ Applicable □ N/A
14.2.1 Major Guarantees
Unit: RMB'0,000
Guarantees provided by the Company as parent company and its subsidiaries for third parties (excluding those for
subsidiaries)
Guaranteed party
Disclosur
e date of
guarante
e line
announce
ment
Line of
guarantee
Actual
occurrenc
e date
(date of
agreeme
nt
signing)
Actual
guarantee
amount
Type of
guarantee
Ter
m of
guar
ante
e
Due
or
not
Guar
ante
e for
relat
ed
party
or
not
Misr Refrigeration And Air Conditioning
Manufacturing CO.
31/03/20
17 3,500
01/01/20
17 0
Joint and
several liability
One
year Not Not
Concepcion Midea INC 31/03/20
17 600
01/01/20
17 0
Joint and
several liability
One
year Not Not
Total external guarantee line approved during
Reporting Period (A1) 4,100
Total actual external
guarantee amount during
Reporting Period (A2)
0
Total approved external guarantee line at end of
Reporting Period (A3) 4,100
Total actual external
guarantee balance at end
of Reporting Period (A4)
0
Guarantees between the Company as parent company and its subsidiaries
Guaranteed party
Disclosur
e date of
guarante
e line
announce
ment
Line of
guarantee
Actual
occurrenc
e date
(date of
agreeme
nt
signing)
Actual
guarantee
amount
Type of
guarantee
Term
of
guara
ntee
Due
or not
Guar
ante
e for
relat
ed
party
or
not
Midea Group Finance Co., Ltd. 31/03/20
17 1,040,000
01/01/20
17 171,766
Joint and
several
liability
One
year Not Not
Guangdong Midea Refrigeration
Equipment Co., Ltd.
31/03/20
17 1,110,000
09/02/20
17 371,717 Ditto Ditto Ditto Ditto
Guangzhou Hualing Refrigeration 31/03/20 150,000 20/01/20 0 Ditto Ditto Ditto Ditto

Midea Group Co., Ltd. Semi-Annual Report 2017
- 45 -
Equipment Co., Ltd. 17 17
Foshan Midea Carrier Refrigeration
Equipment Co., Ltd.
31/03/20
17 9,500 - 0 Ditto Ditto Ditto Ditto
Guangdong Midea Kitchen Appliances
Manufacturing Co., Ltd.
31/03/20
17 547,200
01/01/20
17 192,959 Ditto Ditto Ditto Ditto
Guangdong Witt Vacuum Electronics
Manufacturing Co., Ltd.
31/03/20
17 5,000
01/01/20
17 2,676 Ditto Ditto Ditto Ditto
Foshan Shunde Midea Washing
Appliance Manufacturing Co., Ltd.
31/03/20
17 146,200
09/01/20
17 51,505 Ditto Ditto Ditto Ditto
Guangdong Midea Heating & Ventilation
Equipment Co., Ltd.
31/03/20
17 214,400
12/01/20
17 23,970 Ditto Ditto Ditto Ditto
Midea Commercial Air Conditioning
Equipment Co., Ltd., Guangdong
Province
31/03/20
17 55,000
12/05/20
17 10,800 Ditto Ditto Ditto Ditto
Guangdong Midea-SIIX Electronics Co.,
Ltd.
31/03/20
17 13,200
01/01/20
17 41 Ditto Ditto Ditto Ditto
Guangdong Midea Consumer Electric
Manufacturing Co., Ltd.
31/03/20
17 27,500
01/01/20
17 811 Ditto Ditto Ditto Ditto
Foshan Shunde Midea Electric
Appliance Manufacturing Co., Ltd.
31/03/20
17 62,100
15/01/20
17 10,429 Ditto Ditto Ditto Ditto
Guangdong Midea Kitchen & Bathroom
Appliances Manufacturing Co., Ltd.
31/03/20
17 10,600 - 0 Ditto Ditto Ditto Ditto
Foshan Shunde Midea Drinking
Manufacturing Co., Ltd.
31/03/20
17 28,100 - 0 Ditto Ditto Ditto Ditto
Foshan Midea Clear Lake Water
Purification Equipment Manufacturing
Co., Ltd.
31/03/20
17 6,000 - 0 Ditto Ditto Ditto Ditto
Guangdong Midea Environment
Appliances Manufacturing Co., Ltd.
31/03/20
17 52,200
24/03/20
17 795 Ditto Ditto Ditto Ditto
Guangdong GMCC Refrigeration
Equipment Co., Ltd.
31/03/20
17 45,500
21/03/20
17 4,096 Ditto Ditto Ditto Ditto
Guangdong GMCC Precise
Manufacture Co., Ltd.
31/03/20
17 34,000
01/01/20
17 1,207 Ditto Ditto Ditto Ditto
Guangdong Welling Motor Co., Ltd.
31/03/20
17 46,900
01/01/20
17 35 Ditto Ditto Ditto Ditto
Foshan Welling Washer Motor
Manufacturing Co., Ltd.
31/03/20
17 78,200
20/01/20
17 4,735 Ditto Ditto Ditto Ditto
Ningbo Midea Joint Materials Supply
Co. Ltd.
31/03/20
17 66,000
01/01/20
17 10,000 Ditto Ditto Ditto Ditto

Midea Group Co., Ltd. Semi-Annual Report 2017
- 46 -
Foshan Welling Material Co., Ltd.
31/03/20
17 6,000
01/01/20
17 2,503 Ditto Ditto Ditto Ditto
Guangzhou Kaizhao Trading Co., Ltd. 31/03/20
17 18,000
01/01/20
17 492 Ditto Ditto Ditto Ditto
Guangdong Midea Group Wuhu
Refrigeration Equipment Co., Ltd.
31/03/20
17 122,300 - 0 Ditto Ditto Ditto Ditto
Wuhu GMCC Air Conditioning
Equipment Co., Ltd.
31/03/20
17 111,000
12/01/20
17 1,864 Ditto Ditto Ditto Ditto
Hefei Midea Refrigerator Co., Ltd. 31/03/20
17 34,000
06/01/20
17 0 Ditto Ditto Ditto Ditto
Hubei Midea Refrigerator Co., Ltd.
31/03/20
17 10,000
24/03/20
17 1,075 Ditto Ditto Ditto Ditto
Hefei Hualing Co., Ltd.
31/03/20
17 52,000
10/01/20
17 950 Ditto Ditto Ditto Ditto
Guangzhou Midea Hualing Refrigerator
Equipment Co., Ltd.
31/03/20
17 20,000
12/01/20
17 1,089 Ditto Ditto Ditto Ditto
Hefei Midea Heating & Ventilation
Equipment Co., Ltd.
31/03/20
17 24,200 - 0 Ditto Ditto Ditto Ditto
Hefei Midea-Bosch Air Conditioning
Equipment Co., Ltd.
31/03/20
17 5,000 - 0 Ditto Ditto Ditto Ditto
Wuhu Midea Kitchen & Bathroom
Electric Manufacturing Co., Ltd.
31/03/20
17 44,000
05/05/20
17 16,472 Ditto Ditto Ditto Ditto
Wuhu Midea Kitchen Appliances
Manufacturing Co., Ltd.
31/03/20
17 4,000 - 0 Ditto Ditto Ditto Ditto
Anhui GMCC Refrigeration Equipment
Co., Ltd.
31/03/20
17 10,000
14/03/20
17 21 Ditto Ditto Ditto Ditto
Anhui GMCC Precise Manufacture Co.,
Ltd.
31/03/20
17 25,200
12/01/20
17 2,983 Ditto Ditto Ditto Ditto
Welling (Wuhu) Motor Manufacturing
Co., Ltd.
31/03/20
17 16,800
18/05/20
17 6,040 Ditto Ditto Ditto Ditto
Annto Logistics Co., Ltd. 31/03/20
17 32,000
01/01/20
17 479 Ditto Ditto Ditto Ditto
Hefei Midea Washing Machine Co., Ltd.
31/03/20
17 105,000
21/02/20
17 24,433 Ditto Ditto Ditto Ditto
Jiangsu Midea Cleaning Appliances
Co., Ltd.
31/03/20
17 22,000
16/03/20
17 17,505 Ditto Ditto Ditto Ditto
Jiangxi Midea Guiya Lighting Co., Ltd.
31/03/20
17 7,700 - 0 Ditto Ditto Ditto Ditto

Midea Group Co., Ltd. Semi-Annual Report 2017
- 47 -
Chongqing Midea General Refrigeration
Equipment Co., Ltd.
31/03/20
17 7,700 - 0 Ditto Ditto Ditto Ditto
Zhejiang GMCC Compressor Co., Ltd. 31/03/20
17 80,000
28/03/20
17 63,247 Ditto Ditto Ditto Ditto
Midea International Holdings Ltd.
31/03/20
17 701,300
01/01/20
17 197,212 Ditto Ditto Ditto Ditto
Midea International Trading Co., Ltd
31/03/20
17 83,350
05/01/20
17 34,057 Ditto Ditto Ditto Ditto
Midea Electric Investment (BVI) Limited
31/03/20
17 80,780 - 0 Ditto Ditto Ditto Ditto
Midea Refrigeration (Hong Kong) Ltd. 31/03/20
17 3,500 - 0 Ditto Ditto Ditto Ditto
Calpore Macao Commercial Offshore
Ltd.
31/03/20
17 22,500 - 0 Ditto Ditto Ditto Ditto
Welling International Hong Kong Limited 31/03/20
17 32,190 - 0 Ditto Ditto Ditto Ditto
Midea Investment and Development
Co., Ltd.
31/03/20
17 700,000
01/01/20
17 485,436 Ditto Ditto Ditto Ditto
Main Power Electrical Factory Ltd 31/03/20
17 48,500
20/01/20
17 6,517 Ditto Ditto Ditto Ditto
Midea Electric Trading (Singapore) Co.
Pte. Ltd.
31/03/20
17 439,000
06/02/20
17 36,754 Ditto Ditto Ditto Ditto
Toshiba Lifestyle Products & Services
Corporation and its subsidiaries
31/03/20
17 446,000
01/01/20
17 50,879 Ditto Ditto Ditto Ditto
Midea Consumer Electric (Vietnam) Co.,
Ltd.
31/03/20
17 6,860 - 0 Ditto Ditto Ditto Ditto
Springer Carrier Ltda. 31/03/20
17 130,000
01/03/20
17 59,313
Ditto Ditto Ditto Ditto
Climazon Industrial Ltda. 31/03/20
17 Ditto Ditto Ditto Ditto
Carrier(Chile) S.A. 31/03/20
17 3,900
27/06/20
17 1,900 Ditto Ditto Ditto Ditto
Midea Electrics Netherlands B.V. 31/03/20
17 6,860 - 0 Ditto Ditto Ditto Ditto
Midea America Corp. 31/03/20
17 17,400 - 0 Ditto Ditto Ditto Ditto
PT.MIDEA Planet Indonesia 31/03/20
17 15,100 - 0 Ditto Ditto Ditto Ditto
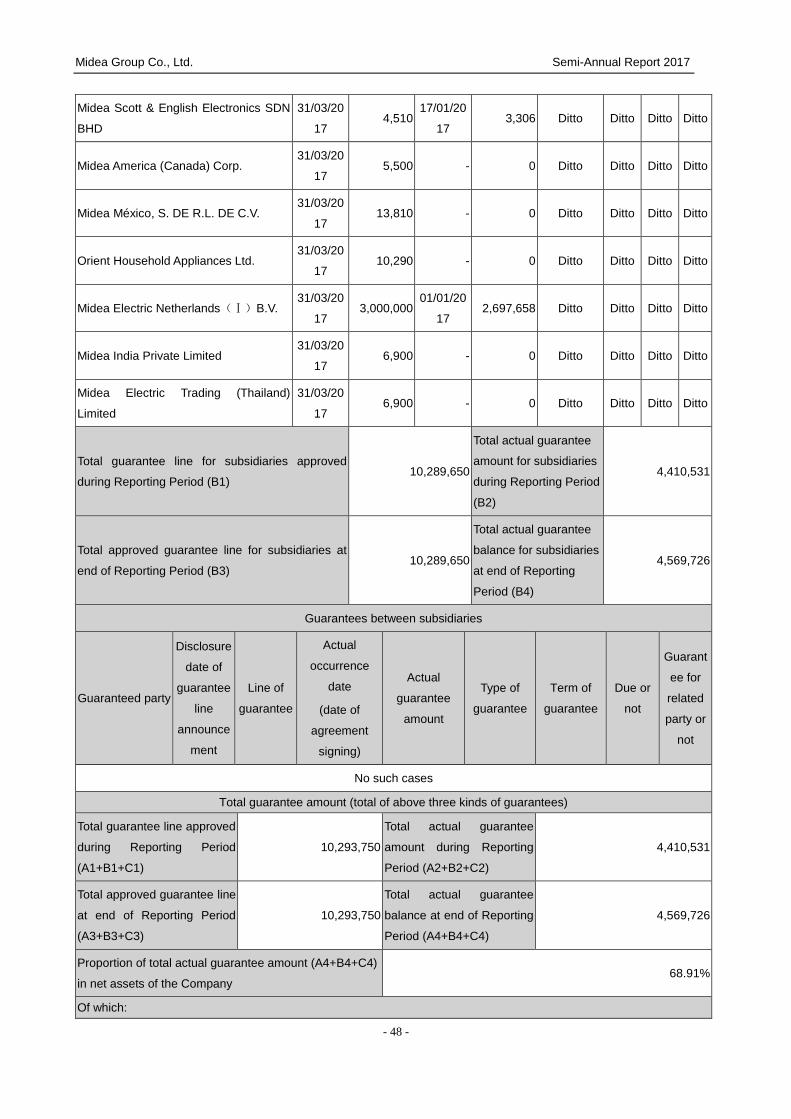
Midea Group Co., Ltd. Semi-Annual Report 2017
- 48 -
Midea Scott & English Electronics SDN
BHD
31/03/20
17 4,510
17/01/20
17 3,306 Ditto Ditto Ditto Ditto
Midea America (Canada) Corp. 31/03/20
17 5,500 - 0 Ditto Ditto Ditto Ditto
Midea México, S. DE R.L. DE C.V. 31/03/20
17 13,810 - 0 Ditto Ditto Ditto Ditto
Orient Household Appliances Ltd. 31/03/20
17 10,290 - 0 Ditto Ditto Ditto Ditto
Midea Electric Netherlands(Ⅰ)B.V. 31/03/20
17 3,000,000
01/01/20
17 2,697,658 Ditto Ditto Ditto Ditto
Midea India Private Limited 31/03/20
17 6,900 - 0 Ditto Ditto Ditto Ditto
Midea Electric Trading (Thailand)
Limited
31/03/20
17 6,900 - 0 Ditto Ditto Ditto Ditto
Total guarantee line for subsidiaries approved
during Reporting Period (B1) 10,289,650
Total actual guarantee
amount for subsidiaries
during Reporting Period
(B2)
4,410,531
Total approved guarantee line for subsidiaries at
end of Reporting Period (B3) 10,289,650
Total actual guarantee
balance for subsidiaries
at end of Reporting
Period (B4)
4,569,726
Guarantees between subsidiaries
Guaranteed party
Disclosure
date of
guarantee
line
announce
ment
Line of
guarantee
Actual
occurrence
date
(date of
agreement
signing)
Actual
guarantee
amount
Type of
guarantee
Term of
guarantee
Due or
not
Guarant
ee for
related
party or
not
No such cases
Total guarantee amount (total of above three kinds of guarantees)
Total guarantee line approved
during Reporting Period
(A1+B1+C1)
10,293,750
Total actual guarantee
amount during Reporting
Period (A2+B2+C2)
4,410,531
Total approved guarantee line
at end of Reporting Period
(A3+B3+C3)
10,293,750
Total actual guarantee
balance at end of Reporting
Period (A4+B4+C4)
4,569,726
Proportion of total actual guarantee amount (A4+B4+C4)
in net assets of the Company 68.91%
Of which:

Midea Group Co., Ltd. Semi-Annual Report 2017
- 49 -
Amount of guarantees provided for shareholders, actual
controller and their related parties (D) 0
Amount of debt guarantees provided directly or indirectly
for entities with liability-to-asset ratio over 70% (E) 1,779,482
Portion of total guarantee amount in excess of 50% of net
assets (F) 0
Total amount of three kinds of guarantees above
(D+E+F) 1,779,482
Joint responsibilities possibly borne for undue guarantees
(if any) N/A
Provision of guarantees in breach of prescribed
procedures (if any) N/A
14.2.2 Illegal Provision of Guarantees for Third Parties
□ Applicable √ N/A
No such cases in the Reporting Period.
14.3 Other Significant Contracts
□ Applicable √ N/A
No such cases in the Reporting Period.
15. Social Responsibilities
15.1 Targeted Measures Taken to Help People Lift Themselves out of Poverty
15.1.1 Summary of Poverty Alleviation Measures Taken in H1 2017
Midea attaches great importance to helping those in need as a way to meet its social responsibility and
give back to society. In 2017, in response to the call of the Guangdong provincial government and the
government’s office for poverty alleviation and development, Midea has been trying to help reduce
poverty through industrial development, creating more jobs and giving donations for public welfare. In H1
2017, Midea donated a total of RMB10 million to the Guangdong government’s office for poverty
alleviation and development to improve education, medical care and housing in over 2,000 poor villages.
This was not only given as cash hand-outs to the poor, but also used to help them develop or improve
abilities to make more money on their own.

Midea Group Co., Ltd. Semi-Annual Report 2017
- 50 -
15.1.2 Poverty Alleviation Plans for Coming Future
In H2 2017, Midea will follow the Guangdong government’s instructions and make plans to help reduce
poverty as a way to meet its social responsibility as a private company.
Midea will work closely with the Guangdong government’s office for poverty alleviation and development
to help those most in need with what they really need by targeted identification and planning. The
poverty alleviation will focus on development or improvement of the poor’s abilities to increase their
income on their own, building of a longlasting poverty alleviation mechanism and optimization of
donation projects. In the meantime, it will be fair, transparent and open for public supervision.
15.2 Material Environmental Issues
Whether the Company or any of its subsidiaries is a heavily polluting business declared by
environmental protection authorities:
□ Yes √ No
16. Other Significant Events
√ Applicable □ N/A
The proposals for the tender offer to acquire shares of KUKA Aktiengesellschaft have been considered
and approved at the 11th and 12th meetings of the Second Board as well as the Third Special Meeting of
Shareholders in 2016. The Company intended to make a cash tender offer of 115 euro/share to acquire
KUKA shares via its wholly-owned foreign subsidiary MECCA, with the funds needed sourced from
syndicated loans and the Company’s own funds.
The Company completed the transaction on 6 January 2017 after the fulfillment of all statutory
decision-making and approval procedures prior to completion. KUKA AG's 32,233,536 shares have been
transferred to MECCA and MECCA has paid the total transaction price of € 3,706,856,640.
17. Significant Events of Subsidiaries
□ Applicable √ N/A

Midea Group Co., Ltd. Semi-Annual Report 2017
- 51 -
Part VI Changes in Shares and Information about Shareholders
1. Changes in Shares
1.1 Changes in Shares
Unit: share
Before Change in Reporting Period After
Number
As
perce
ntage
in
total
share
s (%)
New issue
Bon
us
shar
es
Convert
ed from
capital
reserve
s
Other Subtotal Number
As
perc
enta
ge in
total
shar
es
(%)
1. Restricted shares 279,045,260 4.32 23,130,000 0 0
-90,498,80
0
-67,368,80
0 211,676,460 3.25
1.1 Shares held by the
state 0 0 0 0 0 0 0 0 0
1.2 Shares held by
state-owned corporations 0 0 0 0 0 0 0 0 0
1.3 Shares held by other
domestic investors 279,045,260 4.32 22,380,000 0 0
-90,498,80
0
-68,118,80
0 210,926,460 3.24
Among which: Shares
held by domestic
corporations
82,500,000 1.28 0 0 0 0 0 82,500,000 1.27
Shares held by
domestic individuals 196,545,260 3.04 22,380,000 0 0
-90,498,80
0
-68,118,80
0 128,426,460 1.97
1.4 Shares held by
foreign investors 0 0 750,000 0 0 0 750,000 750,000 0.01
Among which: Shares
held by foreign
corporations
0 0 0 0 0 0 0 0 0
Shares held by
foreign individuals 0 0 750,000 0 0 0 750,000 750,000 0.01
2. Non-restricted shares
6,179,721,54
8 95.68 37,740,390 0 0 90,498,800
128,239,19
0
6,307,960,73
8
96.7
5
2.1 RMB common shares 6,179,721,54 95.68 37,740,390 0 0 90,498,800 128,239,19 6,307,960,73 96.7

Midea Group Co., Ltd. Semi-Annual Report 2017
- 52 -
8 0 8 5
2.2 Domestically listed
shares for foreign
investors
0 0 0 0 0 0 0 0 0
2.3 Overseas listed
shares for foreign
investors
0 0 0 0 0 0 0 0 0
2.4 Others 0 0 0 0 0 0 0 0 0
3. Total shares 6,458,766,80
8 100 60,870,390 0 0 0 60,870,390
6,519,637,19
8 100
Reasons for the changes in shares:
√ Applicable □ N/A
a. 23,130,000 restricted shares were granted to 133 employees for the first phase of the Company’s 2017 Restricted
Share Incentive Plan, of which 750,000 were granted to foreign employees who work in China.
b. Director & Vice President Mr. Li Feide chose to exercise, on 24 May 2017, 375,000 share options, which had been
granted to him as incentives, and 75% of these shares, equal to 281,250 shares, were locked up due to his senior
management position.
c. Ms. Yuan Liqun, a former director, vice president and the former CFO, left the Company on 15 July 2016, and all her
holdings of 90,750,000 shares in the Company have been unlocked after a lockup for six months.
d. Ms. Mai Yufen, a former employee supervisor, left the Company on 30 March 2017, and all her 575 tradable shares in
the Company should be locked up for six months from her departure.
Approval of share changes:
□ Applicable √ N/A
Transfer of share ownership:
□ Applicable √ N/A
Effects of changes in shares on the basic EPS, diluted EPS, net assets per share attributable to common
shareholders of the Company and other financial indexes over the last year and the last reporting period:
□ Applicable √ N/A
Other contents that the Company considers necessary or is required by the securities regulatory
authorities to disclose:
□ Applicable √ N/A
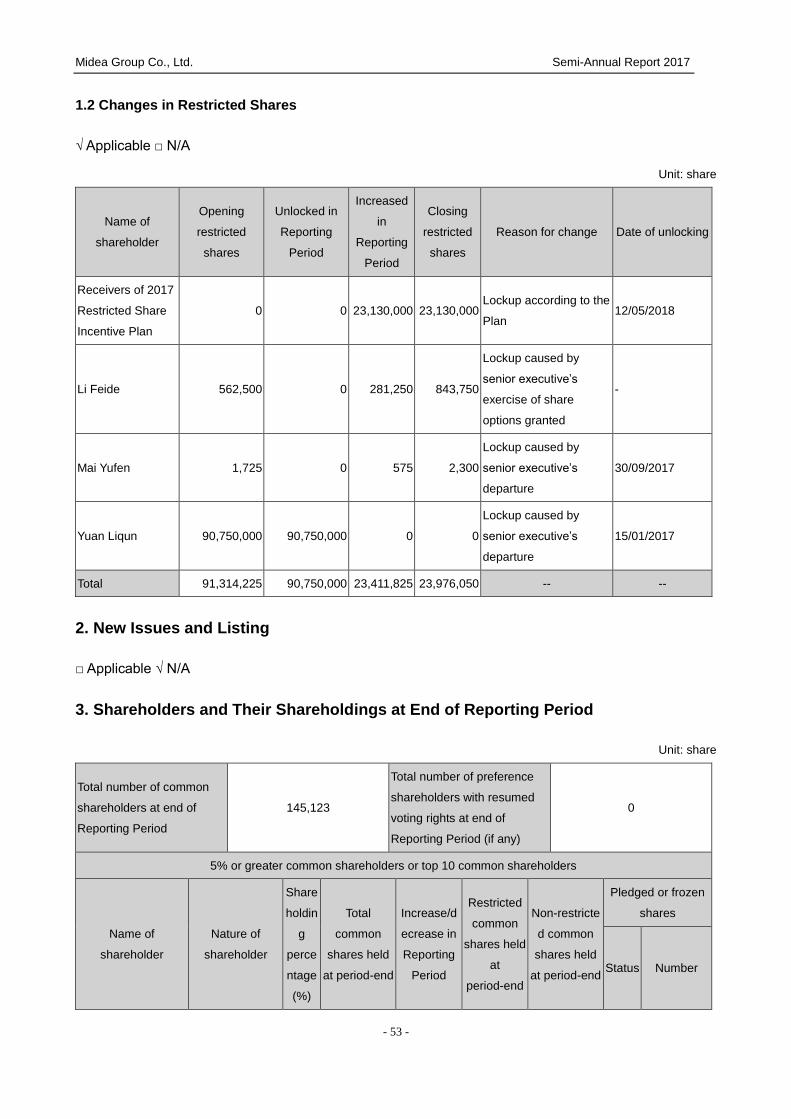
Midea Group Co., Ltd. Semi-Annual Report 2017
- 53 -
1.2 Changes in Restricted Shares
√ Applicable □ N/A
Unit: share
Name of
shareholder
Opening
restricted
shares
Unlocked in
Reporting
Period
Increased
in
Reporting
Period
Closing
restricted
shares
Reason for change Date of unlocking
Receivers of 2017
Restricted Share
Incentive Plan
0 0 23,130,000 23,130,000 Lockup according to the
Plan 12/05/2018
Li Feide 562,500 0 281,250 843,750
Lockup caused by
senior executive’s
exercise of share
options granted
-
Mai Yufen 1,725 0 575 2,300
Lockup caused by
senior executive’s
departure
30/09/2017
Yuan Liqun 90,750,000 90,750,000 0 0
Lockup caused by
senior executive’s
departure
15/01/2017
Total 91,314,225 90,750,000 23,411,825 23,976,050 -- --
2. New Issues and Listing
□ Applicable √ N/A
3. Shareholders and Their Shareholdings at End of Reporting Period
Unit: share
Total number of common
shareholders at end of
Reporting Period
145,123
Total number of preference
shareholders with resumed
voting rights at end of
Reporting Period (if any)
0
5% or greater common shareholders or top 10 common shareholders
Name of
shareholder
Nature of
shareholder
Share
holdin
g
perce
ntage
(%)
Total
common
shares held
at period-end
Increase/d
ecrease in
Reporting
Period
Restricted
common
shares held
at
period-end
Non-restricte
d common
shares held
at period-end
Pledged or frozen
shares
Status Number

Midea Group Co., Ltd. Semi-Annual Report 2017
- 54 -
Midea Holding Co.,
Ltd.
Domestic
non-state-owned
corporation
33.93 2,212,046,61
3
-32,328,38
7 0
2,212,046,61
3
Pledg
ed 854,955,000
Hong Kong
Exchanges and
Clearing Limited
Foreign corporat
ion 5.82 379,247,553
326,064,03
8 0 379,247,553 - -
China Securities
Finance Co., Ltd.
State-owned
corporation 2.70 176,076,530 -3,963,350 0 176,076,530 - -
Fang Hongbo Domestic
individual 2.10 136,990,492 0
102,742,86
9 34,247,623 - -
Hillhouse Capital
Management
Limited-HCM
China Fund
Foreign corporat
ion 1.75 113,891,138 0 0 113,891,138 - -
Huang Jian Domestic
individual 1.35 87,980,000 -20,000 0 87,980,000
Pledg
ed 22,999,900
Xiaomi Technology
Co., Ltd.
Domestic
non-state-owned
corporation
1.27 82,500,000 0 82,500,000 0 - -
Central Huijin Asset
Management Ltd.
State-owned
corporation 1.20 78,474,900 0 0 78,474,900 - -
Yuan Liqun Domestic
individual 1.13 73,986,200
-16,763,80
0 0 73,986,200
Pledg
ed 13,052,500
UBS AG Foreign corporat
ion 1.06 69,254,607 3,833,560 0 69,254,607 - -
Strategic investors or general
corporations becoming top-ten
shareholders due to placing of new
shares (if any) (see note 3)
N/A
Related or acting-in-concert parties
among shareholders above N/A
Top 10 non-restricted common shareholders
Name of shareholder Non-restricted common
shares held at period-end
Type of shares
Type Number
Midea Holding Co., Ltd. 2,212,046,613 RMB common share 2,212,046,613
Hong Kong Exchanges and Clearing
Limited 379,247,553 Ditto 379,247,553
China Securities Finance Co., Ltd. 176,076,530 Ditto 176,076,530
Hillhouse Capital Management Limited- 113,891,138 Ditto 113,891,138
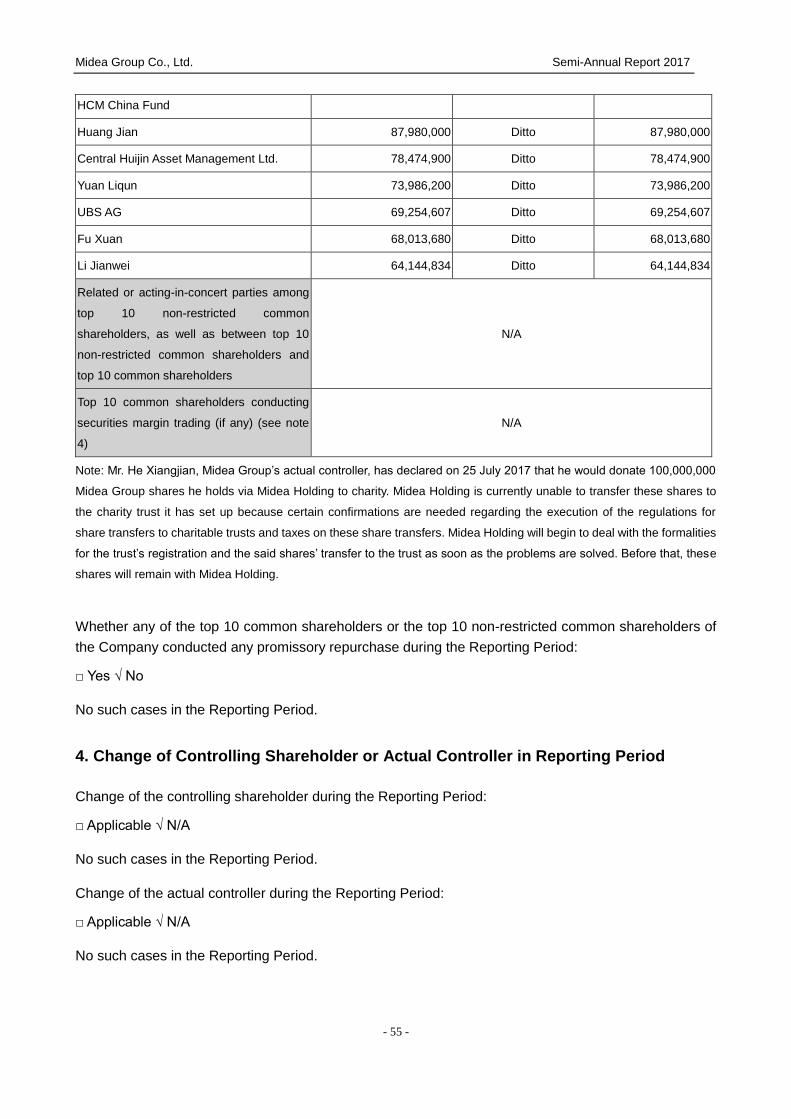
Midea Group Co., Ltd. Semi-Annual Report 2017
- 55 -
HCM China Fund
Huang Jian 87,980,000 Ditto 87,980,000
Central Huijin Asset Management Ltd. 78,474,900 Ditto 78,474,900
Yuan Liqun 73,986,200 Ditto 73,986,200
UBS AG 69,254,607 Ditto 69,254,607
Fu Xuan 68,013,680 Ditto 68,013,680
Li Jianwei 64,144,834 Ditto 64,144,834
Related or acting-in-concert parties among
top 10 non-restricted common
shareholders, as well as between top 10
non-restricted common shareholders and
top 10 common shareholders
N/A
Top 10 common shareholders conducting
securities margin trading (if any) (see note
4)
N/A
Note: Mr. He Xiangjian, Midea Group’s actual controller, has declared on 25 July 2017 that he would donate 100,000,000
Midea Group shares he holds via Midea Holding to charity. Midea Holding is currently unable to transfer these shares to
the charity trust it has set up because certain confirmations are needed regarding the execution of the regulations for
share transfers to charitable trusts and taxes on these share transfers. Midea Holding will begin to deal with the formalities
for the trust’s registration and the said shares’ transfer to the trust as soon as the problems are solved. Before that, these
shares will remain with Midea Holding.
Whether any of the top 10 common shareholders or the top 10 non-restricted common shareholders of
the Company conducted any promissory repurchase during the Reporting Period:
□ Yes √ No
No such cases in the Reporting Period.
4. Change of Controlling Shareholder or Actual Controller in Reporting Period
Change of the controlling shareholder during the Reporting Period:
□ Applicable √ N/A
No such cases in the Reporting Period.
Change of the actual controller during the Reporting Period:
□ Applicable √ N/A
No such cases in the Reporting Period.

Midea Group Co., Ltd. Semi-Annual Report 2017
- 56 -
Part VII Preference Shares
□ Applicable √ N/A
No such cases in the Reporting Period.
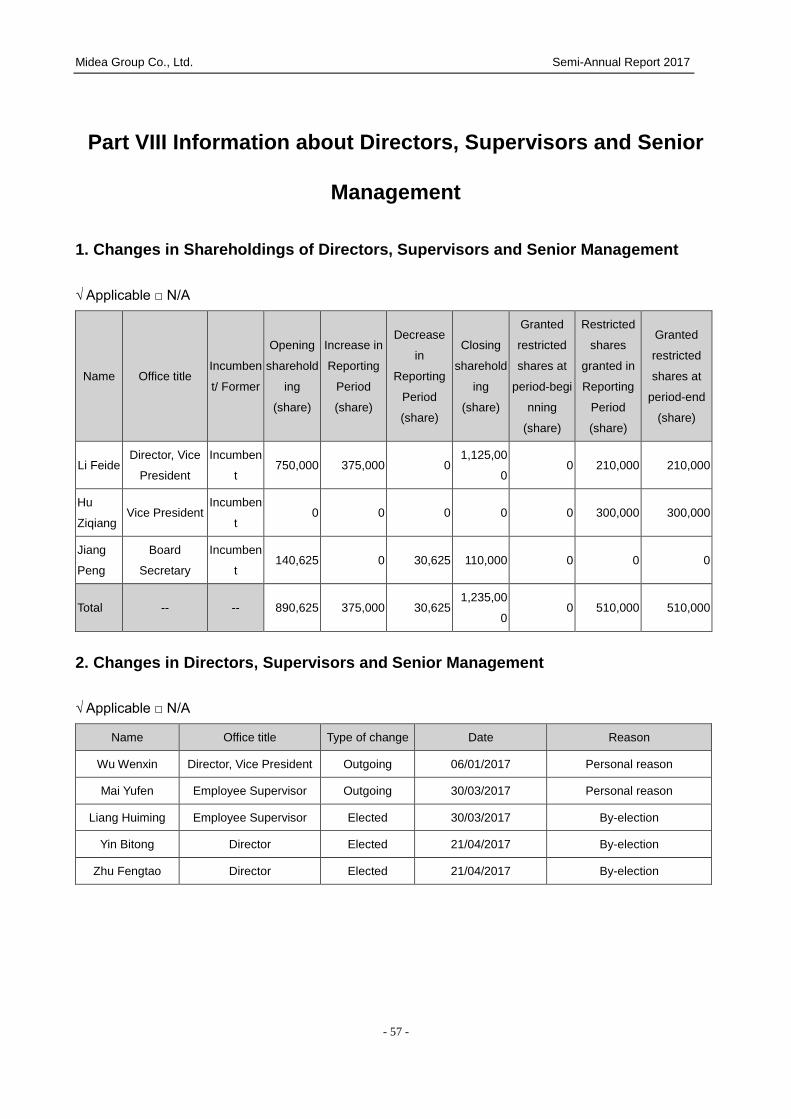
Midea Group Co., Ltd. Semi-Annual Report 2017
- 57 -
Part VIII Information about Directors, Supervisors and Senior
Management
1. Changes in Shareholdings of Directors, Supervisors and Senior Management
√ Applicable □ N/A
Name Office title Incumben
t/ Former
Opening
sharehold
ing
(share)
Increase in
Reporting
Period
(share)
Decrease
in
Reporting
Period
(share)
Closing
sharehold
ing
(share)
Granted
restricted
shares at
period-begi
nning
(share)
Restricted
shares
granted in
Reporting
Period
(share)
Granted
restricted
shares at
period-end
(share)
Li Feide Director, Vice
President
Incumben
t 750,000 375,000 0
1,125,00
0 0 210,000 210,000
Hu
Ziqiang Vice President
Incumben
t 0 0 0 0 0 300,000 300,000
Jiang
Peng
Board
Secretary
Incumben
t 140,625 0 30,625 110,000 0 0 0
Total -- -- 890,625 375,000 30,625 1,235,00
0 0 510,000 510,000
2. Changes in Directors, Supervisors and Senior Management
√ Applicable □ N/A
Name Office title Type of change Date Reason
Wu Wenxin Director, Vice President Outgoing 06/01/2017 Personal reason
Mai Yufen Employee Supervisor Outgoing 30/03/2017 Personal reason
Liang Huiming Employee Supervisor Elected 30/03/2017 By-election
Yin Bitong Director Elected 21/04/2017 By-election
Zhu Fengtao Director Elected 21/04/2017 By-election

Midea Group Co., Ltd. Semi-Annual Report 2017
- 58 -
Part IX Financial Report
1. Auditor’s Report
Have the H1 2017 financial statements been audited by a CPAs firm?
□ Yes √ No
The H1 2017 financial statements are unaudited by a CPAs firm.
2. Financial Statements

- 59 -
MIDEA GROUP CO., LTD. CONSOLIDATED AND COMPANY BALANCE SHEETS AS AT 30 JUNE 2017 (All amounts in RMB'000 Yuan unless otherwise stated) [English translation for reference only]
ASSETS Note
30 June 2017 31 December
2016 30 June 2017 31 December
2016
Consolidated Consolidated Company Company
Current assets:
Cash at bank and on hand 4(1) 34,219,018 27,169,118 19,889,986 17,135,480
Derivative financial assets 331,009 412,813 - -
Notes receivable 4(2) 10,884,391 7,427,488 - -
Accounts receivable 4(3) 19,380,874 13,454,511 - -
Advances to suppliers 4(4) 2,065,803 1,587,366 23,972 8,252
Loans and advances 4(5) 12,149,708 10,273,397 - -
Dividends receivable 4,351 - 1,292,508 285,916
Other receivables 4(3), 17(1) 2,170,084 1,140,133 14,686,795 12,644,592
Inventories 4(6) 20,885,038 15,626,897 - -
Including: completed but unsettled 4(6) 5,154,238 - - -
Other current assets 4(7) 50,041,889 43,529,597 25,265,903 24,165,141
Total current assets 152,132,165 120,621,320 61,159,164 54,239,381
Non-current assets:
Available-for-sale financial assets 4(8) 1,872,393 5,187,732 56,868 28,931
Long-term receivables 404,115 33,868 - -
Long-term equity investments 4(9), 17(2) 2,586,329 2,211,732 23,947,670 23,058,980
Investment properties 480,814 494,122 588,175 604,881
Fixed assets 4(10) 22,603,151 21,056,791 915,261 984,666
Construction in progress 4(11) 880,939 580,729 516,104 467,053
Intangible assets 4(12) 16,312,242 6,868,538 234,388 236,083
Goodwill 4(13) 28,418,164 5,730,995 - -
Long-term prepaid expenses 712,450 625,971 36,788 46,090
Deferred income tax assets 4(14) 3,602,239 3,030,383 38,531 62,711
Other non-current assets 4(7) 1,011,491 4,158,530 3,961,576 3,342,000
Total non-current assets 78,884,327 49,979,391 30,295,361 28,831,395
TOTAL ASSETS 231,016,492 170,600,711 91,454,525 83,070,776
Legal representative: Fang Hongbo
Person in charge of accounting function: Xiao Mingguang
Person in charge of accounting department: Chen Lihong

- 60 -
MIDEA GROUP CO., LTD. CONSOLIDATED AND COMPANY BALANCE SHEETS (CONT’D) AS AT 30 JUNE 2017 (All amounts in RMB'000 Yuan unless otherwise stated) [English translation for reference only]
Liabilities and shareholders' equity Note
30 June 2017 31 December
2016 30 June 2017 31 December
2016
Consolidated Consolidated Company Company
Current liabilities:
Short-term borrowings 4(17) 32,391,950 3,024,426 - -
Borrowings from central bank - - - - Customer deposits and
deposits from banks and other financial institutions 110,016 36,708 - -
Derivative financial liabilities 43,734 89,838 - - Financial assets sold under
repurchase agreements - - - -
Notes payable 4(18) 22,034,312 18,484,939 - -
Accounts payable 4(19) 32,298,812 25,356,960 - -
Advances from customers 4(20) 14,170,593 10,252,375 - - Including: settled but not
completed 4(20) 1,955,231 - - -
Employee benefits payable 4(21) 3,789,589 3,154,387 82,079 199,842
Taxes payable 4(22) 3,614,764 2,364,446 12,233 103,848
Interest payable 35,564 21,343 121,682 76,776
Dividends payable 277,840 105,641 - -
Other payables 4(23) 2,262,085 1,571,422 62,301,628 54,461,578 Current portion of non-current
liabilities 77,711 158,545 - -
Other current liabilities 4(24) 26,604,521 24,562,970 5,379 140,264
Total current liabilities 137,711,491 89,184,000 62,523,001 54,982,308
Non-current liabilities:
Long-term borrowings 4(25) 4,036,714 2,254,348 - -
Debentures payable 4(26) 4,713,144 4,818,769 - -
Long-term payables 554,781 366,881 - -
Payables for specific projects 2,500 2,405 - -
Provisions 654,385 325,217 - -
Deferred revenue 589,506 502,316 - - Long-term employee benefits
payable 4(27) 2,385,070 1,449,954 - -
Deferred income tax liabilities 4(14) 4,519,872 1,831,973 - -
Other non-current liabilities 854,137 888,152 - -
Total non-current liabilities 18,310,109 12,440,015 - -
Total liabilities 156,021,600 101,624,015 62,523,001 54,982,308
Shareholders' equity:
Share capital 4(28) 6,519,637 6,458,767 6,519,637 6,458,767
Capital surplus 4(29) 14,734,308 13,596,569 6,578,932 5,455,268
Less: Treasury stock 366,842 - 366,842 - Other comprehensive
income 4(30) 22,807 13,125 (12,495) (9,069)
Surplus reserve 4(31) 2,804,469 2,804,469 2,804,469 2,804,469
General reserve 148,602 148,602 - -
Undistributed profits 4(32) 42,451,036 38,105,391 13,407,823 13,379,033 Total equity attributable to
equity holders of the parent company 66,314,017 61,126,923 28,931,524 28,088,468
Minority interests 8,680,875 7,849,773 - -
Total shareholders' equity 74,994,892 68,976,696 28,931,524 28,088,468 TOTAL LIABILITIES AND
SHAREHOLDERS' EQUITY 231,016,492 170,600,711 91,454,525 83,070,776
Legal representative: Fang Hongbo
Person in charge of accounting function: Xiao Mingguang
Person in charge of accounting department: Chen Lihong

- 61 -
MIDEA GROUP CO., LTD. CONSOLIDATED AND COMPANY INCOME STATEMENTS FOR THE SIX MONTHS ENDED 30 JUNE 2017 (All amounts in RMB'000 Yuan unless otherwise stated) [English translation for reference only]
Item Note
For the six months ended 30 June
2017
For the six months ended 30 June
2016
For the six months ended 30 June
2017
For the six months ended 30 June
2016
Consolidated Consolidated Company Company
Total revenue 124,963,616 78,007,516 701,070 588,251
Including: Operating revenue 4(33), 17(3) 124,450,065 77,522,287 701,070 588,251
Interest income 4(34) 513,549 479,576 - -
Fee and commission income 2 5,653 - -
Total cost of sales (113,963,618) (66,818,413) (323,655) (759,589)
Including: Cost of sales 4(33) (93,051,081) (54,866,160) (19,329) (13,648)
Interest expenses 4(34) (165,666) (261,318) - -
Fee and commission expense (1,661) (1,387) - -
Taxes and surcharges 4(35) (754,771) (467,762) (3,779) (3,335)
Selling and distribution expenses 4(36) (12,404,770) (8,185,178) - -
General and administrative expenses 4(37) (6,832,958) (3,690,059) (105,438) (338,538)
Financial expenses 4(38) (346,614) 905,261 (194,963) (404,035)
Asset impairment loss 4(39) (406,097) (251,810) (146) (33)
Add: (Losses)/gains on changes in fair value 4(40) (9,523) (525,089) - 22,673
Investment income 4(41), 17(4) 1,199,452 714,082 6,125,238 7,558,711
Including: Share of profit of associates and joint ventures 287,134 200,742 214,433 131,111
Other income 4(42) 846,226 - - -
Operating profit 13,036,153 11,378,096 6,502,653 7,410,046
Add: Non-operating income 4(43) 990,914 903,272 757 1,837
Including: Gains on disposal of non-current assets 781,229 3,548 - -
Less: Non-operating expenses 4(44) (419,943) (103,799) (1,041) (1,557)
Including: Losses on disposal of non-current assets (37,127) (32,149) (119) (1,547)
Total profit 13,607,124 12,177,569 6,502,369 7,410,326
Less: Income tax expenses 4(45) (2,059,053) (1,946,671) (7,902) (34,901)
Net profit 11,548,071 10,230,898 6,494,467 7,375,425
Including: Net profit of the acquiree entity before the combination date - - - -
Attributable to shareholders of the Company 10,811,322 9,496,493 6,494,467 7,375,425
Minority interests 736,749 734,405 - -
Other comprehensive income, net of tax 26,322 1,347,262 (3,426) (10,577)
Other comprehensive income attributable to shareholders of the parent company 9,682 1,276,714 (3,426) (10,577)
(1) Other comprehensive income items which will not be reclassified subsequently to profit or loss 39,579 - - -
(2) Other comprehensive income items which will be reclassified subsequently to profit or loss (29,897) 1,276,714 (3,426) (10,577)
1) Share of the other comprehensive income of the investee accounted for using equity method which will be reclassified subsequently to profit and loss (8,069) (65,706) (3,426) (10,577)
2) Change in fair value of available-for-sale financial assets (292,475) 1,082,507 - -
3) Losses or profits arising from the reclassification of held-to-maturity investments into available-for-sale financial assets - - - -
4) Effective portion of cash flow hedging gains or losses 168,716 145,603 - -
5) Translation of foreign currency financial statements 101,931 114,310 - -
Other comprehensive income attributable to minority shareholders, net of tax 16,640 70,548 - -
Total comprehensive income 11,574,393 11,578,160 6,491,041 7,364,848
Attributable to shareholders of the parent company 10,821,004 10,773,207 6,491,041 7,364,848
Minority interests 753,389 804,953 - -
Earnings per share
(1) Basic earnings per share 4(46) 1.67 1.48 N/A N/A
(2) Diluted earnings per share 4(46) 1.66 1.48 N/A N/A
Legal representative: Fang Hongbo
Person in charge of accounting function: Xiao Mingguang
Person in charge of accounting department: Chen Lihong

- 62 -
MIDEA GROUP CO., LTD. CONSOLIDATED AND COMPANY CASH FLOW STATEMENTS FOR THE SIX MONTHS ENDED 30 JUNE 2017 (All amounts in RMB'000 Yuan unless otherwise stated) [English translation for reference only]
Item Note
For the six months ended 30 June
2017
For the six months ended 30 June
2016
For the six months ended 30 June
2017
For the six months ended 30 June
2016
Consolidated Consolidated Company Company
1. Cash flows from operating activities
Cash received from sales of goods or rendering of services 99,984,184 67,859,148 - -
Net increase in customer deposits and deposits from banks and other financial institutions 73,308 20,521 -
Net increase in borrowings from the central bank - 45,740 - -
Cash received for interest, fee and commission 543,915 493,143 - -
Refund of taxes and surcharges 2,593,364 2,797,186 - -
Cash received relating to other operating activities 4(47)(a) 2,485,847 1,537,990 8,176,371 21,775,704
Sub-total of cash inflows 105,680,618 72,753,728 8,176,371 21,775,704
Cash paid for goods and services (58,343,060) (39,448,768) - -
Net increase in loans and advances (1,903,898) (4,588,457) - -
Net increase in deposits with central bank and deposits with banks and other financial institutions (528,948) (454,933) - -
Cash paid for interest, fee and commission (167,327) (262,705) - -
Cash paid to and on behalf of employees (11,456,781) (5,660,543) (112,878) (97,184)
Payments of taxes and surcharges (5,982,427) (4,743,106) (94,326) (42,490)
Cash paid relating to other operating activities 4(47)(b) (13,402,245) (9,466,053) (1,958,570) (4,533,614)
Sub-total of cash outflows (91,784,686) (64,624,565) (2,165,774) (4,673,288)
Net cash flows from operating activities 4(47)(c) 13,895,932 8,129,163 6,010,597 17,102,416
2. Cash flows from investing activities
Cash received from disposal of investments 40,674,727 28,775,253 27,815,545 17,722,372
Cash received from returns on investments 1,223,225 824,805 5,297,145 6,531,603
Cash received from disposal of fixed assets, intangible assets and other long-term assets 859,943 16,919 12,049 110
Net cash received from disposal of subsidiaries and other business units 2,415 272,899 - -
Cash received relating to other investing activities - - - -
Sub-total of cash inflows 42,760,310 29,889,876 33,124,739 24,254,085
Cash paid to acquire fixed assets, intangible assets and other long-term assets (1,520,059) (1,076,411) (59,406) (217,976)
Cash paid to acquire investments (42,660,602) (43,293,409) (32,378,633) (21,275,146)
Net cash paid to acquire subsidiaries and other business units (25,331,546) (1,856,787) - -
Cash paid relating to other investing activities - - - -
Sub-total of cash outflows (69,512,207) (46,226,607) (32,438,039) (21,493,122)
Net cash flows from investing activities (26,751,897) (16,336,731) 686,700 2,760,963
3. Cash flows from financing activities
Cash received from capital contributions 629,854 45,552 629,854 29,742
Including: Cash received from capital contributions by minority shareholders of subsidiaries - 15,810 - -
Cash received from borrowings 31,631,302 27,806,076 1,600,000 1,800,000
Cash received from issuing short-term financing bonds - 1,999,500 - 1,999,500
Cash received relating to other financing activities - - - -
Sub-total of cash inflows 32,261,156 29,851,128 2,229,854 3,829,242
Cash repayments of borrowings (4,198,336) (11,044,612) (1,600,000) (1,290,000)
Cash payment for issuing short-term financing bonds - - - -
Cash payments for interest expenses and distribution of dividends or profits (7,072,016) (5,560,069) (6,816,712) (5,782,143)
Including: Cash payments for dividends or profit to minority shareholders of subsidiaries (395,950) (297,841) - -
Cash payments relating to other financing activities - - - -
Sub-total of cash outflows (11,270,352) (16,604,681) (8,416,712) (7,072,143)
Net cash flows from financing activities 20,990,804 13,246,447 (6,186,858) (3,242,901)
4. Effect of foreign exchange rate changes on cash and cash equivalents 137,862 70,620 - -
5. Net increase in cash and cash equivalents 8,272,701 5,109,499 510,439 16,620,478
Add: Cash and cash equivalents at the beginning of the period 12,513,730 5,187,317 8,174,915 6,245,008
6. Cash and cash equivalent at the end of period 20,786,431 10,296,816 8,685,354 22,865,486
Legal representative: Fang Hongbo
Person in charge of accounting function: Xiao Mingguang
Person in charge of accounting department: Chen Lihong

- 63 -
MIDEA GROUP CO., LTD. CONSOLIDATED STATEMENT OF CHANGES IN SHAREHOLDERS' EQUITY FOR THE SIX MONTHS ENDED 30 JUNE 2017 (All amounts in RMB'000 Yuan unless otherwise stated) [English translation for reference only]
Item
Current figure
Equity attributable to the parent company
Minority interests Total shareholders'
equity Share capital Capital surplus Less: Treasury stock
Other comprehensive
income Surplus reserve General reserve Undistributed profits
Balance at the end of last year 6,458,767 13,596,569 - 13,125 2,804,469 148,602 38,105,391 7,849,773 68,976,696
Add: Changes in accounting policies - - - - - - - - -
Balance at the beginning of current year 6,458,767 13,596,569 - 13,125 2,804,469 148,602 38,105,391 7,849,773 68,976,696
Movements in the current year 60,870 1,137,739 (366,842) 9,682 - - 4,345,645 831,102 6,018,196
(1) Total comprehensive income - - - 9,682 - - 10,811,322 753,389 11,574,393
(2) Capital contribution and withdrawal by shareholders 60,870 1,137,834 (366,842) - - - - 691,584 1,523,446
1) Capital contribution from shareholders 60,870 1,026,038 (366,842) - - - - - 720,066
2) Business combinations - - - - - - - 647,210 647,210
3) Share-based payment included in shareholders' equity - 111,796 - - - - - 44,374 156,170
4) Others - - - - - - - - -
(3) Profit distribution - - - - - - (6,465,677) (612,353) (7,078,030)
1) Appropriation to surplus reserve - - - - - - - - -
2) Appropriation to general reserve - - - - - - - - -
3) Profit distribution to shareholders - - - - - - (6,465,677) (612,353) (7,078,030)
4) Others - - - - - - - - -
(4) Transfer within shareholders' equity - - - - - - - - -
1) Transfer from capital surplus to paid-in capital - - - - - - - - -
2) Transfer from surplus reserve to paid-in capital - - - - - - - - -
3) Surplus reserve used to offset accumulated losses - - - - - - - - -
4) Others - - - - - - - - -
(5) Specific reserve - - - - - - - - -
1) Increase in current period - - - - - - - - -
2) Usage in current period - - - - - - - - -
(6) Others - (95) - - - - - (1,518) (1,613)
Balance at the end of current period 6,519,637 14,734,308 (366,842) 22,807 2,804,469 148,602 42,451,036 8,680,875 74,994,892
Legal representative: Fang Hongbo Person in charge of accounting function: Xiao Mingguang Person in charge of accounting department: Chen Lihong

- 64 -
MIDEA GROUP CO., LTD. CONSOLIDATED STATEMENT OF CHANGES IN SHAREHOLDERS' EQUITY FOR THE SIX MONTHS ENDED 30 JUNE 2017 (All amounts in RMB'000 Yuan unless otherwise stated) [English translation for reference only]
Item
Comparative figure
Equity attributable to the parent company
Minority interests Total shareholders'
equity Share capital Capital surplus Less: Treasury stock Other comprehensive
income Surplus reserve General reserve Undistributed profits
Balance at the end of last year 4,266,839 14,511,190 - (1,071,151) 1,846,523 118,624 29,529,827 6,829,770 56,031,622
Add: Changes in accounting policies - - - - - - - - -
Balance at the beginning of current year 4,266,839 14,511,190 - (1,071,151) 1,846,523 118,624 29,529,827 6,829,770 56,031,622
Movements in the current year 2,191,928 (914,621) - 1,084,276 957,946 29,978 8,575,564 1,020,003 12,945,074
(1) Total comprehensive income - 1,084,276 - - 14,684,357 1,281,494 17,050,127
(2) Capital contribution and withdrawal by shareholders 58,232 1,235,744 - - - - - 445,093 1,739,069
1) Capital contribution from shareholders 58,232 1,007,110 - - - - - 32,593 1,097,935
2) Business combinations - - - - - - - 339,543 339,543
3) Share-based payment included in shareholders' equity - 228,634 - - - - - 72,957 301,591
4) Others - - - - - - -
(3) Profit distribution - - - - 957,946 29,978 (6,108,793) (550,321) (5,671,190)
1) Appropriation to surplus reserve - - - - 957,946 - (957,946) - -
2) Appropriation to general reserve - - - - - 29,978 (29,978) - -
3) Profit distribution to shareholders - - - - - - (5,120,869) (550,321) (5,671,190)
4) Others - - - - - - - - -
(4) Transfer within shareholders' equity 2,133,696 (2,133,696) - - - - - - -
1) Transfer from capital surplus to paid-in capital 2,133,696 (2,133,696) - - - - - - -
2) Transfer from surplus reserve to paid-in capital - - - - - - - - -
3) Surplus reserve used to offset accumulated losses - - - - - - - - -
4) Others - - - - - - - - -
(5) Specific reserve - - - - - - - - -
1) Increase in current period - - - - - - - - -
2) Usage in current period - - - - - - - - -
(6) Others - (16,669) - - - - - (156,263) (172,932)
Balance at the end of current period 6,458,767 13,596,569 - 13,125 2,804,469 148,602 38,105,391 7,849,773 68,976,696
Legal representative: Fang Hongbo Person in charge of accounting function: Xiao Mingguang Person in charge of accounting department: Chen Lihong

- 65 -
MIDEA GROUP CO., LTD. COMPANY STATEMENT OF CHANGES IN SHAREHOLDERS' EQUITY FOR THE SIX MONTHS ENDED 30 JUNE 2017 (All amounts in RMB'000 Yuan unless otherwise stated) [English translation for reference only]
Item
Current figure
Share capital Capital surplus Less: Treasury
stock
Other comprehensive
income Specific reserve Surplus reserve Undistributed
profits Total shareholders'
equity
Balance at the end of last year 6,458,767 5,455,268 - (9,069) - 2,804,469 13,379,033 28,088,468
Add: Changes in accounting policies - - - - - - - -
Balance at the beginning of current year 6,458,767 5,455,268 - (9,069) - 2,804,469 13,379,033 28,088,468
Movements in the current year 60,870 1,123,664 (366,842) (3,426) - - 28,790 843,056
(1) Total comprehensive income - - - (3,426) - - 6,494,467 6,491,041
(2) Capital contribution and withdrawal by shareholders 60,870 1,123,725 (366,842) - - - - 817,753
1) Capital contribution from shareholders 60,870 1,026,038 (366,842) - - - - 720,066
2) Capital contribution from owners of other equity instruments - - - - - - - -
3) Share-based payment included in owners' equity - 97,687 - - - - - 97,687
4) Others - - - - - - - -
(3) Profit distribution - - - - - - (6,465,677) (6,465,677)
1) Appropriation to surplus reserve - - - - - - - -
2) Profit distribution to shareholders - - - - - - (6,465,677) (6,465,677)
3) Others - - - - - - - -
(4) Transfer within shareholders' equity - - - - - - - -
1) Transfer from capital surplus to paid-in capital - - - - - - - -
2) Transfer from surplus reserve to paid-in capital - - - - - - - -
3) Surplus reserve used to offset accumulated losses - - - - - - - -
4) Others - - - - - - - -
(5) Specific reserve - - - - - - - -
1. Increase in the current year - - - - - - - -
2. Usage in the current year - - - - - - - -
(6) Others - (61) - - - - - (61)
Balance at the end of the year 6,519,637 6,578,932 (366,842) (12,495) - 2,804,469 13,407,823 28,931,524
Legal representative: Fang Hongbo Person in charge of accounting function: Xiao Mingguang Person in charge of accounting department: Chen Lihong

- 66 -
MIDEA GROUP CO., LTD. COMPANY STATEMENT OF CHANGES IN SHAREHOLDERS' EQUITY FOR THE SIX MONTHS ENDED 30 JUNE 2017 (All amounts in RMB'000 Yuan unless otherwise stated) [English translation for reference only]
Item
Comparative figure
Share capital Capital surplus Less: Treasury
stock
Other comprehensive
income Specific reserve Surplus reserve Undistributed
profits Total shareholders'
equity
Balance at the end of last year 4,266,839 6,370,934 - 21,006 - 1,846,523 9,878,385 22,383,687
Add: Changes in accounting policies - - - - - - - -
Balance at the beginning of current year 4,266,839 6,370,934 - 21,006 - 1,846,523 9,878,385 22,383,687
Movements in the current year 2,191,928 (915,666) - (30,075) - 957,946 3,500,648 5,704,781
(1) Total comprehensive income - - - (30,075) - - 9,579,463 9,549,388
(2) Capital contribution and withdrawal by shareholders 58,232 1,217,773 - - - - - 1,276,005
1) Capital contribution from shareholders 58,232 1,007,110 - - - - - 1,065,342
2) Capital contribution from owners of other equity instruments - - - - - - - -
3) Share-based payment included in owners' equity - 210,663 - - - - - 210,663
4) Others - - - - - - - -
(3) Profit distribution - - - - - 957,946 (6,078,815) (5,120,869)
1) Appropriation to surplus reserve - - - - - 957,946 (957,946) -
2) Profit distribution to shareholders - - - - - - (5,120,869) (5,120,869)
3) Others - - - - - - - -
(4) Transfer within shareholders' equity 2,133,696 (2,133,696) - - - - - -
1) Transfer from capital surplus to paid-in capital 2,133,696 (2,133,696) - - - - - -
2) Transfer from surplus reserve to paid-in capital - - - - - - - -
3) Surplus reserve used to offset accumulated losses - - - - - - - -
4) Others - - - - - - - -
(5) Specific reserve - - - - - - - -
1. Increase in the current year - - - - - - - -
2. Usage in the current year - - - - - - - -
(6) Others - 257 - - - - - 257
Balance at the end of the year 6,458,767 5,455,268 - (9,069) - 2,804,469 13,379,033 28,088,468
Legal representative: Fang Hongbo Person in charge of accounting function: Xiao Mingguang Person in charge of accounting department: Chen Lihong

MIDEA GROUP CO., LTD. NOTES TO THE FINANCIAL STATEMENTS FOR THE SIX MONTHS ENDED 30 JUNE 2017 (All amounts in RMB'000 Yuan unless otherwise stated) [English translation for reference only]
- 67 -
1. General information The operational activities of Midea Group Co. Ltd. (hereinafter referred to as the “Company”) and its subsidiaries (collectively referred to as the “Group”) are principally engaged in the manufacturing and sale of household electrical appliances, design and implementation of scheme for robots and industrial automation system. Other operations include sale, wholesale and processing of raw materials of household electrical appliances and financial business, which includes customer deposits, interbank lending, consumption credit, buyer’s credit and finance lease. The Company was promoted and set up by the Council of Trade Unions of GD Midea Group Co. Ltd., and was registered in Market Safety Supervision Bureau of Shunde District, Foshan on 7 April 2000, with its headquarters located in Shunde District, Foshan. On 31 December 2011, the Company was transformed into a limited liability company. On 29 July 2013, the Company was approved to acquire additional interests in Guangdong Midea Electric Co., Ltd., a subsidiary listed on Shenzhen Stock Exchange. On 18 September 2013, the Company’s shares became listed on Shenzhen Stock Exchange through share issuance and share exchange. As at 30 June 2017, the Company's registered capital is RMB6,519,637,198 and the total number of shares in issue is 6,519,637,198, of which 211,676,460 shares are restricted tradable shares and 6,307,960,738 shares are unrestricted tradable shares. The detailed information of major subsidiaries included in the consolidation scope in the current year is set out in Note 5 and 6. Entities newly included in the consolidation scope in the current year include Guangdong Midea Electric Co., Ltd., Guangdong Midea Intelligent Robotics Co., Ltd., Chongqing Midea Microfinance Loan Co., Ltd., Guangdong Midea Advanced Technologies Co., Ltd., Hefei Midea Advanced Technologies Co., Ltd., Guangdong Midea Kafei Coffee Machine Manufacturing Co., Ltd., Midea Electric Netherlands (I) B.V., KUKA Group and its subsidiaries (“KUKA”), Easy Conveyors B.V., and Servotronix and its subsidiaries (“SMC”). Please refer to Note 5(1) and 5(2)(a) for details. The detailed information of subsidiaries no longer included in the consolidation scope in the current year is set out in Note 5(2)(b). These financial statements were authorised for issue by the Company’s Board of Directors on 29 August 2017.
2 Summary of significant accounting policies and accounting estimates The Group determines specific accounting policies and accounting estimates based on the features of production and operation, mainly including the recognition method of provision for bad debts of accounts receivable (Note 2(10)), valuation method of inventory (Note 2(12)), depreciation of fixed assets and amortisation of intangible assets (Note (15) and (18)), and recognition time of revenue (Note 2(27)). Critical judgements applied by the Group in determining significant accounting policies are set out in Note 2(32).
(1) Basis of preparation
The financial statements are prepared in accordance with the Accounting Standard for Business Enterprises - Basic Standard, and the specific accounting standards and other relevant regulations issued by the Ministry of Finance on 15 February 2006 and in subsequent periods (hereafter collectively referred to as the “Accounting Standards for Business Enterprises” or “CAS”) and the disclosure requirements in the Preparation Convention of Information Disclosure by Companies Offering Securities to the Public No.15 – General Rules on Financial Reporting issued by the China Securities Regulatory Commission. The financial statements are prepared on a going concern basis.

MIDEA GROUP CO., LTD. NOTES TO THE FINANCIAL STATEMENTS FOR THE SIX MONTHS ENDED 30 JUNE 2017 (All amounts in RMB'000 Yuan unless otherwise stated) [English translation for reference only]
- 68 -
2 Summary of significant accounting policies and accounting estimates (Cont’d)
(2) Statement of compliance with the Accounting Standards for Business Enterprises The financial statements of the Company for the six months ended 30 June 2017 are in compliance with the Accounting Standards for Business Enterprises, and truly and completely present the financial position of the consolidated and the Company as at 30 June 2017 and their financial performance, cash flows and other information for the six months then ended.
(3) Accounting period The Company’s accounting year starts on 1 January and ends on 31 December.
(4) Recording currency The recording currency of the Company is the Renminbi (“RMB”) and the financial statements are presented in RMB. The Company and its subsidiaries determine their recording currency based on the valuation and settlement currency of their respective main operating revenues and expenses. As the recording currency of some of the Company's subsidiaries is not RMB, the Company translates the foreign currency financial statements of such subsidiaries in the preparation of financial statements (Note 2(8)(b)).
(5) Business combinations
(a) Business combinations involving enterprises under common control The consideration paid and net assets obtained by the absorbing party in a business combination are measured at the carrying amount. The difference between the carrying amount of the net assets obtained from the combination and the carrying amount of the consideration paid for the combination is treated as an adjustment to capital surplus (share premium). If the capital surplus (share premium) is not sufficient to absorb the difference, the remaining balance is adjusted against retained earnings. Costs directly attributable to the combination are included in profit or loss in the period in which they are incurred. Transaction costs associated with the issue of equity or debt securities for the business combination are included in the initially recognised amounts of the equity or debt securities.
(b) Business combinations involving enterprises not under common control The cost of combination and identifiable net assets obtained by the acquirer in a business combination are measured at fair value at the acquisition date. Where the cost of the combination exceeds the acquirer’s interest in the fair value of the acquiree’s identifiable net assets, the difference is recognised as goodwill; where the cost of combination is lower than the acquirer’s interest in the fair value of the acquiree’s identifiable net assets, the difference is recognised in profit or loss for the current period. Costs directly attributable to the combination are included in profit or loss in the period in which they are incurred. Transaction costs associated with the issue of equity or debt securities for the business combination are included in the initially recognised amounts of the equity or debt securities.
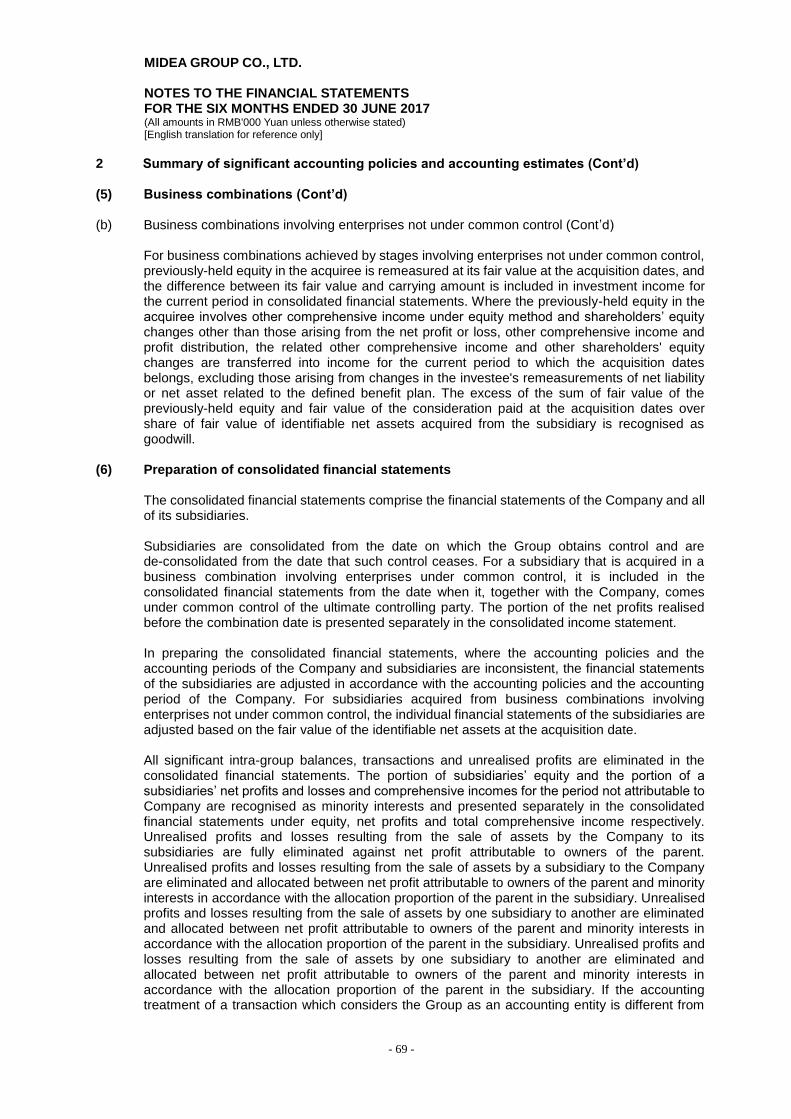
MIDEA GROUP CO., LTD. NOTES TO THE FINANCIAL STATEMENTS FOR THE SIX MONTHS ENDED 30 JUNE 2017 (All amounts in RMB'000 Yuan unless otherwise stated) [English translation for reference only]
- 69 -
2 Summary of significant accounting policies and accounting estimates (Cont’d) (5) Business combinations (Cont’d) (b) Business combinations involving enterprises not under common control (Cont’d)
For business combinations achieved by stages involving enterprises not under common control, previously-held equity in the acquiree is remeasured at its fair value at the acquisition dates, and the difference between its fair value and carrying amount is included in investment income for the current period in consolidated financial statements. Where the previously-held equity in the acquiree involves other comprehensive income under equity method and shareholders’ equity changes other than those arising from the net profit or loss, other comprehensive income and profit distribution, the related other comprehensive income and other shareholders' equity changes are transferred into income for the current period to which the acquisition dates belongs, excluding those arising from changes in the investee's remeasurements of net liability or net asset related to the defined benefit plan. The excess of the sum of fair value of the previously-held equity and fair value of the consideration paid at the acquisition dates over share of fair value of identifiable net assets acquired from the subsidiary is recognised as goodwill.
(6) Preparation of consolidated financial statements
The consolidated financial statements comprise the financial statements of the Company and all of its subsidiaries. Subsidiaries are consolidated from the date on which the Group obtains control and are de-consolidated from the date that such control ceases. For a subsidiary that is acquired in a business combination involving enterprises under common control, it is included in the consolidated financial statements from the date when it, together with the Company, comes under common control of the ultimate controlling party. The portion of the net profits realised before the combination date is presented separately in the consolidated income statement. In preparing the consolidated financial statements, where the accounting policies and the accounting periods of the Company and subsidiaries are inconsistent, the financial statements of the subsidiaries are adjusted in accordance with the accounting policies and the accounting period of the Company. For subsidiaries acquired from business combinations involving enterprises not under common control, the individual financial statements of the subsidiaries are adjusted based on the fair value of the identifiable net assets at the acquisition date. All significant intra-group balances, transactions and unrealised profits are eliminated in the consolidated financial statements. The portion of subsidiaries’ equity and the portion of a subsidiaries’ net profits and losses and comprehensive incomes for the period not attributable to Company are recognised as minority interests and presented separately in the consolidated financial statements under equity, net profits and total comprehensive income respectively. Unrealised profits and losses resulting from the sale of assets by the Company to its subsidiaries are fully eliminated against net profit attributable to owners of the parent. Unrealised profits and losses resulting from the sale of assets by a subsidiary to the Company are eliminated and allocated between net profit attributable to owners of the parent and minority interests in accordance with the allocation proportion of the parent in the subsidiary. Unrealised profits and losses resulting from the sale of assets by one subsidiary to another are eliminated and allocated between net profit attributable to owners of the parent and minority interests in accordance with the allocation proportion of the parent in the subsidiary. Unrealised profits and losses resulting from the sale of assets by one subsidiary to another are eliminated and allocated between net profit attributable to owners of the parent and minority interests in accordance with the allocation proportion of the parent in the subsidiary. If the accounting treatment of a transaction which considers the Group as an accounting entity is different from
MIDEA GROUP CO., LTD. NOTES TO THE FINANCIAL STATEMENTS FOR THE SIX MONTHS ENDED 30 JUNE 2017 (All amounts in RMB'000 Yuan unless otherwise stated) [English translation for reference only]
- 70 -
that considers the Company or its subsidiaries as an accounting entity, it is adjusted from the perspective of the Group.

MIDEA GROUP CO., LTD. NOTES TO THE FINANCIAL STATEMENTS FOR THE SIX MONTHS ENDED 30 JUNE 2017 (All amounts in RMB'000 Yuan unless otherwise stated) [English translation for reference only]
- 71 -
2 Summary of significant accounting policies and accounting estimates (Cont’d) (7) Recognition criteria of cash and cash equivalents
Cash and cash equivalents comprise cash on hand, deposits that can be readily drawn on demand, and short-term and highly liquid investments that are readily convertible to known amounts of cash and which are subject to an insignificant risk of changes in value.
(8) Foreign currency translation (a) Foreign currency transaction
Foreign currency transactions are translated into RMB using the exchange rates prevailing at the dates of the transactions. At the balance sheet date, monetary items denominated in foreign currencies are translated into RMB using the spot exchange rates on the balance sheet date. Exchange differences arising from these translations are recognised in profit or loss for the current period, except for those attributable to foreign currency borrowings that have been taken out specifically for the acquisition or construction of qualifying assets, which are capitalised as part of the cost of those assets. Non-monetary items denominated in foreign currencies that are measured at historical costs are translated at the balance sheet date using the spot exchange rates at the date of the transactions. The effect of exchange rate changes on cash is presented separately in the cash flow statement.
(b) Translation of foreign currency financial statements
The asset and liability items in the balance sheets for overseas operations are translated at the spot exchange rates on the balance sheet date. Among the owners’ equity items, the items other than “undistributed profits” are translated at the spot exchange rates of the transaction dates. The income and expense items in the income statements of overseas operations are translated at the spot exchange rates of the transaction dates. The differences arising from the above translation are presented in other comprehensive income. The cash flows of overseas operations are translated at the spot exchange rates on the dates of the cash flows. The effect of exchange rate changes on cash is presented separately in the cash flow statement.
(9) Financial instruments
(a) Financial assets (i) Classification of financial assets
Financial assets are classified into the following categories at initial recognition: financial assets at fair value through profit or loss, loans and receivables and available-for-sale financial assets. The classification of financial assets depends on the Group’s intention and ability to hold the financial assets. Financial assets at fair value through profit or loss Financial assets at fair value through profit or loss include financial assets held for the purpose of selling in the short term and derivative financial instruments.

MIDEA GROUP CO., LTD. NOTES TO THE FINANCIAL STATEMENTS FOR THE SIX MONTHS ENDED 30 JUNE 2017 (All amounts in RMB'000 Yuan unless otherwise stated) [English translation for reference only]
- 72 -
2 Summary of significant accounting policies and accounting estimates (Cont’d) (9) Financial instrument (Cont’d)
(a) Financial assets (Cont’d) (i) Classification of financial assets (Cont’d)
Loans and receivables Loans and receivables are non-derivative financial assets with fixed or determinable payments that are not quoted in an active market, including cash at bank and on hand, deposits with central bank, deposits with banks and other financial institutions, loans and advances, interest receivable, dividends receivable, accounts receivable and structural deposits with banks. Available-for-sale financial assets Available-for-sale financial assets are non-derivative financial assets that are either designated in this category or not classified in any of the other categories at initial recognition. Available-for-sale financial assets are included in other current assets - wealth management products on the balance sheet if management intends to dispose of them within 12 months after the balance sheet date, while those are included in other non-current assets - wealth management products if management intends to dispose of them over 12 months after the balance sheet date.
(ii) Derivative financial instruments
The derivative financial instruments held or issued by the Group are mainly used in controlling risk exposures. Derivative financial instruments are initially recognised at fair value on the day when derivatives transaction contract was signed, and subsequently measured at fair value. The derivative financial instruments are recorded as assets when they have a positive fair value and as liabilities when they have a negative fair value.
The recognition of changes in fair value of derivative financial instruments depends on whether such derivative financial instruments are designated as hedging instruments and meet requirements for hedging instruments, and depends on the nature of hedged items in this case. For derivative financial instruments that are not designated as hedging instruments and fail to meet requirements on hedging instruments, including those held for the purpose of providing hedging against specific risks in interest rate and foreign exchange but not conforming with requirements of hedge accounting, the changes in fair value are recorded in gains or losses arising from changes in fair value in the consolidated income statement.
At the inception of the transaction, the Group officially designates the hedging relations between hedging instruments and hedged items and documents the hedging relations, risk management objectives and hedging strategies. The Group also makes written assessment of the effectiveness of hedging instruments in offsetting changes in the fair value or cash flow of hedged items. These criteria should be met before hedging accounting is determined as applicable to such hedges.
Cash flow hedging Cash flow hedge is a hedge of the exposure to variability in cash flows that is attributable to a particular risk associated with a recognised asset or liability (such as all or some future interest payments on variable rate debt) or a highly probable forecast transaction that could ultimately affect the profit or loss.

MIDEA GROUP CO., LTD. NOTES TO THE FINANCIAL STATEMENTS FOR THE SIX MONTHS ENDED 30 JUNE 2017 (All amounts in RMB'000 Yuan unless otherwise stated) [English translation for reference only]
- 73 -
2 Summary of significant accounting policies and accounting estimates (Cont’d) (9) Financial instrument (Cont’d)
(a) Financial assets (Cont’d) (ii) Derivative financial instruments (Cont’d)
Cash flow hedging (Cont’d) The effective portion of changes in the fair value of hedging instruments that are designated and qualify as cash flow hedges is recognised in other comprehensive income in current year and accumulated in equity in the “other comprehensive income”. The ineffective portion is recognised immediately in the profit or loss.
Amounts accumulated in equity are reclassified to the profit or loss in the same periods when the hedged item affects the profit or loss.
When a hedging instrument expires or is sold, or the hedge designation is revoked or when a hedge no longer meets the criteria for hedge accounting, any cumulative gain or loss on the hedging instrument existing in equity at that time remains in equity and is reclassified to the profit or loss when the forecast transaction ultimately occurs. When a forecast transaction is no longer expected to occur, the cumulative gain or loss existing in equity is immediately transferred to the profit or loss.
(iii) Recognition and measurement
Financial assets are recognised at fair value on the balance sheet when the Group becomes a party to the contractual provisions of the financial instrument. In the case of financial assets at fair value through profit or loss, the related transaction costs incurred at the time of acquisition are recognised in profit or loss for the current period. For other financial assets, transaction costs that are attributable to the acquisition of the financial assets are included in their initially recognised amounts.
Financial assets at fair value through profit or loss and available-for-sale financial assets are subsequently measured at fair value. Investments in equity instruments are measured at cost when they do not have a quoted market price in an active market and whose fair value cannot be reliably measured. Receivables and held-to-maturity investments are measured at amortised cost using the effective interest method.
Gains or losses arising from change in the fair value of financial assets at fair value through profit or loss are recognised in profit or loss. Interests and cash dividends received during the period in which such financial assets are held, as well as the gains or losses arising from disposal of these assets are recognised in profit or loss for the current period. Gains or losses arising from change in fair value of available-for-sale financial assets are recognised directly in shareholder’s equity, except for impairment losses and foreign exchange gains and losses arising from translation of monetary financial assets. When such financial assets are derecognised, the cumulative gains or losses previously recognised directly into equity are recycled into profit or loss for the current period. Interests on available-for-sale investments in debt instruments calculated using the effective interest method during the period in which such investments are held and cash dividends declared by the investee on available-for-sale investments in equity instruments are recognised as investment income, which is recognised in profit or loss for the period.

MIDEA GROUP CO., LTD. NOTES TO THE FINANCIAL STATEMENTS FOR THE SIX MONTHS ENDED 30 JUNE 2017 (All amounts in RMB'000 Yuan unless otherwise stated) [English translation for reference only]
- 74 -
2 Summary of significant accounting policies and accounting estimates (Cont’d) (9) Financial instrument (Cont’d)
(a) Financial assets (Cont’d) (iv) Impairment of financial assets
The Group assesses the carrying amounts of financial assets other than those at fair value through profit or loss at each balance sheet date. If there is objective evidence that a financial asset is impaired, an impairment loss is provided for. Objective evidence indicating impairment of financial assets refers to the matter that actually occurs after the initial recognition of financial assets, it will affect estimated future cash flows of financial assets, and its impact can be reliably measured. Objective evidence indicating impairment of available-for-sale investments in equity instruments includes a significant or prolonged decline in the fair value of an investment in an equity instrument. The Group reviews available-for-sale investments in equity instruments on an individual basis at the balance sheet date. If the fair value of an equity instrument investment at the balance sheet date is lower than 50% (inclusive) of its initial cost for more than 12 months (inclusive), it indicates that the impairment has occurred. If the fair value at the balance sheet date is lower than 20% (inclusive) but no more than 50%, the Group considers other relevant factors, such as price fluctuation rate, to determine whether an impairment of equity instrument investment occurs. The Group calculates the initial cost of available-for-sale equity instrument using weighted average method.
When an impairment loss on a financial asset carried at amortised cost has occurred, the amount of loss is provided for at the difference between the asset’s carrying amount and the present value of its estimated future cash flows (excluding future credit losses that have not been incurred). If there is objective evidence that the value of the financial asset recovered and the recovery is related objectively to an event occurring after the impairment was recognised, the previously recognised impairment loss is reversed and the amount of reversal is recognised in profit or loss. If an impairment loss on available-for-sale financial assets measured at fair value is incurred, the cumulative losses arising from the decline in fair value that had been recognised directly in shareholders' equity are transferred out from equity and into impairment loss. For an investment in debt instrument classified as available-for-sale on which impairment losses have been recognised, if, in a subsequent period, its fair value increases and the increase can be objectively related to an event occurring after the impairment loss was recognised in profit or loss, the previously recognised impairment loss is reversed into profit or loss for the current period. For an investment in an equity instrument classified as available-for-sale on which impairment losses have been recognised, the increase in its fair value in a subsequent period is recognised directly in equity. If available-for-sale financial asset, which is measured at cost model, is impaired, the amount of loss is measured as the difference between the asset’s carrying amount and the present value of estimated future cash flows discounted at the current market rate of return for a similar financial asset. Impairment losses on these assets are not recognised in profit or loss for the current period. The previously recognised impairment loss will not be reversed in subsequent periods. Please refer to Note 2(10) for accounting policies related to impairment of receivables.

MIDEA GROUP CO., LTD. NOTES TO THE FINANCIAL STATEMENTS FOR THE SIX MONTHS ENDED 30 JUNE 2017 (All amounts in RMB'000 Yuan unless otherwise stated) [English translation for reference only]
- 75 -
2 Summary of significant accounting policies and accounting estimates (Cont’d) (9) Financial instrument (Cont’d)
(a) Financial assets (Cont’d) (v) Derecognition of financial assets
A financial asset is derecognised when any of the below criteria is met: (1) the contractual rights to receive the cash flows from the financial asset expire; (2) the financial asset has been transferred and the Group transfers substantially all the risks and rewards of ownership of the financial asset to the transferee; or (3) the financial asset has been transferred and the Group has not retained control of the financial asset, although the Group neither transfers nor retains substantially all the risks and rewards of ownership of the financial asset. On derecognition of a financial asset, the difference between the carrying amount and the sum of the consideration received and the cumulative changes in fair value that had been recognised directly in equity, is recognised in profit or loss.
(b) Financial liabilities
Financial liabilities are classified into two categories at initial recognition: financial liabilities at fair value through profit or loss and other financial liabilities. The Group's financial liabilities include derivative financial liabilities, accounts payable, notes payable, borrowings, customer deposits and deposits from banks and other financial institutions, financial assets sold under repurchase agreements and interest payable. Payables comprise accounts payable, other payables and other current liabilities, and are recognised at fair value at initial recognition. Payables are subsequently measured at amortised cost using the effective interest method. Borrowings and debentures payable are recognised initially at fair value, net of transaction costs incurred, and subsequently measured at amortised cost using the effective interest method. Other financial liabilities of which the period is within one year (including one year) are classified as the current liabilities; the period is over one year while will be due within one year (including one year) since the balance sheet date are classified as current portion of non-current liabilities; and the others are classified as non-current liabilities. A financial liability (or a part of a financial liability) is derecognised when all or part of the obligation is extinguished. The difference between the carrying amount of a financial liability (or part of a financial liability) extinguished and the consideration paid, shall be recognised in profit or loss.
(c) Determination of fair value of financial instruments
The fair value of a financial instrument that is traded in an active market is determined at the quoted price in the active market. The fair value of a financial instrument that is not traded in an active market is determined by using a valuation technique. During valuation, the Group uses valuation technique appropriate in the current situation with sufficient available data and other supporting information, and select input with the same feature of assets or liabilities which are taken into consideration by market participants in transactions of related assets and liabilities, and observable inputs are preferential. When relevant observable inputs are impossible or not practicable be obtained, unobservable inputs are used.

MIDEA GROUP CO., LTD. NOTES TO THE FINANCIAL STATEMENTS FOR THE SIX MONTHS ENDED 30 JUNE 2017 (All amounts in RMB'000 Yuan unless otherwise stated) [English translation for reference only]
- 76 -
2 Summary of significant accounting policies and accounting estimates (Cont’d) (10) Provision for bad debts of receivables
Receivables comprise accounts receivable and other receivables. Accounts receivable arising from sales of goods or rendering of services are initially recognised at fair value of the contractual payments from the buyers or service recipients.
(a) Receivables with amounts that are individually significant and subject to separate assessment for provision for bad debts Receivables with amounts that are individually significant are subject to separate assessment for impairment. If there exists objective evidence that the Group will not be able to collect the amount under the original terms, a provision for impairment of that receivable is made. The judgement standard for individually significant amount is an individual amount exceeding RMB5,000,000 for accounts receivable and RMB500,000 for other receivables. The method of providing for bad debts for those individually significant amounts is as follows: the amount of the present value of the future cash flows expected to be derived from the receivable below its carrying amount.
(b) Accounts receivable and other receivables that are subject to provision for bad debts on the
grouping basis
Receivables with amounts that are not individually significant and those receivables that have been individually assessed for impairment and have not been found impaired are classified into certain groupings based on their credit risk characteristics. The provision for bad debts is determined based on the historical loss experience for the groupings of receivables with similar credit risk characteristics, taking into consideration of the current circumstances. The Group assesses the recovery risk of receivables based on the characteristics of different regions. The Company's subsidiaries in Mainland China classify the credit risk groupings by taking the ageing of receivables as the risk characteristics and determine different provision ratios based on business features:
Within 6 months
6 months to 1 year 1 to 2 years 2 to 3 years 3 to 5 years Over 5 years
Heating Ventilating
& Air Conditioning (“HVAC”) 0%, 5% 5% 10% 30% 50% 100%
Consumer appliances 0%, 5% 5% 10% 30% 50% 100%
Robots and automatic system
5% 5% 10% 30% 50% 100%
Others 0%, 5% 5% 10% 30% 50% 100%
The Company's subsidiaries in Japan classify the credit risk groupings by taking the overdue of receivables as the risk characteristics and make bad debts provision using percentage-of-balance method with reference to the average percentage of bad debts during last three years. For the receivables that are overdue, they make bad debts provision on an individual basis. The Company's subsidiaries in Hong Kong, Macau, Singapore and Italy make bad debts provision for receivables on an individual basis.

MIDEA GROUP CO., LTD. NOTES TO THE FINANCIAL STATEMENTS FOR THE SIX MONTHS ENDED 30 JUNE 2017 (All amounts in RMB'000 Yuan unless otherwise stated) [English translation for reference only]
- 77 -
2 Summary of significant accounting policies and accounting estimates (Cont’d) (10) Provision for bad debts of receivables (Cont’d) (b) Accounts receivable and other receivables that are subject to provision for bad debts on the
grouping basis (Cont’d) The Company's subsidiaries in Brazil make no bad debts provision for receivables with the ageing within 1 year and adopt 100% provision ratio for those with the ageing over 1 year. The Company's subsidiaries in Germany classify the credit risk groupings by taking the expiring date of receivables as the risk characteristics. The Company's subsidiaries in Israel classify the credit risk groupings by taking the ageing of receivables as the risk characteristics.
(c) Accounts receivable and other receivables with amounts that are not individually significant but
subject to separate assessment for provision for bad debts
The reason for making separate assessment for provision for bad debts is that there exists objective evidence that the Group will not be able to collect the amount under the original terms of the receivable. The provision for bad debts is determined based on the amount of the present value of the future cash flows expected to be derived from the receivable below its carrying amount.
(d) When the Group transfers the accounts receivable to the financial institutions without recourse, the difference between the proceeds received from the transaction and their carrying amounts and the related taxes is recognised in profit or loss for the current period.
(11) Provision for bad debts of loans and advances
The provision for bad debts of loans and advances is provided by five-tier loan classification of ending balances of loans and advances as follows: The Group assesses the carrying amounts of the loans and advances at each balance sheet date. If there is objective evidences that the loans and advances are impaired, provision will be made at the difference between the carrying amount and the present value of its estimated future cash flows (excluding future credit losses that have not been incurred). Loans and advances that have not been individually assessed for impairment are classified into certain groupings based on their credit risk characteristics. The provision for bad debts is determined based on the historical loss experience for the groupings of loans and advances with similar credit risk characteristics, and take the current circumstances into consideration.
(12) Inventories
(a) Classification of inventories
Inventories, including raw materials, consigned processing materials, low value consumables, work in progress, completed but unsettled products and finished goods, etc., are measured at the lower of cost and net realisable value.
MIDEA GROUP CO., LTD. NOTES TO THE FINANCIAL STATEMENTS FOR THE SIX MONTHS ENDED 30 JUNE 2017 (All amounts in RMB'000 Yuan unless otherwise stated) [English translation for reference only]
- 78 -
2 Summary of significant accounting policies and accounting estimates (Cont’d) (12) Inventories (Cont'd)
(a) Classification of inventories (Cont'd)
The amount of completed but unsettled works is determined on the basis of individual contract at the cost of contract incurred plus profits thereof and less losses recognised and amount settled. It is recognised as assets when the balance is positive and recognised as liabilities when the balance is negative.
(b) Costing of inventories Other than completed but unsettled products, cost is determined using the first-in first-out method when issued. The cost of goods of finished goods and work in progress comprises raw materials, direct labour and systematically allocated production overhead based on the normal production capacity.
(c) Basis for determining net realisable values of inventories and method for making provision for decline in the value of inventories Inventories are initially measured at cost. The cost of inventories comprises purchase cost, processing cost and other expenditures to bring the inventories to current site and condition. On the balance sheet date, inventories are measured at the lower of cost and net realisable value. Net realisable value is determined based on the estimated selling price in the ordinary course of business, less the estimated costs to completion and estimated costs necessary to make the sale and related taxes. Provision for decline in the value of inventories is determined at the excess amount of the cost as calculated based on the classification of inventories over their net realisable value, and are recognised in profit or loss for the current period.
(d) Inventory system The Group adopts the perpetual inventory system.
(e) Amortisation methods of low value consumables and packaging materials Low value consumables are expensed in full when issued and recognised in cost of related assets or in profit or loss for the current period.
(13) Long-term equity investments
Long-term equity investments comprise the Company’s long-term equity investments in its subsidiaries, and the Group’s long-term equity investments in its associates and joint venture. Subsidiaries are the investees over which the Company is able to exercise control. Subsidiaries are the investees over which the Company is able to exercise control. A joint venture is a joint arrangement which is structured through a separate vehicle over which the Group has joint control together with other parties and only has rights to the net assets of the arrangement based on legal forms, contractual terms and other facts and circumstances.
MIDEA GROUP CO., LTD. NOTES TO THE FINANCIAL STATEMENTS FOR THE SIX MONTHS ENDED 30 JUNE 2017 (All amounts in RMB'000 Yuan unless otherwise stated) [English translation for reference only]
- 79 -
2 Summary of significant accounting policies and accounting estimates (Cont’d)
(13) Long-term equity investments (Cont’d) Associates are the investees that the Group has significant influence on their financial and operating policies. Investments in subsidiaries are presented in the Company’s financial statements using the cost method, and are adjusted to the equity method when preparing the consolidated financial statements. Investments in a joint venture and associates are accounted for using the equity method.
(a) Determination of investment cost
For long-term equity investments acquired through a business combination: for long-term equity investments acquired through a business combination involving enterprises under common control, the investment cost shall be the absorbing party’s share of the carrying amount of owners’ equity of the party being absorbed at the combination date; for long-term equity investment acquired through a business combination involving enterprises not under common control, the investment cost shall be the combination cost. For business combinations achieved by stages involving enterprises not under common control, the initial investment cost accounted for using the cost method is the sum of carrying amount of previously-held equity investment and additional investment cost. For previously-held equity accounted for using the equity method, the accounting treatment of related other comprehensive income from disposal of the equity is carried out on a same basis with the investee's direct disposal of related assets or liabilities. Shareholders' equity, which is recognised due to changes in investee’s shareholders’ equity other than those arising from the net profit or loss, other comprehensive income and profit distribution, is accordingly transferred into profit or loss in the period in which the investment is disposed. For investment in previously-held equity accounted for using the recognition and measurement standards of financial instruments, the initial investment cost accounted for using the cost method is the sum of carrying amount of previously-held equity investment and additional investment cost. For long-term equity investments acquired not through a business combination: for long-term equity investment acquired by payment in cash, the initial investment cost shall be the purchase price actually paid; for long-term equity investments acquired by issuing equity securities, the initial investment cost shall be the fair value of the equity securities issued.
(b) Subsequent measurement and recognition of related profit and loss For long-term equity investments accounted for using the cost method, they are measured at the initial investment costs, and cash dividends or profit distribution declared by the investees are recognised as investment income in profit or loss.
For long-term equity investments accounted for using the equity method, where the initial investment cost of a long-term equity investment exceeds the Group’s share of the fair value of the investee’s identifiable net assets at the acquisition date, the long-term equity investment is measured at the initial investment cost; where the initial investment cost is less than the Group’s share of the fair value of the investee’s identifiable net assets at the acquisition date, the difference is included in profit or loss and the cost of the long-term equity investment is adjusted upwards accordingly.
MIDEA GROUP CO., LTD. NOTES TO THE FINANCIAL STATEMENTS FOR THE SIX MONTHS ENDED 30 JUNE 2017 (All amounts in RMB'000 Yuan unless otherwise stated) [English translation for reference only]
- 80 -
2 Summary of significant accounting policies and accounting estimates (Cont’d)
(13) Long-term equity investments (Cont’d)
(b) Subsequent measurement and recognition of related profit and loss (Cont’d) For long-term equity investments accounted for using the equity method, the Group recognises the investment income according to its share of net profit or loss of the investee. The Group discontinues recognising its share of the net losses of an investee after the carrying amounts of the long-term equity investment together with any long-term interests that in substance form part of the investor’s net investment in the investee are reduced to zero. However, if the Group has obligations for additional losses and the criteria with respect to recognition of provisions under the accounting standards on contingencies are satisfied, the Group continues recognising the investment losses and the provisions. The changes of the Group’s share of the investee’s owner's equity other than those arising from the net profit or loss, other comprehensive income and profit distribution, are recognised in the Group’s equity and the carrying amounts of the long-term equity investment are adjusted accordingly. The carrying amount of the investment is reduced by the Group’s share of the profit distribution or cash dividends declared by an investee. The unrealised profits or losses arising from the transactions between the Group and its investees are eliminated in proportion to the Group’s equity interest in the investees, based on which the investment gain or losses are recognised. Any losses resulting from transactions between the Group and its investees attributable to asset impairment losses are not eliminated.
(c) Basis for determining existence of control, jointly control or significant influence over investees
Control is the power to govern an investee and obtain variable returns from participating the investee's activities, and the ability to utilise the power of an investee to affect its returns. Joint control is the contractually agreed sharing of control over an arrangement, and relevant economic activity can be arranged upon the unanimous approval of the Group and other participants sharing of control rights. Significant influence is the power to participate in the financial and operating policy decisions of the investee, but is not control or joint control over those policies.
(d) Impairment of long-term equity investments The carrying amounts of long-term equity investments in subsidiaries, joint venture and associates are reduced to the recoverable amounts when the recoverable amounts are below their carrying amounts (Note 2(20)).

MIDEA GROUP CO., LTD. NOTES TO THE FINANCIAL STATEMENTS FOR THE SIX MONTHS ENDED 30 JUNE 2017 (All amounts in RMB'000 Yuan unless otherwise stated) [English translation for reference only]
- 81 -
2 Summary of significant accounting policies and accounting estimates (Cont’d) (14) Investment properties
Investment properties, including land use rights that have already been leased out, buildings that are held for the purpose of leasing and buildings that are being constructed or developed for future use for leasing, are measured initially at cost. Subsequent expenditures incurred in relation to an investment property are included in the cost of the investment property when it is probable that the associated economic benefits will flow to the Group and their costs can be reliably measured; otherwise, the expenditures are recognised in profit or loss in the period in which they are incurred. The Group adopts the cost model for subsequent measurement of investment properties. Buildings and land use rights are depreciated or amortised to their estimated net residual values over their estimated useful lives. The estimated useful lives, the estimated net residual values that are expressed as a percentage of cost and the annual depreciation (amortisation) rates of investment properties are as follows:
Estimated useful lives Estimated net
residual values Annual depreciation (amortisation) rates
Buildings 20 to 40 years 5% 2.38% to 4.75% Land use rights 40 to 50 years - 2% to 2.5% When an investment property is transferred to owner-occupied properties, it is reclassified as fixed asset or intangible asset at the date of the transfer. When an owner-occupied property is transferred out for earning rentals or for capital appreciation, the fixed asset or intangible asset is reclassified as investment properties at its carrying amount at the date of the transfer. At the time of transfer, the property is recognised based on the carrying amount before transfer. The investment properties' estimated useful lives, the estimated net residual values and the depreciation (amortisation) methods applied are reviewed and adjusted as appropriate at each year-end. An investment property is derecognised on disposal or when the investment property is permanently withdrawn from use and no future economic benefits are expected from its disposal. The net amount of proceeds from sale, transfer, retirement or damage of an investment property after its carrying amount and related taxes and expenses is recognised in profit or loss for the current period.

MIDEA GROUP CO., LTD. NOTES TO THE FINANCIAL STATEMENTS FOR THE SIX MONTHS ENDED 30 JUNE 2017 (All amounts in RMB'000 Yuan unless otherwise stated) [English translation for reference only]
- 82 -
2 Summary of significant accounting policies and accounting estimates (Cont’d) (15) Fixed assets
(a) Recognition and initial measurement of fixed assets
Fixed assets comprise buildings, land with permanent ownership, machinery and equipment, motor vehicles, computers and electronic equipment and office equipment.
Fixed assets are recognised when it is probable that the related economic benefits will flow to the Group and the costs can be reliably measured. The initial cost of purchased fixed assets include purchase price, related taxes and expenditures that are attributable to the assets incurred before the assets are ready for their intended use. The initial cost of self-constructed fixed assets is determined based on Note 2(16).
Subsequent expenditures incurred for a fixed asset are included in the cost of the fixed asset when it is probable that the associated economic benefits will flow to the Group and the related cost can be reliably measured. The carrying amount of the replaced part is derecognised. All the other subsequent expenditures are recognised in profit or loss in the period in which they are incurred.
(b) Depreciation methods of fixed assets
Fixed assets are depreciated using the straight-line method to allocate the cost of the assets to their estimated residual values over their estimated useful lives. For the fixed assets that have been provided for impairment loss, the related depreciation charge is prospectively determined based upon the adjusted carrying amounts over their remaining useful lives. The estimated useful lives, the estimated residual values expressed as a percentage of cost and the annual depreciation rates of the Group's fixed assets are as follows:
Classes Estimated useful
lives Estimated net
residual values Annual
depreciation rates
Buildings 20 to 60 years 0% to 10% 5% to 1.5%
Machinery and equipment 2 to 18 years 0% to 10% 50% to 5.0%
Motor vehicles 2 to 20 years 0% to 10% 50% to 4.5% Electronic equipment and other
equipment 2 to 20 years 0% to 10% 50% to 4.5%
Land with permanent ownership Permanent N/A N/A
The estimated useful lives and the estimated net residual values of the Group's fixed assets and the depreciation methods applied to the assets are reviewed, and adjusted as appropriate at each year-end.
MIDEA GROUP CO., LTD. NOTES TO THE FINANCIAL STATEMENTS FOR THE SIX MONTHS ENDED 30 JUNE 2017 (All amounts in RMB'000 Yuan unless otherwise stated) [English translation for reference only]
- 83 -
2 Summary of significant accounting policies and accounting estimates (Cont’d) (15) Fixed assets (Cont’d)
(c) Basis for identification of fixed assets held under finance leases and related measurement
A lease that transfers substantially all the risks and rewards incidental to ownership of an asset is a finance lease. The leased asset is recognised at the lower of the fair value of the leased asset and the present value of the minimum lease payments. The difference between the recorded amount of the leased asset and the minimum lease payments is accounted for as unrecognised finance charge.
Fixed assets held under a finance lease is depreciated on a basis consistent with the depreciation policy adopted for fixed assets that are self-owned. When a leased asset can be reasonably determined that its ownership will be transferred at the end of the lease term, it is depreciated over the period of expected use; otherwise, the leased asset is depreciated over the shorter period of the lease term and the period of expected use.
(d) The carrying amount of a fixed asset is reduced to the recoverable amount when the recoverable amount is below the carrying amount (Note 2(20)).
(e) Disposal of fixed assets
A fixed asset is derecognised on disposal or when no future economic benefits are expected from its use or disposal. The amount of proceeds from disposals on sale, transfer, retirement or damage of a fixed asset net of its carrying amount and related taxes and expenses is recognised in profit or loss for the current period.
(16) Construction in progress Construction in progress is measured at actual cost. Actual cost comprises construction costs, installation costs, borrowing costs that are eligible for capitalisation and other costs necessary to bring the fixed assets ready for their intended use. Construction in progress is transferred to fixed assets when the assets are ready for their intended use, and depreciation begins from the following month. The carrying amount of construction in progress is reduced to the recoverable amount when the recoverable amount is below the carrying amount (Note 2(20)).
MIDEA GROUP CO., LTD. NOTES TO THE FINANCIAL STATEMENTS FOR THE SIX MONTHS ENDED 30 JUNE 2017 (All amounts in RMB'000 Yuan unless otherwise stated) [English translation for reference only]
- 84 -
2 Summary of significant accounting policies and accounting estimates (Cont’d) (17) Borrowing costs
The borrowing costs that are directly attributable to the acquisition and construction of a fixed asset that needs a substantially long period of time for its intended use commence to be capitalised and recorded as part of the cost of the asset when expenditures for the asset and borrowing costs have been incurred, and the activities relating to the acquisition and construction that are necessary to prepare the asset for its intended use have commenced. The capitalisation of borrowing costs ceases when the asset under acquisition or construction becomes ready for its intended use and the borrowing costs incurred thereafter are recognised in profit or loss for the current period. Capitalisation of borrowing costs is suspended during periods in which the acquisition or construction of an asset is interrupted abnormally and the interruption lasts for more than 3 months, until the acquisition or construction is resumed. For the specific borrowings obtained for the acquisition or construction of a fixed asset qualifying for capitalisation, the amount of borrowing costs eligible for capitalisation is determined by deducting any interest income earned from depositing the unused specific borrowings in the banks or any investment income arising on the temporary investment of those borrowings during the capitalisation period. For the general borrowings obtained for the acquisition or construction of a fixed asset qualifying for capitalisation, the amount of borrowing costs eligible for capitalisation is determined by applying the weighted average effective interest rate of general borrowings, to the weighted average of the excess amount of cumulative expenditures on the asset over the amount of specific borrowings. The effective interest rate is the rate at which the estimated future cash flows during the period of expected duration of the borrowings or applicable shorter period are discounted to the initial amount of the borrowings.
(18) Intangible assets Intangible assets include land use rights, patents and non-patent technologies, trademark rights, trademark use rights and others, and are measured at cost.
(a) Land use rights Land use rights are amortised on the straight-line basis over their approved use period of 40 to 50 years. If the acquisition costs of the land use rights and the buildings located thereon cannot be reasonably allocated between the land use rights and the buildings, all of the acquisition costs are recognised as fixed assets.
(b) Patents and non-patent technologies
Patents are amortised on a straight-line basis over the statutory period of validity, the period as stipulated by contracts or the beneficial period.
(c) Trademark rights The trademark rights is measured at cost when acquired and is amortised over the estimated
useful life of 30 years. The cost of trademark rights obtained in the business combinations involving enterprises not under common control is measured at fair value.
(d) Trademark use rights The trademark use rights is measured at cost when acquired. The cost of trademark use rights
obtained in the business combinations involving enterprises not under common control is measured at fair value, and is amortised over the estimated useful life of 40 years.

MIDEA GROUP CO., LTD. NOTES TO THE FINANCIAL STATEMENTS FOR THE SIX MONTHS ENDED 30 JUNE 2017 (All amounts in RMB'000 Yuan unless otherwise stated) [English translation for reference only]
- 85 -
2 Summary of significant accounting policies and accounting estimates (Cont’d) (18) Intangible assets (Cont’d)
(e) Periodical review of useful life and amortisation method
For an intangible asset with a finite useful life, review of its useful life and amortisation method is performed at each year-end, with adjustment made as appropriate.
(f) Research and development (“R&D”)
The expenditure on an internal research and development project is classified into expenditure on the research phase and expenditure on the development phase based on its nature and whether there is material uncertainty that the research and development activities can form an intangible asset at the end of the project. Expenditure on the planned investigation, evaluation and selection for the research of production processes or products is categorised as expenditure on the research phase, and it is recognised in profit or loss when it is incurred. Expenditure on design and test for the final application of the development of production processes or products before mass production is categorised as expenditure on the development phase, which is capitalised only if all of the following conditions are satisfied:
The development of production processes or products has been fully justified by technical team;
The budget on the development of production processes or products has been approved by the management;
There is market research analysis that demonstrates the product produced by the production process or product has the ability of marketing;
There are sufficient technical and financial resources to support the development of production processes or products and subsequent mass production; and
Expenditure attributable to the development of production processes or products can be reliably measured.
Other development expenditures that do not meet the conditions above are recognised in profit or loss in the period in which they are incurred. Development costs previously recognised as expenses are not recognised as an asset in a subsequent period. Capitalised expenditure on the development phase is presented as development costs in the balance sheet and transferred to intangible assets at the date that the asset is ready for its intended use.
(g) Impairment of intangible assets
The carrying amount of intangible assets is reduced to the recoverable amount when the recoverable amount is below the carrying amount (Note 2(20)).
(19) Long-term prepaid expenses Long-term prepaid expenses include the expenditure for improvements to fixed assets held under operating leases, and other expenditures that have been incurred but should be recognised as expenses over more than one year in the current and subsequent periods. Long-term prepaid expenses are amortised on the straight-line basis over the expected beneficial period and are presented at actual expenditure net of accumulated amortisation.
MIDEA GROUP CO., LTD. NOTES TO THE FINANCIAL STATEMENTS FOR THE SIX MONTHS ENDED 30 JUNE 2017 (All amounts in RMB'000 Yuan unless otherwise stated) [English translation for reference only]
- 86 -
2 Summary of significant accounting policies and accounting estimates (Cont’d) (20) Impairment of long-term assets
Fixed assets, construction in progress, intangible assets with finite useful lives, investment properties measured using the cost model and long-term equity investments in subsidiaries, a joint venture and associates are tested for impairment if there is any indication that the assets may be impaired at the balance sheet date. Intangible assets not ready for their intended use and land with permanent ownership are tested at least annually for impairment, irrespective of whether there is any indication that it may be impaired. If the result of the impairment test indicates that the recoverable amount of an asset is less than its carrying amount, a provision for impairment and an impairment loss are recognised for the amount by which the asset’s carrying amount exceeds its recoverable amount. The recoverable amount is the higher of an asset’s fair value less costs to sell and the present value of the future cash flows expected to be derived from the asset. Provision for asset impairment is determined and recognised on the individual asset basis. If it is not possible to estimate the recoverable amount of an individual asset, the recoverable amount of a group of assets to which the asset belongs is determined. A group of assets is the smallest group of assets that is able to generate independent cash inflows. Goodwill that is separately presented in the financial statements is tested at least annually for impairment, irrespective of whether there is any indication that it may be impaired. In conducting the test, the carrying value of goodwill is allocated to the related asset groups or groups of asset groups which are expected to benefit from the synergies of the business combination. If the result of the test indicates that the recoverable amount of an asset group or group of asset groups, including the allocated goodwill, is lower than its carrying amount, the corresponding impairment loss is recognised. The impairment loss is first deducted from the carrying amount of goodwill that is allocated to the asset group or group of asset groups, and then deducted from the carrying amounts of other assets within the asset groups or groups of asset groups in proportion to the carrying amounts of assets other than goodwill.
Once the above asset impairment loss is recognised, it will not be reversed for the value recovered in the subsequent periods.
(21) Employee benefits
Employee benefits include short-term employee benefits, post-employment benefits, termination benefits and other long-term employee benefits provided in various forms of consideration in exchange for service rendered by employees or compensations for the termination of employment relationship.
(a) Short-term employee benefits
Short-term employee benefits include employee wages or salaries, bonus, allowances and subsidies, staff welfare, premiums or contributions on medical insurance, work injury insurance and maternity insurance, housing funds, union running costs and employee education costs, short-term paid absences. The employee benefit liabilities are recognised in the accounting period in which the service is rendered by the employees, with a corresponding charge to the profit or loss for the current period or the cost of relevant assets. Employee benefits which are non-monetary benefits are measured at fair value.
MIDEA GROUP CO., LTD. NOTES TO THE FINANCIAL STATEMENTS FOR THE SIX MONTHS ENDED 30 JUNE 2017 (All amounts in RMB'000 Yuan unless otherwise stated) [English translation for reference only]
- 87 -
2 Summary of significant accounting policies and accounting estimates (Cont’d)
(21) Employee benefits (Cont’d)
(b) Post-employment benefits The Group classifies post-employment benefit plans as either defined contribution plans or defined benefit plans. Defined contribution plans are post-employment benefit plans under which the Group pays fixed contributions into a separate fund and will have no obligation to pay further contributions; and Defined benefit plans are post-employment benefit plans other than defined contribution plans. During the reporting period, the Group's defined contribution plans mainly include basic pensions and unemployment insurance, while the defined benefit plans are that TLSC and KUKA, the Group’s subsidiaries, provide supplemental retirement benefits beyond the national regulatory insurance system. Basic pensions The Group’s employees participate in the basic pension plan set up and administered by local authorities of Ministry of Human Resource and Social Security. Monthly payments of premiums on the basic pensions are calculated according to prescribed bases and percentage by the relevant local authorities. When employees retire, the relevant local authorities are obliged to pay the basic pensions to them. The amounts based on the above calculations are recognised as liabilities in the accounting period in which the service has been rendered by the employees, with a corresponding charge to the profit or loss for the current period or the cost of relevant assets. Supplementary retirement benefits The liability recognised in the balance sheet in respect of defined benefit pension plans is the present value of the defined benefit obligation at the end of the reporting period less the fair value of plan assets. The defined benefit obligation is calculated annually by independent actuaries using the projected unit credit method. The present value of the defined benefit obligation is determined by discounting the estimated future cash outflows using interest rates of high-quality corporate bonds that are denominated in the currency in which the benefits will be paid, and that have terms to maturity approximating to the terms of the related pension obligation. The charges related to the supplemental retirement benefits (including current service costs, past-service costs and gains or losses on settlement) and net interest costs are recognised in the statement of profit or loss or included in the cost of an asset, and the changes of remeasurement in net liabilities or net assets arising from the benefit plan are charged or credited to equity in other comprehensive.
(c) Termination benefits
The Group provides compensation for terminating the employment relationship with employees before the end of the employment contracts or as an offer to encourage employees to accept voluntary redundancy before the end of the employment contracts. The Group recognises a liability arising from compensation for termination of the employment relationship with employees, with a corresponding charge to profit or loss at the earlier of the following dates: 1) when the Group cannot unilaterally withdraw the offer of termination benefits because of an employment termination plan or a curtailment proposal; 2) when the Group recognises costs or expenses related to the restructuring that involves the payment of termination benefits.
MIDEA GROUP CO., LTD. NOTES TO THE FINANCIAL STATEMENTS FOR THE SIX MONTHS ENDED 30 JUNE 2017 (All amounts in RMB'000 Yuan unless otherwise stated) [English translation for reference only]
- 88 -
2 Summary of significant accounting policies and accounting estimates (Cont’d)
(21) Employee benefits (Cont’d)
(c) Termination benefits (Cont’d) Early retirement benefits The Group offers early retirement benefits to those employees who accept early retirement arrangements. The early retirement benefits refer to the salaries and social security contributions to be paid to and for the employees who accept voluntary retirement before the normal retirement date prescribed by the State, as approved by the management. The Group pays early retirement benefits to those early retired employees from the early retirement date until normal retirement date. The Group accounts for the early retirement benefits in accordance with the treatment of termination benefits, in which the salaries and social security contributions to be paid to and for the early retired employees from the off-duty date to the normal retirement date are recognised as liabilities with a corresponding charge to the profit or loss for the current period. The differences arising from the changes in the respective actuarial assumptions of the early retirement benefits and the adjustments of benefit standards are recognised in profit or loss in the period in which they occur. The termination benefits expected to be paid within one year since the balance sheet date are classified as current liabilities.
(22) Financial assets sold under repurchase agreements Assets sold under agreements to repurchase at a specific future date are not derecognised from the balance sheet. The corresponding proceeds are recognised on the balance sheet under “Repurchase agreements”. The difference between the sale price and the repurchase price is treated as interest expense and is accrued over the life of the agreement using the effective interest method.
(23) General reserve
General reserve is the reserve appropriated from undistributed profits to cover part of unidentified potential losses, on the basis of the estimated potential risk value of risk assets assessed by the standardised approach, which is deducted from recognised provision for impairment losses on loans. Risk assets include loans and advances, available-for-sale financial assets, long-term equity investments, deposits with banks and other financial institutions and other receivables of subsidiary engaged in financial business.
(24) Dividend distribution
Cash dividend is recognised as a liability for the period in which the dividend is approved by the shareholders’ meeting.
MIDEA GROUP CO., LTD. NOTES TO THE FINANCIAL STATEMENTS FOR THE SIX MONTHS ENDED 30 JUNE 2017 (All amounts in RMB'000 Yuan unless otherwise stated) [English translation for reference only]
- 89 -
2 Summary of significant accounting policies and accounting estimates (Cont’d)
(25) Provisions Provisions for product warranties, onerous contracts etc. are recognised when the Group has a present obligation, it is probable that an outflow of economic benefits will be required to settle the obligation, and the amount of the obligation can be measured reliably. A provision is initially measured at the best estimate of the expenditure required to settle the related present obligation. Factors surrounding a contingency, such as the risks, uncertainties and the time value of money, are taken into account as a whole in reaching the best estimate of a provision. Where the effect of the time value of money is material, the best estimate is determined by discounting the related future cash outflows. The increase in the discounted amount of the provision arising from passage of time is recognised as interest expense. The carrying amount of provisions is reviewed at each balance sheet date and adjusted to reflect the current best estimate.
(26) Share-based payment
(a) Type of share-based payment Share-based payment is a transaction in which the entity acquires services from employees as consideration for equity instruments of the entity or by incurring liabilities for amounts based on the equity instruments. Equity instruments include equity instruments of the Company, its parent company or other accounting entities of the Group. Share-based payments are divided into equity-settled and cash-settled payments. The Group’s share-based payments are equity-settled payments. Equity-settled share-based payment The Group’s share option plan is the equity-settled share-based payment in exchange of employees' services and is measured at the fair value of the equity instruments at grant date. The equity instruments are exercisable after services in vesting period are completed or specified performance conditions are met. In the vesting period, the services obtained in current period are included in relevant cost and expenses at the fair value of the equity instruments at grant date based on the best estimate of the number of exercisable equity instruments, and capital surplus is increased accordingly. If the subsequent information indicates the number of exercisable equity instruments differs from the previous estimate, an adjustment is made and, on the exercise date, the estimate is revised to equal the number of actual vested equity instruments. On the exercise date, the recognised amount calculated based on the number of exercised equity instruments is transferred into share capital.
(b) Determination of the fair value of equity instruments
The Group determines the fair value of share options using option pricing model, which is Black - Scholes option pricing model.
MIDEA GROUP CO., LTD. NOTES TO THE FINANCIAL STATEMENTS FOR THE SIX MONTHS ENDED 30 JUNE 2017 (All amounts in RMB'000 Yuan unless otherwise stated) [English translation for reference only]
- 90 -
2 Summary of significant accounting policies and accounting estimates (Cont’d) (26) Share-based payment (Cont'd) (c) Basis for determining best estimate of exercisable equity instruments
At the end of each reporting period, the group revises its estimates of the number of options that are expected to vest based on the non-marketing performance and service conditions. On the exercise date, the final number of estimated exercisable equity instruments is consistent with the number of exercised equity instruments.
(d) Accounting treatment related to the exercise of share options
When the options are exercised, the company issues new shares. The proceeds received net of any directly attributable transaction costs are credited to share capital (and share premium). At the same time, capital surplus recognised in the vesting period are carried forward to share premium.
(27) Revenue The amount of revenue is determined in accordance with the fair value of the consideration received or receivable for the sales of goods and services in the ordinary course of the Group’s activities. Revenue is shown net of discounts, rebates and returns. Revenue is recognised when the economic benefits associated with the transaction will flow to the Group, the related revenue can be reliably measured, and the specific revenue recognition criteria have been met for each type of the Group’s activities as described below:
(a) Sales of goods The Group are principally engaged in the manufacturing and sales of home appliances and mechanical and electrical products (namely large household appliances, small household appliances and motors). Revenue from domestic sales is recognised when 1) the goods are delivered to buyers by the Group pursuant to contracts; 2) the amount of revenue is confirmed; 3) payments for goods are collected or receipts are acquired; and 4) the related economic benefits will flow to the Group; and the related costs can be measured reliably. Upon confirming the acceptance, the buyer has the right to sell the products at its discretion and takes the risks of any price fluctuations and obsolescence and loss of the products. Revenue from overseas sales is recognised when 1) the goods have left the port and obtain the bill of lading pursuant to contracts; 2) the amount of revenue is confirmed; 3) payments for goods are collected or obtain related receipts; and 4) the related economic benefits will flow to the Group and the related costs can be measured reliably.
(b) Rendering of services
Revenue from transportation service, storage service, distribution service and installation service as provided by the Group is recognised when the services are completed.

MIDEA GROUP CO., LTD. NOTES TO THE FINANCIAL STATEMENTS FOR THE SIX MONTHS ENDED 30 JUNE 2017 (All amounts in RMB'000 Yuan unless otherwise stated) [English translation for reference only]
- 91 -
2 Summary of significant accounting policies and accounting estimates (Cont’d)
(27) Revenue (Cont'd)
(c) Construction contract Where the outcome of a construction contract can be estimated reliably, revenue and costs
thereof are recognised using the “percentage-of-completion” method as at the balance sheet date, the stage of completion is measured by reference to the contract costs incurred up to the end of the reporting period as a percentage of total estimated costs for each contract.
The outcome of a construction contract can be estimated reliably when all of the following
conditions are concurrently met: (1) The total contract revenue can be measured reliably; (2) It is highly probable that the economic benefits associated with the contract will flow to the enterprise; (3) The contract costs incurred thus far can be clearly identified and measured reliably; (4) Both the stage of completion and the costs necessary to complete the contract can be reliably measured.
Where the outcome of a construction contract cannot be estimated reliably, contract revenue is
recognised to the extent that contract costs can be recovered actually. Contract costs are recognised as expenses in the period in which they are incurred. Otherwise, contract costs are recognised as expenses immediately, not as contract revenue. If the unexpected factors no longer exist which make construction contract unable to be estimated reliably, revenue and costs are recognised using the percentage-of-completion method. When it is probable that total contract costs will exceed total contract revenue, the expected loss is recognised as an expense immediately. As at the balance sheet date, the actual total contract revenue multiply the percentage of completion less the total contract revenue recognised in previous accounting periods should be recognised as the revenue for the current period. Similarly, the total contract costs multiply the percentage of completion incurred less the total contract costs recognised in previous accounting periods should be recognised as the expenses for the current period.
(d) Interest income Interest income from financial instruments is calculated by effective interest method and recognised in profit or loss for the current period. Interest income comprises premiums or discounts, or the amortisation based on effective rates of other difference between the initial carrying amount and the due amount of interest-earning assets. The effective interest method is a method of calculating the amortised cost of a financial asset or liability and the interest income or expense based on effective rates. Actual interest rate is the rate at which the estimated future cash flows during the period of expected duration of the financial instruments or applicable shorter period are discounted to the current carrying amount of the financial instruments. When calculating the effective interest rate, the Group estimates cash flows by considering all contractual terms of the financial instrument (e.g. early repayment options, similar options, etc.), but without considering future credit losses. The calculation includes all fees and interest paid or received that are an integral part of the effective interest rate, transaction costs, and all other premiums or discounts. Interest income from impaired financial assets is calculated at the interest rate that is used for discounting estimated future cash flow when measuring the impairment loss.

MIDEA GROUP CO., LTD. NOTES TO THE FINANCIAL STATEMENTS FOR THE SIX MONTHS ENDED 30 JUNE 2017 (All amounts in RMB'000 Yuan unless otherwise stated) [English translation for reference only]
- 92 -
2 Summary of significant accounting policies and accounting estimates (Cont’d) (27) Revenue (Cont'd)
(e) Dividend income
Dividend income is recognised when the right to receive dividend payment is established.
(f) Rental income Rental income from investment prosperities is recognised in the income statement on a straight-line basis over the lease period.
(g) Fee and commission income Fee and commission income is recognised in profit or loss for the current period when the service is provided. The Group defers the initial charge income or commitment fee income arising from the forming or acquisition of financial assets as the adjustment to effective interest rate. If the loans are not lent when the loan commitment period is expired, related charges are recognised as fee and commission income.
(28) Government grants
Government grants are transfers of monetary or non-monetary assets from the government to the Group at nil consideration, including refund of taxes and financial subsidies, etc. A government grant is recognised when the conditions attached to it can be complied with and the government grant can be received. For a government grant in the form of transfer of monetary assets, the grant is measured at the amount received or receivable. For a government grant in the form of transfer of non-monetary assets, it is measured at fair value; if the fair value is not reliably determinable, the grant is measured at nominal amount. Government grants related to assets are grants that are acquired by an enterprise and used for acquisition, construction or forming long-term assets in other ways. Government grants related to income are government grants other than government grants related to assets. Government grants related to assets could be offset the carrying amount of related assets, or recognised as deferred income, and reasonably and systematically amortised to profit or loss over the useful life of the related asset. For government grants related to income, where the grant is a compensation for related expenses or losses to be incurred by the Group in the subsequent periods, the grant is recognised as deferred income, and included in profit or loss or offset the related cost over the periods in which the related costs are recognised; where the grant is a compensation for related expenses or losses already incurred by the Group, the grant is recognised immediately in profit or loss or offset the related cost for the current period. The same kind of government grants are presented with the same method, that is, those related to ordinary activities are recorded into operating profit while other in non-operating income and expenses. Loans to the Group at political preferential rate are recorded at the actual amount received, and the related loan expenses are calculated based on the principal and the political preferential rate. Finance discounts directly received offset related loans expenses.
MIDEA GROUP CO., LTD. NOTES TO THE FINANCIAL STATEMENTS FOR THE SIX MONTHS ENDED 30 JUNE 2017 (All amounts in RMB'000 Yuan unless otherwise stated) [English translation for reference only]
- 93 -
2 Summary of significant accounting policies and accounting estimates (Cont'd) (29) Deferred income tax assets and deferred income tax liabilities
Deferred income tax assets and deferred income tax liabilities are calculated and recognised based on the differences arising between the tax bases of assets and liabilities and their carrying amounts (temporary differences). Deferred income tax asset is recognised for the tax losses that can be carried forward to subsequent years for deduction of the taxable profit in accordance with the tax laws. No deferred t income tax liability is recognised for a temporary difference arising from the initial recognition of goodwill. No deferred income tax asset or deferred income tax liability is recognised for the temporary differences resulting from the initial recognition of assets or liabilities due to a transaction other than a business combination, which affects neither accounting profit nor taxable profit (or tax loss). At the balance sheet date, deferred income tax assets and deferred income tax liabilities are measured at the tax rates that are expected to apply to the period when the asset is realised or the liability is settled. Deferred income tax assets are only recognised for deductible temporary differences, tax losses and tax credits to the extent that it is probable that taxable profit will be available in the future against which the deductible temporary differences, tax losses and tax credits can be utilised. Deferred income tax liabilities are recognised for temporary differences arising from investments in subsidiaries, associates and a joint venture, except where the Group is able to control the timing of reversal of the temporary difference, and it is probable that the temporary difference will not reverse in the foreseeable future. When it is probable that the temporary differences arising from investments in subsidiaries, associates and a joint venture will be reversed in the foreseeable future and that the taxable profit will be available in the future against which the temporary differences can be utilised, the corresponding deferred income tax assets are recognised. Deferred income tax assets and liabilities are offset when:
The deferred income taxes are related to the same tax payer within the Group and the same taxation authority; and,
That tax payer within the Group has a legally enforceable right to offset current tax assets against current tax liabilities.
(30) Leases (a) Operating lease
Rental expenses for assets held under operating leases are recognised as the cost of relevant assets or expenses on a straight-line basis over the lease period. Contingent rentals are recognised as profit and loss for the current period when incurred. Fixed assets leased out under operating leases, other than investment prosperities (Note 2(14)), are depreciated in accordance with the depreciation policy stated in Note 2(15)(b) and provided for impairment loss in accordance with the policy stated in Note 2(20). Rental income from operating leases is recognised as revenue on a straight-line basis over the lease period. Initial direct costs in large amount arising from assets leased out under operating leases are capitalised when incurred and recognised as profit and loss for the current period over the lease period on a same basis with revenue recognition; initial direct costs in small amount are directly recognised as profit and loss for the current period. Contingent rentals are recognised as profit and loss for the current period when incurred.

MIDEA GROUP CO., LTD. NOTES TO THE FINANCIAL STATEMENTS FOR THE SIX MONTHS ENDED 30 JUNE 2017 (All amounts in RMB'000 Yuan unless otherwise stated) [English translation for reference only]
- 94 -
2 Summary of significant accounting policies and accounting estimates (Cont'd)
(30) Leases (Cont'd) (b) Finance lease
The leased asset is recognised at the lower of the fair value of the leased asset and the present value of the minimum lease payments. The difference between the recorded amount of the leased asset and the minimum lease payments is accounted for as unrecognised finance charge and is amortised using the effective interest method over the period of the lease. A long-term payable is recorded at the amount equal to the minimum lease payments less the unrecognised finance charge.
(31) Segment information
The Group identifies operating segments based on the internal organisation structure, management requirements and internal reporting system, and discloses segment information of reportable segments which is determined on the basis of operating segments. An operating segment is a component of the Group that satisfies all of the following conditions: (1) the component is able to earn revenue and incur expenses from its ordinary activities; (2) whose operating results are regularly reviewed by the Group’s management to make decisions about resources to be allocated to the segment and to assess its performance, and (3) for which the information on financial position, operating results and cash flows is available to the Group. If two or more operating segments have similar economic characteristics and satisfy certain conditions, they are aggregated into one single operating segment.
(32) Critical accounting estimates and judgements
The Group continually evaluates the critical accounting estimates and key judgements applied based on historical experience and other factors, including expectations of future events that are believed to be reasonable.
(a) Critical accounting estimates and key assumptions
The critical accounting estimates and key assumptions that have a significant risk of causing a material adjustment to the carrying amounts of assets and liabilities within the next accounting year are outlined below:
(i) The fair value assessment and recognition of goodwill related to the business combination not under common control
For business combination not under common control (Note 5(1)(a)), the Group shall allocate the cost of acquisition to identified assets and liabilities based on their fair values at the date of acquisition. The excess of the consideration transferred over share of fair value of identifiable net assets acquired from the acquiree is recognised as goodwill. The Group needs to make critical judgements in identifying the identifiable assets and liabilities, and evaluation of fair value, including sales growth rate, gross margin and discount rate, etc. The estimation of fair value is based on the information available at the acquisition date and on expectations and assumptions that have been deemed reasonable by management. Such judgements could materially impact the calculation of goodwill and amortisation charges of identified assets in subsequent periods. Determining the estimated useful lives of intangible assets acquired also requires critical judgement.
MIDEA GROUP CO., LTD. NOTES TO THE FINANCIAL STATEMENTS FOR THE SIX MONTHS ENDED 30 JUNE 2017 (All amounts in RMB'000 Yuan unless otherwise stated) [English translation for reference only]
- 95 -
2 Summary of significant accounting policies and accounting estimates (Cont'd) (32) Critical accounting estimates and judgements (Cont'd) (a) Critical accounting estimates and key assumptions (Cont'd) (ii) Provision for impairment of goodwill
The Group tests annually goodwill for impairment. The recoverable amount of asset groups inclusive of goodwill is the present value of the future cash flows expected to be derived from them. These calculations require use of estimates (Note 2(20)).
If management revises the gross margin that is used in the calculation of the future cash flows of asset groups, and the revised gross margin is lower than the one currently used, the Group would need to recognise further impairment against goodwill.
If management revises the pre-tax discount rate applied to the discounted cash flows, and the revised pre-tax discount rate is higher than the one currently applied, the Group would need to recognise further impairment against goodwill.
If the actual gross margin/pre-tax discount rate is higher/lower than management’s estimates, the impairment loss of goodwill previously provided for is not allowed to be reversed by the Group.
(iii) Provisions for sales rebates, installation expenses and maintenance expenses.
The relevant expenditures, including sales rebates to the buyers, product installation expenses and maintenance expenses during the warranty period, are accrued when the Group recognises revenue from sales of products. The provision of sales rebates is to deduct revenue. The provisions for such expenditures involve management's judgements and estimates, the key factors mainly include the buyers' completion of agreed performance indicators, the unit historical and expected installation costs of products, the expected claim rate for maintenance, market conditions and the stock level kept in sale channel. The estimation basis is reviewed on an on-going basis and revised where appropriate. When the actual outcome or expectation in the future is different from the original estimate, such differences will impact the carrying amount of the provisions and the provision amount charged/reversed in the period in which such estimate has been changed.
(iv) Income taxes
The Group is subject to income taxes in numerous jurisdictions. There are many transactions and events for which the ultimate tax determination is uncertain during the ordinary course of business. Significant judgement is required from the Group in determining the provision for income taxes in each of these jurisdictions. Where the final tax outcome of these matters is different from the amounts that were initially recorded, such differences will impact the income tax and deferred income tax provisions in the period in which such determination is made.
(v) Fair value of financial instruments
The fair value of a financial instrument that is not traded in an active market is determined by using a valuation technique. Valuation techniques include discounted cash flow model analysis, etc. The Group makes estimates in terms of future cash flow, credit risk, market volatility and correlation for valuation. These estimates are uncertain and changes in them will impact the fair value of financial instruments.
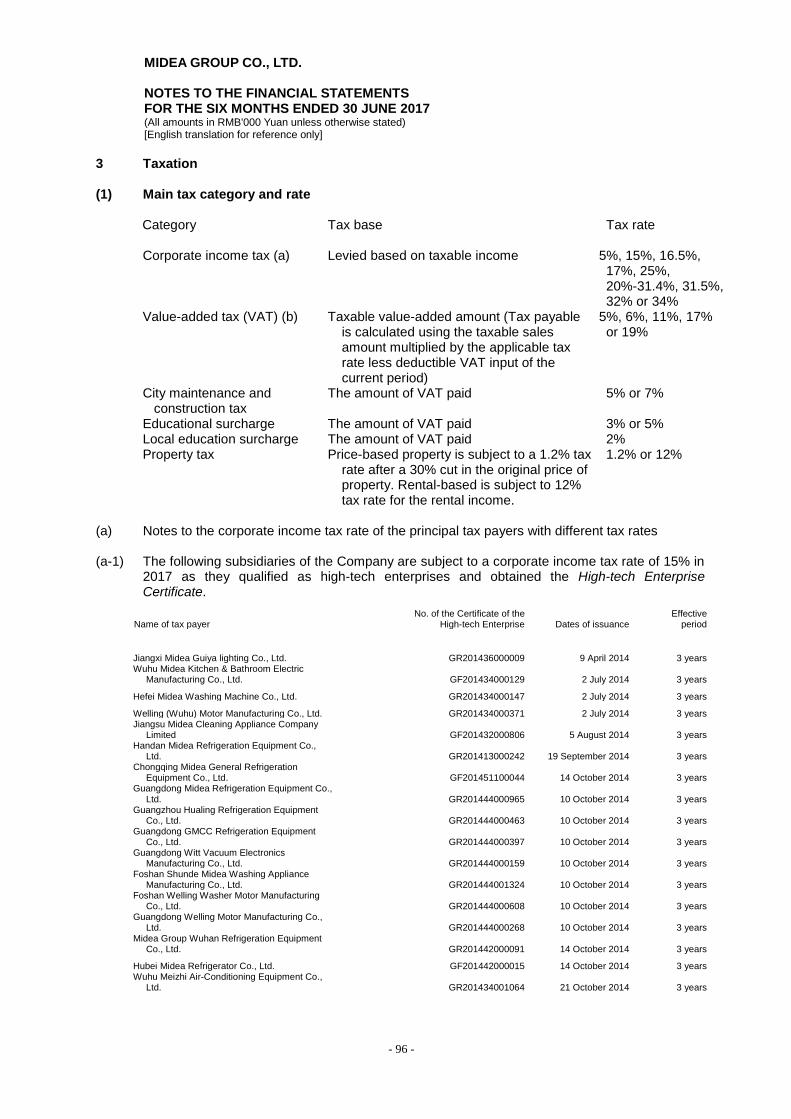
MIDEA GROUP CO., LTD. NOTES TO THE FINANCIAL STATEMENTS FOR THE SIX MONTHS ENDED 30 JUNE 2017 (All amounts in RMB'000 Yuan unless otherwise stated) [English translation for reference only]
- 96 -
3 Taxation (1) Main tax category and rate
Category Tax base Tax rate Corporate income tax (a) Levied based on taxable income 5%, 15%, 16.5%,
17%, 25%, 20%-31.4%, 31.5%, 32% or 34%
Value-added tax (VAT) (b) Taxable value-added amount (Tax payable is calculated using the taxable sales amount multiplied by the applicable tax rate less deductible VAT input of the current period)
5%, 6%, 11%, 17% or 19%
City maintenance and construction tax
The amount of VAT paid 5% or 7%
Educational surcharge The amount of VAT paid 3% or 5% Local education surcharge The amount of VAT paid 2% Property tax Price-based property is subject to a 1.2% tax
rate after a 30% cut in the original price of property. Rental-based is subject to 12% tax rate for the rental income.
1.2% or 12%
(a) Notes to the corporate income tax rate of the principal tax payers with different tax rates (a-1) The following subsidiaries of the Company are subject to a corporate income tax rate of 15% in
2017 as they qualified as high-tech enterprises and obtained the High-tech Enterprise Certificate.
Name of tax payer No. of the Certificate of the
High-tech Enterprise Dates of issuance Effective
period
Jiangxi Midea Guiya lighting Co., Ltd. GR201436000009 9 April 2014 3 years Wuhu Midea Kitchen & Bathroom Electric
Manufacturing Co., Ltd. GF201434000129 2 July 2014 3 years
Hefei Midea Washing Machine Co., Ltd. GR201434000147 2 July 2014 3 years
Welling (Wuhu) Motor Manufacturing Co., Ltd. GR201434000371 2 July 2014 3 years Jiangsu Midea Cleaning Appliance Company
Limited GF201432000806 5 August 2014 3 years Handan Midea Refrigeration Equipment Co.,
Ltd. GR201413000242 19 September 2014 3 years Chongqing Midea General Refrigeration
Equipment Co., Ltd. GF201451100044 14 October 2014 3 years Guangdong Midea Refrigeration Equipment Co.,
Ltd. GR201444000965 10 October 2014 3 years Guangzhou Hualing Refrigeration Equipment
Co., Ltd. GR201444000463 10 October 2014 3 years Guangdong GMCC Refrigeration Equipment
Co., Ltd. GR201444000397 10 October 2014 3 years Guangdong Witt Vacuum Electronics
Manufacturing Co., Ltd. GR201444000159 10 October 2014 3 years Foshan Shunde Midea Washing Appliance
Manufacturing Co., Ltd. GR201444001324 10 October 2014 3 years Foshan Welling Washer Motor Manufacturing
Co., Ltd. GR201444000608 10 October 2014 3 years Guangdong Welling Motor Manufacturing Co.,
Ltd. GR201444000268 10 October 2014 3 years Midea Group Wuhan Refrigeration Equipment
Co., Ltd. GR201442000091 14 October 2014 3 years
Hubei Midea Refrigerator Co., Ltd. GF201442000015 14 October 2014 3 years Wuhu Meizhi Air-Conditioning Equipment Co.,
Ltd. GR201434001064 21 October 2014 3 years
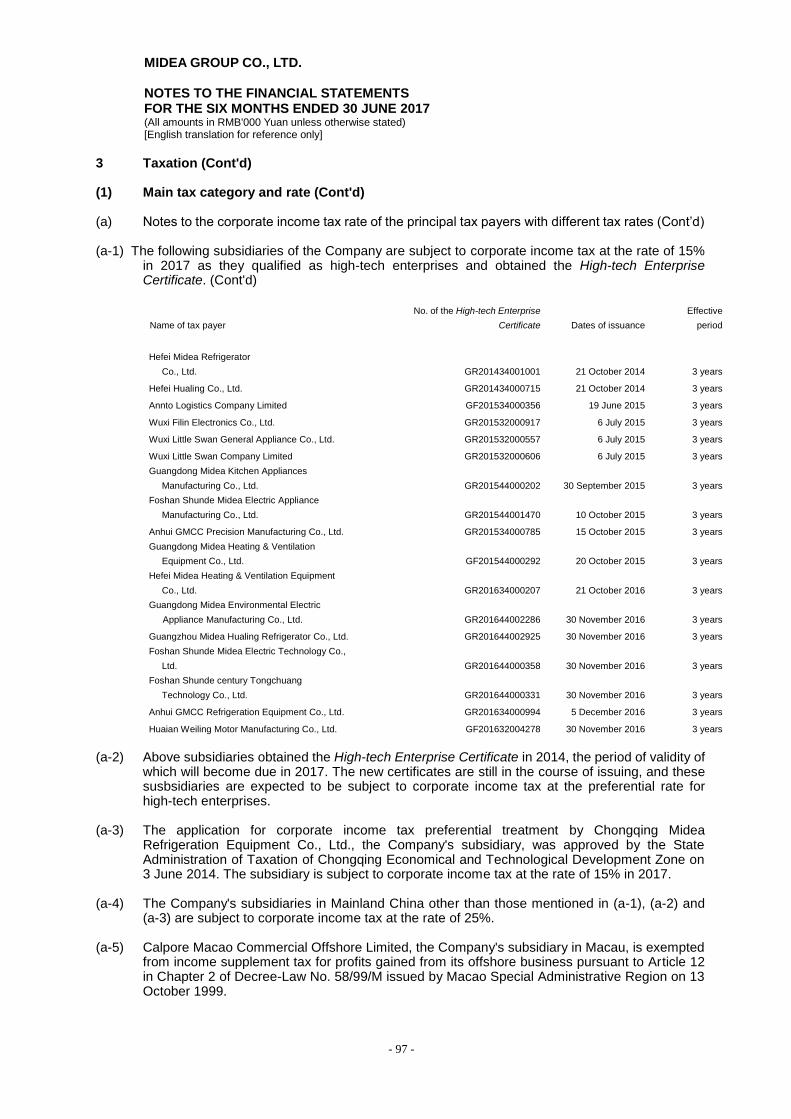
MIDEA GROUP CO., LTD. NOTES TO THE FINANCIAL STATEMENTS FOR THE SIX MONTHS ENDED 30 JUNE 2017 (All amounts in RMB'000 Yuan unless otherwise stated) [English translation for reference only]
- 97 -
3 Taxation (Cont'd) (1) Main tax category and rate (Cont'd) (a) Notes to the corporate income tax rate of the principal tax payers with different tax rates (Cont’d) (a-1) The following subsidiaries of the Company are subject to corporate income tax at the rate of 15%
in 2017 as they qualified as high-tech enterprises and obtained the High-tech Enterprise Certificate. (Cont'd)
Name of tax payer
No. of the High-tech Enterprise
Certificate Dates of issuance
Effective
period
Hefei Midea Refrigerator
Co., Ltd. GR201434001001 21 October 2014 3 years
Hefei Hualing Co., Ltd. GR201434000715 21 October 2014 3 years
Annto Logistics Company Limited GF201534000356 19 June 2015 3 years
Wuxi Filin Electronics Co., Ltd. GR201532000917 6 July 2015 3 years
Wuxi Little Swan General Appliance Co., Ltd. GR201532000557 6 July 2015 3 years
Wuxi Little Swan Company Limited GR201532000606 6 July 2015 3 years
Guangdong Midea Kitchen Appliances
Manufacturing Co., Ltd. GR201544000202 30 September 2015 3 years
Foshan Shunde Midea Electric Appliance
Manufacturing Co., Ltd. GR201544001470 10 October 2015 3 years
Anhui GMCC Precision Manufacturing Co., Ltd. GR201534000785 15 October 2015 3 years
Guangdong Midea Heating & Ventilation
Equipment Co., Ltd. GF201544000292 20 October 2015 3 years
Hefei Midea Heating & Ventilation Equipment
Co., Ltd. GR201634000207 21 October 2016 3 years
Guangdong Midea Environmental Electric
Appliance Manufacturing Co., Ltd. GR201644002286 30 November 2016 3 years
Guangzhou Midea Hualing Refrigerator Co., Ltd. GR201644002925 30 November 2016 3 years
Foshan Shunde Midea Electric Technology Co.,
Ltd. GR201644000358 30 November 2016 3 years
Foshan Shunde century Tongchuang
Technology Co., Ltd.
GR201644000331 30 November 2016 3 years
Anhui GMCC Refrigeration Equipment Co., Ltd. GR201634000994 5 December 2016 3 years
Huaian Weiling Motor Manufacturing Co., Ltd. GF201632004278 30 November 2016 3 years
(a-2) Above subsidiaries obtained the High-tech Enterprise Certificate in 2014, the period of validity of
which will become due in 2017. The new certificates are still in the course of issuing, and these susbsidiaries are expected to be subject to corporate income tax at the preferential rate for high-tech enterprises.
(a-3) The application for corporate income tax preferential treatment by Chongqing Midea
Refrigeration Equipment Co., Ltd., the Company's subsidiary, was approved by the State Administration of Taxation of Chongqing Economical and Technological Development Zone on 3 June 2014. The subsidiary is subject to corporate income tax at the rate of 15% in 2017.
(a-4) The Company's subsidiaries in Mainland China other than those mentioned in (a-1), (a-2) and
(a-3) are subject to corporate income tax at the rate of 25%.
(a-5) Calpore Macao Commercial Offshore Limited, the Company's subsidiary in Macau, is exempted from income supplement tax for profits gained from its offshore business pursuant to Article 12 in Chapter 2 of Decree-Law No. 58/99/M issued by Macao Special Administrative Region on 13 October 1999.

MIDEA GROUP CO., LTD. NOTES TO THE FINANCIAL STATEMENTS FOR THE SIX MONTHS ENDED 30 JUNE 2017 (All amounts in RMB'000 Yuan unless otherwise stated) [English translation for reference only]
- 98 -
3 Taxation (Cont'd) (1) Main tax category and rate (Cont'd) (a) Notes to the corporate income tax rate of the principal tax payers with different tax rates (Cont’d)
(a-6) In August 2008, Midea Electric Appliance (Singapore) Co., Ltd., the Company's subsidiary, was
awarded with the Certificate of Honor for Development and Expansion (NO.587) by the Singapore Economic Development Board, which approves that qualified income exceeding a certain amount is subject to corporate income tax at the rate of 5% while the unqualified income is subject to the corporate income tax at the rate of 17%. Midea Electric Appliance (Singapore) Co., Ltd. and Little Swan International (Singapore) Co., Ltd., the Company's subsidiary, is subject to corporate income tax at the rate of 17%.
(a-7) The Company's subsidiaries in Hong Kong are subject to Hong Kong profits tax at the rate of 16.5%.
Such subsidiaries include Midea International Trade Co., Ltd., Midea International Co., Ltd., Midea Appliance Investment (Hong Kong) Ltd., Gold Emperor Enterprises Ltd., Chairing Holding Ltd., Century Carrier Household Air-conditioning Co., Ltd., Midea Refrigeration (Hong Kong) Ltd., Welling Holding Limited (Hong Kong), Welling International Hong Kong Ltd (HK), and Midea Investment (Asia) Co., Ltd.
(a-8) The Company's subsidiaries in BVI and Cayman Islands are exempted from corporate income tax.
Such subsidiaries include Mecca International (BVI) Limited, Titoni Investments Development Ltd., Midea Holdings (BVI) Ltd., Midea Electric Investment (BVI) Limited, Welling Holding (BVI) Ltd., Midea Holding (Cayman Islands) Ltd. and Midea Investment Development Ltd.
(a-9) Springer Carrier Ltda., the Company's subsidiaries in Brazil, is subject to Brazil corporate income tax
at the rate of 34%.
(a-10) TLSC, the Company's subsidiaries in Japan, is subject to Japan corporate income tax at the rate of 31.5%.
(a-11) Clivet, the Company's subsidiaries in Italy, is subject to Italy corporate income tax at the rate between
20% and 31.4%. (a-12) KUKA, the Company's subsidiaries in Germany, is subject to Germany corporate income tax at the
rate of 32% (a-13) SMC, the Company's subsidiaries in Israel, is subject to Israel corporate income tax at the rate of 25% (b) Notes to the VAT rate of the principal tax payers with different tax rates
(b-1) According to the Notice for the Full Implementation of Transformation from business tax to
value-added tax Pilot (tax[2016]36) and the relevant provisions issued by Ministry of Finance and the State Administration of Taxation, since 1 May 2016, revenue from rental service, real estate management service, financial service, consulting service and logistics service of the Company and its subsidiaries are subject to VAT, while these service are subject to business tax at the rate of 5% before 1 May 2016.
(b-2) Sales of goods and provision of repairs and replacement service from certain subsidiaries of the
Company are subject to VAT at the rate of 17%.
(b-3) Rental service on real estate and distribution service provided by the Company and certain subsidiaries are subject to VAT at the rate of 11%.

MIDEA GROUP CO., LTD. NOTES TO THE FINANCIAL STATEMENTS FOR THE SIX MONTHS ENDED 30 JUNE 2017 (All amounts in RMB'000 Yuan unless otherwise stated) [English translation for reference only]
- 99 -
3 Taxation (Cont'd) (1) Main tax category and rate (Cont'd) (b) Notes to the VAT rate of the principal tax payers with different tax rates (Cont’d) (b-4) Financial service, consulting service and storage service provided by the Company and certain
subsidiaries are subject to VAT at the rate of 6%. . (b-5) Rental revenue of Hefei Midea Refrigerator Co., Ltd., which is a subsidiary of the Company, is
subject to easy levy of VAT at the rate of 5%. 4 Notes to the consolidated financial statements (1) Cash at bank and on hand
Item Ending balance Opening balance
Cash on hand 4,456 2,315
Cash at bank (a) 20,598,595 16,151,724
Other cash balances (b) 696,895 1,042,031
Statutory reserve deposits with the Central Bank (c) 1,205,959 677,011
Surplus reserve with the Central Bank 32,528 58,172
Financial enterprises' deposits with domestic banks 11,680,585 9,237,865
Total 34,219,018 27,169,118
Including: Cash abroad (including Germany, Japan, Hong Kong, Macau, Singapore and Brazil, etc.) 5,899,032 4,234,153
(a) As at 30 June 2017, cash at bank includes fixed deposits with the term of over three months, amounting to RMB11,111,670,000 (31 December 2016: RMB9,136,346,000).
(b) Other cash balances mainly includes security deposits, bank acceptance note and letter of
credit. (c) Statutory reserve with the Central Bank represents the statutory reserve deposited in People’s
Bank of China by the financial enterprise in accordance with relevant regulations, which are calculated at 7% and 5% for eligible RMB deposits and foreign currency deposits, respectively, and are not available for use in the Group’s daily operations.
(d) As at 30 June 2017, deposits with banks and other financial institutions include time deposits
with the term of over three months, amounting to RMB500,000,000 (31 December 2016: RMB3,800,000,000).

MIDEA GROUP CO., LTD. NOTES TO THE FINANCIAL STATEMENTS FOR THE SIX MONTHS ENDED 30 JUNE 2017 (All amounts in RMB'000 Yuan unless otherwise stated) [English translation for reference only]
- 100 -
4 Notes to the consolidated financial statements (Cont’d) (2) Notes receivable
Item Ending balance Opening balance
Bank acceptance notes 10,884,391 7,427,488
(a) As at 30 June 2017, the Group's notes receivable that are not mature but have been endorsed
to other parties, or that have been discounted are as follows:
Item Derecognised Recognised
Bank acceptance notes 30,406,520 -
(3) Receivables (a) Accounts receivable
Item Ending balance Opening balance
Accounts receivable 20,340,317 14,198,320
Less: Provision for bad debts (959,443) (743,809)
Total 19,380,874 13,454,511
The ageing of other receivables is analysed as follows:
Ageing Ending balance Opening balance
Within 1 year 19,637,201 13,603,125
1 to 2 years 472,132 462,845
2 to 3 years 133,475 66,756
3 to 5 years 59,502 45,212
Over 5 years 38,007 20,382
Sub-total 20,340,317 14,198,320
As at 30 June 2017, the Group has no overdue accounts receivable with significant amount.

MIDEA GROUP CO., LTD. NOTES TO THE FINANCIAL STATEMENTS FOR THE SIX MONTHS ENDED 30 JUNE 2017 (All amounts in RMB'000 Yuan unless otherwise stated) [English translation for reference only]
- 101 -
4 Notes to the consolidated financial statements (Cont’d) (3) Receivables (Cont’d) (a) Accounts receivable (Cont’d)
Accounts receivable are analysed by categories as follows:
Categories
Ending balance Opening balance
Book balance Provision for bad debts Book balance Provision for bad debts
Amount % of total
balance Amount Ratio Amount % of total
balance Amount Ratio
With amounts that are individually significant and that the related provision for bad debts is provided on the individual basis 7,469 0.04% 7,469 100.00% 35,363 0.25% 9,108 25.76%
That the related provision for bad debts is provided on the age grouping basis 20,015,577 98.40% 915,041 4.57% 13,931,404 98.12% 729,848 5.24%
With amounts that are not individually significant but that the related provision for bad debts is provided on the individual basis 317,271 1.56% 36,933 11.64% 231,553 1.63% 4,853 2.10%
Total 20,340,317 100.00% 959,443 4.72% 14,198,320 100.00% 743,809 5.24%
Accounts receivable that the related provision for bad debts is provided on grouping basis using the ageing analysis method are analysed as follows:
Ageing
Ending balance Opening balance
Ending balance Provision for bad debts Ending balance Provision for bad debts
Amount Amount Ratio Amount Amount Ratio
Within 1 year 19,380,577 608,786 3.14% 13,353,944 431,907 3.23%
1 to 2 years 419,863 126,198 30.06% 445,165 198,277 44.54%
2 to 3 years 132,335 104,658 79.09% 66,701 40,686 61.00%
3 to 5 years 52,156 44,753 85.81% 45,212 38,596 85.37%
Over 5 years 30,646 30,646 100.00% 20,382 20,382 100.00%
Total 20,015,577 915,041 4.57% 13,931,404 729,848 5.24%
The provision for bad debts reversed for the six months ended 30 June 2017 is RMB45,337,000.
The accounts receivable as written off by the Group for the six months ended 30 June 2017 are
arising from transactions with third parties and there's no written-off accounts receivable with amounts that are individually significant.
As at 30 June 2017, the top 5 accounts receivable assembled by debtors are analysed as follows:
Item Amount Provision for bad debts % of total balance
Total balance of top 5 accounts receivable 2,275,146 113,757 11.19%
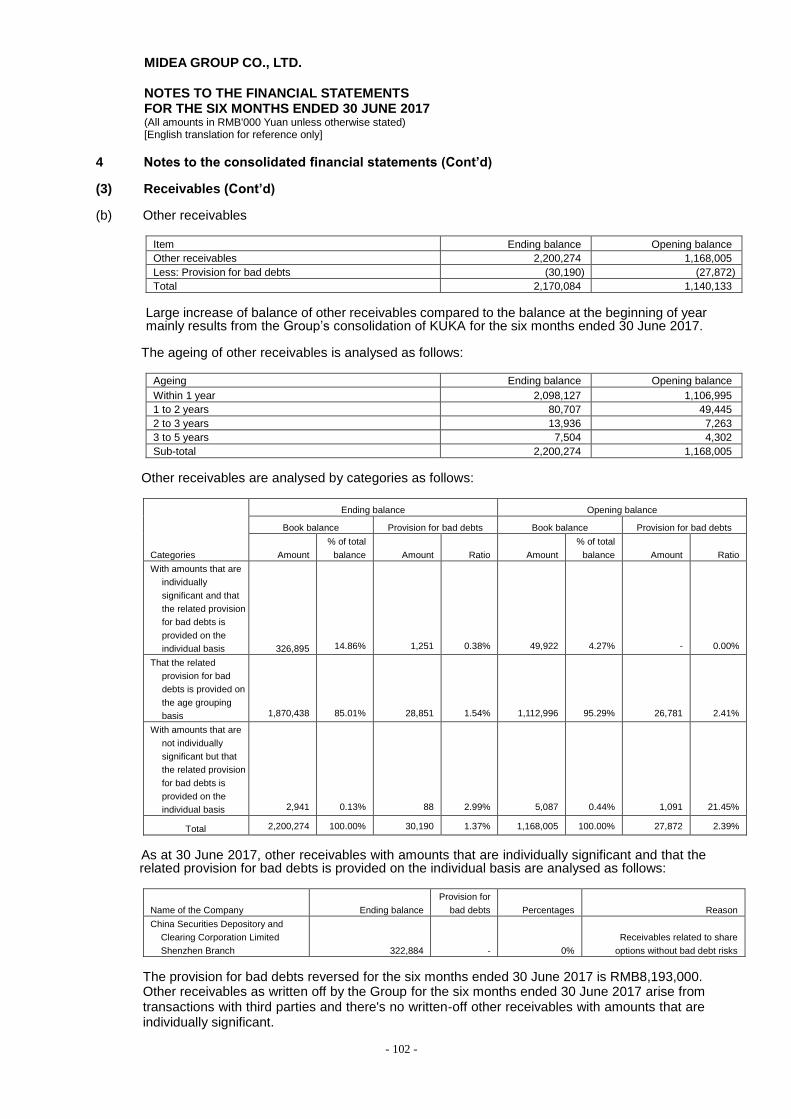
MIDEA GROUP CO., LTD. NOTES TO THE FINANCIAL STATEMENTS FOR THE SIX MONTHS ENDED 30 JUNE 2017 (All amounts in RMB'000 Yuan unless otherwise stated) [English translation for reference only]
- 102 -
4 Notes to the consolidated financial statements (Cont’d) (3) Receivables (Cont’d) (b) Other receivables
Item Ending balance Opening balance
Other receivables 2,200,274 1,168,005
Less: Provision for bad debts (30,190) (27,872)
Total 2,170,084 1,140,133
Large increase of balance of other receivables compared to the balance at the beginning of year mainly results from the Group’s consolidation of KUKA for the six months ended 30 June 2017.
The ageing of other receivables is analysed as follows:
Ageing Ending balance Opening balance
Within 1 year 2,098,127 1,106,995
1 to 2 years 80,707 49,445
2 to 3 years 13,936 7,263
3 to 5 years 7,504 4,302
Sub-total 2,200,274 1,168,005
Other receivables are analysed by categories as follows:
Categories
Ending balance Opening balance
Book balance Provision for bad debts Book balance Provision for bad debts
Amount
% of total
balance Amount Ratio Amount
% of total
balance Amount Ratio
With amounts that are
individually
significant and that
the related provision
for bad debts is
provided on the
individual basis 326,895 14.86% 1,251 0.38% 49,922 4.27% - 0.00%
That the related
provision for bad
debts is provided on
the age grouping
basis 1,870,438 85.01% 28,851 1.54% 1,112,996 95.29% 26,781 2.41%
With amounts that are
not individually
significant but that
the related provision
for bad debts is
provided on the
individual basis 2,941 0.13% 88 2.99% 5,087 0.44% 1,091 21.45%
Total 2,200,274 100.00% 30,190 1.37% 1,168,005 100.00% 27,872 2.39%
As at 30 June 2017, other receivables with amounts that are individually significant and that the related provision for bad debts is provided on the individual basis are analysed as follows:
Name of the Company Ending balance
Provision for
bad debts Percentages Reason
China Securities Depository and
Clearing Corporation Limited
Shenzhen Branch 322,884 - 0%
Receivables related to share
options without bad debt risks
The provision for bad debts reversed for the six months ended 30 June 2017 is RMB8,193,000. Other receivables as written off by the Group for the six months ended 30 June 2017 arise from
transactions with third parties and there's no written-off other receivables with amounts that are individually significant.
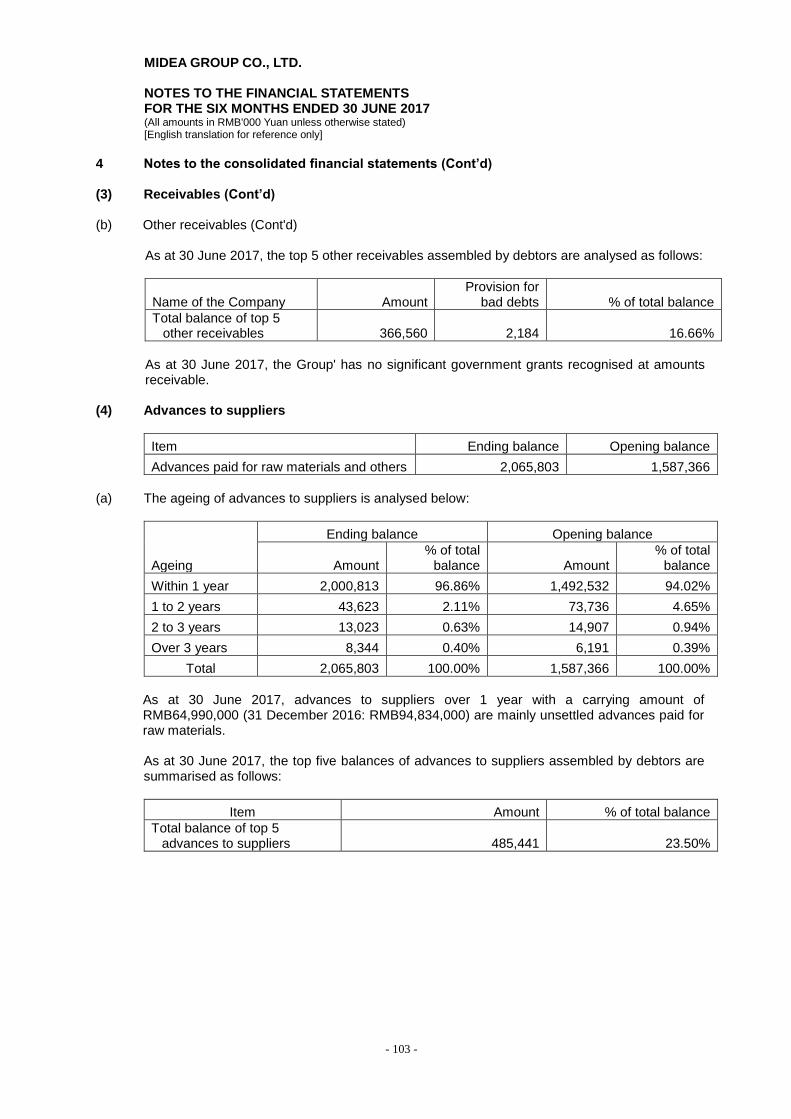
MIDEA GROUP CO., LTD. NOTES TO THE FINANCIAL STATEMENTS FOR THE SIX MONTHS ENDED 30 JUNE 2017 (All amounts in RMB'000 Yuan unless otherwise stated) [English translation for reference only]
- 103 -
4 Notes to the consolidated financial statements (Cont’d) (3) Receivables (Cont’d) (b) Other receivables (Cont'd)
As at 30 June 2017, the top 5 other receivables assembled by debtors are analysed as follows:
Name of the Company Amount Provision for
bad debts % of total balance
Total balance of top 5 other receivables 366,560 2,184 16.66%
As at 30 June 2017, the Group' has no significant government grants recognised at amounts receivable.
(4) Advances to suppliers
Item Ending balance Opening balance
Advances paid for raw materials and others 2,065,803 1,587,366
(a) The ageing of advances to suppliers is analysed below:
Ageing
Ending balance Opening balance
Amount % of total
balance Amount % of total
balance
Within 1 year 2,000,813 96.86% 1,492,532 94.02%
1 to 2 years 43,623 2.11% 73,736 4.65%
2 to 3 years 13,023 0.63% 14,907 0.94%
Over 3 years 8,344 0.40% 6,191 0.39%
Total 2,065,803 100.00% 1,587,366 100.00%
As at 30 June 2017, advances to suppliers over 1 year with a carrying amount of RMB64,990,000 (31 December 2016: RMB94,834,000) are mainly unsettled advances paid for raw materials. As at 30 June 2017, the top five balances of advances to suppliers assembled by debtors are summarised as follows:
Item Amount % of total balance
Total balance of top 5 advances to suppliers 485,441 23.50%
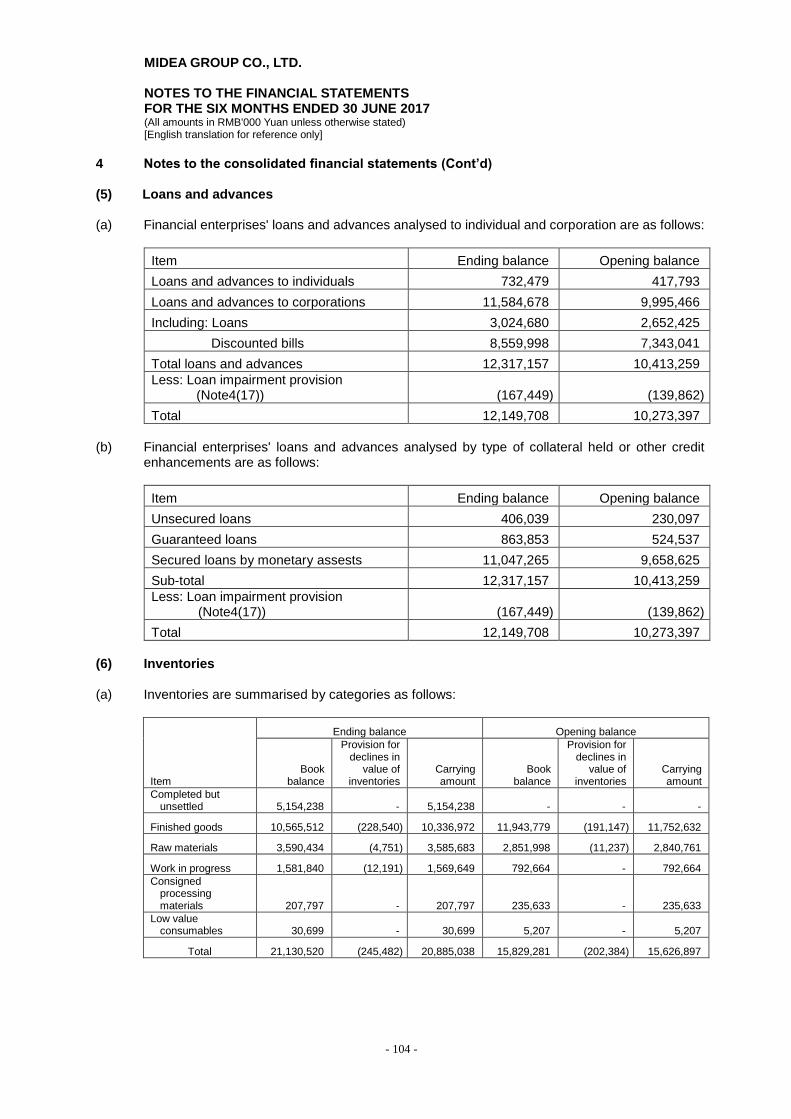
MIDEA GROUP CO., LTD. NOTES TO THE FINANCIAL STATEMENTS FOR THE SIX MONTHS ENDED 30 JUNE 2017 (All amounts in RMB'000 Yuan unless otherwise stated) [English translation for reference only]
- 104 -
4 Notes to the consolidated financial statements (Cont’d)
(5) Loans and advances (a) Financial enterprises' loans and advances analysed to individual and corporation are as follows:
Item Ending balance Opening balance
Loans and advances to individuals 732,479 417,793
Loans and advances to corporations 11,584,678 9,995,466
Including: Loans 3,024,680 2,652,425
Discounted bills 8,559,998 7,343,041
Total loans and advances 12,317,157 10,413,259
Less: Loan impairment provision (Note4(17)) (167,449) (139,862)
Total 12,149,708 10,273,397
(b) Financial enterprises' loans and advances analysed by type of collateral held or other credit
enhancements are as follows:
Item Ending balance Opening balance
Unsecured loans 406,039 230,097
Guaranteed loans 863,853 524,537
Secured loans by monetary assests 11,047,265 9,658,625
Sub-total 12,317,157 10,413,259
Less: Loan impairment provision (Note4(17)) (167,449) (139,862)
Total 12,149,708 10,273,397
(6) Inventories (a) Inventories are summarised by categories as follows:
Item
Ending balance Opening balance
Book balance
Provision for declines in
value of inventories
Carrying amount
Book balance
Provision for declines in
value of inventories
Carrying amount
Completed but unsettled 5,154,238 - 5,154,238 - - -
Finished goods 10,565,512 (228,540) 10,336,972 11,943,779 (191,147) 11,752,632
Raw materials 3,590,434 (4,751) 3,585,683 2,851,998 (11,237) 2,840,761
Work in progress 1,581,840 (12,191) 1,569,649 792,664 - 792,664
Consigned processing materials 207,797 - 207,797 235,633 - 235,633
Low value consumables 30,699 - 30,699 5,207 - 5,207
Total 21,130,520 (245,482) 20,885,038 15,829,281 (202,384) 15,626,897

MIDEA GROUP CO., LTD. NOTES TO THE FINANCIAL STATEMENTS FOR THE SIX MONTHS ENDED 30 JUNE 2017 (All amounts in RMB'000 Yuan unless otherwise stated) [English translation for reference only]
- 105 -
4 Notes to the consolidated financial statements (Cont’d)
(6) Inventories (Cont'd) (b) Provision for decline in the value of inventories is analysed as follows:
Item Opening balance
Increase in current period
Decrease of reversal or write-off in
current period
Differences on translation of
foreign currency financial
statements Ending balance
Finished goods 191,147 171,245 (131,969) (1,883) 228,540
Raw materials 11,237 28,322 (35,400) 592 4,751
Work in progress - 25,703 (14,262) 750 12,191
Total 202,384 225,270 (181,631) (541) 245,482
(c) Provision for decline in the value of inventories is as follows:
Item Basis for provision for decline in the value of
inventories
Reason for the write-off of provision for decline in the value of inventories in
current period
Finished goods Stated at the lower of cost and net realisable value Sales
Raw materials Stated at the lower of cost and net realisable value Requisition for production
Work in progress Stated at the lower of cost and net realisable value Requisition for production
(d) Construction contract
Item Ending balance
Cost occurred and gross profit recognised 23,983,000
Less: Accumulated billed amount (20,783,994)
Total 3,199,006
Item Ending balance
Completed but unsettled products 5,154,238
Less: Provision for decline in the value of completed but unsettled -
Net book value of completed but unsettled products 5,154,238
Settled but not completed (Note 4(20)) (1,955,231)
Total 3,199,006

MIDEA GROUP CO., LTD. NOTES TO THE FINANCIAL STATEMENTS FOR THE SIX MONTHS ENDED 30 JUNE 2017 (All amounts in RMB'000 Yuan unless otherwise stated) [English translation for reference only]
- 106 -
4 Notes to the consolidated financial statements (Cont’d) (7) Other current assets
Item Ending balance Opening balance
Prepaid expenses 721,838 467,916
Deductible input VAT 1,889,499 1,876,967
Structural deposits with banks. 15,303,105 14,442,697
Wealth management products purchased from financial institutions (a) 30,514,012 26,267,067
Others 1,613,435 474,950
Total 50,041,889 43,529,597
(a) As at 30 June 2017, wealth management products due within one year are presented as other
current assets, mainly including wealth management products with floating earnings of RMB30,514,012,000 (31 December 2016: wealth management products with floating earnings of RMB26,267,067,000) (Note 15(1)).
(b) Wealth management products purchased by the Company due more than one year amounting to
RMB500,000,000 are presented as other non-current assets (31 December 2016: RMB3,842,000,000) (Note 15(1)).
(8) Available-for-sale financial assets
Item Ending balance Opening balance
Measured at fair value
- Available-for-sale equity instruments (a) 67,815 3,518,693
Measured at cost
- Available-for-sale equity instruments (b) 1,804,578 1,669,039
Total 1,872,393 5,187,732
(a) Since the equity acquisition of KUKA was completed during the first half year of 2017, the
available-for-sale financial assets at fair value previously recognised were transferred to long-term equity investments and eliminated at the consolidation level, which led the balance at the beginning of year decreasing sharply.
(b) The available-for-sale financial assets measured at cost mainly include the unlisted equity
investments held by the Group, which do not have a quoted market price in an active market and whose fair value cannot be reliably measured as the range of fair value reasonable estimates is large and probabilities for determining these estimates cannot be reasonably determined. The Group has no plan to dispose these investments.
(9) Long-term equity investments
Long-term equity investments are classified as follows:
Item Ending balance Opening balance
Investment in associates 2,586,329 2,211,732
Carrying amount of investment in joint ventures - -
Less: Provision for impairment of long-term equity investments - -
Total 2,586,329 2,211,732
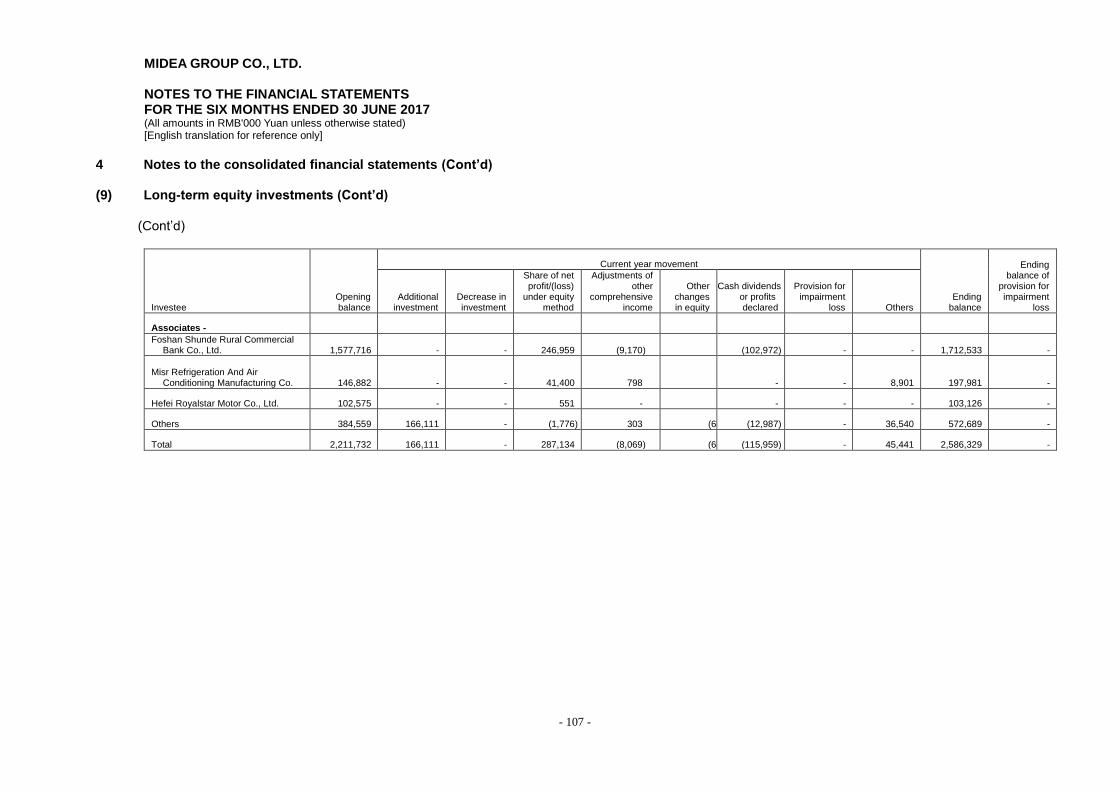
MIDEA GROUP CO., LTD. NOTES TO THE FINANCIAL STATEMENTS FOR THE SIX MONTHS ENDED 30 JUNE 2017 (All amounts in RMB'000 Yuan unless otherwise stated) [English translation for reference only]
- 107 -
4 Notes to the consolidated financial statements (Cont’d) (9) Long-term equity investments (Cont’d)
(Cont’d)
Investee Opening balance
Current year movement
Ending balance
Ending balance of
provision for impairment
loss Additional
investment Decrease in investment
Share of net profit/(loss)
under equity method
Adjustments of other
comprehensive income
Other changes in equity
Cash dividends or profits declared
Provision for impairment
loss Others
Associates -
Foshan Shunde Rural Commercial Bank Co., Ltd. 1,577,716 - - 246,959 (9,170) - (102,972) - - 1,712,533 -
Misr Refrigeration And Air Conditioning Manufacturing Co. 146,882 - - 41,400 798 - - - 8,901 197,981 -
Hefei Royalstar Motor Co., Ltd. 102,575 - - 551 - - - - - 103,126 -
Others 384,559 166,111 - (1,776) 303 (61) (12,987) - 36,540 572,689 -
Total 2,211,732 166,111 - 287,134 (8,069) (61) (115,959) - 45,441 2,586,329 -

MIDEA GROUP CO., LTD.
NOTES TO THE FINANCIAL STATEMENTS
FOR THE SIX MONTHS ENDED 30 JUNE 2017 (All amounts in RMB'000 Yuan unless otherwise stated)
[English translation for reference only]
- 108 -
4 Notes to the consolidated financial statements (Cont’d) (10) Fixed assets
Item Buildings Land Machinery and
equipment Motor vehicles
Electronic equipment and others Total
Carrying amount
Opening balance 15,215,937 840,333 16,670,395 807,794 2,676,768 36,211,227
Increase in current period 1,084,218 255,604 787,630 535,432 694,044 3,356,928
1) Purchase 120,521 - 746,458 89,453 229,233 1,185,665
2) Transfers from construction in progress 21,611 - 41,172 7,080 11,300 81,163
3) Increase in business combinations 942,086 255,604 - 438,899 453,511 2,090,100
4) Transfer from investment prosperities - - - - - -
5) Others - - - - - -
Decrease in current period (49,315) (8,692) (369,584) (54,136) (121,316) (603,043)
1) Disposal or retirement (49,315) (8,692) (369,584) (54,136) (121,316) (603,043)
2) Transfer to investment prosperities - - - - - -
3) Others - - - - - -
Differences on translation of foreign currency financial statements 51,761 22,877 6,695 23,044 30,458 134,835
Ending balance 16,302,601 1,110,122 17,095,136 1,312,134 3,279,954 39,099,947
Accumulated depreciation
Opening balance 4,854,232 - 7,894,549 364,405 2,022,483 15,135,669
Increase in current period 402,512 - 862,813 126,915 277,051 1,669,291
1) Depreciation charged 402,512 - 862,813 126,915 277,051 1,669,291
2) Transfer from investment prosperities and others - - - - - -
Decrease in current period (19,847) - (196,483) (36,808) (79,352) (332,490)
1) Disposal and retirement (19,847) - (196,483) (36,808) (79,352) (332,490)
2) Others - - - - - -
Differences on translation of foreign currency financial statements (1,935) - (69) 2,498 4,025 4,519
Ending balance 5,234,962 - 8,560,810 457,010 2,224,207 16,476,989
Provision for impairment loss
Opening balance 3,918 - 14,706 36 107 18,767
Increase in current period - - 5,242 257 280 5,779
1) Depreciation charged - - 5,242 257 280 5,779
Decrease in current period - - (4,738) (13) (36) (4,787)
1) Disposal and retirement - - (4,738) (13) (36) (4,787)
Differences on translation of foreign currency financial statements - - 33 8 7 48
Ending balance 3,918 - 15,243 288 358 19,807
Carrying amount at the end of period 11,063,721 1,110,122 8,519,083 854,836 1,055,389 22,603,151
Carrying amount at the beginning of period 10,357,787 840,333 8,761,140 443,353 654,178 21,056,791
(a) For the six months ended 30 June 2017, the depreciation of fixed assets amounted to
RMB1,669,291,000 (for the six months ended 30 June 2016: RMB1,248,904,000) and is included in income statement.
(b) As at 30 June 2017, the Company is still in the course of obtaining the ownership certificate for the
fixed asset with a carrying amount of RMB653,756,000.

MIDEA GROUP CO., LTD.
NOTES TO THE FINANCIAL STATEMENTS
FOR THE SIX MONTHS ENDED 30 JUNE 2017
(All amounts in RMB'000 Yuan unless otherwise stated)
[English translation for reference only]
- 109 -
4 Notes to the consolidated financial statements (Cont’d) (11) Construction in progress (a) Movement of significant projects of construction in progress
Project name Opening balance
Increase in current period
Transfer to fixed assets
Other decreases
Ending balance
Accumulative amount of
capitalised borrowing costs
Including: Borrowings costs
capitalised in current year
Capitalisation rate of borrowing costs in current
year Source of
funds
Meizhi Compressor Project 4,060 191 (4,060) - 191 - - -
Internal resource
Compressor (Anhui) Project 1,949 136 (743) - 1,342 - - -
Internal resource
Guangdong Welling construction in progress 28,129 9,648 (29,096) - 8,681 - - -
Internal resource
Innovation project 434,173 49,051 - - 483,224 - - - Internal
resource
Other projects 112,418 333,321 (47,264) (10,974) 387,501 - - - Internal
resource
Total 580,729 392,347 (81,163) (10,974) 880,939 - -
As at 30 June 2017, there's no provision for impairment of construction in progress with the ending balance consistent with the carrying amount; and the cost of construction in progress matches the budget amount. The projects are carried out on schedule.
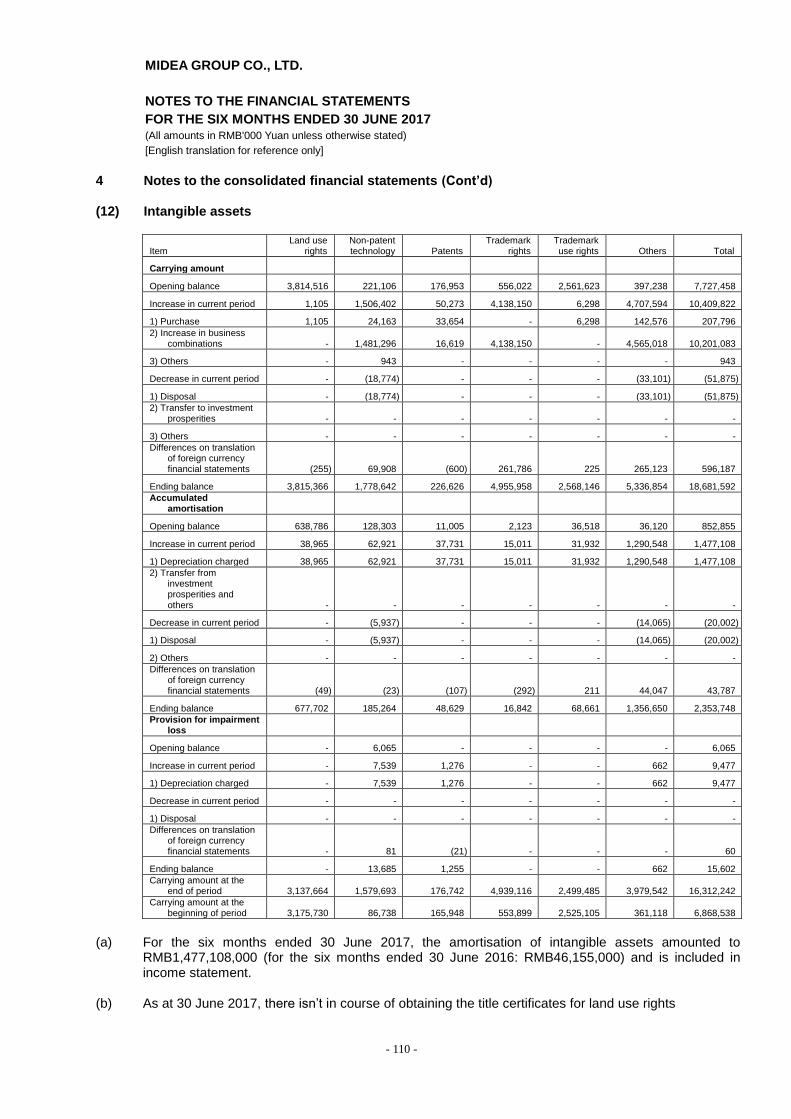
MIDEA GROUP CO., LTD.
NOTES TO THE FINANCIAL STATEMENTS
FOR THE SIX MONTHS ENDED 30 JUNE 2017 (All amounts in RMB'000 Yuan unless otherwise stated)
[English translation for reference only]
- 110 -
4 Notes to the consolidated financial statements (Cont’d) (12) Intangible assets
Item Land use
rights Non-patent technology Patents
Trademark rights
Trademark use rights Others Total
Carrying amount
Opening balance 3,814,516 221,106 176,953 556,022 2,561,623 397,238 7,727,458
Increase in current period 1,105 1,506,402 50,273 4,138,150 6,298 4,707,594 10,409,822
1) Purchase 1,105 24,163 33,654 - 6,298 142,576 207,796
2) Increase in business combinations - 1,481,296 16,619 4,138,150 - 4,565,018 10,201,083
3) Others - 943 - - - - 943
Decrease in current period - (18,774) - - - (33,101) (51,875)
1) Disposal - (18,774) - - - (33,101) (51,875)
2) Transfer to investment prosperities - - - - - - -
3) Others - - - - - - -
Differences on translation of foreign currency financial statements (255) 69,908 (600) 261,786 225 265,123 596,187
Ending balance 3,815,366 1,778,642 226,626 4,955,958 2,568,146 5,336,854 18,681,592
Accumulated amortisation
Opening balance 638,786 128,303 11,005 2,123 36,518 36,120 852,855
Increase in current period 38,965 62,921 37,731 15,011 31,932 1,290,548 1,477,108
1) Depreciation charged 38,965 62,921 37,731 15,011 31,932 1,290,548 1,477,108
2) Transfer from investment prosperities and others - - - - - - -
Decrease in current period - (5,937) - - - (14,065) (20,002)
1) Disposal - (5,937) - - - (14,065) (20,002)
2) Others - - - - - - -
Differences on translation of foreign currency financial statements (49) (23) (107) (292) 211 44,047 43,787
Ending balance 677,702 185,264 48,629 16,842 68,661 1,356,650 2,353,748
Provision for impairment loss
Opening balance - 6,065 - - - - 6,065
Increase in current period - 7,539 1,276 - - 662 9,477
1) Depreciation charged - 7,539 1,276 - - 662 9,477
Decrease in current period - - - - - - -
1) Disposal - - - - - - -
Differences on translation of foreign currency financial statements - 81 (21) - - - 60
Ending balance - 13,685 1,255 - - 662 15,602
Carrying amount at the end of period 3,137,664 1,579,693 176,742 4,939,116 2,499,485 3,979,542 16,312,242
Carrying amount at the beginning of period 3,175,730 86,738 165,948 553,899 2,525,105 361,118 6,868,538
(a) For the six months ended 30 June 2017, the amortisation of intangible assets amounted to
RMB1,477,108,000 (for the six months ended 30 June 2016: RMB46,155,000) and is included in income statement.
(b) As at 30 June 2017, there isn’t in course of obtaining the title certificates for land use rights

MIDEA GROUP CO., LTD.
NOTES TO THE FINANCIAL STATEMENTS
FOR THE SIX MONTHS ENDED 30 JUNE 2017 (All amounts in RMB'000 Yuan unless otherwise stated)
[English translation for reference only]
- 111 -
4 Notes to the consolidated financial statements (Cont’d) (13) Goodwill
Investee Opening balance Increase
Differences on translation of
foreign currency financial
statements Others Ending balance
Wuxi Little Swan Company Limited 1,361,306 - - - 1,361,306
Clivet 498,724 - 30,223 - 528,947
Carrier S.A. Co., Ltd. 614,728 - (24,335) - 590,393
TLSC 2,697,290 - 77,762 - 2,775,052
KUKA - 20,698,212 1,354,393 - 22,052,605
SMC - 544,555 (8,261) - 536,294
Others 558,947 13,787 833 - 573,567
Total 5,730,995 21,256,554 1,430,615 - 28,418,164
(a) Increase of goodwill for the six months ended 30 June 2017 mainly arises from purchase of
shareholdings of KUKA.
(14) Deferred income tax assets and deferred income tax liabilities (a) Deferred income tax assets
Item
Ending balance Opening balance
Deductible temporary
differences and deductible losses
Deferred income tax assets
Deductible temporary
differences and deductible losses Deferred tax assets
Deductible losses 1,346,935 416,611 763,015 223,187
Provision for asset impairments 1,253,190 274,459 1,099,118 224,302
Employee benefits payable 344,072 97,999 344,391 69,092
Other current liabilities 13,956,213 2,601,337 12,548,142 2,210,590
Others 1,089,563 211,833 1,423,137 303,212
Total 17,989,973 3,602,239 16,177,803 3,030,383
(b) Deferred income tax liabilities
Deferred income tax liabilities
Ending balance Opening balance
Taxable temporary differences
Deferred income tax liabilities
Taxable temporary differences
Deferred income tax liabilities
Changes in fair value 262,558 26,500 7,587 1,071
Business combinations involving enterprises not under common control 14,410,911 4,318,727 5,514,103 1,708,006
Others 634,035 174,645 423,030 122,896
Total 15,307,504 4,519,872 5,944,720 1,831,973

MIDEA GROUP CO., LTD.
NOTES TO THE FINANCIAL STATEMENTS
FOR THE SIX MONTHS ENDED 30 JUNE 2017 (All amounts in RMB'000 Yuan unless otherwise stated)
[English translation for reference only]
- 112 -
4 Notes to the consolidated financial statements (Cont’d)
(15) Details of provision for asset impairments
Item Opening balance
Increase in current period
Decrease in current period Differences on translation
of foreign currency financial
statements Ending balance Reversal Write-off
Provision for bad debts 911,543 366,221 (90,163) (7,937) (22,582) 1,157,082
Including: Provision for bad debts of accounts receivable 743,809 291,386 (45,337) (7,887) (22,528) 959,443
Provision for loans and advances 139,862 64,220 (36,633) - - 167,449
Provision for bad debts of other receivables 27,872 10,615 (8,193) (50) (54) 30,190
Provision for decline in the value of inventories 202,384 225,270 (110,487) (71,144) (541) 245,482
Provision for impairment of available-for-sale financial assets 100 - - - - 100
Provision for impairment of fixed assets 18,767 5,779 - (4,787) 48 19,807
Provision for impairment of intangible assets 6,065 9,477 - - 60 15,602
Provision for impairment of investment properties 12,576 - - - 67 12,643
Total 1,151,435 606,747 (200,650) (83,868) (22,948) 1,450,716
(16) Assets with ownership or use right restricted
As at 30 June 2017, details of assets with restricted ownership are as follows:
Item Ending balance Opening balance
Cash at bank and on hand 11,726,628 10,178,377
Deposits with the central bank 1,205,959 677,011
Deposits with other banks 500,000 3,800,000
Total 13,432,587 14,655,388
(17) Short-term borrowings
Item Ending balance Opening balance
Unsecured 31,393,574 2,498,727
Guaranteed borrowings 998,376 525,699
Total 32,391,950 3,024,426
(a) As at 30 June 2017, the annual interest rate range of short-term borrowings is 1.30% to 9.38%
(31 December 2016: 1.77% to 9.38%). (b) There is a large increase in the balance of short-term borrowings compared to that at the
beginning of year, mainly resulting from the new borrowings due to acquisition of KUKA, which were replaced with long-term borrowings in August 2017.

MIDEA GROUP CO., LTD.
NOTES TO THE FINANCIAL STATEMENTS
FOR THE SIX MONTHS ENDED 30 JUNE 2017 (All amounts in RMB'000 Yuan unless otherwise stated)
[English translation for reference only]
- 113 -
4 Notes to the consolidated financial statements (Cont’d)
(18) Notes payable
Item Ending balance Opening balance
Bank acceptance notes 22,034,312 18,484,939
(19) Accounts payable
Item Ending balance Opening balance
Materials cost payable 29,609,383 21,453,740
Others 2,689,429 3,903,220
Total 32,298,812 25,356,960
(a) As at 30 June 2017, accounts payable with ageing over 1 year with a carrying amount of
RMB754,637,000 (31 December 2016: RMB849,693,000) are mainly unsettled accounts payable for materials.
(20) Advances from customers
Item Ending balance Opening balance
Advances on sales 12,215,362 10,252,375
Settled but not completed 1,955,231 -
Total 14,170,593 10,252,375
(a) As at 30 June 2017, accounts payable with ageing over 1 year with a carrying amount of
RMB141,359,000 (31 December 2016: RMB165,010,000) are mainly unsettled advances on sales.
(21) Employee benefits payable
Item Ending balance Opening balance
Short-term employee benefits payable (a) 3,566,042 3,064,520
Others 223,547 89,867
Total 3,789,589 3,154,387

MIDEA GROUP CO., LTD.
NOTES TO THE FINANCIAL STATEMENTS
FOR THE SIX MONTHS ENDED 30 JUNE 2017 (All amounts in RMB'000 Yuan unless otherwise stated)
[English translation for reference only]
- 114 -
4 Notes to the consolidated financial statements (Cont’d)
(21) Employee benefits payable (Cont’d)
(a) Short-term employee benefits
Item Opening balance
Increase in current period
Decrease in current period
Ending balance
Wages and salaries, bonus, allowances and subsidies 2,720,179 9,946,093 (9,526,559) 3,139,713
Staff welfare 258,258 312,643 (304,936) 265,965
Social security contributions 17,741 1,146,351 (1,061,380) 102,712
Including: Medical insurance 15,866 1,032,650 (946,934) 101,582
Work injury insurance 1,637 87,521 (88,662) 496
Maternity insurance 238 26,180 (25,784) 634
Housing funds 21,317 130,225 (136,836) 14,706
Labour union funds and employee education funds 20,030 42,402 (41,738) 20,694
Other employee expenses 26,995 255,750 (260,493) 22,252
Sub-total 3,064,520 11,833,464 (11,331,942) 3,566,042
(22) Taxes payable
Item Ending balance Opening balance
VAT payable 813,264 348,991
Corporate income tax payable 2,315,862 1,656,482
Others 485,638 358,973
Total 3,614,764 2,364,446
(23) Other payables
(a) Other payables are mainly deposit and security deposit payable, reimbursed logistics expense,
manufacturing equipment expense and refund for energy-saving and beneficial to people. (b) As at 30 June 2017, accounts payable with ageing over 1 year with a carrying amount of
RMB413,943,000 (31 December 2016: RMB484,749,000) are mainly deposit and security deposit payable, which are unsettled for related projects that are uncompleted.
(24) Other current liabilities
Item Ending balance Opening balance
Accrued sales rebate 16,239,045 16,201,044
Accrued installation and maintenance expenses 5,252,736 4,164,399
Accrued sales promotion expenses 1,569,320 985,665
Accrued transportation expenses 614,810 576,821
Others 2,928,610 2,635,041
Total 26,604,521 24,562,970

MIDEA GROUP CO., LTD.
NOTES TO THE FINANCIAL STATEMENTS
FOR THE SIX MONTHS ENDED 30 JUNE 2017 (All amounts in RMB'000 Yuan unless otherwise stated)
[English translation for reference only]
- 115 -
4 Notes to the consolidated financial statements (Cont’d)
(25) Long-term borrowings
Item Ending balance Opening balance
Unsecured borrowings 1,936,572 2,645
Guaranteed borrowings 2,100,142 2,251,703
Total 4,036,714 2,254,348
(b) As at 30 June 2017, the annual interest rate range of the long-term borrowings is 0.4% to 5.5%
(31 December 2016: 0.4% to 5.5%). (26) Debentures payable
Name of the debentures
Opening balance
Issuing expenses
Interest accrued on
par value
Amortisation of discount
and premium
Exchange gains or loss
and differences
on translation of
foreign currency financial
statements
Repaid in current period
Ending balance
USD Guaranteed Medium Term Note 4,818,769 - 56,312 7,308 (112,933) - 4,713,144
Total 4,818,769 - 56,312 7,308 (112,933) - 4,713,144
Related information is as follows:
Name of the debentures Par value Issuance date Maturity
Issuance amount
USD Guaranteed Medium Term Note 4,605,510 03 June 2016 3 years 4,605,510
(a) Midea Investment Development Co., Ltd, the subsidiary of the Company, issued corporate
debenture with total amount of USD700,000,000 and duration of 3 years on 3 June 2016. Interest of the debenture is paid on a semi-annual basis and calculated by the simple interest method, and the interest rate is 2.375% annually. The debenture is guaranteed by the Company.
(27) Long-term employee benefits payable
Item Ending balance Opening balance
Supplementary retirement benefits (a) 2,356,445 1,418,921
Others 28,625 31,033
Total 2,385,070 1,449,954
(a) Supplementary retirement benefits arise from KUKA and TLSC (subsidiaries).

MIDEA GROUP CO., LTD.
NOTES TO THE FINANCIAL STATEMENTS
FOR THE SIX MONTHS ENDED 30 JUNE 2017 (All amounts in RMB'000 Yuan unless otherwise stated)
[English translation for reference only]
- 116 -
4 Notes to the consolidated financial statements (Cont’d) (28) Share capital
Item Opening balance
Movements in the current year Ending
balance
Transfer from surplus
reserve to paid-in capital
Exercise of share options Desterilisation Sub-total
RMB-denominated ordinary shares - (a)/(b)
RMB-denominated ordinary shares subject to trading restriction (a) 279,045 - 23,130 (90,499) (67,369) 211,676
RMB-denominated ordinary shares not subject to trading restriction (b) 6,179,722 - 37,740 90,499 128,239 6,307,961
6,458,767 - 60,870 - 60,870 6,519,637
(a) Pursuant to the Restricted Share Incentive Plan for 2017 as approved at the shareholders’
meeting dated 21 April 2017 (the "Restricted Share Incentive Plan for 2017 "), the Company granted 23,130,000 restricted shares with an exercise price of RMB15.86 to 133 employees. Under the circumstance that specified performance conditions are met, one third of the total share options granted will become effective after 1 year, 2 years and 3 years, respectively, since 12 May 2017. For the six months ended 30 June 2017, the total number of shares exercised by the granted employees was 23,130,000, of which RMB 23,130,000 was recognised as share capital, and RMB343,712,000 was recognised as capital surplus (share premium).
(b) Pursuant to the first share option incentive plan as approved at the first extraordinary general
meeting dated 17 February 2014 (the "First Options Incentive Programme"), the Company granted 99,863,000 share options with an exercise price of RMB10.01 to 691 employees. Under the circumstance that specified performance conditions are met, one third of the total share options granted will become effective after 1 year, 2 years and 3 years, respectively, since 18 February 2014. For the six months ended 30 June 2017, the total number of shares exercised by the granted employees was 20,046,539, of which RMB 20,046,539 was recognised as share capital, and RMB 251,337,000 was recognised as capital surplus (share premium), of which RMB67,912,000 transferred from capital surplus (others) to capital surplus (share premium).
Pursuant to the second share option incentive plan as approved at the first extraordinary general
meeting dated 25 May 2015 (the "Second Options Incentive Programme"), the Company granted 83,790,000 share options with an exercise price of RMB18.56 to 733 employees. Under the circumstance that specified performance conditions are met, one third of the total share options granted will become effective after 1 year, 2 years and 3 years, respectively, since 27 May 2015. For the six months ended 30 June 2017, the total number of shares exercised by the granted employees was 17,693,851, of which RMB17,693,851 was recognised as share capital, and RMB430,989,000 was recognised as capital surplus (share premium), of which RMB116,180,000 transferred from capital surplus (others) to capital surplus (share premium).
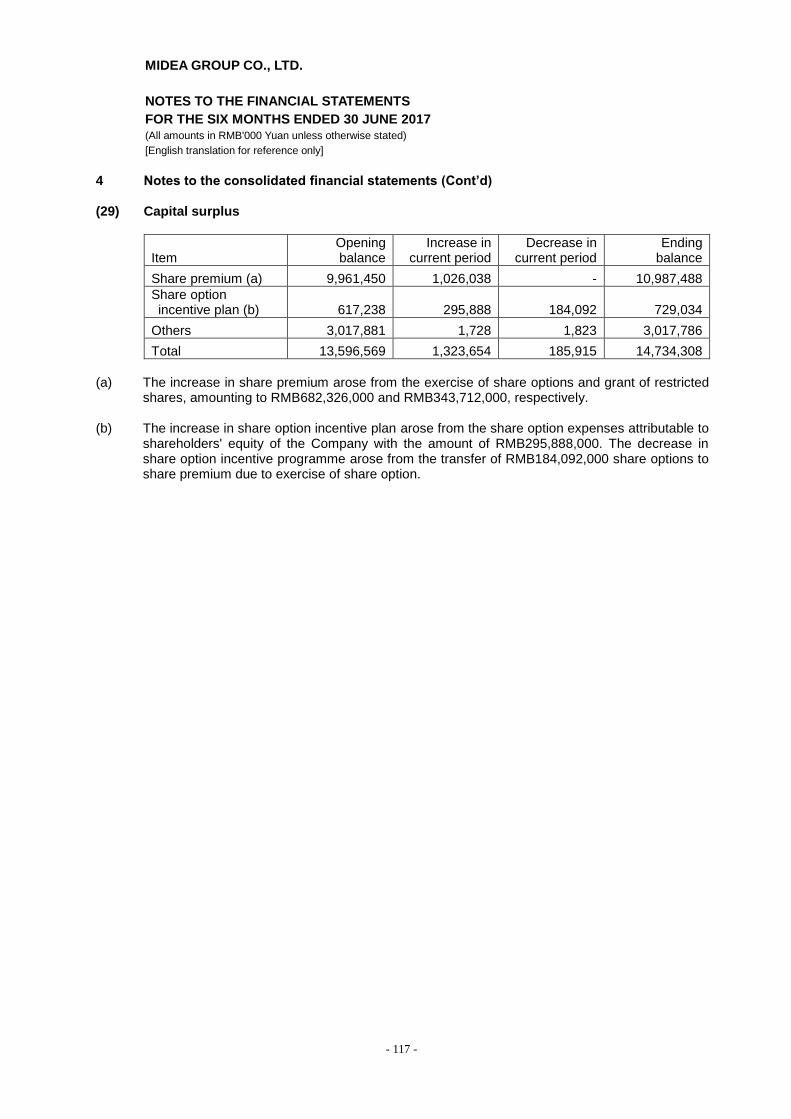
MIDEA GROUP CO., LTD.
NOTES TO THE FINANCIAL STATEMENTS
FOR THE SIX MONTHS ENDED 30 JUNE 2017 (All amounts in RMB'000 Yuan unless otherwise stated)
[English translation for reference only]
- 117 -
4 Notes to the consolidated financial statements (Cont’d) (29) Capital surplus
Item Opening balance
Increase in current period
Decrease in current period
Ending balance
Share premium (a) 9,961,450 1,026,038 - 10,987,488
Share option incentive plan (b) 617,238 295,888 184,092 729,034
Others 3,017,881 1,728 1,823 3,017,786
Total 13,596,569 1,323,654 185,915 14,734,308
(a) The increase in share premium arose from the exercise of share options and grant of restricted
shares, amounting to RMB682,326,000 and RMB343,712,000, respectively.
(b) The increase in share option incentive plan arose from the share option expenses attributable to shareholders' equity of the Company with the amount of RMB295,888,000. The decrease in share option incentive programme arose from the transfer of RMB184,092,000 share options to share premium due to exercise of share option.
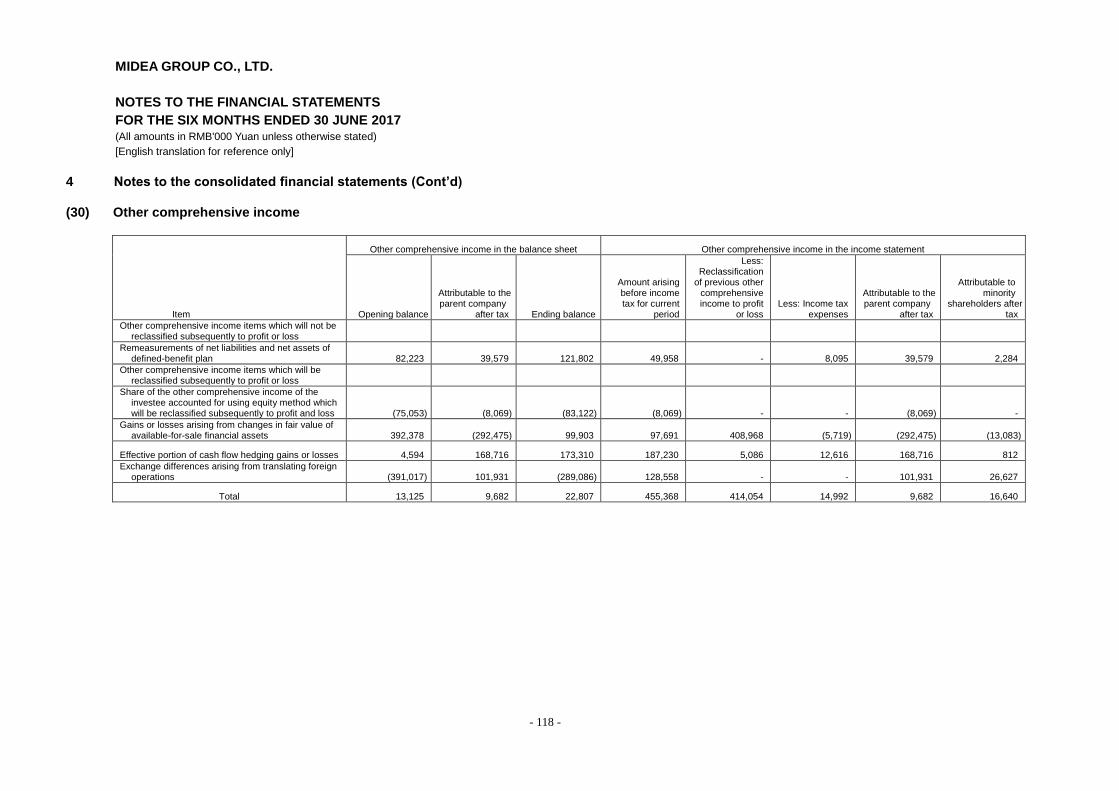
MIDEA GROUP CO., LTD.
NOTES TO THE FINANCIAL STATEMENTS
FOR THE SIX MONTHS ENDED 30 JUNE 2017 (All amounts in RMB'000 Yuan unless otherwise stated)
[English translation for reference only]
- 118 -
4 Notes to the consolidated financial statements (Cont’d) (30) Other comprehensive income
Item
Other comprehensive income in the balance sheet Other comprehensive income in the income statement
Opening balance
Attributable to the parent company
after tax Ending balance
Amount arising before income tax for current
period
Less: Reclassification
of previous other comprehensive income to profit
or loss Less: Income tax
expenses
Attributable to the parent company
after tax
Attributable to minority
shareholders after tax
Other comprehensive income items which will not be reclassified subsequently to profit or loss
Remeasurements of net liabilities and net assets of defined-benefit plan 82,223 39,579 121,802 49,958 - 8,095 39,579 2,284
Other comprehensive income items which will be reclassified subsequently to profit or loss
Share of the other comprehensive income of the investee accounted for using equity method which will be reclassified subsequently to profit and loss (75,053) (8,069) (83,122) (8,069) - - (8,069) -
Gains or losses arising from changes in fair value of available-for-sale financial assets 392,378 (292,475) 99,903 97,691 408,968 (5,719) (292,475) (13,083)
Effective portion of cash flow hedging gains or losses 4,594 168,716 173,310 187,230 5,086 12,616 168,716 812
Exchange differences arising from translating foreign operations (391,017) 101,931 (289,086) 128,558 - - 101,931 26,627
Total 13,125 9,682 22,807 455,368 414,054 14,992 9,682 16,640

MIDEA GROUP CO., LTD.
NOTES TO THE FINANCIAL STATEMENTS
FOR THE SIX MONTHS ENDED 30 JUNE 2017 (All amounts in RMB'000 Yuan unless otherwise stated)
[English translation for reference only]
- 119 -
4 Notes to the consolidated financial statements (Cont’d)
(31) Surplus reserve
Item Opening balance
Increase in current period
Decrease in current period Ending balance
Statutory surplus reserve 2,804,469 - - 2,804,469
(32) Undistributed profits
Item Current figure Comparative figure
Undistributed profits at the beginning of year 38,105,391 29,529,827
Add: Net profit attributable to the parent company for current period 10,811,322 9,496,493
Less: Ordinary share dividends payable 6,465,677 5,120,869
Appropriation to general reserve - -
Undistributed profits at the end of period 42,451,036 33,905,451
(a) Ordinary share dividends distributed in current year
In accordance with the resolution at the Board of Shareholders’ meeting, dated on 21 April 2017, the Company distributed a cash dividend to the shareholders at RMB1.00 per share, amounting to RMB6,465,677,000 calculated by 6,465,677,368 issued shares (2016: RMB1.2 per share, amounting to RMB5,120,869,000).
(33) Revenue and cost of sales
Item Current figure Comparative figure
Revenues from main operations 116,534,606 71,567,026
Other operating income 7,915,459 5,955,261
Sub-total 124,450,065 77,522,287
Item Current figure Comparative figure
Cost of sales from main operations 85,738,240 49,721,730
Cost of sales from other operations 7,312,841 5,144,430
Sub-total 93,051,081 54,866,160

MIDEA GROUP CO., LTD.
NOTES TO THE FINANCIAL STATEMENTS
FOR THE SIX MONTHS ENDED 30 JUNE 2017 (All amounts in RMB'000 Yuan unless otherwise stated)
[English translation for reference only]
- 120 -
4 Notes to the consolidated financial statements (Cont’d)
(33) Revenue and cost of sales (Cont’d) (a) Revenue and cost of sale from main operations
Products or business type
Current figure Comparative figure
Revenue Cost of sales Revenue Cost of sales
HVAC 50,022,802 35,410,252 35,346,190 23,823,434
Consumer appliances 51,827,140 37,688,678 35,315,742 25,062,020
Robots and automatic system 13,606,260 11,605,771 - -
Others 1,078,404 1,033,539 905,094 836,276
Sub-total 116,534,606 85,738,240 71,567,026 49,721,730
For the six months ended 30 June 2017, cost of sales is mainly material costs and labour costs, which accounts for over 80% of total cost of sales from main operations (For the six months ended 30 June 2016: over 80%).
(b) Revenue and cost of sales from other operations
Item
Current figure Comparative figure
Revenue Cost of sales Revenue Cost of sales
Revenue from sales of materials 7,276,885 7,097,826 5,506,428 5,024,891
Others 638,574 215,015 448,833 119,539
Sub-total 7,915,459 7,312,841 5,955,261 5,144,430
For the six months ended 30 June 2017, cost of sales from other operations is mainly material costs, which accounts for over 80% of total cost of sales from other operations (For the six months ended 30 June 2016: over 80%).
(34) Interest income/(expenses) Interest income and expenses arising from financial enterprises are presented as follows:
Item Current figure Comparative figure
Interest income from loans and advances 385,056 458,674
Including: Interest income from loans and advances to corporations and individuals 158,184 210,644
Interest income from note discounting 226,872 248,030
Interest income from deposits with banks, other financial institutions and central bank 128,493 20,902
Interest income 513,549 479,576
Interest expenses (165,666) (261,318)
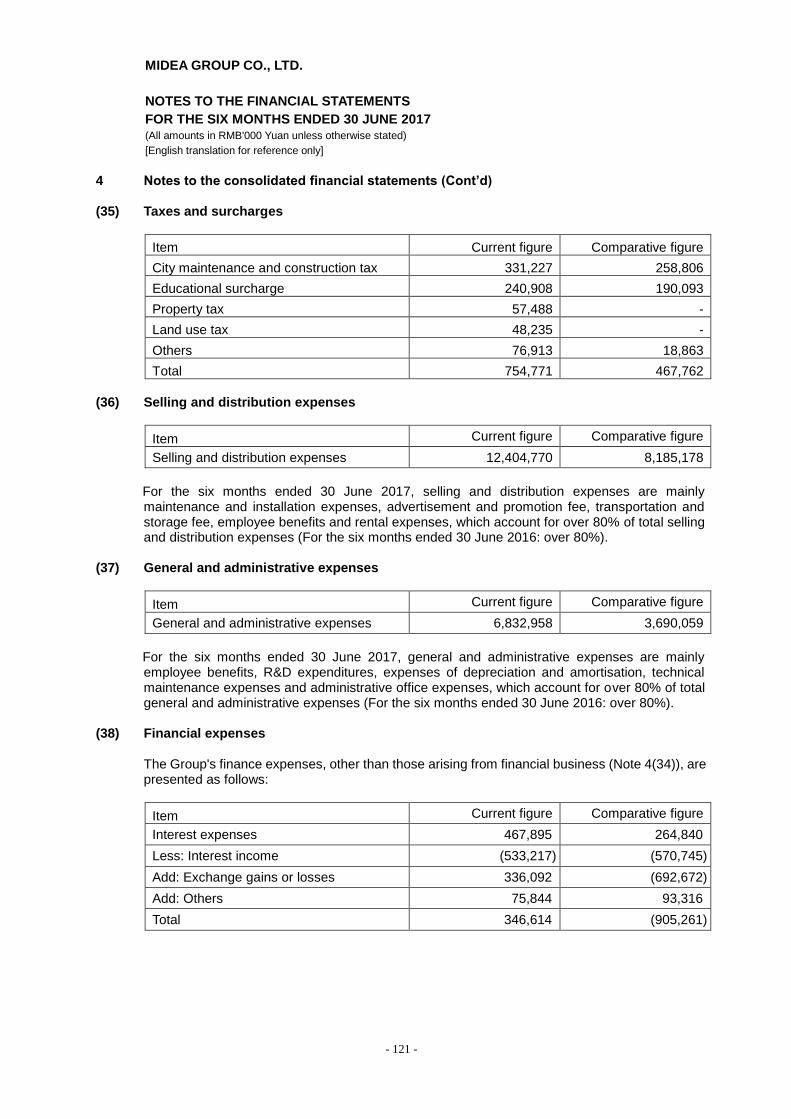
MIDEA GROUP CO., LTD.
NOTES TO THE FINANCIAL STATEMENTS
FOR THE SIX MONTHS ENDED 30 JUNE 2017 (All amounts in RMB'000 Yuan unless otherwise stated)
[English translation for reference only]
- 121 -
4 Notes to the consolidated financial statements (Cont’d) (35) Taxes and surcharges
Item Current figure Comparative figure
City maintenance and construction tax 331,227 258,806
Educational surcharge 240,908 190,093
Property tax 57,488 -
Land use tax 48,235 -
Others 76,913 18,863
Total 754,771 467,762
(36) Selling and distribution expenses
Item Current figure Comparative figure
Selling and distribution expenses 12,404,770 8,185,178
For the six months ended 30 June 2017, selling and distribution expenses are mainly
maintenance and installation expenses, advertisement and promotion fee, transportation and storage fee, employee benefits and rental expenses, which account for over 80% of total selling and distribution expenses (For the six months ended 30 June 2016: over 80%).
(37) General and administrative expenses
Item Current figure Comparative figure
General and administrative expenses 6,832,958 3,690,059
For the six months ended 30 June 2017, general and administrative expenses are mainly
employee benefits, R&D expenditures, expenses of depreciation and amortisation, technical maintenance expenses and administrative office expenses, which account for over 80% of total general and administrative expenses (For the six months ended 30 June 2016: over 80%).
(38) Financial expenses
The Group's finance expenses, other than those arising from financial business (Note 4(34)), are presented as follows:
Item Current figure Comparative figure
Interest expenses 467,895 264,840
Less: Interest income (533,217) (570,745)
Add: Exchange gains or losses 336,092 (692,672)
Add: Others 75,844 93,316
Total 346,614 (905,261)

MIDEA GROUP CO., LTD.
NOTES TO THE FINANCIAL STATEMENTS
FOR THE SIX MONTHS ENDED 30 JUNE 2017 (All amounts in RMB'000 Yuan unless otherwise stated)
[English translation for reference only]
- 122 -
4 Notes to the consolidated financial statements (Cont’d)
(39) Asset impairment loss
Item Current figure Comparative figure
Loss/(Reversal) of bad debts (Note 4(3)) 248,471 130,371
Loss on decline in the value of inventories (Note 4(6)) 114,783 25,210
Impairment loss on available-for-sale financial assets (Note 4(8)) - -
Impairment loss on fixed assets (Note 4(10)) 5,779 2,349
Impairment loss on intangible assets (Note 4(12)) 9,477 -
(Reversal)/Loss of impairment of loans (Note 4(5)) 27,587 93,880
Total 406,097 251,810
(40) Gains/(Losses) on changes in fair value
Item Current figure Comparative figure
Financial instruments at fair value through profit or loss - derivative financial instruments (9,523) (525,089)
(41) Investment income
Source of investment income Current figure Comparative figure
Investment income from wealth management products purchased from financial institutions 628,641 493,198
Investment income from disposal of financial assets at fair value through profit or loss (125,508) (14,501)
Investment income from long-term equity investment under equity method 287,134 200,742
Others 409,185 34,643
Total 1,199,452 714,082
There is no restriction on recovery of investment income.
(42) Other income
Item Current figure Comparative figure
Other income 846,226 -
According to the requirements of CAS 16 Government Grants issued by MOF in May 2017, the Group presented some of the government grants satisfying the requirements of rules under other income in the income statement.

MIDEA GROUP CO., LTD.
NOTES TO THE FINANCIAL STATEMENTS
FOR THE SIX MONTHS ENDED 30 JUNE 2017 (All amounts in RMB'000 Yuan unless otherwise stated)
[English translation for reference only]
- 123 -
4 Notes to the consolidated financial statements (Cont’d)
(43) Non-operating income
Item Current figure Comparative figure
Amount recognised in non-recurring profit or loss in current period
Total gains on disposal of non-current assets 781,229 3,548 781,229
Including: Gains on disposal of fixed assets 24,832 3,548 24,832
Gains on disposal of intangible assets 756,397 - 756,397
Government grants 12,778 762,724 12,778
Other income 196,907 137,000 196,907
Total 990,914 903,272 990,914
(44) Details of government grants
Item Current figure Comparative figure
Amount recognised in non-recurring profit or loss in current period
Total losses on disposal of non-current assets 37,127 32,149 37,127
Including: Losses on disposal of fixed assets 37,127 32,123 37,127
Losses on disposal of intangible assets - 26 -
Donations 12,549 10,264 12,549
Other expenses 370,267 61,386 370,267
Total 419,943 103,799 419,943
(45) Income tax expenses
Item Current figure Comparative figure
Current income tax 2,741,646 2,233,781
Deferred income tax (682,593) (287,110)
Total 2,059,053 1,946,671
The reconciliation from income tax calculated based on the applicable tax rates and total profit presented in the consolidated income statement to the income tax expenses is listed below:
Item Current figure Comparative figure
Total profit 13,607,124 12,177,569
Income tax calculated at tax rate of 25% 3,401,781 3,044,392
Effect of different tax rates applicable to subsidiaries (1,105,403) (1,029,606)
Adjustment of income tax annual filing for prior periods (102,064) (55,800)
Effect of income not subject to tax (113,664) (53,257)
Effect of costs, expenses and losses not deductible for tax purposes 128,859 60,369
Effect of usage of deductible losses for which no deferred income tax asset was recognised in prior periods (186,000) (6,571)
Effect of deductible temporary differences or deductible losses that are not recognised as deferred income tax assets in current period 17,446 5,894
Others 18,098 (18,750)
Income tax expenses 2,059,053 1,946,671

MIDEA GROUP CO., LTD.
NOTES TO THE FINANCIAL STATEMENTS
FOR THE SIX MONTHS ENDED 30 JUNE 2017 (All amounts in RMB'000 Yuan unless otherwise stated)
[English translation for reference only]
- 124 -
4 Notes to the consolidated financial statements (Cont’d)
(46) Calculation of basic and diluted earnings per share (a) Basic earnings per share
Basic earnings per share are calculated by dividing consolidated net profit attributable to ordinary shareholders of the parent company by the weighted average number of outstanding ordinary shares:
Item Unit Current figure Comparative
figure
Consolidated net profit attributable to ordinary shareholders of the parent company RMB'000 10,811,322 9,496,493
Weighted average number of outstanding ordinary shares
Thousand shares 6,464,909 6,400,970
Basic earnings per share RMB per share 1.67 1.48
(b) Diluted earnings per share are calculated by dividing consolidated net profit attributable to
ordinary shareholders of the parent company by the diluted weighted average number of outstanding ordinary shares:
Item Unit Current figure Comparative
figure
Consolidated net profit attributable to ordinary shareholders of the Company RMB'000 10,811,322 9,496,493
Weighted average number of ordinary shares of the Company outstanding
Thousand shares 6,464,909 6,400,970
Weighted average number of ordinary shares increased due to share options
Thousand shares 39,541 18,074
Weighted average number of diluted outstanding ordinary shares
Thousand shares 6,504,450 6,419,044
Diluted earnings per share RMB per share 1.66 1.48
(47) Notes to cash flow statement (a) Cash received relating to other operating activities
Item Current figure Comparative figure
Non-operating income 148,188 879,790
Other income 823,350 -
Other operating income 568,021 423,739
Financial interest income 87,473 116,164
Others 858,815 118,297
Total 2,485,847 1,537,990
(b) Cash paid relating to other operating activities
Item Current figure Comparative figure
General and administrative expenses (excluding employee benefits and taxes and surcharges) 3,778,202 1,872,868
Selling and distribution expenses (excluding employee benefits and taxes and surcharges) 9,577,762 6,707,172
Others 46,281 886,013
Total 13,402,245 9,466,053

MIDEA GROUP CO., LTD.
NOTES TO THE FINANCIAL STATEMENTS
FOR THE SIX MONTHS ENDED 30 JUNE 2017 (All amounts in RMB'000 Yuan unless otherwise stated)
[English translation for reference only]
- 125 -
4 Notes to the consolidated financial statements (Cont’d) (47) Notes to cash flow statement (Cont'd)
(c) Supplementary information to cash flow statement
Reconciliation of net profit to cash flow from operating activities is as follows:
Supplementary information Current figure Comparative figure
1) Reconciliation from net profit to cash flows from operating activities
Net profit 11,548,071 10,230,898
Add: Provision for assets impairment 406,097 251,810
Depreciation and amortisation 3,406,392 1,572,255
Net loss on disposal of non-current assets (744,102) 28,601
Losses on changes in fair value 9,523 525,089
Financial expenses 56,225 (273,692)
Investment income (1,199,452) (714,082)
Share options expenses 340,262 229,551
Decrease in deferred income tax assets (196,587) (356,685)
Increase in Deferred income tax liabilities (466,590) (1,391)
Decrease in inventories 1,152,072 2,264,446
Decrease in operating receivables (11,272,631) (10,458,499)
Increase in operating payables 10,856,652 4,830,862
Net cash flows from operating activities 13,895,932 8,129,163
2) Net movement in cash and cash equivalents
Cash at the end of period 20,786,431 10,296,816
Less: Cash at the beginning of period 12,513,730 5,187,317
Add: Cash equivalents at the end of period - -
Less: Cash equivalents at the beginning of period - -
Net increase in cash and cash equivalents 8,272,701 5,109,499
(d) Acquisition of subsidiaries
Item Current figure
Cash and cash equivalents paid in current period for business combinations occurred in current period 28,013,229
Including: KUKA 27,001,856
SMC 901,794
Others 109,579
Less: Cash and cash equivalents held by the subsidiaries at the acquisition dates 2,681,683
Including: KUKA 2,653,544
SMC 28,139
Net cash outflow on acquisition of the subsidiaries 25,331,546
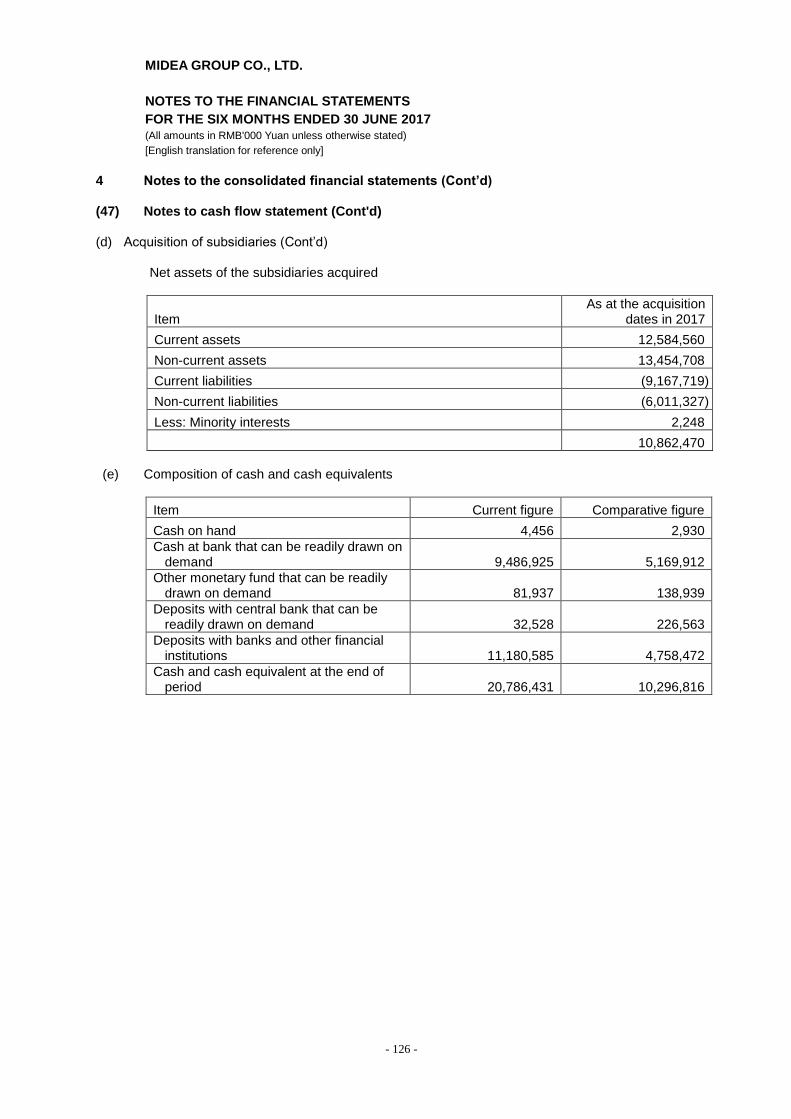
MIDEA GROUP CO., LTD.
NOTES TO THE FINANCIAL STATEMENTS
FOR THE SIX MONTHS ENDED 30 JUNE 2017 (All amounts in RMB'000 Yuan unless otherwise stated)
[English translation for reference only]
- 126 -
4 Notes to the consolidated financial statements (Cont’d) (47) Notes to cash flow statement (Cont'd)
(d) Acquisition of subsidiaries (Cont’d)
Net assets of the subsidiaries acquired
Item As at the acquisition
dates in 2017
Current assets 12,584,560
Non-current assets 13,454,708
Current liabilities (9,167,719)
Non-current liabilities (6,011,327)
Less: Minority interests 2,248
10,862,470
(e) Composition of cash and cash equivalents
Item Current figure Comparative figure
Cash on hand 4,456 2,930
Cash at bank that can be readily drawn on demand 9,486,925 5,169,912
Other monetary fund that can be readily drawn on demand 81,937 138,939
Deposits with central bank that can be readily drawn on demand 32,528 226,563
Deposits with banks and other financial institutions 11,180,585 4,758,472
Cash and cash equivalent at the end of period 20,786,431 10,296,816
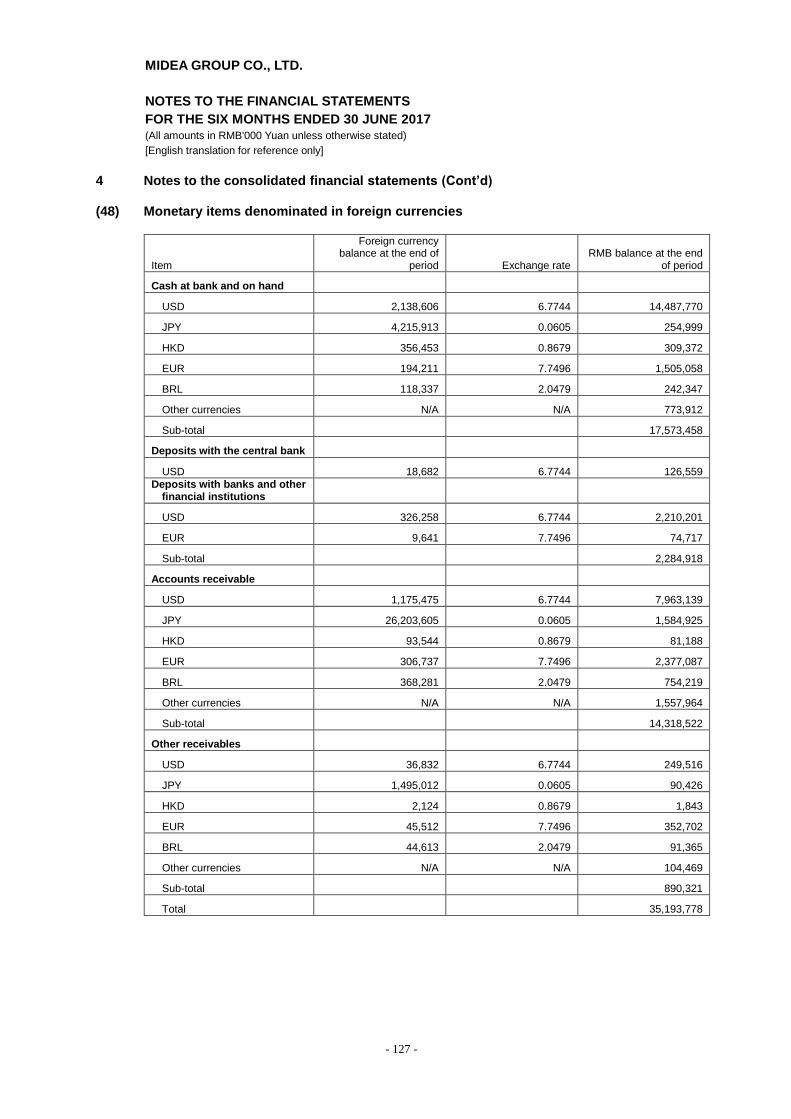
MIDEA GROUP CO., LTD.
NOTES TO THE FINANCIAL STATEMENTS
FOR THE SIX MONTHS ENDED 30 JUNE 2017 (All amounts in RMB'000 Yuan unless otherwise stated)
[English translation for reference only]
- 127 -
4 Notes to the consolidated financial statements (Cont’d)
(48) Monetary items denominated in foreign currencies
Item
Foreign currency balance at the end of
period Exchange rate RMB balance at the end
of period
Cash at bank and on hand
USD 2,138,606 6.7744 14,487,770
JPY 4,215,913 0.0605 254,999
HKD 356,453 0.8679 309,372
EUR 194,211 7.7496 1,505,058
BRL 118,337 2.0479 242,347
Other currencies N/A N/A 773,912
Sub-total 17,573,458
Deposits with the central bank
USD 18,682 6.7744 126,559
Deposits with banks and other financial institutions
USD 326,258 6.7744 2,210,201
EUR 9,641 7.7496 74,717
Sub-total 2,284,918
Accounts receivable
USD 1,175,475 6.7744 7,963,139
JPY 26,203,605 0.0605 1,584,925
HKD 93,544 0.8679 81,188
EUR 306,737 7.7496 2,377,087
BRL 368,281 2.0479 754,219
Other currencies N/A N/A 1,557,964
Sub-total 14,318,522
Other receivables
USD 36,832 6.7744 249,516
JPY 1,495,012 0.0605 90,426
HKD 2,124 0.8679 1,843
EUR 45,512 7.7496 352,702
BRL 44,613 2.0479 91,365
Other currencies N/A N/A 104,469
Sub-total 890,321
Total 35,193,778
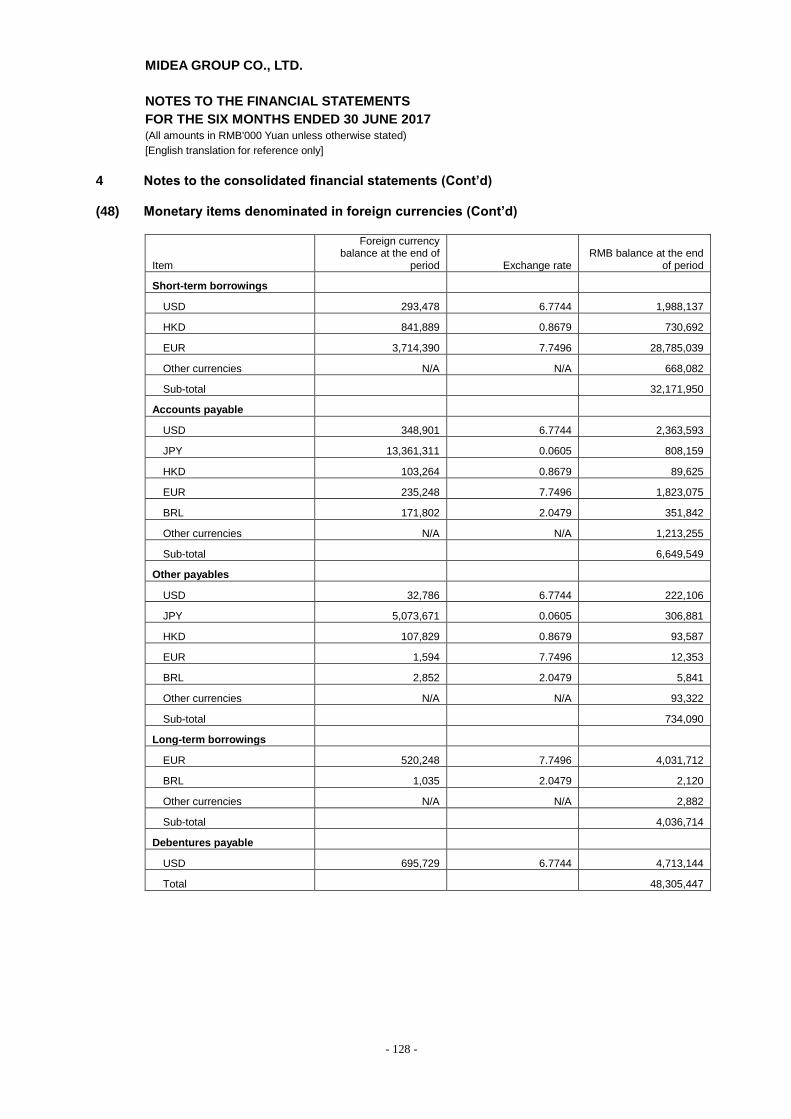
MIDEA GROUP CO., LTD.
NOTES TO THE FINANCIAL STATEMENTS
FOR THE SIX MONTHS ENDED 30 JUNE 2017 (All amounts in RMB'000 Yuan unless otherwise stated)
[English translation for reference only]
- 128 -
4 Notes to the consolidated financial statements (Cont’d)
(48) Monetary items denominated in foreign currencies (Cont’d)
Item
Foreign currency balance at the end of
period Exchange rate RMB balance at the end
of period
Short-term borrowings
USD 293,478 6.7744 1,988,137
HKD 841,889 0.8679 730,692
EUR 3,714,390 7.7496 28,785,039
Other currencies N/A N/A 668,082
Sub-total 32,171,950
Accounts payable
USD 348,901 6.7744 2,363,593
JPY 13,361,311 0.0605 808,159
HKD 103,264 0.8679 89,625
EUR 235,248 7.7496 1,823,075
BRL 171,802 2.0479 351,842
Other currencies N/A N/A 1,213,255
Sub-total 6,649,549
Other payables
USD 32,786 6.7744 222,106
JPY 5,073,671 0.0605 306,881
HKD 107,829 0.8679 93,587
EUR 1,594 7.7496 12,353
BRL 2,852 2.0479 5,841
Other currencies N/A N/A 93,322
Sub-total 734,090
Long-term borrowings
EUR 520,248 7.7496 4,031,712
BRL 1,035 2.0479 2,120
Other currencies N/A N/A 2,882
Sub-total 4,036,714
Debentures payable
USD 695,729 6.7744 4,713,144
Total 48,305,447
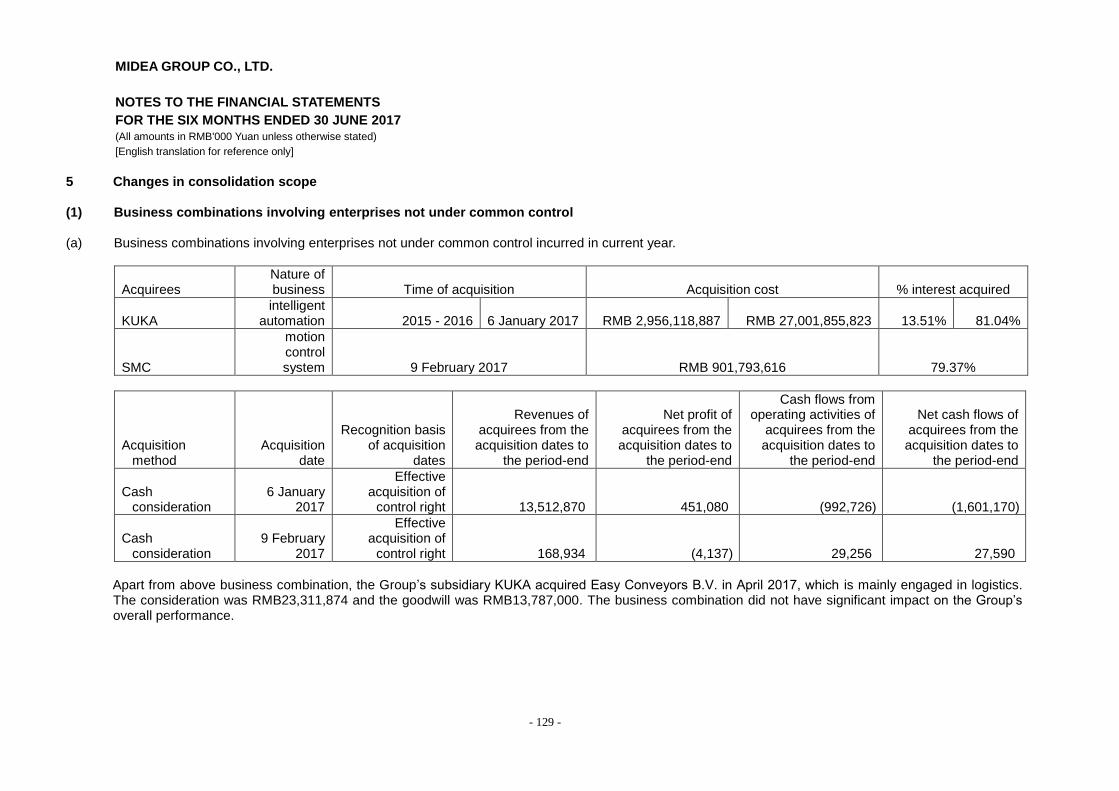
MIDEA GROUP CO., LTD.
NOTES TO THE FINANCIAL STATEMENTS
FOR THE SIX MONTHS ENDED 30 JUNE 2017 (All amounts in RMB'000 Yuan unless otherwise stated)
[English translation for reference only]
- 129 -
5 Changes in consolidation scope (1) Business combinations involving enterprises not under common control (a) Business combinations involving enterprises not under common control incurred in current year.
Acquirees Nature of business Time of acquisition Acquisition cost % interest acquired
KUKA intelligent
automation 2015 - 2016 6 January 2017 RMB 2,956,118,887 RMB 27,001,855,823 13.51% 81.04%
SMC
motion control system 9 February 2017 RMB 901,793,616 79.37%
Acquisition method
Acquisition date
Recognition basis of acquisition
dates
Revenues of acquirees from the acquisition dates to
the period-end
Net profit of acquirees from the acquisition dates to
the period-end
Cash flows from operating activities of
acquirees from the acquisition dates to
the period-end
Net cash flows of acquirees from the acquisition dates to
the period-end
Cash consideration
6 January 2017
Effective acquisition of
control right 13,512,870 451,080 (992,726) (1,601,170)
Cash consideration
9 February 2017
Effective acquisition of
control right 168,934 (4,137) 29,256 27,590
Apart from above business combination, the Group’s subsidiary KUKA acquired Easy Conveyors B.V. in April 2017, which is mainly engaged in logistics.
The consideration was RMB23,311,874 and the goodwill was RMB13,787,000. The business combination did not have significant impact on the Group’s overall performance.

MIDEA GROUP CO., LTD.
NOTES TO THE FINANCIAL STATEMENTS
FOR THE SIX MONTHS ENDED 30 JUNE 2017 (All amounts in RMB'000 Yuan unless otherwise stated)
[English translation for reference only]
- 130 -
5 Changes in consolidation scope (Cont’d) (1) Business combinations involving enterprises not under common control (Cont’d) (b) Details of costs of combination and good will are as follows:
Item KUKA SMC
Costs of combination -
Cash consideration 27,001,856 901,794
Fair value of previously held equity at acquisition dates 3,540,726 N/A
Future payment of consideration N/A N/A
Total cost of combination 30,542,582 901,794
Less: Share of fair value of the identifiable net assets obtained (9,844,370) (357,239)
Goodwill 20,698,212 544,555
The Group mainly uses valuation techniques such as market approach, income approach and cost approach to determine the fair value of non-cash assets transferred and liabilities incurred. The Group recognises the differences between costs of combination and the share of fair value of the identifiable net assets of KUKA and SMC obtained in the combination as goodwill for the period in which the combination incurs.
(c) Assets and liabilities of acquirees at acquisition dates are as follows: (i) KUKA
KUKA Fair value at the acquisition date
Carrying amount at the acquisition date
Current assets 12,468,388 12,468,388
Non-current assets 12,925,644 6,119,034
Current liabilities (9,092,126) (9,092,126)
Non-current liabilities (5,891,794) (3,355,987)
Less: Minority interests 2,248 2,248
Net assets obtained 10,412,360 6,141,556
The Group uses valuation techniques to determine the fair value of KUKA's assets and liabilities at the acquisition date. The valuation method and critical assumptions applied to the major assets are as follows: The fair value of land was estimated by applying the market value approach. To evaluate the fair value of the assets, it compared the transaction price and desired selling price of similar assets in the active market and adjusted the actual difference between the evaluated assets and similar assets. The fair value of building and machine was estimated by applying cost approach, which considered the current replacement cost of fixed assets after deduction of the loss value. The current replacement cost was calculated at full price multiplied by the new comprehensive rate of equipment.

MIDEA GROUP CO., LTD.
NOTES TO THE FINANCIAL STATEMENTS
FOR THE SIX MONTHS ENDED 30 JUNE 2017 (All amounts in RMB'000 Yuan unless otherwise stated)
[English translation for reference only]
- 131 -
5 Changes in consolidation scope (Cont’d) (1) Business combinations involving enterprises not under common control (Cont’d) (c) Assets and liabilities of acquirees at acquisition dates are as follows (Cont'd): (i) KUKA (Cont’d)
The fair value of trademarks and patents was estimated by applying income approach, which considered present value of royalty fees discounted at a proper rate that were saved annually by using the relevant assets during the remaining useful life of trademarks and patents. Relationship with customers and orders were estimated by multi-period excess income general method. The present value on the assessment date was discounted at a proper rate on the basis of the sum of present value of excess income arising from economic benefits net of tax after deducting assets contributed during future useful years of customer relationship or orders.
(ii) SMC
SMC Fair value at the acquisition date
Carrying amount at the acquisition date
Current assets 116,172 116,172
Non-current assets 529,064 38,630
Current liabilities (75,593) (75,593)
Non-current liabilities (119,533) (6,733)
Net assets obtained 450,110 72,476
(d) Cash flows for the period from the acquisition date to 30 June 2017 are as follows:
Item
For the period from the acquisition dates to 31 December 2016
KUKA SMC
Net cash flows from operating activities (992,726) 29,256
Net cash flows from investing activities (447,133) -
Net cash flows from financing activities (161,311) (1,666)
(1,601,170) 27,590
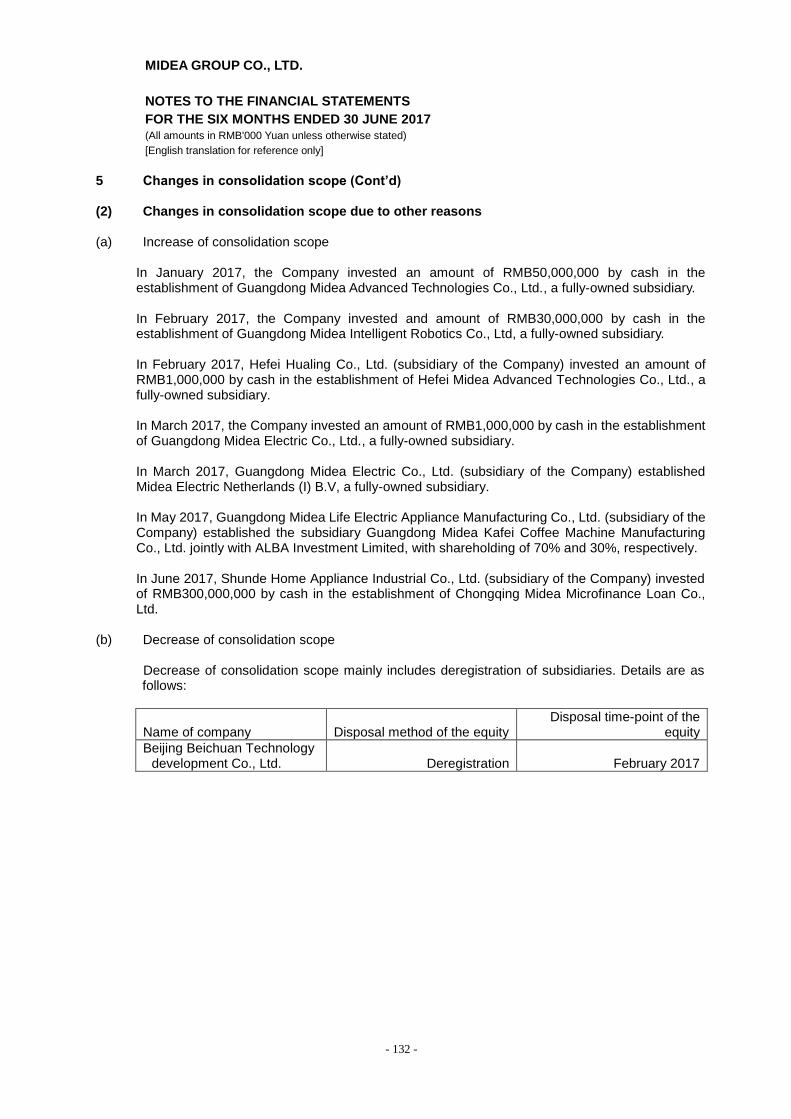
MIDEA GROUP CO., LTD.
NOTES TO THE FINANCIAL STATEMENTS
FOR THE SIX MONTHS ENDED 30 JUNE 2017 (All amounts in RMB'000 Yuan unless otherwise stated)
[English translation for reference only]
- 132 -
5 Changes in consolidation scope (Cont’d)
(2) Changes in consolidation scope due to other reasons (a) Increase of consolidation scope
In January 2017, the Company invested an amount of RMB50,000,000 by cash in the establishment of Guangdong Midea Advanced Technologies Co., Ltd., a fully-owned subsidiary. In February 2017, the Company invested and amount of RMB30,000,000 by cash in the establishment of Guangdong Midea Intelligent Robotics Co., Ltd, a fully-owned subsidiary. In February 2017, Hefei Hualing Co., Ltd. (subsidiary of the Company) invested an amount of RMB1,000,000 by cash in the establishment of Hefei Midea Advanced Technologies Co., Ltd., a fully-owned subsidiary. In March 2017, the Company invested an amount of RMB1,000,000 by cash in the establishment of Guangdong Midea Electric Co., Ltd., a fully-owned subsidiary. In March 2017, Guangdong Midea Electric Co., Ltd. (subsidiary of the Company) established Midea Electric Netherlands (I) B.V, a fully-owned subsidiary. In May 2017, Guangdong Midea Life Electric Appliance Manufacturing Co., Ltd. (subsidiary of the Company) established the subsidiary Guangdong Midea Kafei Coffee Machine Manufacturing Co., Ltd. jointly with ALBA Investment Limited, with shareholding of 70% and 30%, respectively. In June 2017, Shunde Home Appliance Industrial Co., Ltd. (subsidiary of the Company) invested of RMB300,000,000 by cash in the establishment of Chongqing Midea Microfinance Loan Co., Ltd.
(b) Decrease of consolidation scope
Decrease of consolidation scope mainly includes deregistration of subsidiaries. Details are as follows:
Name of company Disposal method of the equity Disposal time-point of the
equity
Beijing Beichuan Technology development Co., Ltd. Deregistration February 2017

MIDEA GROUP CO., LTD.
NOTES TO THE FINANCIAL STATEMENTS
FOR THE SIX MONTHS ENDED 30 JUNE 2017
(All amounts in RMB'000 Yuan unless otherwise stated)
[English translation for reference only]
- 133 -
6 Interests in other entities (1) Interests in subsidiaries
(a) Information of significant subsidiaries
Major business location Place of registration Nature of business
Shareholding (%) Acquisition method
Direct Indirect
Guangdong Midea Heating & Ventilation Equipment Co., Ltd. Foshan, PRC Foshan, PRC Manufacture of air conditioner 90% 10% Establishment
Hefei Hualing Co., Ltd. Hefei, PRC Hefei, PRC Manufacture of refrigerator 75% 25% Business combinations involving
enterprises not under common control
Foshan Shunde Home Appliance Industrial Co., Ltd., Foshan, PRC Foshan, PRC Investment holding 100% - Establishment
Midea Wuhan Refrigeration Equipments Co., Ltd. Wuhan, PRC Wuhan, PRC Manufacture of air conditioner 73% 7% Establishment
Foshan Shunde Midea Electric Appliance Manufacturing Co., Ltd. Foshan, PRC Foshan, PRC Manufacture of small household
appliances - 100% Establishment
Hefei Midea Refrigerator Co., Ltd. Hefei, PRC Hefei, PRC Manufacture of refrigerator 75% 25% Business combinations involving
enterprises not under common control
Welling Holding Co., Ltd. Foshan, PRC Hong Kong Manufacture of motors 68.63% - Business combinations involving
enterprises not under common control
Ningbo Midea United Material Supply Co., Ltd. Ningbo, PRC Ningbo, PRC Manufacture of air conditioner 100% - Business combination involving
enterprises under common control
Annto Logistics Co., Ltd. Wuhu, PRC Wuhu, PRC Cargo storage and
transportation 55% 25% Business combination involving
enterprises under common control
Wuxi Little Swan Company Limited Wuxi, PRC Wuxi, PRC Manufacture of washing
machine 38% 15% Business combinations involving
enterprises not under common control
Guangdong Midea Refrigeration Equipment Co., Ltd. Foshan, PRC Foshan, PRC Manufacture and sales of air
conditioner 73% 7% Business combinations involving
enterprises not under common control
Guangdong Midea Kitchen Electric Manufacturing Co., Ltd. Foshan, PRC Foshan, PRC Manufacture of small household
appliances - 100% Establishment
Guangdong Midea Wuhu Refrigeration Equipment Co., Ltd. Wuhu, PRC Wuhu, PRC Manufacture and sales of air
conditioner 73% 7% Business combinations involving
enterprises not under common control
Wuhu Meizhi Air-Conditioning Equipment Co., Ltd. Wuhu, PRC Wuhu, PRC Manufacture of air conditioner 88% 12% Establishment
Wuhu Midea Kitchen & Bathroom Electric Manufacturing Wuhu, PRC Wuhu, PRC Manufacture of small household
appliances 90% 10% Business combination involving
enterprises under common control
Wuhu Midea Electric Appliance Manufacturing Co., Ltd. Wuhu, PRC Wuhu, PRC Manufacture of small household
appliances - 100% Establishment
MECCA INTERNATIONAL (BVI) LIMITED British Virgin Islands British Virgin Islands Investment holding - 100% Establishment
Midea International Holding Co., Ltd. Hong Kong Hong Kong Investment holding 100% - Establishment
Midea Investment & Development Corporation British Virgin Islands British Virgin Islands Investment holding - 100% Establishment
TLSC Japan Japan Manufacture of household
appliances - 80% Business combinations involving
enterprises not under common control
KUKA Germany Germany intelligent automation - 94.55% Business combinations involving
enterprises not under common control
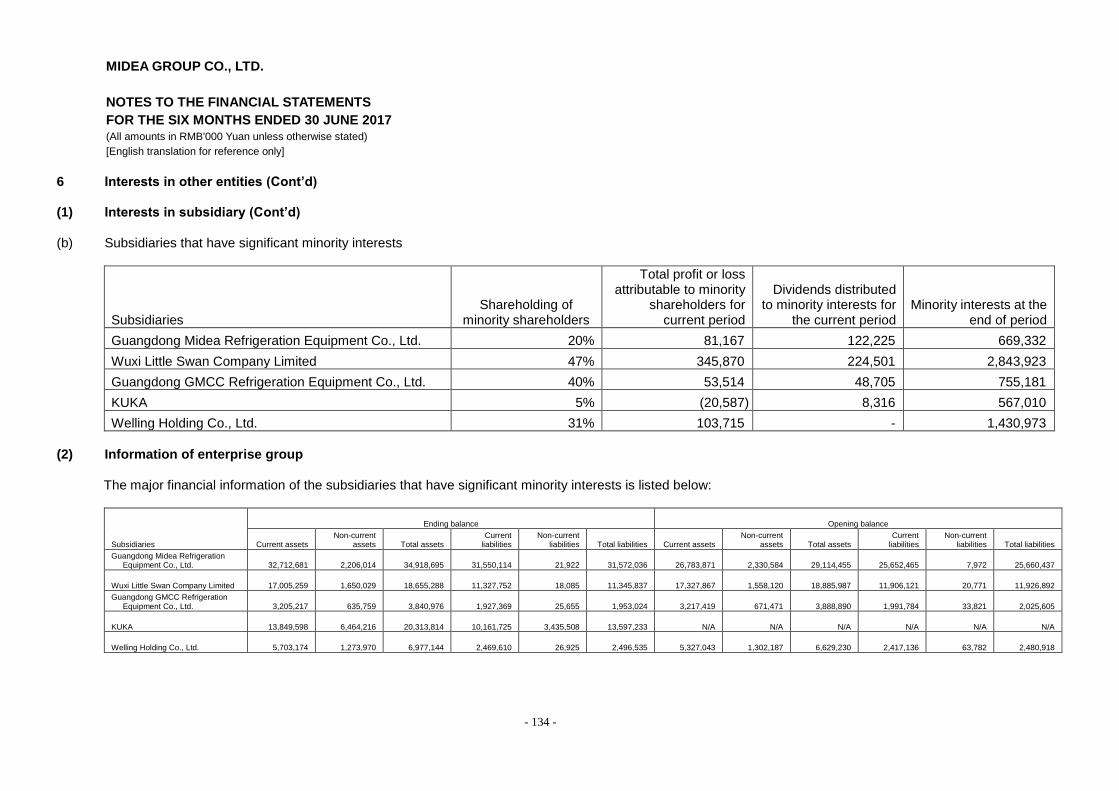
MIDEA GROUP CO., LTD.
NOTES TO THE FINANCIAL STATEMENTS
FOR THE SIX MONTHS ENDED 30 JUNE 2017
(All amounts in RMB'000 Yuan unless otherwise stated)
[English translation for reference only]
- 134 -
6 Interests in other entities (Cont’d) (1) Interests in subsidiary (Cont’d)
(b) Subsidiaries that have significant minority interests
Subsidiaries Shareholding of
minority shareholders
Total profit or loss attributable to minority
shareholders for current period
Dividends distributed to minority interests for
the current period Minority interests at the
end of period
Guangdong Midea Refrigeration Equipment Co., Ltd. 20% 81,167 122,225 669,332
Wuxi Little Swan Company Limited 47% 345,870 224,501 2,843,923
Guangdong GMCC Refrigeration Equipment Co., Ltd. 40% 53,514 48,705 755,181
KUKA 5% (20,587) 8,316 567,010
Welling Holding Co., Ltd. 31% 103,715 - 1,430,973
(2) Information of enterprise group
The major financial information of the subsidiaries that have significant minority interests is listed below:
Subsidiaries
Ending balance Opening balance
Current assets Non-current
assets Total assets Current
liabilities Non-current
liabilities Total liabilities Current assets Non-current
assets Total assets Current
liabilities Non-current
liabilities Total liabilities
Guangdong Midea Refrigeration Equipment Co., Ltd. 32,712,681 2,206,014 34,918,695 31,550,114 21,922 31,572,036 26,783,871 2,330,584 29,114,455 25,652,465 7,972 25,660,437
Wuxi Little Swan Company Limited 17,005,259 1,650,029 18,655,288 11,327,752 18,085 11,345,837 17,327,867 1,558,120 18,885,987 11,906,121 20,771 11,926,892
Guangdong GMCC Refrigeration Equipment Co., Ltd. 3,205,217 635,759 3,840,976 1,927,369 25,655 1,953,024 3,217,419 671,471 3,888,890 1,991,784 33,821 2,025,605
KUKA 13,849,598 6,464,216 20,313,814 10,161,725 3,435,508 13,597,233 N/A N/A N/A N/A N/A N/A
Welling Holding Co., Ltd. 5,703,174 1,273,970 6,977,144 2,469,610 26,925 2,496,535 5,327,043 1,302,187 6,629,230 2,417,136 63,782 2,480,918
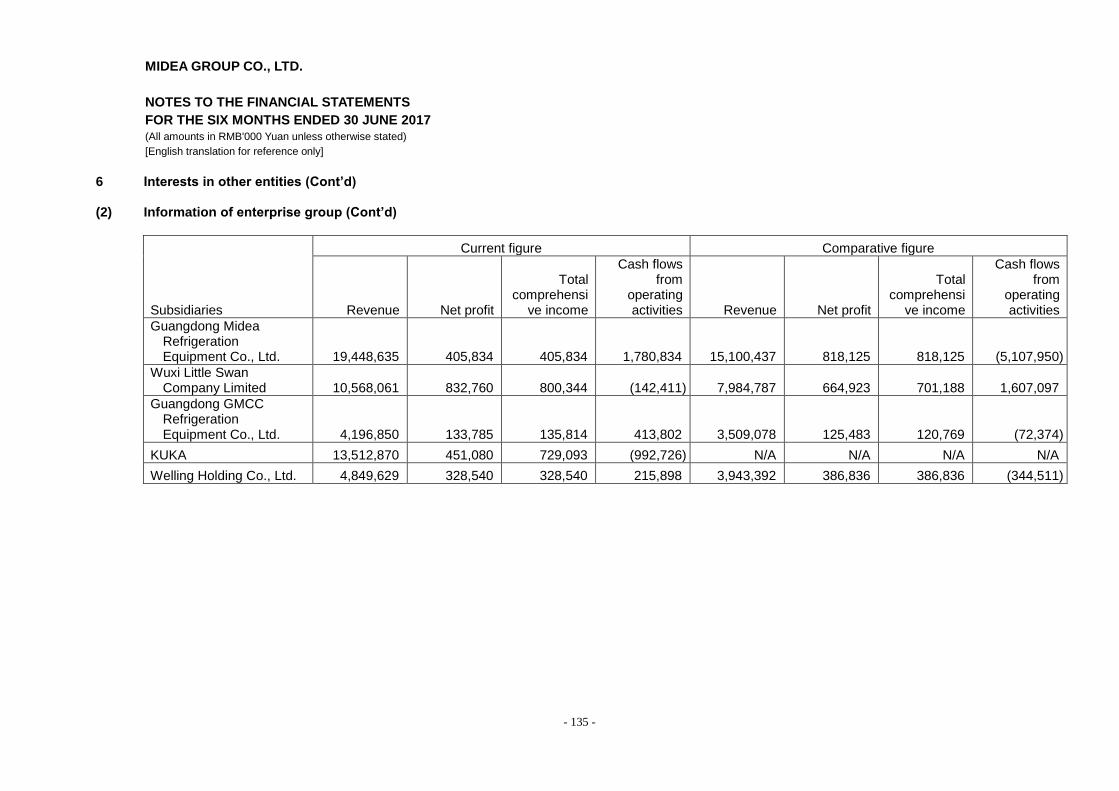
MIDEA GROUP CO., LTD.
NOTES TO THE FINANCIAL STATEMENTS
FOR THE SIX MONTHS ENDED 30 JUNE 2017
(All amounts in RMB'000 Yuan unless otherwise stated)
[English translation for reference only]
- 135 -
6 Interests in other entities (Cont’d) (2) Information of enterprise group (Cont’d)
Subsidiaries
Current figure Comparative figure
Revenue Net profit
Total comprehensi
ve income
Cash flows from
operating activities Revenue Net profit
Total comprehensi
ve income
Cash flows from
operating activities
Guangdong Midea Refrigeration Equipment Co., Ltd. 19,448,635 405,834 405,834 1,780,834 15,100,437 818,125 818,125 (5,107,950)
Wuxi Little Swan Company Limited 10,568,061 832,760 800,344 (142,411) 7,984,787 664,923 701,188 1,607,097
Guangdong GMCC Refrigeration Equipment Co., Ltd. 4,196,850 133,785 135,814 413,802 3,509,078 125,483 120,769 (72,374)
KUKA 13,512,870 451,080 729,093 (992,726) N/A N/A N/A N/A
Welling Holding Co., Ltd. 4,849,629 328,540 328,540 215,898 3,943,392 386,836 386,836 (344,511)

MIDEA GROUP CO., LTD.
NOTES TO THE FINANCIAL STATEMENTS
FOR THE SIX MONTHS ENDED 30 JUNE 2017 (All amounts in RMB'000 Yuan unless otherwise stated)
[English translation for reference only]
- 136 -
6 Interests in other entities (Cont’d) (3) Interests in associates and joint ventures The impact of the Group’s associates and joint ventures on the Group is not significant.
Summarised information is as follows:
Item Current figure Comparative figure
Aggregated carrying amount of investments 2,586,329 3,108,646
Aggregate of the following items calculated in proportion to shareholding (i) 287,134 200,742
Other comprehensive income (i) (8,069) (65,706)
Total comprehensive income 279,065 135,036
(i) The net profit and other comprehensive income have taken into account the impacts of both the
fair value of the identifiable assets and liabilities upon the acquisition of investment and accounting policies unifying.
7 Segment information
The reportable segments of the Group are the business units that provide different products or service, or operate in the different areas. Different businesses or areas require different technologies and marketing strategies, the Group, therefore, separately manages the production and operation of each reportable segment and evaluates their operating results respectively, in order to make decisions about resources to be allocated to these segments and to assess their performance. In 2016 and early of 2017, the Group finished a series of overseas merges, such as TLSC and KUKA(Germany robot enterprises), and carried out integration on the existing business and newly acquired business. On the basis of new management mode, the segment reporting was adjusted accordingly, and the comparative figures were presented accordingly too. The Group identified 4 reportable segments as follows:
- Heating & ventilation, as well as air-conditioner - Consumer appliances - Robots and automatic system - Others
Inter-segment transfer prices are measured by reference to selling prices to third parties.
The assets are allocated based on the operations of the segment and the physical location of the asset. The liabilities are allocated based on the operations of the segment. Expenses indirectly attributable to each segment are allocated to the segments based on the proportion of each segment’s revenue. Operating expenses include cost of sales, interest expenses, fee and commission expenses, taxes and surcharges, selling and distribution expenses, general and administrative expenses, financial expenses and asset impairment losses.

MIDEA GROUP CO., LTD.
NOTES TO THE FINANCIAL STATEMENTS
FOR THE SIX MONTHS ENDED 30 JUNE 2017
(All amounts in RMB'000 Yuan unless otherwise stated)
[English translation for reference only]
- 137 -
8 Segment reporting (a) Information on the profit or loss, assets and liabilities of reported segment
Segment information as at and for the six months ended 30 June 2017 is as follows:
Item
Current figure
Heating & ventilation, as well as
air-conditioner Consumer appliances Robots and automatic
system Other segments and
unallocated Elimination Total
Revenue from external customers 55,624,107 54,049,321 13,655,523 1,634,665 - 124,963,616
Inter-segment revenue 1,216,745 139,860 433 2,879,845 (4,236,883) -
Operating expenses (51,390,893) (48,664,743) (14,486,022) (3,640,771) 4,218,811 (113,963,618)
Segment profit 5,449,959 5,524,438 (830,066) 873,739 (18,072) 10,999,998
Other profit or loss 2,607,126
Total profit 13,607,124
Total assets 92,062,091 90,073,822 27,602,655 81,363,914 (60,085,990) 231,016,492
Total liabilities 62,786,365 92,183,380 17,183,416 68,684,125 (84,815,686) 156,021,600
Long-term equity investments in associates and joint ventures 209,974 74,533 138,011 2,163,811 2,586,329
Investment income from associates and joint ventures 37,670 4,097 (7,902) 253,269 287,134
Increase in non-current assets (excluding available-for-sale financial assets, long-term equity investments and deferred income tax assets) 471,922 1,011,631 12,736,618 110,494 - 14,330,665
Asset impairment losses/(reversal) 248,101 47,601 27,591 18,859 63,945 406,097
Depreciation and amortisation expenses 794,475 947,541 1,462,109 202,267 - 3,406,392

MIDEA GROUP CO., LTD.
NOTES TO THE FINANCIAL STATEMENTS
FOR THE SIX MONTHS ENDED 30 JUNE 2017
(All amounts in RMB'000 Yuan unless otherwise stated)
[English translation for reference only]
- 138 -
8 Segment report (Cont’d) (a) Information on the profit or loss, assets and liabilities of reported segment (Cont’d)
Segment information as at and for the six months ended 30 June 2016 is as follows:
Item
Comparative figure
Heating & ventilation, as well as air-conditioner
Consumer appliances
Robots and automatic system
Other segments and unallocated Elimination Total
Revenue from external customers 39,629,469 36,981,287 - 1,396,760 - 78,007,516
Inter-segment revenue 185,483 96,123 - 1,904,893 (2,186,499) -
Operating expenses (33,557,545) (32,172,808) - (3,270,777) 2,182,717 (66,818,413)
Segment profit 6,257,407 4,904,602 - 30,876 (3,782) 11,189,103
Other profit or loss 988,466
Total profit 12,177,569
Total assets 90,473,297 101,109,587 - 73,283,606 (97,363,743) 167,502,747
Total liabilities 66,788,913 70,938,523 - 71,061,413 (103,945,230) 104,843,619
Long-term equity investments in associates and joint ventures 617,369 2,700 - 2,488,577 - 3,108,646
Investment income from associates and joint ventures 32,339 - - 168,403 - 200,742
Increase in non-current assets (excluding available-for-sale financial assets, long-term equity investments and deferred income tax assets) 566,527 8,256,262 - 483,029 - 9,305,818
Asset impairment losses/(reversal) 123,937 32,502 - 94,472 899 251,810
Depreciation and amortisation expenses 767,432 675,610 - 129,213 - 1,572,255

MIDEA GROUP CO., LTD.
NOTES TO THE FINANCIAL STATEMENTS FOR THE SIX MONTHS ENDED 30 JUNE 2017
(All amounts in RMB'000 Yuan unless otherwise stated) [English translation for reference only]
- 139 -
8 Segment report (Cont’d) (b) Geographical area information
The Group’s revenue from external customers domestically and in foreign countries or geographical areas, and the total non-current assets other than available-for-sale financial assets, long-term equity investments, goodwill and deferred income tax assets located domestically and in foreign countries or geographical areas (including Germany, Japan, Hong Kong, Macau, Singapore, and Brazil, etc.) are as follows:
Revenue from external customers Current figure Comparative figure
Domestic 69,364,700 46,668,922
In other countries/geographical areas 55,598,916 31,338,594
Total 124,963,616 78,007,516
Total non-current assets Current figure Comparative figure
Domestic 23,250,191 28,960,862
In other countries/geographical areas 19,155,011 8,751,634
Total 42,405,202 37,712,496
9 Related parties and significant related party transactions (1) Information of the parent company
(a) General information of the parent company
Name of the parent company Relationship Place of registration
Nature of business
Midea Holding Co., Ltd.
Controlling shareholder Shunde District, Foshan Commercial
The Company’s ultimate controlling person is Mr. He Xiangjian.
(b) Registered capital and changes in registered capital of the parent company
Name of the parent company Registered capital
Midea Holding Co., Ltd. 330,000
(c) The percentages of shareholding and voting rights in the Company held by the parent company
Name of the parent company
At the end of period At the beginning of period
Shareholding (%) Voting rights (%)
Shareholding (%) Voting rights (%) Direct Indirect Direct Indirect
Midea Holding Co., Ltd. 33.93% - 33.93% 34.75% - 34.75%

MIDEA GROUP CO., LTD.
NOTES TO THE FINANCIAL STATEMENTS FOR THE SIX MONTHS ENDED 30 JUNE 2017
(All amounts in RMB'000 Yuan unless otherwise stated) [English translation for reference only]
- 140 -
9 Related parties and significant related party transactions (Cont’d)
(2) Information of the Company's subsidiaries
Please refer to Note 6(1) for the information of the Company’s main subsidiaries. (3) Information of other related parties
Name of other related parties Relationship
Guangzhou Wellkey Electrician Material Co., Ltd. Under common control of the direct relatives of the
Company's ultimate controlling shareholders
Anhui Wellkey Electrician Material Co., Ltd. Under common control of the direct relatives of the
Company's ultimate controlling shareholders
Infore Investment Holding Group Co., Ltd. Under common control of the direct relatives of the
Company's ultimate controlling shareholders
Hefei Orinko Plastics Group. Under common control of the direct relatives of the
Company's ultimate controlling shareholders
Foshan Midea Real Estate Development Co., Ltd. Under common control of the Company's actual
controlling persons
Foshan Micro Midea Filter MFG Co., Ltd. Associates of the Company
Foshan Shunde Rural Commercial Bank Co., Ltd. Associates of the Company
(4) Information of related party transactions
The following related party transactions are conducted in accordance with normal commercial terms or relevant agreements.
(a) Purchase of goods
Related parties
Content of related party transactions
Pricing policies of related party
transactions Current
figure Comparativ
e figure
Hefei Orinko Plastics Group. Purchase of
goods Agreed price 241,380 104,024
Guangzhou Wellkey Electrician Material Co., Ltd.
Purchase of goods Agreed price 417,827 476,574
Foshan Micro Midea Filter MFG Co., Ltd.
Purchase of goods Agreed price 93,705 82,158
Guangdong Infore Electronics Co., Ltd.
Purchase of goods Agreed price 714 -
Anhui Wellkey Electrician Material Co., Ltd.
Purchase of goods Agreed price 123,049 117,679
Total 876,675 780,435
(b) Investment income
Related parties Content Current figure Comparative
figure
Foshan Shunde Rural Commercial Bank Co., Ltd.
Wealth management products 28,287 44,400

MIDEA GROUP CO., LTD.
NOTES TO THE FINANCIAL STATEMENTS FOR THE SIX MONTHS ENDED 30 JUNE 2017
(All amounts in RMB'000 Yuan unless otherwise stated) [English translation for reference only]
- 141 -
9 Related parties and significant related party transactions (Cont’d)
(5) Receivables from and payables to related parties
Receivables from related parties
Items Related parties Ending balance Opening balance
Advances to suppliers Hefei Orinko Plastics Group. 126,893 41,161
Items Related parties Ending balance Opening balance
Other current assets Foshan Shunde Rural Commercial Bank Co., Ltd. 800,000 1,500,000
Items Related parties Ending balance Opening balance
Cash at bank and on hand Foshan Shunde Rural Commercial Bank Co., Ltd. 437,104 1,201,929
Payables to related parties:
Items Related parties Ending balance Opening balance
Accounts payable
Guangzhou Wellkey Electrician Material Co., Ltd. 168,610 43,132
Foshan Micro Midea Filter MFG Co., Ltd. 29,701 15,985
Hefei Orinko Plastics Group. 19,145 12,269
Anhui Wellkey Electrician Material Co., Ltd. 44,490 55,962
Guangdong Infore Electronics Co., Ltd. 201 -
Sub-total 262,147 127,348
10 Share-based payment and restricted shares (1) Share-based payment
(a) Pursuant to the forth share option incentive plan (the “Forth Share Option Incentive Plan”)
approved at the shareholders' meeting for the year ended 31 December 2016 dated 21 April 2017, the Company granted 98,274,000 share options with exercise price of RMB32.72 to 1463 employees. Under the circumstance that the Company meets expected performance, 1/3 of the total share options granted will become effective after 1 year, 2 years and 3 years respectively since 12 May 2017. Determination method for fair value of share options at the grant date
Exercise price of options: RMB 32.72
Effective period of options: 4 years
Current price of underlying shares RMB 35.75
Estimated fluctuation rate of share price: 38.13%
Estimated dividend rate: 4.40%
Risk-free interest rate within effective period of options: 2.83%
The fair value of the Forth Share Option Incentive Plan calculated pursuant to the above parameters is: RMB835,743,000.
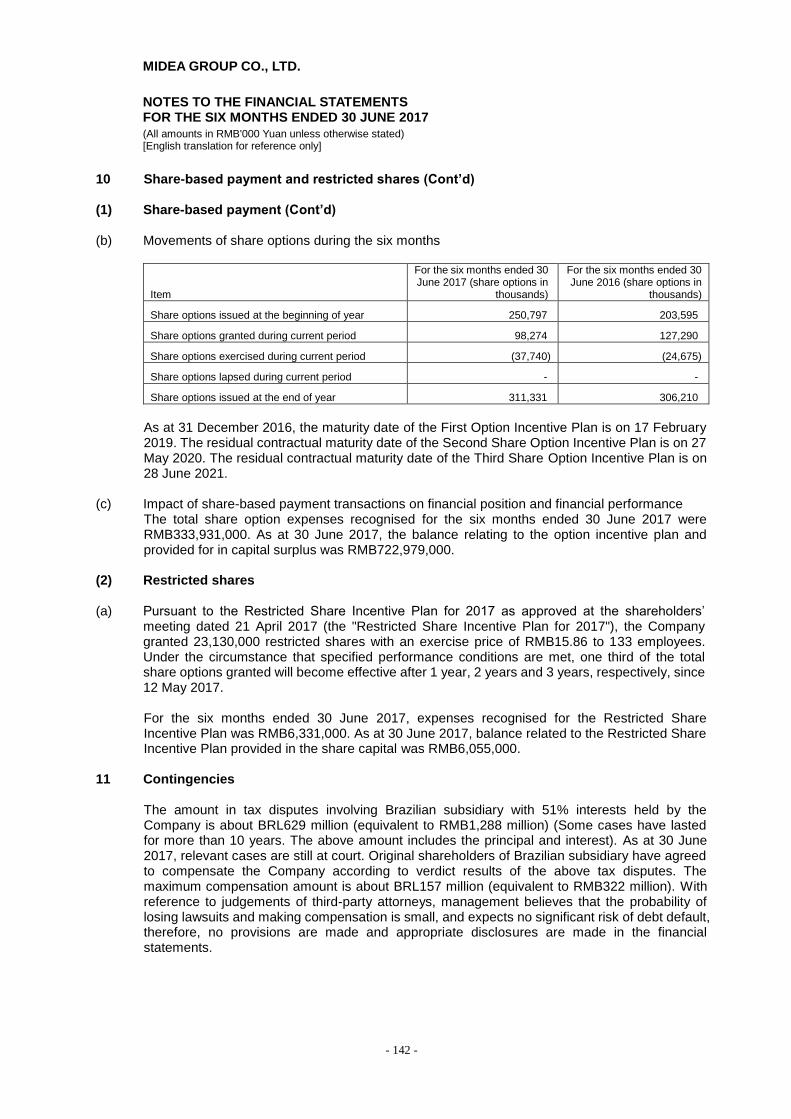
MIDEA GROUP CO., LTD.
NOTES TO THE FINANCIAL STATEMENTS FOR THE SIX MONTHS ENDED 30 JUNE 2017
(All amounts in RMB'000 Yuan unless otherwise stated) [English translation for reference only]
- 142 -
10 Share-based payment and restricted shares (Cont’d) (1) Share-based payment (Cont’d)
(b) Movements of share options during the six months
Item
For the six months ended 30 June 2017 (share options in
thousands)
For the six months ended 30 June 2016 (share options in
thousands)
Share options issued at the beginning of year 250,797 203,595
Share options granted during current period 98,274 127,290
Share options exercised during current period (37,740) (24,675)
Share options lapsed during current period - -
Share options issued at the end of year 311,331 306,210
As at 31 December 2016, the maturity date of the First Option Incentive Plan is on 17 February 2019. The residual contractual maturity date of the Second Share Option Incentive Plan is on 27 May 2020. The residual contractual maturity date of the Third Share Option Incentive Plan is on 28 June 2021.
(c) Impact of share-based payment transactions on financial position and financial performance
The total share option expenses recognised for the six months ended 30 June 2017 were RMB333,931,000. As at 30 June 2017, the balance relating to the option incentive plan and provided for in capital surplus was RMB722,979,000.
(2) Restricted shares (a) Pursuant to the Restricted Share Incentive Plan for 2017 as approved at the shareholders’
meeting dated 21 April 2017 (the "Restricted Share Incentive Plan for 2017"), the Company granted 23,130,000 restricted shares with an exercise price of RMB15.86 to 133 employees. Under the circumstance that specified performance conditions are met, one third of the total share options granted will become effective after 1 year, 2 years and 3 years, respectively, since 12 May 2017. For the six months ended 30 June 2017, expenses recognised for the Restricted Share Incentive Plan was RMB6,331,000. As at 30 June 2017, balance related to the Restricted Share Incentive Plan provided in the share capital was RMB6,055,000.
11 Contingencies
The amount in tax disputes involving Brazilian subsidiary with 51% interests held by the Company is about BRL629 million (equivalent to RMB1,288 million) (Some cases have lasted for more than 10 years. The above amount includes the principal and interest). As at 30 June 2017, relevant cases are still at court. Original shareholders of Brazilian subsidiary have agreed to compensate the Company according to verdict results of the above tax disputes. The maximum compensation amount is about BRL157 million (equivalent to RMB322 million). With reference to judgements of third-party attorneys, management believes that the probability of losing lawsuits and making compensation is small, and expects no significant risk of debt default, therefore, no provisions are made and appropriate disclosures are made in the financial statements.

MIDEA GROUP CO., LTD.
NOTES TO THE FINANCIAL STATEMENTS FOR THE SIX MONTHS ENDED 30 JUNE 2017
(All amounts in RMB'000 Yuan unless otherwise stated) [English translation for reference only]
- 143 -
12 Commitments
The Group has no significant commitments at the balance sheet date.
13 Subsequent events Nil
14 Financial risk
The Group is exposed to various financial risks in the ordinary course of business, mainly including:
Foreign exchange risk
Interest rate risk
Credit risk
Liquidity risk
The following mainly relates to the above risk exposures and relevant causes, objectives, policies and process of risk management and method of risk measurement, etc. The objective of the Group's risk management is to seek balance between risk and income, minimising the adverse impact of financial risks on the Group's financial performance. Pursuant to the risk management objective, the Group has made risk management policies to identify and analyse the risks it is exposed to and set appropriate risk resistant level and design relevant internal control procedures to monitor the Group’s risk level. The Group reviews regularly these risk management policies and relevant internal control systems to adapt to changes in market condition or its operating activities.
(1) Market risk
(a) Foreign exchange risk
The Group’s major operational activities are carried out in Mainland China and a majority of the transactions are denominated in RMB. The Group is exposed to foreign exchange risk arising from the recognised assets and liabilities, and future transactions denominated in foreign currencies, primarily with respect to US dollars. The Group’s finance department at its headquarters is responsible for monitoring the amount of assets and liabilities, and transactions denominated in foreign currencies to minimise the foreign exchange risk. Therefore, the Group may consider entering into forward exchange contracts or currency swap contracts to mitigate the foreign exchange risk.

MIDEA GROUP CO., LTD.
NOTES TO THE FINANCIAL STATEMENTS FOR THE SIX MONTHS ENDED 30 JUNE 2017
(All amounts in RMB'000 Yuan unless otherwise stated) [English translation for reference only]
- 144 -
14 Financial risk (Cont’d)
(1) Market risk (cont’d)
(b) Interest rate risk The Group's interest rate risk arises from interest bearing borrowings including long-term borrowings and debentures payable. Financial liabilities issued at floating rates expose the Group to cash flow interest rate risk. Financial liabilities issued at fixed rates expose the Group to fair value interest rate risk. The Group determines the relative proportions of its fixed rate and floating rate contracts depending on the prevailing market conditions. As at 30 June 2017, the long-term interest bearing borrowings at floating rates of the Group are RMB0. The Group’s finance department at its headquarters continuously monitors the interest rate position of the Group. Increases in interest rates will increase the cost of new borrowing and the interest expenses with respect to the Group’s outstanding floating rate borrowings, and therefore could have a material adverse effect on the Group’s financial position. The Group makes adjustments timely with reference to the latest market conditions and may enter into interest rate swap agreements to mitigate its exposure to interest rate risk. As at 30 June 2017, if interest rates on the floating rate borrowings had risen/fallen by 50 basis points while all other variables had been held constant, the Group’s net profit would have decreased/increased by approximately RMB0.
(2) Credit risk Credit risk is managed on the grouping basis. Credit risk mainly arise from cash at bank, deposits with central bank, deposits with banks and other financial institutions, notes receivable, accounts receivable, interest receivable, loans and advances, other receivables and other structural deposits in current assets. The Group expects that there is no significant credit risk associated with cash at bank, deposits with central bank and deposits with banks and other financial institutions since they are deposited at state-owned banks and other medium or large size listed banks. Management does not expect that there will be any significant losses from non-performance by these counterparties. In addition, the Group has policies to limit the credit exposure on notes receivable, accounts receivable, interest receivable, loans and advances, other receivables and other structural deposits in current assets. The Group assesses the credit quality of and sets credit limits on its customers by taking into account their financial position, the availability of guarantee from third parties, their credit history and other factors such as current market conditions. The credit history of the customers is regularly monitored by the Group. In respect of customers with a poor credit history, the Group will use written payment reminders, or shorten or cancel credit periods, to ensure the overall credit risk of the Group is limited to a controllable extent.
(3) Liquidity risk
Cash flow forecasting is performed by each subsidiary of the Group and aggregated by the Group’s finance department in its headquarters. The Group’s finance department at its headquarters monitors rolling forecasts of the Group's short-term and long-term liquidity requirements to ensure it has sufficient cash and securities that are readily convertible to cash to meet operational needs, while maintaining sufficient headroom on its undrawn committed borrowing facilities from major financial institutions so that the Group does not breach borrowing limits or covenants on any of its borrowing facilities to meet the short-term and long-term liquidity requirements.

MIDEA GROUP CO., LTD.
NOTES TO THE FINANCIAL STATEMENTS FOR THE SIX MONTHS ENDED 30 JUNE 2017
(All amounts in RMB'000 Yuan unless otherwise stated) [English translation for reference only]
- 145 -
14 Financial risk (Cont’d)
(3) Liquidity risk (Cont’d) The financial liabilities of the Group at the balance sheet date are analysed by their maturity date below at their undiscounted contractual cash flows:
Ending balance Within 1 year 1 to 2 years 2 to 5 years Over 5 years Total
Short-term borrowings (including interest) 32,393,436 - - - 32,393,436
Notes payable 22,034,312 - - - 22,034,312
Accounts payable 32,298,812 - - - 32,298,812
Interest payable 35,564 - - - 35,564
Dividends payable 277,840 - - - 277,840
Other payables 2,262,085 - - - 2,262,085
Borrowings from central bank - - - - -
Customer deposits and deposits from banks and other financial institutions 110,016 - - - 110,016
Derivative financial liabilities 43,734 - - - 43,734
Financial assets sold under repurchase agreements - - - - -
Current portion of non-current liabilities 77,711 - - - 77,711
Other current liabilities 26,604,521 - - - 26,604,521
Long-term borrowings (including interest) 35,310 2,134,041 2,018,847 2,125 4,190,323
Debentures payable 113,492 4,818,240 - - 4,931,732
Sub-total 116,286,833 6,952,281 2,018,847 2,125 125,260,086
15 Fair value estimates
The level in which fair value measurement is categorised is determined by the level of the fair value hierarchy of the lowest level input that is significant to the entire fair value measurement: Level 1: Quoted prices (unadjusted) in active markets for identical assets or liabilities. Level 2: Inputs other than quoted prices included within Level 1 that are observable for the asset or liability, either directly or indirectly. Level 3: Unobservable inputs for the asset or liability.

MIDEA GROUP CO., LTD.
NOTES TO THE FINANCIAL STATEMENTS FOR THE SIX MONTHS ENDED 30 JUNE 2017
(All amounts in RMB'000 Yuan unless otherwise stated) [English translation for reference only]
- 146 -
15 Fair value estimates (Cont’d)
(1) Assets and liabilities measured at fair value on a recurring basis As at 30 June 2017, the assets and liabilities measured at fair value on a recurring basis by the above three levels are analysed below:
Item
Fair value at the end of period
Level 1 Level 2 Level 3 Total
Financial assets at fair value through profit or loss - derivative financial assets - 518,481 - 518,481
Available-for-sale financial assets - other current assets - wealth management products - - 30,514,012 30,514,012
Available-for-sale financial assets - other non-current assets - wealth management products and asset management plans - - 500,000 500,000
Available-for-sale financial assets 42,790 - 25,025 67,815
Total assets 42,790 518,481 31,039,037 31,600,308
Financial liabilities at fair value through profit or loss - derivative financial liabilities - 43,975 - 43,975
Total liabilities - 43,975 - 43,975
The Group takes the date on which events causing the transfers between the levels take place as the timing specific for recognising the transfers. There was no significant transfer of fair value measurement level of the above financial instruments. The fair value of financial instruments traded in an active market is determined at the quoted market price; and the fair value of those not traded in an active market is determined by the Group using valuation technique. The valuation models used mainly primarily comprise discounted cash flow model and market comparable corporate model. Inputs of valuation technique mainly comprise risk-free interest rate, estimated interest rate and estimated annual yield. There was no change in the valuation technique for the fair value of the Group’s financial instruments in current year.
Item - Available-for-sale equity
instruments
Opening balance 30,109,067
Purchases 17,396,174
Sales (17,163,908)
Total gains of current period
Investment income recognised in the income statement 628,641
Gains recognised in other comprehensive income 69,063
Ending balance 31,039,037
There was no change in the valuation technique for the fair value of the Group’s financial instruments in current year.

MIDEA GROUP CO., LTD.
NOTES TO THE FINANCIAL STATEMENTS FOR THE SIX MONTHS ENDED 30 JUNE 2017
(All amounts in RMB'000 Yuan unless otherwise stated) [English translation for reference only]
- 147 -
15 Fair value estimates (Cont’d)
(1) Assets measured at fair value on a recurring basis (Cont'd) Information about the Level 3 fair value measurement is as follows:
30 June 2017
Fair value Valuation technique
Inputs
Name Range Relationship
with fair value Observable/un
observable Available-for-sale financial
assets -
Other current assets 30,514,012 Discounted cash
flows Estimated
annual yield 2.2% to 7.2% Positive Unobservable
Other non-current assets 500,000 Discounted cash
flows Estimated
annual yield 4% to 7.35% Positive Unobservable Available-for-sale financial
assets 25,025 Income approach - - - -
31,039,037
Assets and liabilities subject to level 2 fair value measurement are mainly forward exchange contracts and are evaluated by income approach.
(2) Assets and liabilities not measured at fair value but disclosed The Group's financial assets and financial liabilities measured at amortised cost mainly include: cash at bank and on hand, deposits with central bank, deposits with banks and other financial institutions, notes receivable, accounts receivable, loans and advances, other receivables, other current assets (excluding those mentioned in Note 15(1)), accounts payable, notes payable, short-term borrowings, long-term borrowings, customer deposits and deposits from banks and other financial institutions, financial assets sold under repurchase agreements, interest payable and other current liabilities, etc. Carrying amounts of the Group’s financial assets and financial liabilities as at 30 June 2017 and 31 December 2016 approximated their fair value.
16 Capital management
The Group’s capital management policies aim to safeguard the Group’s ability to continue as a going concern in order to provide returns for shareholders and benefits for other stakeholders, and to maintain an optimal capital structure to reduce the cost of capital. In order to maintain or adjust the capital structure, the Group may adjust the amount of dividends paid to shareholders, refund capital to shareholders, issue new shares or sell assets to reduce debts. The Group is not subject to external mandatory capital requirements, and monitors capital structure on the basis of gearing ratio (total assets divide total liabilities). As at 30 June 2017 and 31 December 2016, the Group's gearing ratio is as follows:
Item Ending balance Opening balance
Total liabilities 156,021,600 101,624,015
Total assets 231,016,492 170,600,711
Gearing ratio 67.54% 59.57%

MIDEA GROUP CO., LTD.
NOTES TO THE FINANCIAL STATEMENTS FOR THE SIX MONTHS ENDED 30 JUNE 2017
(All amounts in RMB'000 Yuan unless otherwise stated) [English translation for reference only]
- 148 -
17 Notes to the parent company’s financial statements (1) Other receivables
Item Ending balance Opening balance
Current accounts 14,686,555 12,584,623
Guaranty 1,124 60,707
Sub-total 14,687,679 12,645,330
Less: Provision for bad debts (884) (738)
Total 14,686,795 12,644,592
(a) Other receivables are analysed by ageing as follows:
Ageing Ending balance Opening balance
Within 1 year (inclusive) 8,524,117 6,088,475
1 to 2 years (inclusive) 6,163,562 6,556,855
Sub-total 14,687,679 12,645,330
Less: Provision for bad debts (884) (738)
Total 14,686,795 12,644,592
(b) Other receivables are analysed by categories as follows:
Categories
Ending balance Opening balance
Book balance Provision for bad debts Book balance Provision for bad debts
Amount % of total
balance Amount Ratio Amount Ratio Amount Ratio
Provision for bad debts provided on the individual basis 14,682,836 99.97% - - 12,633,325 99.91% - -
Provision for bad debts provided on the grouping basis 4,843 0.03% 884 18.25% 12,005 0.09% 738 6.15%
Total 14,687,679 100.00% 884 0.01% 12,645,330 100.00% 738 0.01%
(c) Other receivables that the related provision for bad debts is provided on grouping basis using the
ageing analysis method are analysed as follows:
Ageing
Ending balance Opening balance
Book balance Provision for bad debts
Book balance Provision for bad debts
Amount Amount Ratio Amount Amount Ratio
Within 1 year 1,361 67 5.00% 9,245 462 5.00%
1 to 2 years 1,140 114 10.00% 2,760 276 10.00%
2 to 3 years 2,342 703 30.00% - - -
Sub-total 4,843 884 18.25% 12,005 738 6.15%

MIDEA GROUP CO., LTD.
NOTES TO THE FINANCIAL STATEMENTS FOR THE SIX MONTHS ENDED 30 JUNE 2017
(All amounts in RMB'000 Yuan unless otherwise stated) [English translation for reference only]
- 149 -
17 Notes to the parent company’s financial statements (Cont’d) (1) Other receivables (Cont’d)
(d) As at 30 June 2017, other receivables from the top five debtors are analysed as below:
Name of the Company Nature Book balance Ageing % of total balance
Provision for bad debts
1st
Temporary payments receivable 6,157,095 Within 2 year 42% -
2nd
Temporary payments receivable 1,864,680 Within 1 year 13% -
3rd
Temporary payments receivable 88,946 Within 1 year 1% -
4th
Temporary payments receivable 75,544 Within 1 year 1% -
5th
Temporary payments receivable 62,759 Within 1 year 0% -
Sub-total 8,249,024 56% -
(2) Long-term equity investments
Long-term equity investments are classified as follows:
Item Ending balance Opening balance
Subsidiaries (a) 22,476,789 21,716,662
Associates (b) 1,470,881 1,342,318
Sub-total 23,947,670 23,058,980
Less: Provision for impairment - -
Total 23,947,670 23,058,980

MIDEA GROUP CO., LTD.
NOTES TO THE FINANCIAL STATEMENTS FOR THE SIX MONTHS ENDED 30 JUNE 2017 (All amounts in RMB'000 Yuan unless otherwise stated) [English translation for reference only]
- 150 -
17 Notes to the parent company’s financial statements (Cont’d) (2) Long-term equity investments (Cont’d) (a) Subsidiaries
Investee Opening balance
Movements in the current year
Ending balance Cash dividends declared
in the current year Additional investment Changes arising from share-based payment Decrease in investment Absorption and merger Others
Wuxi Little Swan Company Limited 2,699,321 - 21,150 - - - 2,720,471 179,211
Midea Group Finance Co., Ltd. 1,431,886 - 2,783 - - - 1,434,669 312,545
Hefei Midea Heating & Ventilation Equipment Co., Ltd. 1,052,268 - 2,198 - - - 1,054,466 872,573
Hubei Midea Refrigerator Co., Ltd. 835,994 - 1,482 - - - 837,476 -
Anhui GMCC Precision Manufacturing Co., Ltd. 808,032 - 3,336 - - - 811,368 336,128
Foshan Shunde Home Appliance Industrial Co., Ltd., 2,449,000 500,000 - - - - 2,949,000 -
Wuhu Meizhi Air-Conditioning Equipment Co., Ltd. 736,448 - 3,670 - - - 740,118 -
Guangdong Midea Refrigeration Equipment Co., Ltd. 955,245 - 97,935 - - - 1,053,180 446,123
Annto Logistics Co., Ltd. 474,391 - 3,241 - - - 477,632 168,513
Guangdong Midea Commercial Air Conditioning Equipment Co., Ltd. 569,430 - - - - - 569,430 22,162
Ningbo Midea United Material Supply Co., Ltd. 484,506 - 1,539 - - - 486,045 486,961
Guangzhou Hualing Refrigeration Equipment Co., Ltd. 496,014 - 3,775 - - - 499,789 -
Guangzhou Midea Hualing Refrigerator Co., Ltd. 423,948 - 1,062 - - - 425,010 -
Hefei Midea Refrigerator Co., Ltd. 453,337 - 10,928 - - - 464,265 -
Guangdong Midea Wuhu Refrigeration Equipment Co., Ltd. 350,092 - 1,266 - - - 351,358 88,740
Anhui GMCC Refrigeration Equipment Co., Ltd. 316,871 - 2,405 - - - 319,276 -
Guangdong Midea Heating & Ventilation Equipment Co., Ltd. 344,730 - 22,851 - - - 367,581 736,698
Midea Electric Investment (BVI) Limited 236,543 - - - - - 236,543 -
Midea International Holding Co., Ltd. 176,974 - - - - - 176,974 -
Guangzhou Hualing Refrigeration Equipment Co., Ltd. 136,745 - - - - - 136,745 -
Foshan Midea Carrier Refrigeration Equipment Co., Ltd. 128,733 - 2,633 - - - 131,366 -
Hefei Midea Material Supplies Co., Ltd. 117,000 - - - - - 117,000 58
Midea Group E-commerce Co., Ltd. 115,984 - 6,599 - - - 122,583 -

MIDEA GROUP CO., LTD.
NOTES TO THE FINANCIAL STATEMENTS FOR THE SIX MONTHS ENDED 30 JUNE 2017 (All amounts in RMB'000 Yuan unless otherwise stated) [English translation for reference only]
- 151 -
17 Notes to the parent company’s financial statements (Cont’d) (2) Long-term equity investments (Cont’d) (a) Subsidiaries (Cont'd)
Investee Opening balance
Movements in the current year
Ending balance Cash dividends declared
in the current year Additional investment Changes arising from share-based payment Decrease in investment Absorption and merger Others
Midea Smart Home Technology Co., Ltd. 20,000 - - - - - 20,000 -
Guangdong GMCC Refrigeration Equipment Co., Ltd. 135,332 - 10,615 - - - 145,947 73,057
Hefei Hualing Co., Ltd. 107,996 - 7,975 - - - 115,971 -
Midea Wuhan Refrigeration Equipments Co., Ltd. 79,331 - 4,090 - - - 83,421 189,988
Foshan City Midea Material Supplies Co., Ltd. 54,000 - - - - - 54,000 5,204
Zhejiang GMCC Compressor Co., Ltd. 52,820 - 1,588 - - - 54,408 380,457
Chongqing Midea Refrigeration Equipment Co., Ltd. 59,614 - 3,324 - - - 62,938 -
Wuhu Little Swan Refrigeration Equipment Co., Ltd. 47,500 - - - - - 47,500 -
Guangdong GMCC Precision Manufacturing Co., Ltd. 38,438 - 45 - - - 38,483 34,928
Foshan City Midea Air-conditioners Industrial Investment Co., Ltd. 36,062 - - - - - 36,062 -
Chongqing Midea General Refrigeration Equipment Co., Ltd. 40,588 - 3,534 - - - 44,122 -
Midea Finance Holding (Shenzhen) Co., Ltd. 50,000 - - - - - 50,000 -
Foshan City Shunde District Midea Electronic Technology Co., Ltd. 16,303 - 1,920 - - - 18,223 -
Midea Holdings (BVI) Ltd. 82 - - - - - 82 -
Handan Midea Refrigeration Equipment Co., Ltd. 131,079 - 3,310 - - - 134,389 -
Midea Group Payment Technology Co., Ltd. 100,213 - 106 (100,319) - - - 41
Midea Innovation Investment Co., Ltd. 35,000 - - - - - 35,000 -
Guangdong Midea Microwave Electric Manufacturing Co., Ltd. 1,880,041 - - - - - 1,880,041 -
Wuhu Midea Kitchen Appliances Manufacturing Co., Ltd. 20,000 - 120 - - - 20,120 -
Jiangsu Midea Chunhua Electric Co., Ltd. 96,900 - 2,629 - - - 99,529 -
Guangdong Witt Vacuum Electronics Manufacturing Co., Ltd. 196,427 - 308 - - - 196,735 104,603
Guangdong Midea Life Electric Appliance Manufacturing Co., Ltd. 1,003,673 - 11,382 - - - 1,015,055 -
Wuhu Midea Electric Appliance Manufacturing Co., Ltd. 56,223 - - - - - 56,223 89,832

MIDEA GROUP CO., LTD.
NOTES TO THE FINANCIAL STATEMENTS FOR THE SIX MONTHS ENDED 30 JUNE 2017 (All amounts in RMB'000 Yuan unless otherwise stated) [English translation for reference only]
- 152 -
17 Notes to the parent company’s financial statements (Cont’d) (2) Long-term equity investments (Cont’d) (a) Subsidiaries (Cont'd)
Investee Opening balance
Movements in the current year
Ending balance Cash dividends declared
in the current year Additional investment Changes arising from share-based payment Decrease in investment Absorption and merger Others
Foshan Shunde Water machine manufacturing Co., Ltd. 36,658 - 2,078 - - - 38,736 -
Foshan Midea Qinghu purification equipment Co., Ltd. 59,386 - 1,908 - - - 61,294 12,000
Guangdong Midea Intelligent Technology Co., Ltd. 10,000 - - - - - 10,000 -
Wuhan Midea electric appliance manufacturing co., LTD 80,000 - - - - - 80,000 -
Guangdong Midea Environmental Electric Appliance Manufacturing Co., Ltd. 307,689 - 11,144 - - - 318,833 -
Foshan Shunde Midea Washing Appliance Manufacturing Co., Ltd. 414,887 - 5,474 - - - 420,361 297,734
Guangdong Midea Kitchen & Bathroom Electric Manufacturing 80,664 - 438 - - - 81,102 34,295
Wuhu Midea Kitchen & Bathroom Electric Manufacturing 79,319 - 12,382 - - - 91,701 611,481
Foshan Shunde Meiying Enterprise Management Services Co., Ltd. 13,000 - - - - - 13,000 -
Jiangxi Midea Guiya lighting co., LTD 164,830 - 2,592 - - - 167,422 -
Guangdong Midea Household Appliances Import and Export Trade Co., Ltd. 53,207 - - - - - 53,207 -
JV MIDEA–HORIZONT Co., Ltd. 41,357 - - - - - 41,357 877
Guangdong MIDEA-YASKAWA Service Robotics Ltd. 12,020 - - - - - 12,020 -
Foshan Shunde District Midea Petty Loan Co., Ltd. 68,344 - 772 - - - 69,116 -
Guangdong Midea Electric Co., Ltd. - 1,000 - - - - 1,000 -
Guangdong Midea Intelligent Robotics Co., Ltd. - 30,000 - - - - 30,000 -
Guangdong Midea Advanced Technologies Co., Ltd. - 50,000 - - - - 50,000 -
Midea Petty Loan Co., Ltd. 55,173 - 142 - - - 55,315 -
Midea Robotics Industry Development Co., Ltd. 7,000 - - - - - 7,000 -
Wuhu Midea Household Consultation Service Co., Ltd. 101,542 - 106 - - - 101,648 -
Hefei Midea Washing Machine Co., Ltd. 78,042 - 2,611 - - - 80,653 -
Chinese Refrigerator Industry Co., Ltd. 2,430 - - - - - 2,430 -
Total 21,716,662 581,000 279,446 (100,319) - - 22,476,789 5,484,209

MIDEA GROUP CO., LTD.
NOTES TO THE FINANCIAL STATEMENTS FOR THE SIX MONTHS ENDED 30 JUNE 2017 (All amounts in RMB'000 Yuan unless otherwise stated) [English translation for reference only]
- 153 -
17 Notes to the parent company’s financial statements (Cont’d)
(2) Long-term equity investments (Cont’d) (b) Associates
Investee Opening balance
Current year movement
Ending balance
Provision for impairment loss at the end of year
Additional investment
Decrease in investment
Share of net profit/(loss) under equity
method
Adjustments of other
comprehensive income
Other changes in
equity
Cash dividends or
profits declared
Provision for impairment
loss Others
Associates -
Foshan Shunde Rural Commercial Bank Co., Ltd. 971,931 - - 207,822 (6,624) - (74,383) - - 1,098,746 -
Hefei Royalstar Motor Co., Ltd. 102,576 - - 551 - - - - - 103,127 -
GE Fund Management Co., Ltd. 43,035 - - 7,371 - - - - - 50,406 -
Foshan Micro Midea Filter MFG Co., Ltd. 36,779 - - 2,552 - - (8,000) - - 31,331 -
Anhui Efort Intelligent Equipment Co., Ltd. 178,558 - - (2,833) 3,198 (61) - - - 178,862 -
Guangdong YASKAWA-MIDEA Industrial Robotics System Ltd. 9,439 - - (1,030) - - - - - 8,409 -
Total 1,342,318 - - 214,433 (3,426) (61) (82,383) - - 1,470,881 -

MIDEA GROUP CO., LTD.
NOTES TO THE FINANCIAL STATEMENTS FOR THE SIX MONTHS ENDED 30 JUNE 2017 (All amounts in RMB'000 Yuan unless otherwise stated) [English translation for reference only]
- 154 -
17 Notes to the parent company’s financial statements (Cont’d)
(3) Revenue Revenue mainly comprises other operating income including the brand royalty income, rental income and management fee income, etc. obtained by the parent company from the subsidiaries.
(4) Investment income
Item Current figure Comparative figure
Income from long-term equity investment under cost method 5,484,209 7,105,789
Investment income from wealth management products purchased from financial institutions 426,915 425,882
Investment income from long-term equity investment under equity method 214,433 131,111
Losses on disposal of long-term equity investment (319) (104,071)
Income earned during the holding period of available-for-sale financial assets - -
Total 6,125,238 7,558,711
There is no significant restriction on repatriation of the Company's investment income.
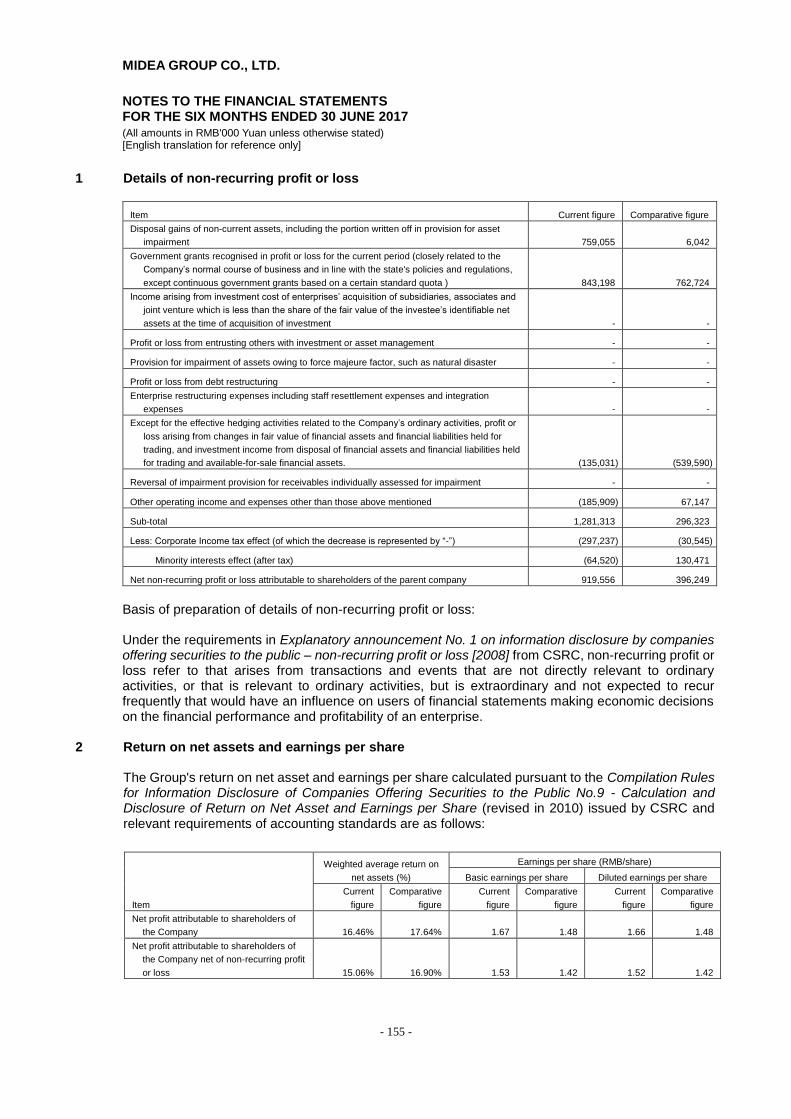
MIDEA GROUP CO., LTD.
NOTES TO THE FINANCIAL STATEMENTS FOR THE SIX MONTHS ENDED 30 JUNE 2017
(All amounts in RMB'000 Yuan unless otherwise stated) [English translation for reference only]
- 155 -
1 Details of non-recurring profit or loss
Item Current figure Comparative figure
Disposal gains of non-current assets, including the portion written off in provision for asset
impairment 759,055 6,042
Government grants recognised in profit or loss for the current period (closely related to the
Company’s normal course of business and in line with the state's policies and regulations,
except continuous government grants based on a certain standard quota ) 843,198 762,724
Income arising from investment cost of enterprises’ acquisition of subsidiaries, associates and
joint venture which is less than the share of the fair value of the investee’s identifiable net
assets at the time of acquisition of investment - -
Profit or loss from entrusting others with investment or asset management - -
Provision for impairment of assets owing to force majeure factor, such as natural disaster - -
Profit or loss from debt restructuring - -
Enterprise restructuring expenses including staff resettlement expenses and integration
expenses - -
Except for the effective hedging activities related to the Company’s ordinary activities, profit or
loss arising from changes in fair value of financial assets and financial liabilities held for
trading, and investment income from disposal of financial assets and financial liabilities held
for trading and available-for-sale financial assets. (135,031) (539,590)
Reversal of impairment provision for receivables individually assessed for impairment - -
Other operating income and expenses other than those above mentioned (185,909) 67,147
Sub-total 1,281,313 296,323
Less: Corporate Income tax effect (of which the decrease is represented by “-”) (297,237) (30,545)
Minority interests effect (after tax) (64,520) 130,471
Net non-recurring profit or loss attributable to shareholders of the parent company 919,556 396,249
Basis of preparation of details of non-recurring profit or loss: Under the requirements in Explanatory announcement No. 1 on information disclosure by companies offering securities to the public – non-recurring profit or loss [2008] from CSRC, non-recurring profit or loss refer to that arises from transactions and events that are not directly relevant to ordinary activities, or that is relevant to ordinary activities, but is extraordinary and not expected to recur frequently that would have an influence on users of financial statements making economic decisions on the financial performance and profitability of an enterprise.
2 Return on net assets and earnings per share
The Group's return on net asset and earnings per share calculated pursuant to the Compilation Rules for Information Disclosure of Companies Offering Securities to the Public No.9 - Calculation and Disclosure of Return on Net Asset and Earnings per Share (revised in 2010) issued by CSRC and relevant requirements of accounting standards are as follows:
Item
Weighted average return on
net assets (%)
Earnings per share (RMB/share)
Basic earnings per share Diluted earnings per share
Current
figure
Comparative
figure
Current
figure
Comparative
figure
Current
figure
Comparative
figure
Net profit attributable to shareholders of
the Company 16.46% 17.64% 1.67 1.48 1.66 1.48
Net profit attributable to shareholders of
the Company net of non-recurring profit
or loss 15.06% 16.90% 1.53 1.42 1.52 1.42

Semi-annual Report of Midea Group Co., Ltd. For the six months ended 30 June 2017
- 156 -
Section 10 Catalog of reference documentation
1. Original copy of Interim Report of Midea Group Co., Ltd. for the six months ended 30 June 2017 with
signature of legal representative of the Company;
2. Financial statements with signature and stamp of legal representative, financial principal and person in
charge of accounting department;
3. Original copy of all the Company documentation and announcements publicly disclosed in assigned
information disclosure journals during the reporting period.
4. Electronic document of interim report of the Company for the six months ended 30 June 2017 on
http://www.cninfo.com.cn
MIDEA GROUP CO., LTD.
Legal representative:
Fang hongbo
31 August 2017