middle market m&a: update and key areas of due...
TRANSCRIPT
April 26, 2016
Middle Market M&A: Update and Key Areas of
Due Diligence
1
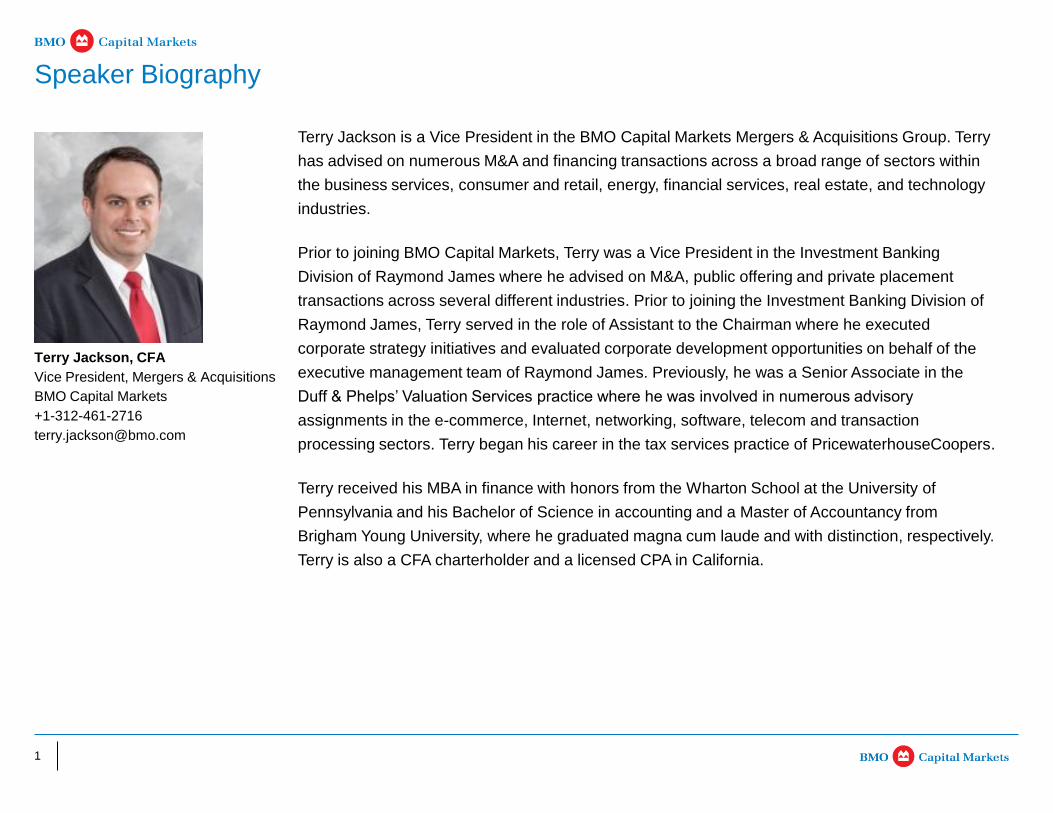
Terry Jackson is a Vice President in the BMO Capital Markets Mergers & Acquisitions Group. Terry
has advised on numerous M&A and financing transactions across a broad range of sectors within
the business services, consumer and retail, energy, financial services, real estate, and technology
industries.
Prior to joining BMO Capital Markets, Terry was a Vice President in the Investment Banking
Division of Raymond James where he advised on M&A, public offering and private placement
transactions across several different industries. Prior to joining the Investment Banking Division of
Raymond James, Terry served in the role of Assistant to the Chairman where he executed
corporate strategy initiatives and evaluated corporate development opportunities on behalf of the
executive management team of Raymond James. Previously, he was a Senior Associate in the
Duff & Phelps’ Valuation Services practice where he was involved in numerous advisory
assignments in the e-commerce, Internet, networking, software, telecom and transaction
processing sectors. Terry began his career in the tax services practice of PricewaterhouseCoopers.
Terry received his MBA in finance with honors from the Wharton School at the University of
Pennsylvania and his Bachelor of Science in accounting and a Master of Accountancy from
Brigham Young University, where he graduated magna cum laude and with distinction, respectively.
Terry is also a CFA charterholder and a licensed CPA in California.
Speaker Biography
Terry Jackson, CFA
Vice President, Mergers & Acquisitions
BMO Capital Markets
+1-312-461-2716
2
MIDDLE MARKET M&A UPDATE
Section 1: Middle Market M&A Update
Section 1 Middle Market M&A Update
Section 2 Middle Market M&A 101
Section 3 Middle Market M&A Key Areas of Due Diligence
Appendix A - C
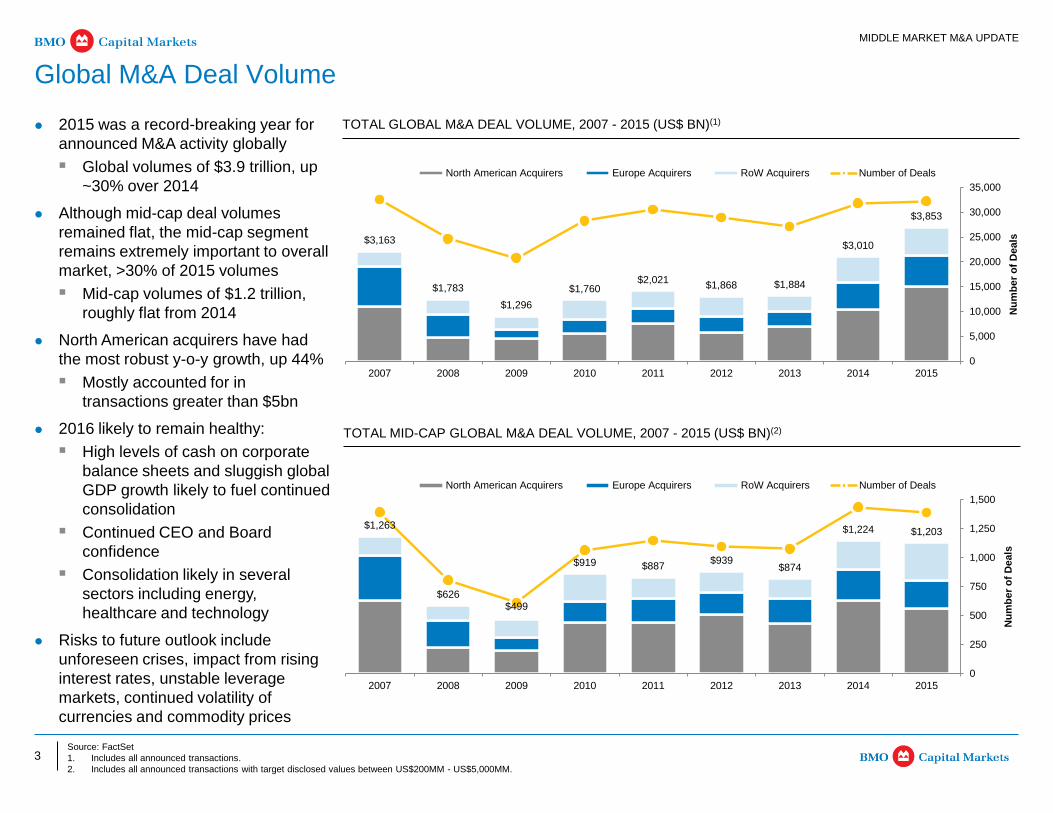
3 Source: FactSet
1. Includes all announced transactions.
2. Includes all announced transactions with target disclosed values between US$200MM - US$5,000MM.
MIDDLE MARKET M&A UPDATE
Global M&A Deal Volume
2015 was a record-breaking year for
announced M&A activity globally
Global volumes of $3.9 trillion, up
~30% over 2014
Although mid-cap deal volumes
remained flat, the mid-cap segment
remains extremely important to overall
market, >30% of 2015 volumes
Mid-cap volumes of $1.2 trillion,
roughly flat from 2014
North American acquirers have had
the most robust y-o-y growth, up 44%
Mostly accounted for in
transactions greater than $5bn
2016 likely to remain healthy:
High levels of cash on corporate
balance sheets and sluggish global
GDP growth likely to fuel continued
consolidation
Continued CEO and Board
confidence
Consolidation likely in several
sectors including energy,
healthcare and technology
Risks to future outlook include
unforeseen crises, impact from rising
interest rates, unstable leverage
markets, continued volatility of
currencies and commodity prices
TOTAL GLOBAL M&A DEAL VOLUME, 2007 - 2015 (US$ BN)(1)
TOTAL MID-CAP GLOBAL M&A DEAL VOLUME, 2007 - 2015 (US$ BN)(2)
$1,263
$626$499
$919 $887$939
$874
$1,224 $1,203
0
250
500
750
1,000
1,250
1,500
2007 2008 2009 2010 2011 2012 2013 2014 2015
Nu
mb
er
of
Deals
North American Acquirers Europe Acquirers RoW Acquirers Number of Deals
$3,163
$1,783
$1,296
$1,760$2,021
$1,868 $1,884
$3,010
$3,853
0
5,000
10,000
15,000
20,000
25,000
30,000
35,000
2007 2008 2009 2010 2011 2012 2013 2014 2015
Nu
mb
er
of
Deals
North American Acquirers Europe Acquirers RoW Acquirers Number of Deals

4
19.9%
16.4%
13.1%9.6%
12.7%
11.4%
5.5%
11.4%
Business Services & Media
Industrial
Energy & Power
FIG
Food & Consumer
Healthcare
Real Estate
Tech
Source: FactSet
1. Includes all completed transactions with U.S. targets or acquirors involved and target disclosed values greater than $1 million.
2. Includes all completed transactions with a U.S. acquiror and target disclosed values between US$200MM - US$5,000MM.
MIDDLE MARKET M&A UPDATE
U.S. M&A Market Snapshot
15.9%
20.1%
12.9%9.6%
9.2%
12.3%
7.6%
12.4%
U.S. MID-CAP M&A VOLUME COMPOSITION BY SECTOR, 2014 AND 2015(2)
Broad-based deal growth across all
sectors
Relatively consistent deal volume
composition over the last few years
Top three sectors in terms of total
deal volume were Industrial,
Business Services & Media and
Energy & Power
2014 2015
TOTAL U.S. M&A DEAL VOLUME, 2007 - 2015 (US$ BN)(1)
$1,617
$1,225
$819$975$929
$778$602
$1,083
$1,694
201520142013201220112010200920082007
United States Cross-border: U.S. Acquiror Cross-border: Non-U.S. Acquiror 2015 completed deal volume
approaching near peak levels
U.S. completed deal volume of
$1.6 trillion, up 32% over 2014
Significant increase in cross-border
activity
Total cross-border volume of
$557 billion, up 152% from 2014
Highest transaction volume of
foreign acquirors for U.S.
targets, with $327 billion in
volume, up 179% from 2014
5
8.0x
10.0x
12.0x
14.0x
16.0x
18.0x
20.0x
Ja
n-0
7A
pr-
07
Ju
l-0
7O
ct-
07
De
c-0
7M
ar-
08
Ju
n-0
8S
ep-0
8D
ec-0
8M
ar-
09
Ju
n-0
9S
ep-0
9D
ec-0
9M
ar-
10
Ju
n-1
0S
ep-1
0D
ec-1
0M
ar-
11
Jun-1
1S
ep-1
1D
ec-1
1M
ar-
12
Ju
n-1
2S
ep-1
2D
ec-1
2M
ar-
13
Ju
n-1
3S
ep-1
3D
ec-1
3M
ar-
14
Ju
n-1
4S
ep-1
4D
ec-1
4M
ar-
15
Ju
n-1
5S
ep-1
5D
ec-1
5
S&P 500 LTM P/E Multiple
0.0
1.0
2.0
3.0
4.0
5.0
6.0
Jan-0
7A
pr-
07
Ju
l-0
7O
ct-
07
De
c-0
7M
ar-
08
Ju
n-0
8S
ep-0
8D
ec-0
8M
ar-
09
Jun-0
9S
ep-0
9D
ec-0
9M
ar-
10
Ju
n-1
0S
ep-1
0D
ec-1
0M
ar-
11
Ju
n-1
1S
ep-1
1D
ec-1
1M
ar-
12
Ju
n-1
2S
ep-1
2D
ec-1
2M
ar-
13
Ju
n-1
3S
ep-1
3D
ec-1
3M
ar-
14
Jun-1
4S
ep-1
4D
ec-1
4M
ar-
15
Ju
n-1
5S
ep-1
5D
ec-1
5
US Benchmark Bond - 10 Year LIBOR - USD 3 month
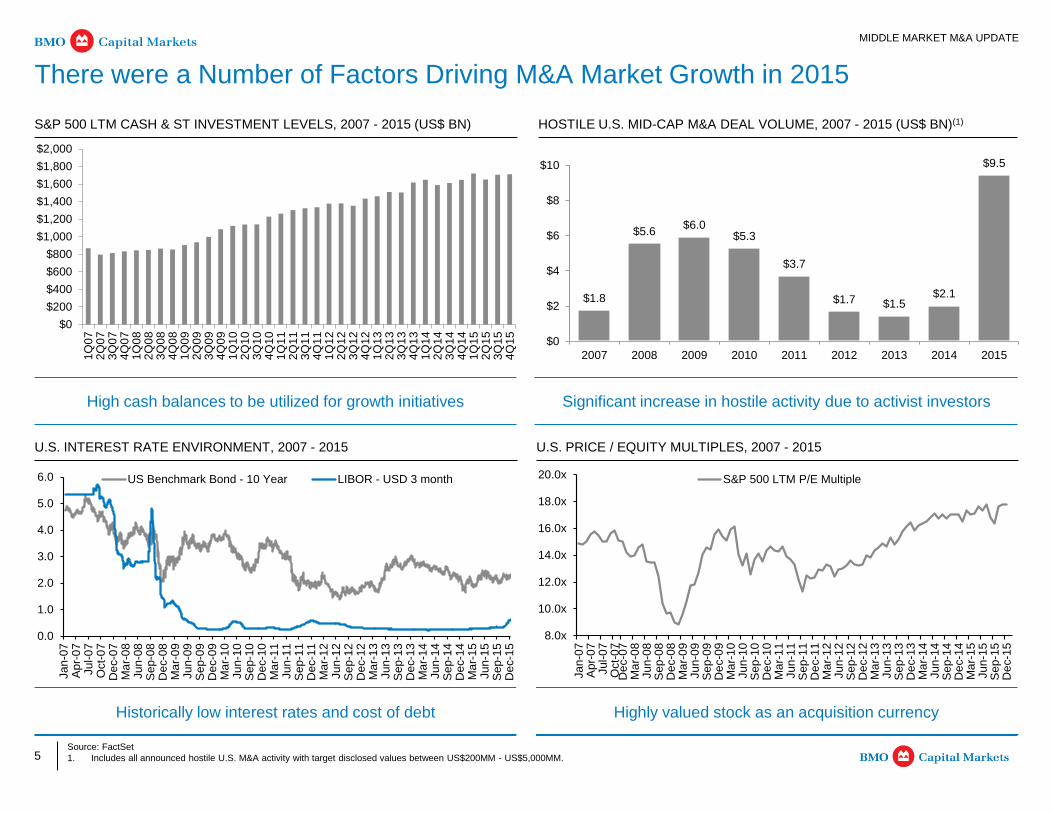
Significant increase in hostile activity due to activist investors High cash balances to be utilized for growth initiatives
U.S. INTEREST RATE ENVIRONMENT, 2007 - 2015 U.S. PRICE / EQUITY MULTIPLES, 2007 - 2015
Highly valued stock as an acquisition currency Historically low interest rates and cost of debt
$0
$200
$400
$600
$800
$1,000
$1,200
$1,400
$1,600
$1,800
$2,000
4Q
15
3Q
15
2Q
15
1Q
15
4Q
14
3Q
14
2Q
14
1Q
14
4Q
13
3Q
13
2Q
13
1Q
13
4Q
12
3Q
12
2Q
12
1Q
12
4Q
11
3Q
11
2Q
11
1Q
11
4Q
10
3Q
10
2Q
10
1Q
10
4Q
09
3Q
09
2Q
09
1Q
09
4Q
08
3Q
08
2Q
08
1Q
08
4Q
07
3Q
07
2Q
07
1Q
07
MIDDLE MARKET M&A UPDATE
There were a Number of Factors Driving M&A Market Growth in 2015
Source: FactSet
1. Includes all announced hostile U.S. M&A activity with target disclosed values between US$200MM - US$5,000MM.
S&P 500 LTM CASH & ST INVESTMENT LEVELS, 2007 - 2015 (US$ BN) HOSTILE U.S. MID-CAP M&A DEAL VOLUME, 2007 - 2015 (US$ BN)(1)
$1.8
$5.6$6.0
$5.3
$3.7
$1.7 $1.5$2.1
$9.5
$0
$2
$4
$6
$8
$10
2007 2008 2009 2010 2011 2012 2013 2014 2015
6
6.0x
7.0x
8.0x
9.0x
10.0x
11.0x
12.0x
13.0x
14.0x
Q1 Q2 Q3 Q4 Q1 Q2 Q3 Q4
2014 2015
Financial Buyer Strategic Buyer
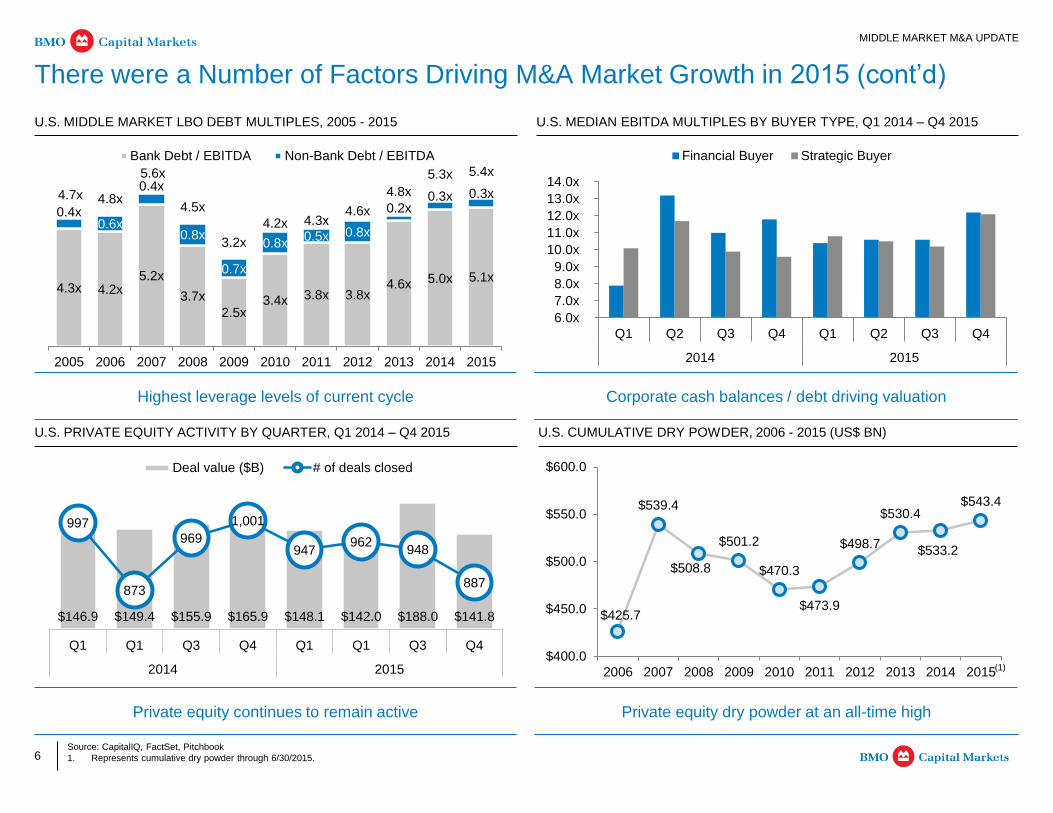
$425.7
$539.4
$508.8
$501.2
$470.3
$473.9
$498.7
$530.4
$533.2
$543.4
$400.0
$450.0
$500.0
$550.0
$600.0
2006 2007 2008 2009 2010 2011 2012 2013 2014 2015
$146.9 $149.4 $155.9 $165.9 $148.1 $142.0 $188.0 $141.8
997
873
969
1,001
947962
948
887
Q1 Q1 Q3 Q4 Q1 Q1 Q3 Q4
2014 2015
Deal value ($B) # of deals closed
MIDDLE MARKET M&A UPDATE
There were a Number of Factors Driving M&A Market Growth in 2015 (cont’d)
Source: CapitalIQ, FactSet, Pitchbook
1. Represents cumulative dry powder through 6/30/2015.
U.S. PRIVATE EQUITY ACTIVITY BY QUARTER, Q1 2014 – Q4 2015 U.S. CUMULATIVE DRY POWDER, 2006 - 2015 (US$ BN)
(1)
Private equity dry powder at an all-time high Private equity continues to remain active
4.3x 4.2x5.2x
3.7x
2.5x3.4x 3.8x 3.8x
4.6x 5.0x 5.1x
0.4x0.6x
0.4x
0.8x
0.7x
0.8x0.5x 0.8x
0.2x0.3x 0.3x4.7x 4.8x
5.6x
4.5x
3.2x
4.2x 4.3x4.6x
4.8x
5.3x 5.4x
2005 2006 2007 2008 2009 2010 2011 2012 2013 2014 2015
Bank Debt / EBITDA Non-Bank Debt / EBITDA
U.S. MIDDLE MARKET LBO DEBT MULTIPLES, 2005 - 2015 U.S. MEDIAN EBITDA MULTIPLES BY BUYER TYPE, Q1 2014 – Q4 2015
Corporate cash balances / debt driving valuation Highest leverage levels of current cycle
7 Source: Capital IQ, FactSet, SDC
Note: As of April 15, 2016 unless otherwise noted.
1. Includes U.S. targets, acquirers or sellers involved in transactions with disclosed value ranges of $200 - $5,000 million.
2. Includes U.S. targets, acquirers or sellers involved in transactions with disclosed values greater than $1 million.
3. LTM majority transactions with disclosed value ranges of $200 - $5,000 million through April 8, 2016; $ in billions.
MIDDLE MARKET M&A UPDATE
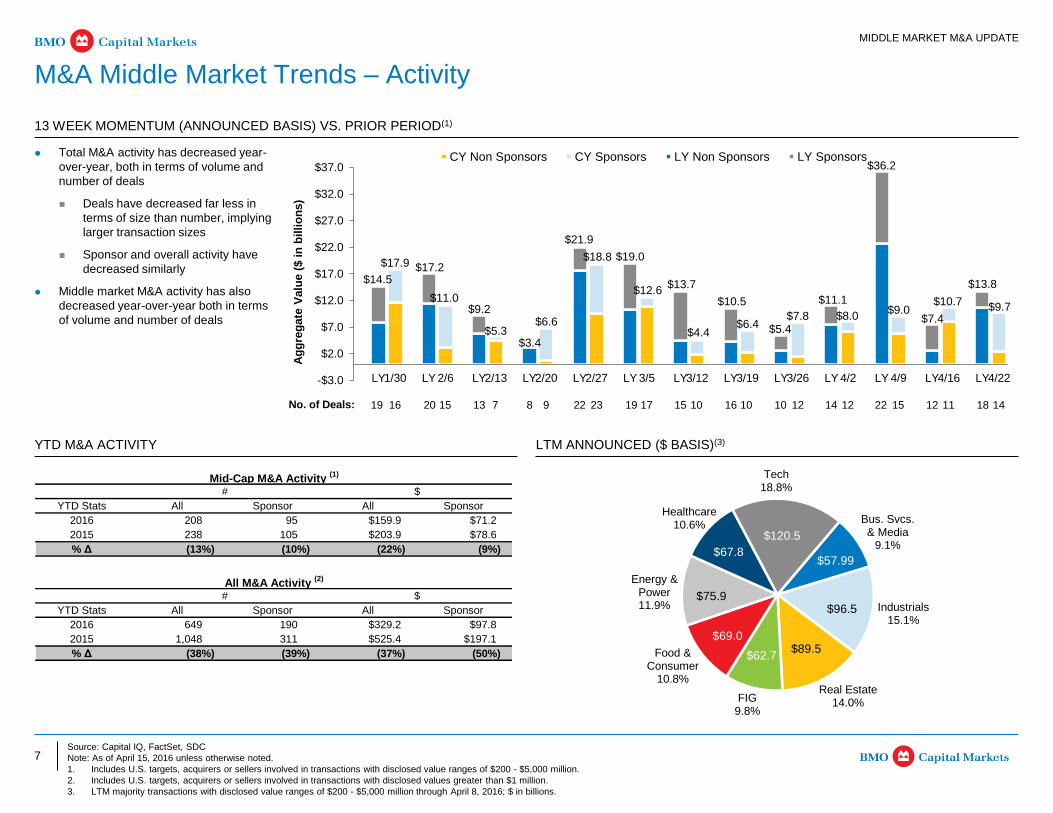
M&A Middle Market Trends – Activity
13 WEEK MOMENTUM (ANNOUNCED BASIS) VS. PRIOR PERIOD(1)
YTD M&A ACTIVITY LTM ANNOUNCED ($ BASIS)(3)
Bus. Svcs. & Media
9.1%
Industrials15.1%
Real Estate14.0%FIG
9.8%
Food & Consumer
10.8%
Energy & Power11.9%
Healthcare10.6%
Tech18.8%
$67.8
$89.5
$57.99
$96.5
$62.7
$69.0
$75.9
$120.5
Total M&A activity has decreased year-
over-year, both in terms of volume and
number of deals
Deals have decreased far less in
terms of size than number, implying
larger transaction sizes
Sponsor and overall activity have
decreased similarly
Middle market M&A activity has also
decreased year-over-year both in terms
of volume and number of deals
$14.5
$17.9 $17.2
$11.0 $9.2
$5.3 $3.4
$6.6
$21.9
$18.8 $19.0
$12.6 $13.7
$4.4
$10.5
$6.4 $5.4 $7.8
$11.1
$8.0
$36.2
$9.0 $7.4
$10.7
$13.8
$9.7
-$3.0
$2.0
$7.0
$12.0
$17.0
$22.0
$27.0
$32.0
$37.0
LY1/30 LY 2/6 LY2/13 LY2/20 LY2/27 LY 3/5 LY3/12 LY3/19 LY3/26 LY 4/2 LY 4/9 LY4/16 LY4/22
Ag
gre
gate
Valu
e (
$ i
n b
illi
on
s)
CY Non Sponsors CY Sponsors LY Non Sponsors LY Sponsors
19 16 No. of Deals: 15 7 9 23 17 10 10 12 12 15 11 14 18 12 22 14 10 16 15 22 8 13 20 19
Mid-Cap M&A Activity (1)
# $
YTD Stats All Sponsor All Sponsor
2016 208 95 $159.9 $71.2
2015 238 105 $203.9 $78.6
% Δ (13%) (10%) (22%) (9%)
All M&A Activity (2)
# $
YTD Stats All Sponsor All Sponsor
2016 649 190 $329.2 $97.8
2015 1,048 311 $525.4 $197.1
% Δ (38%) (39%) (37%) (50%)

8
MIDDLE MARKET M&A UPDATE
Middle Market M&A Trends – Relevant Topics
Once an esoteric insurance product, now a commonplace feature in M&A deals
Enhanced post-closing deal protection for buyers and clean exits for sellers
Distinguishes bids in an auction by requiring minimal or no survival of R&W in purchase agreement
General market observations:
$30mm coverage costs 3.5-4.0% ($1.0-1.2mm) with policy deductible of 1.5% of purchase price for zero recourse
to seller (some seller recourse may be 5-10% cheaper)
– Costs are typically split 50/50 between buyer and seller
Policies are typically for three years for general R&W and up to six years for fundamental reps, including tax
AIG, Ambridge Partners, and Concorde Specialty Risk are more comfortable with zero recourse deals
Ace, Allied, and Hartford less inclined on no indemnity deals or may require 2.0% policy deductible
Generally, insurance companies won’t begin their underwriting work until buyer is exclusive and will want to
review SPA, schedules
Policy negotiation and underwriting generally takes seven to ten business days
Carve-out policies are also becoming commonplace (i.e. environmental)
Reps & Warranties (R&W)
Insurance
Marginal benefit to sanctioning a QoE report by seller unless add-backs represent a substantial portion of adjusted
EBITDA and will distract buyers
Desired goal can be accomplished with staple financing indication
In almost all situations, buyers will want to complete their own QoE report
Third party consulting reports supporting growth strategy offers best return on investment
Seller has ability to influence and drive conclusions; conflicts consulting firm with working with potential buyers
Potential to hire consulting firm following management presentations where all buyers sign-off on scope of
engagement and receive report; winning party ultimately pays for report
Seller Diligence Reports / Quality of
Earnings (QoE)
9
MIDDLE MARKET M&A 101
Section 2: Middle Market M&A 101
Section 1 Middle Market M&A Update
Section 2 Middle Market M&A 101
Section 3 Middle Market M&A Key Areas of Due Diligence
Appendix A - C

10
“Buyside” Motivation “Sellside” Motivation
Strategic fit / synergies
Portfolio / geographic diversification
Consolidator in a fragmented marketplace
Market leader / platform opportunity
Defensive focus: “eat or be eaten”
Opportunistic valuation
Acquisition of technology
Private equity investment horizon
Seeking new strategic direction / growth capital
Succession issues
Opportunistic valuation
Shareholder dissent
Operational underperformance
1+1 > 2
MIDDLE MARKET M&A 101
What Motivates Companies to Transact?
M&A situations may be driven by a variety of circumstances
11
MIDDLE MARKET M&A 101
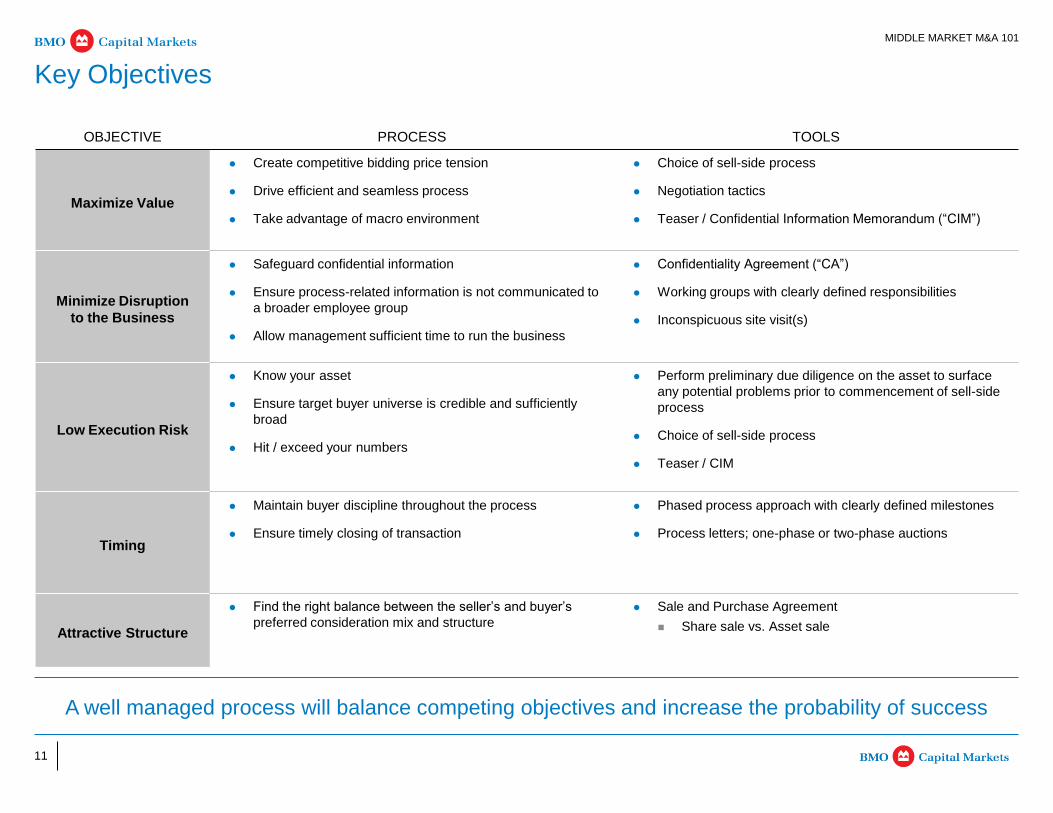
Key Objectives
A well managed process will balance competing objectives and increase the probability of success
OBJECTIVE PROCESS TOOLS
Maximize Value
Create competitive bidding price tension
Drive efficient and seamless process
Take advantage of macro environment
Choice of sell-side process
Negotiation tactics
Teaser / Confidential Information Memorandum (“CIM”)
Minimize Disruption
to the Business
Safeguard confidential information
Ensure process-related information is not communicated to
a broader employee group
Allow management sufficient time to run the business
Confidentiality Agreement (“CA”)
Working groups with clearly defined responsibilities
Inconspicuous site visit(s)
Low Execution Risk
Know your asset
Ensure target buyer universe is credible and sufficiently
broad
Hit / exceed your numbers
Perform preliminary due diligence on the asset to surface
any potential problems prior to commencement of sell-side
process
Choice of sell-side process
Teaser / CIM
Timing
Maintain buyer discipline throughout the process
Ensure timely closing of transaction
Phased process approach with clearly defined milestones
Process letters; one-phase or two-phase auctions
Attractive Structure
Find the right balance between the seller’s and buyer’s
preferred consideration mix and structure
Sale and Purchase Agreement
Share sale vs. Asset sale
12
MIDDLE MARKET M&A 101
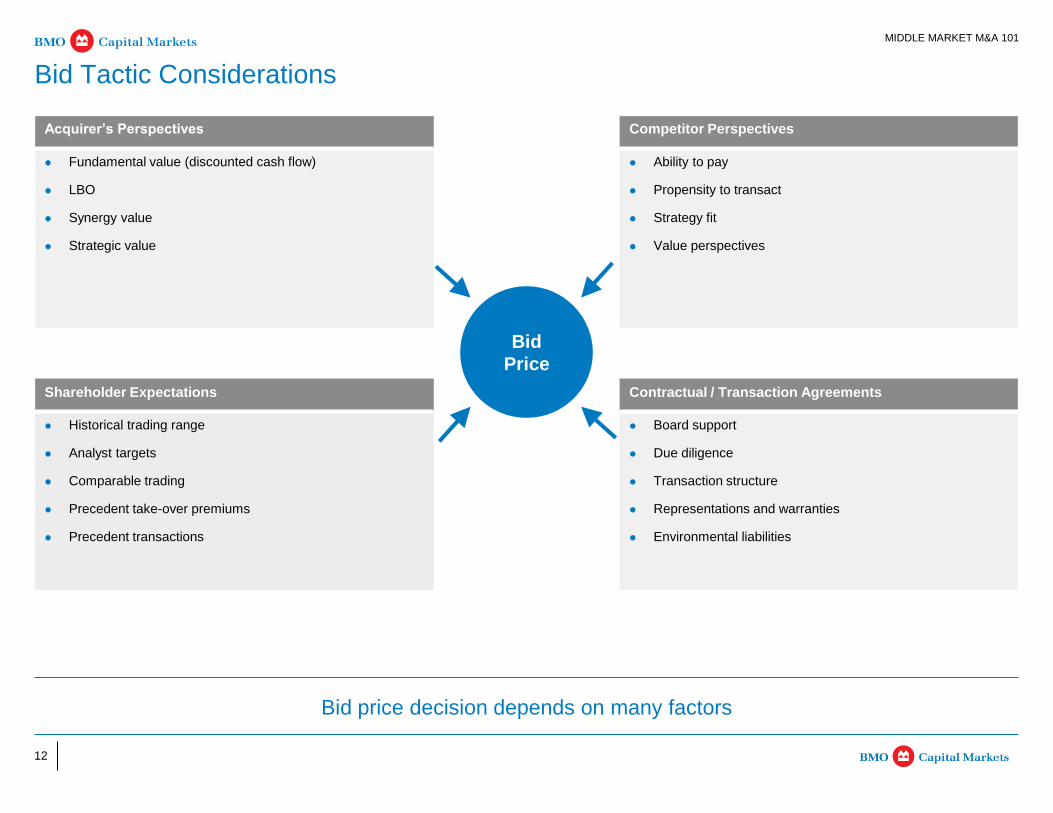
Bid Tactic Considerations
Bid price decision depends on many factors
Bid
Price
Acquirer’s Perspectives Competitor Perspectives
Fundamental value (discounted cash flow)
LBO
Synergy value
Strategic value
Ability to pay
Propensity to transact
Strategy fit
Value perspectives
Shareholder Expectations Contractual / Transaction Agreements
Historical trading range
Analyst targets
Comparable trading
Precedent take-over premiums
Precedent transactions
Board support
Due diligence
Transaction structure
Representations and warranties
Environmental liabilities
13
MIDDLE MARKET M&A 101
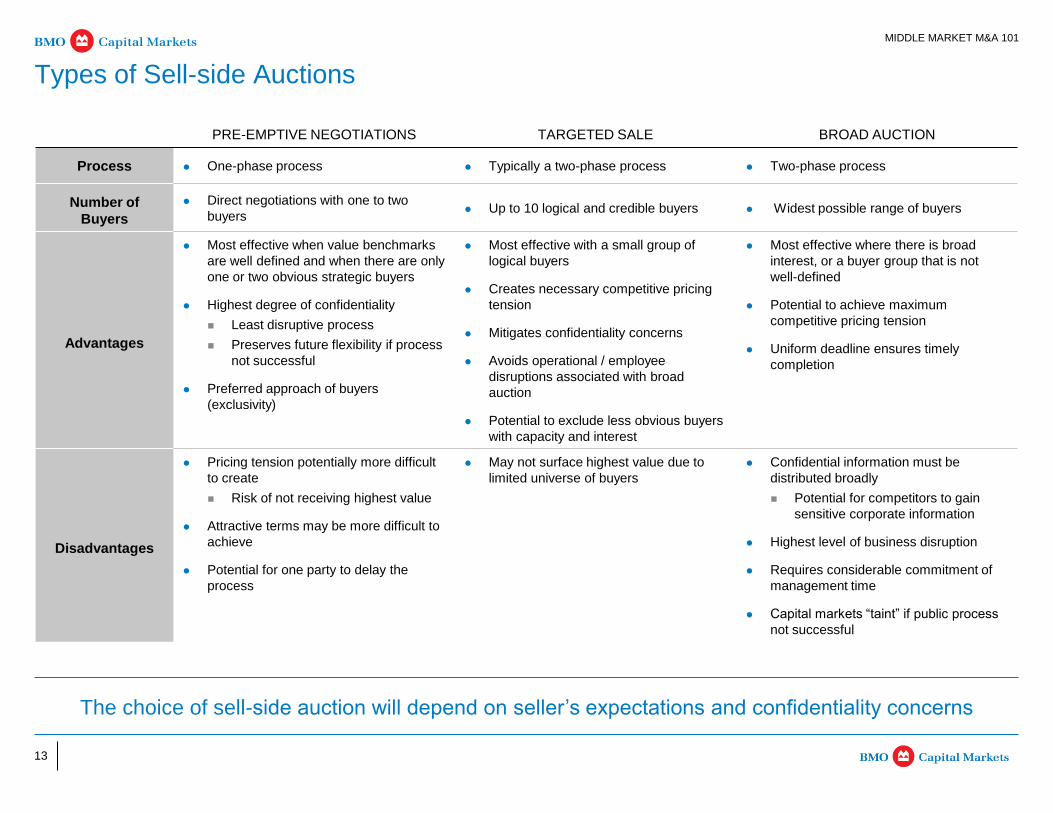
Types of Sell-side Auctions
The choice of sell-side auction will depend on seller’s expectations and confidentiality concerns
PRE-EMPTIVE NEGOTIATIONS TARGETED SALE BROAD AUCTION
Process One-phase process Typically a two-phase process Two-phase process
Number of
Buyers
Direct negotiations with one to two
buyers Up to 10 logical and credible buyers Widest possible range of buyers
Advantages
Most effective when value benchmarks
are well defined and when there are only
one or two obvious strategic buyers
Highest degree of confidentiality
Least disruptive process
Preserves future flexibility if process
not successful
Preferred approach of buyers
(exclusivity)
Most effective with a small group of
logical buyers
Creates necessary competitive pricing
tension
Mitigates confidentiality concerns
Avoids operational / employee
disruptions associated with broad
auction
Potential to exclude less obvious buyers
with capacity and interest
Most effective where there is broad
interest, or a buyer group that is not
well-defined
Potential to achieve maximum
competitive pricing tension
Uniform deadline ensures timely
completion
Disadvantages
Pricing tension potentially more difficult
to create
Risk of not receiving highest value
Attractive terms may be more difficult to
achieve
Potential for one party to delay the
process
May not surface highest value due to
limited universe of buyers
Confidential information must be
distributed broadly
Potential for competitors to gain
sensitive corporate information
Highest level of business disruption
Requires considerable commitment of
management time
Capital markets “taint” if public process
not successful
14
MIDDLE MARKET M&A 101
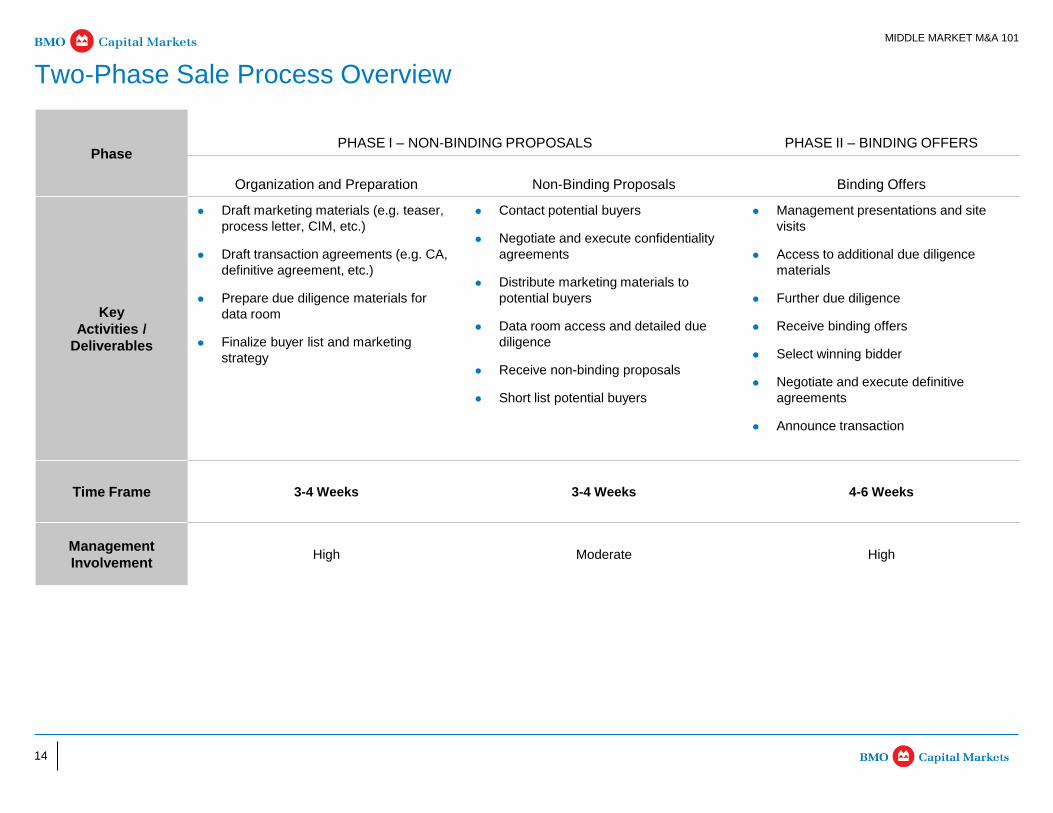
Two-Phase Sale Process Overview
Phase PHASE I – NON-BINDING PROPOSALS PHASE II – BINDING OFFERS
Organization and Preparation Non-Binding Proposals Binding Offers
Key
Activities /
Deliverables
Draft marketing materials (e.g. teaser,
process letter, CIM, etc.)
Draft transaction agreements (e.g. CA,
definitive agreement, etc.)
Prepare due diligence materials for
data room
Finalize buyer list and marketing
strategy
Contact potential buyers
Negotiate and execute confidentiality
agreements
Distribute marketing materials to
potential buyers
Data room access and detailed due
diligence
Receive non-binding proposals
Short list potential buyers
Management presentations and site
visits
Access to additional due diligence
materials
Further due diligence
Receive binding offers
Select winning bidder
Negotiate and execute definitive
agreements
Announce transaction
Time Frame 3-4 Weeks 3-4 Weeks 4-6 Weeks
Management
Involvement High Moderate High
15
MIDDLE MARKET M&A 101
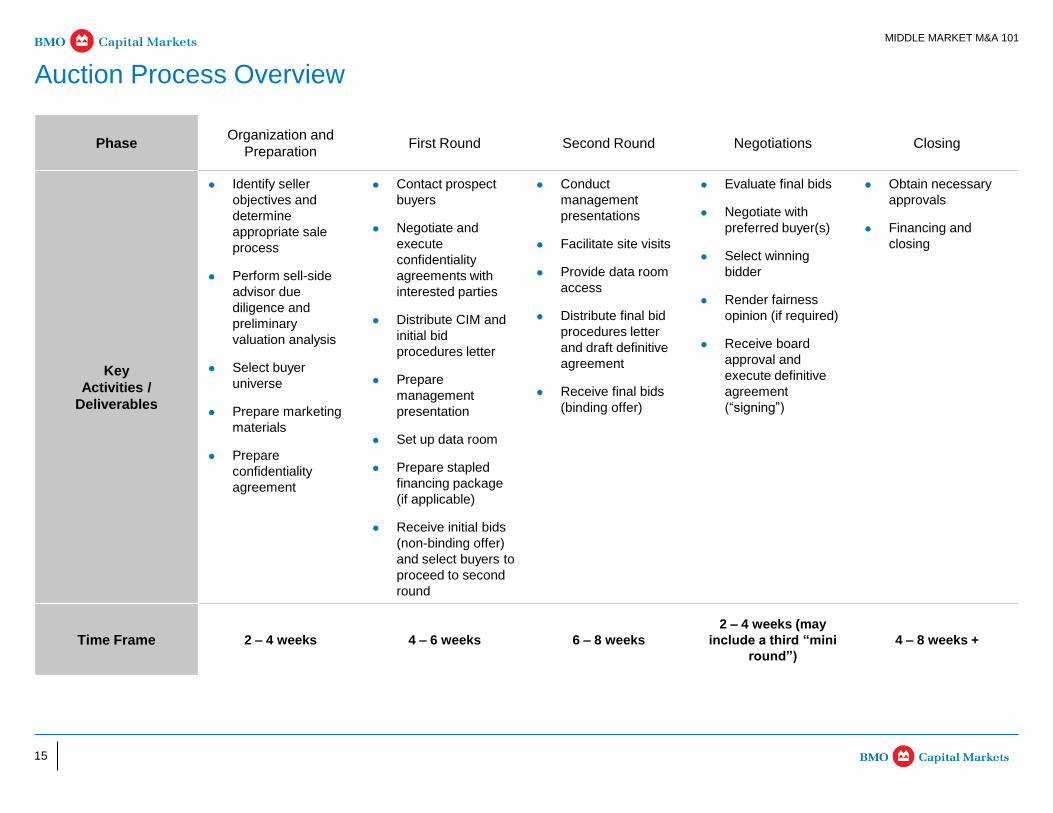
Auction Process Overview
Phase Organization and
Preparation First Round Second Round Negotiations Closing
Key
Activities /
Deliverables
Identify seller
objectives and
determine
appropriate sale
process
Perform sell-side
advisor due
diligence and
preliminary
valuation analysis
Select buyer
universe
Prepare marketing
materials
Prepare
confidentiality
agreement
Contact prospect
buyers
Negotiate and
execute
confidentiality
agreements with
interested parties
Distribute CIM and
initial bid
procedures letter
Prepare
management
presentation
Set up data room
Prepare stapled
financing package
(if applicable)
Receive initial bids
(non-binding offer)
and select buyers to
proceed to second
round
Conduct
management
presentations
Facilitate site visits
Provide data room
access
Distribute final bid
procedures letter
and draft definitive
agreement
Receive final bids
(binding offer)
Evaluate final bids
Negotiate with
preferred buyer(s)
Select winning
bidder
Render fairness
opinion (if required)
Receive board
approval and
execute definitive
agreement
(“signing”)
Obtain necessary
approvals
Financing and
closing
Time Frame 2 – 4 weeks 4 – 6 weeks 6 – 8 weeks
2 – 4 weeks (may
include a third “mini
round”)
4 – 8 weeks +
16
MIDDLE MARKET M&A 101
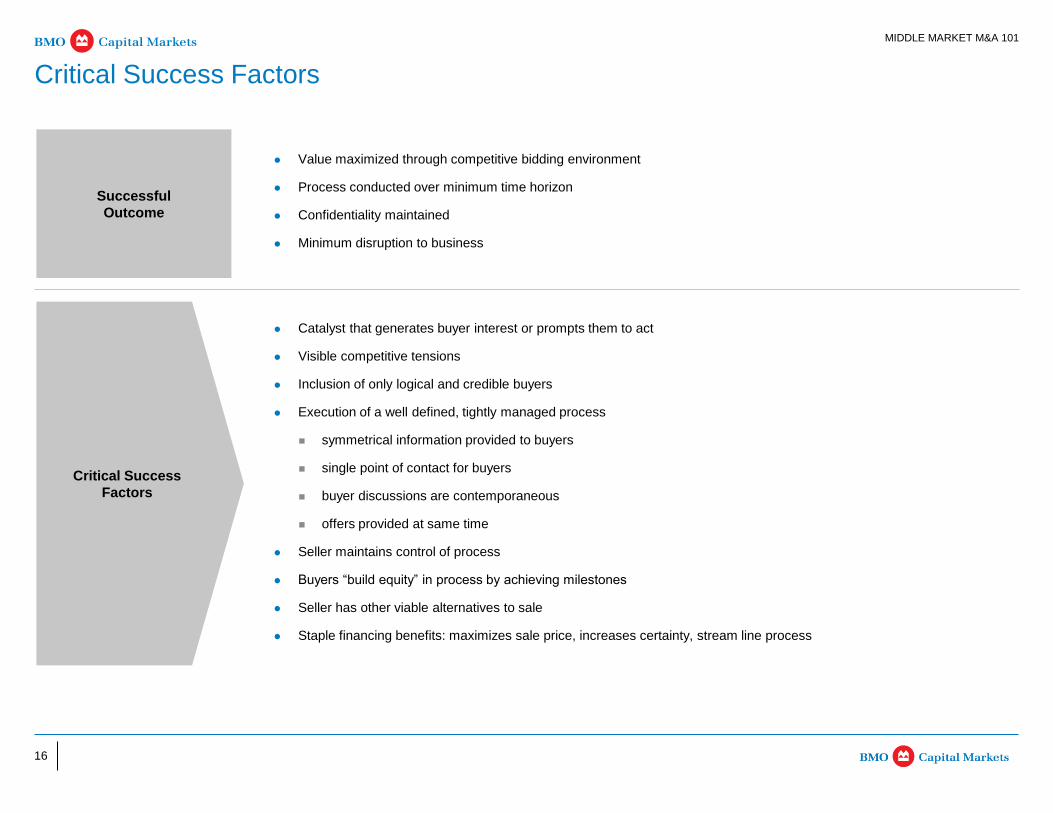
Critical Success Factors
Value maximized through competitive bidding environment
Process conducted over minimum time horizon
Confidentiality maintained
Minimum disruption to business
Successful
Outcome
Critical Success
Factors
Catalyst that generates buyer interest or prompts them to act
Visible competitive tensions
Inclusion of only logical and credible buyers
Execution of a well defined, tightly managed process
symmetrical information provided to buyers
single point of contact for buyers
buyer discussions are contemporaneous
offers provided at same time
Seller maintains control of process
Buyers “build equity” in process by achieving milestones
Seller has other viable alternatives to sale
Staple financing benefits: maximizes sale price, increases certainty, stream line process
17
MIDDLE MARKET M&A KEY AREAS OF DUE DILIGENCE
Section 3: Middle Market M&A Key Areas of Due Diligence
Section 1 Middle Market M&A Update
Section 2 Middle Market M&A 101
Section 3 Middle Market M&A Key Areas of Due Diligence
Appendix A - C
18
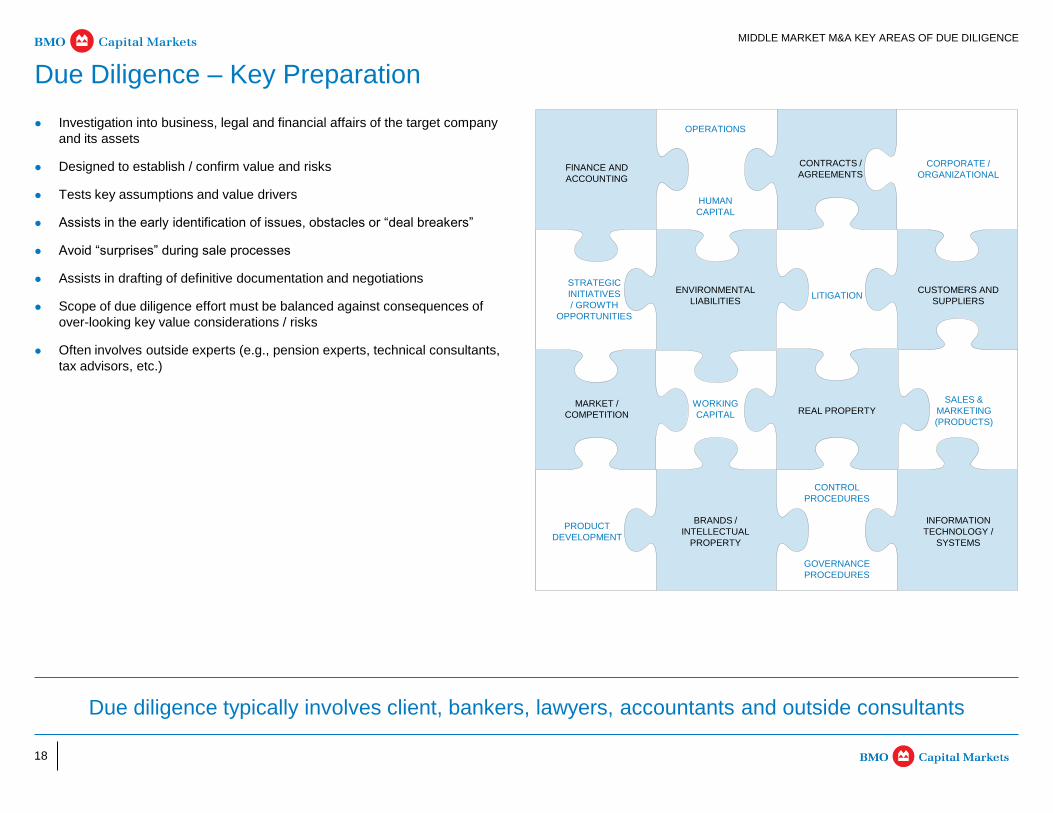
Investigation into business, legal and financial affairs of the target company
and its assets
Designed to establish / confirm value and risks
Tests key assumptions and value drivers
Assists in the early identification of issues, obstacles or “deal breakers”
Avoid “surprises” during sale processes
Assists in drafting of definitive documentation and negotiations
Scope of due diligence effort must be balanced against consequences of
over-looking key value considerations / risks
Often involves outside experts (e.g., pension experts, technical consultants,
tax advisors, etc.)
MIDDLE MARKET M&A KEY AREAS OF DUE DILIGENCE
Due Diligence – Key Preparation
Due diligence typically involves client, bankers, lawyers, accountants and outside consultants
FINANCE AND
ACCOUNTING
OPERATIONS
CONTRACTS /
AGREEMENTS
SALES &
MARKETING
(PRODUCTS)
STRATEGIC
INITIATIVES
/ GROWTH
OPPORTUNITIES
ENVIRONMENTAL
LIABILITIES LITIGATION
CUSTOMERS AND
SUPPLIERS
MARKET /
COMPETITION
WORKING
CAPITAL REAL PROPERTY
CORPORATE /
ORGANIZATIONAL
PRODUCT
DEVELOPMENT
BRANDS /
INTELLECTUAL
PROPERTY
CONTROL
PROCEDURES
INFORMATION
TECHNOLOGY /
SYSTEMS
HUMAN
CAPITAL
GOVERNANCE
PROCEDURES
19
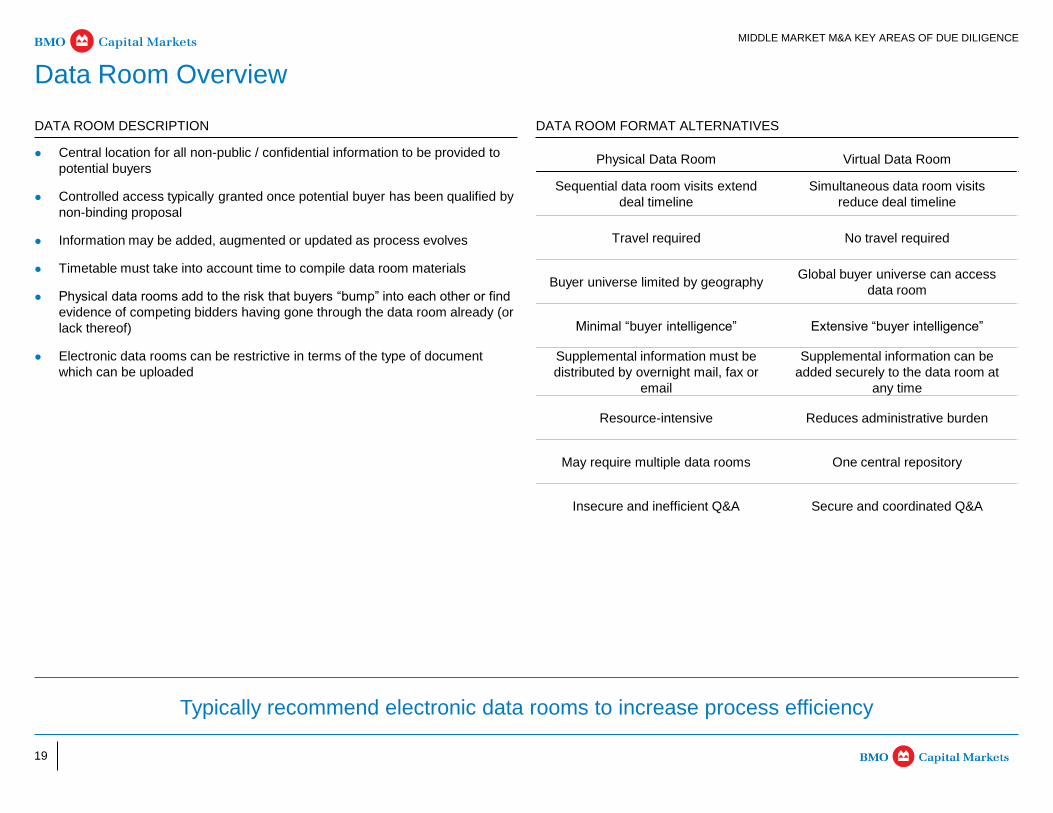
Central location for all non-public / confidential information to be provided to
potential buyers
Controlled access typically granted once potential buyer has been qualified by
non-binding proposal
Information may be added, augmented or updated as process evolves
Timetable must take into account time to compile data room materials
Physical data rooms add to the risk that buyers “bump” into each other or find
evidence of competing bidders having gone through the data room already (or
lack thereof)
Electronic data rooms can be restrictive in terms of the type of document
which can be uploaded
MIDDLE MARKET M&A KEY AREAS OF DUE DILIGENCE
Data Room Overview
Typically recommend electronic data rooms to increase process efficiency
DATA ROOM DESCRIPTION
Physical Data Room Virtual Data Room
Sequential data room visits extend
deal timeline
Simultaneous data room visits
reduce deal timeline
Travel required No travel required
Buyer universe limited by geography Global buyer universe can access
data room
Minimal “buyer intelligence” Extensive “buyer intelligence”
Supplemental information must be
distributed by overnight mail, fax or
Supplemental information can be
added securely to the data room at
any time
Resource-intensive Reduces administrative burden
May require multiple data rooms One central repository
Insecure and inefficient Q&A Secure and coordinated Q&A
DATA ROOM FORMAT ALTERNATIVES
20
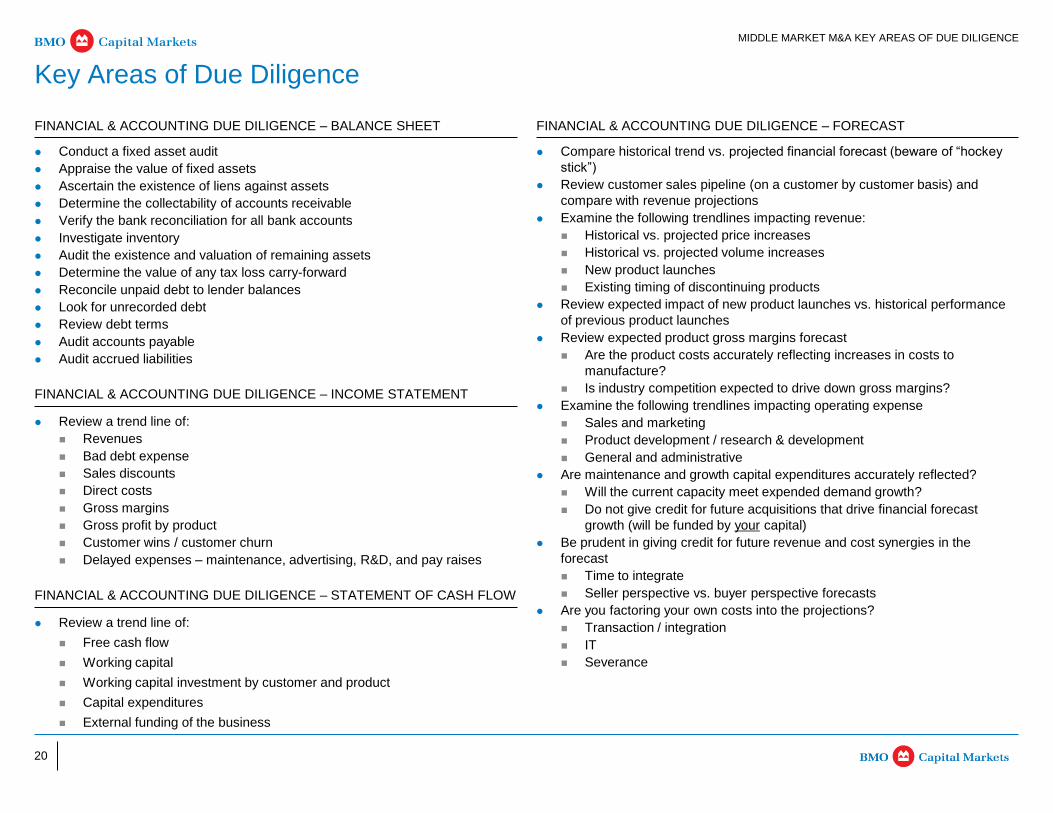
Compare historical trend vs. projected financial forecast (beware of “hockey
stick”)
Review customer sales pipeline (on a customer by customer basis) and
compare with revenue projections
Examine the following trendlines impacting revenue:
Historical vs. projected price increases
Historical vs. projected volume increases
New product launches
Existing timing of discontinuing products
Review expected impact of new product launches vs. historical performance
of previous product launches
Review expected product gross margins forecast
Are the product costs accurately reflecting increases in costs to
manufacture?
Is industry competition expected to drive down gross margins?
Examine the following trendlines impacting operating expense
Sales and marketing
Product development / research & development
General and administrative
Are maintenance and growth capital expenditures accurately reflected?
Will the current capacity meet expended demand growth?
Do not give credit for future acquisitions that drive financial forecast
growth (will be funded by your capital)
Be prudent in giving credit for future revenue and cost synergies in the
forecast
Time to integrate
Seller perspective vs. buyer perspective forecasts
Are you factoring your own costs into the projections?
Transaction / integration
IT
Severance
FINANCIAL & ACCOUNTING DUE DILIGENCE – BALANCE SHEET FINANCIAL & ACCOUNTING DUE DILIGENCE – FORECAST
MIDDLE MARKET M&A KEY AREAS OF DUE DILIGENCE
Key Areas of Due Diligence
Conduct a fixed asset audit
Appraise the value of fixed assets
Ascertain the existence of liens against assets
Determine the collectability of accounts receivable
Verify the bank reconciliation for all bank accounts
Investigate inventory
Audit the existence and valuation of remaining assets
Determine the value of any tax loss carry-forward
Reconcile unpaid debt to lender balances
Look for unrecorded debt
Review debt terms
Audit accounts payable
Audit accrued liabilities
FINANCIAL & ACCOUNTING DUE DILIGENCE – INCOME STATEMENT
Review a trend line of:
Revenues
Bad debt expense
Sales discounts
Direct costs
Gross margins
Gross profit by product
Customer wins / customer churn
Delayed expenses – maintenance, advertising, R&D, and pay raises
FINANCIAL & ACCOUNTING DUE DILIGENCE – STATEMENT OF CASH FLOW
Review a trend line of:
Free cash flow
Working capital
Working capital investment by customer and product
Capital expenditures
External funding of the business
21
MIDDLE MARKET M&A KEY AREAS OF DUE DILIGENCE
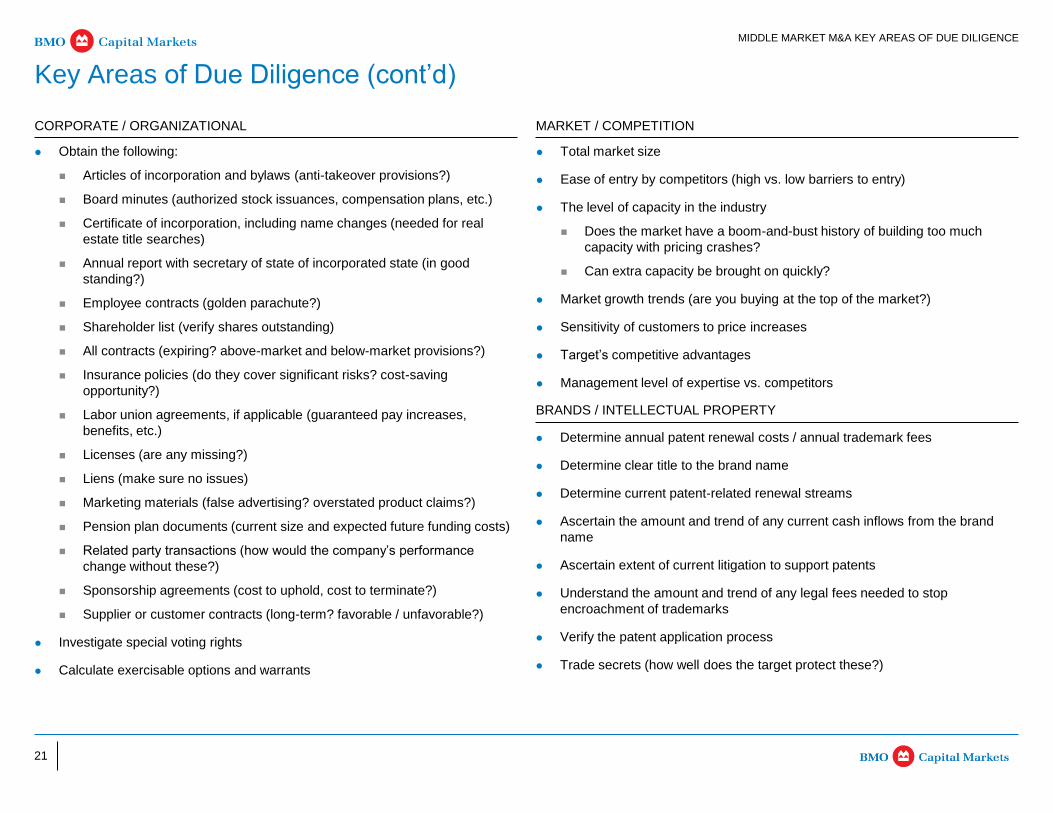
Obtain the following:
Articles of incorporation and bylaws (anti-takeover provisions?)
Board minutes (authorized stock issuances, compensation plans, etc.)
Certificate of incorporation, including name changes (needed for real
estate title searches)
Annual report with secretary of state of incorporated state (in good
standing?)
Employee contracts (golden parachute?)
Shareholder list (verify shares outstanding)
All contracts (expiring? above-market and below-market provisions?)
Insurance policies (do they cover significant risks? cost-saving
opportunity?)
Labor union agreements, if applicable (guaranteed pay increases,
benefits, etc.)
Licenses (are any missing?)
Liens (make sure no issues)
Marketing materials (false advertising? overstated product claims?)
Pension plan documents (current size and expected future funding costs)
Related party transactions (how would the company’s performance
change without these?)
Sponsorship agreements (cost to uphold, cost to terminate?)
Supplier or customer contracts (long-term? favorable / unfavorable?)
Investigate special voting rights
Calculate exercisable options and warrants
Key Areas of Due Diligence (cont’d)
CORPORATE / ORGANIZATIONAL MARKET / COMPETITION
Total market size
Ease of entry by competitors (high vs. low barriers to entry)
The level of capacity in the industry
Does the market have a boom-and-bust history of building too much
capacity with pricing crashes?
Can extra capacity be brought on quickly?
Market growth trends (are you buying at the top of the market?)
Sensitivity of customers to price increases
Target’s competitive advantages
Management level of expertise vs. competitors
BRANDS / INTELLECTUAL PROPERTY
Determine annual patent renewal costs / annual trademark fees
Determine clear title to the brand name
Determine current patent-related renewal streams
Ascertain the amount and trend of any current cash inflows from the brand
name
Ascertain extent of current litigation to support patents
Understand the amount and trend of any legal fees needed to stop
encroachment of trademarks
Verify the patent application process
Trade secrets (how well does the target protect these?)
22
MIDDLE MARKET M&A KEY AREAS OF DUE DILIGENCE
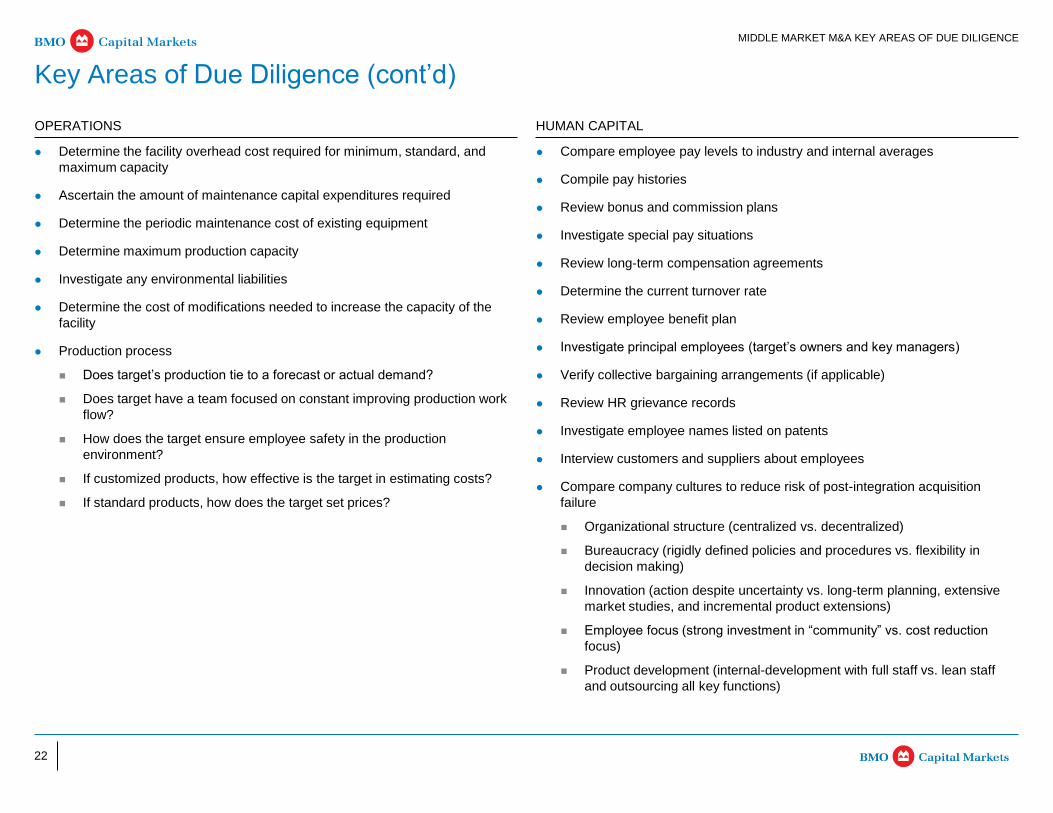
Determine the facility overhead cost required for minimum, standard, and
maximum capacity
Ascertain the amount of maintenance capital expenditures required
Determine the periodic maintenance cost of existing equipment
Determine maximum production capacity
Investigate any environmental liabilities
Determine the cost of modifications needed to increase the capacity of the
facility
Production process
Does target’s production tie to a forecast or actual demand?
Does target have a team focused on constant improving production work
flow?
How does the target ensure employee safety in the production
environment?
If customized products, how effective is the target in estimating costs?
If standard products, how does the target set prices?
Key Areas of Due Diligence (cont’d)
OPERATIONS HUMAN CAPITAL
Compare employee pay levels to industry and internal averages
Compile pay histories
Review bonus and commission plans
Investigate special pay situations
Review long-term compensation agreements
Determine the current turnover rate
Review employee benefit plan
Investigate principal employees (target’s owners and key managers)
Verify collective bargaining arrangements (if applicable)
Review HR grievance records
Investigate employee names listed on patents
Interview customers and suppliers about employees
Compare company cultures to reduce risk of post-integration acquisition
failure
Organizational structure (centralized vs. decentralized)
Bureaucracy (rigidly defined policies and procedures vs. flexibility in
decision making)
Innovation (action despite uncertainty vs. long-term planning, extensive
market studies, and incremental product extensions)
Employee focus (strong investment in “community” vs. cost reduction
focus)
Product development (internal-development with full staff vs. lean staff
and outsourcing all key functions)
23
MIDDLE MARKET M&A KEY AREAS OF DUE DILIGENCE
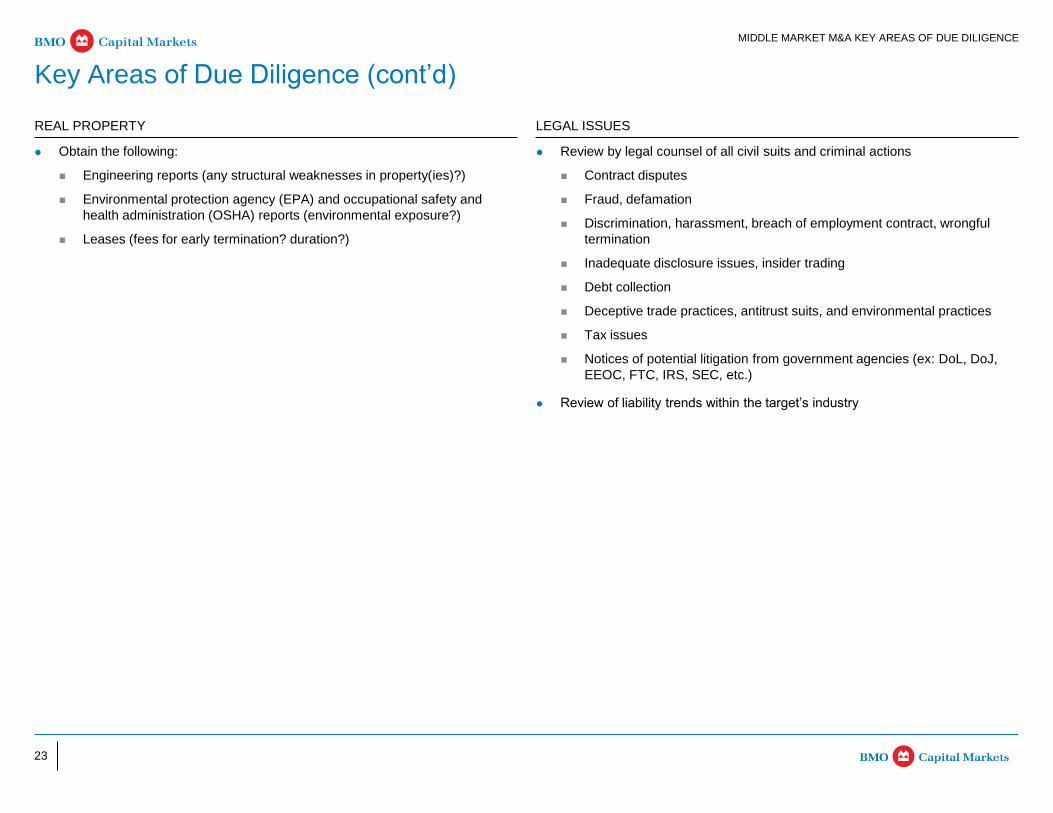
Obtain the following:
Engineering reports (any structural weaknesses in property(ies)?)
Environmental protection agency (EPA) and occupational safety and
health administration (OSHA) reports (environmental exposure?)
Leases (fees for early termination? duration?)
Key Areas of Due Diligence (cont’d)
REAL PROPERTY LEGAL ISSUES
Review by legal counsel of all civil suits and criminal actions
Contract disputes
Fraud, defamation
Discrimination, harassment, breach of employment contract, wrongful
termination
Inadequate disclosure issues, insider trading
Debt collection
Deceptive trade practices, antitrust suits, and environmental practices
Tax issues
Notices of potential litigation from government agencies (ex: DoL, DoJ,
EEOC, FTC, IRS, SEC, etc.)
Review of liability trends within the target’s industry
24
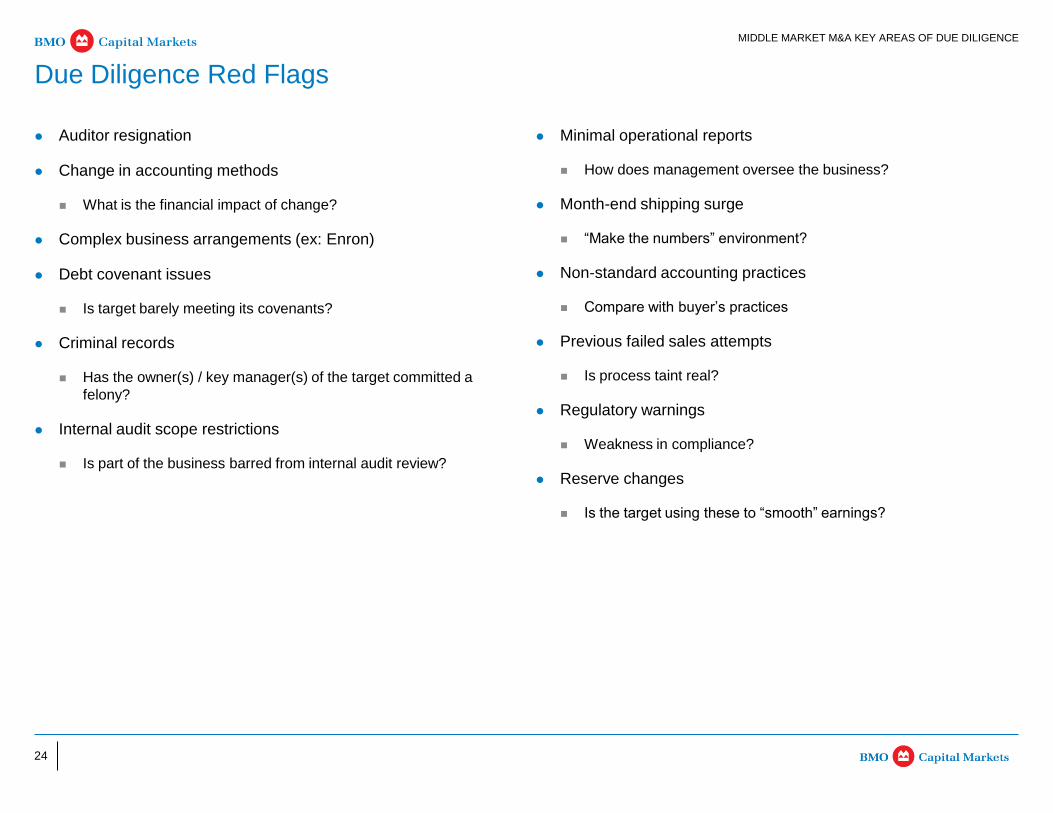
Auditor resignation
Change in accounting methods
What is the financial impact of change?
Complex business arrangements (ex: Enron)
Debt covenant issues
Is target barely meeting its covenants?
Criminal records
Has the owner(s) / key manager(s) of the target committed a
felony?
Internal audit scope restrictions
Is part of the business barred from internal audit review?
Minimal operational reports
How does management oversee the business?
Month-end shipping surge
“Make the numbers” environment?
Non-standard accounting practices
Compare with buyer’s practices
Previous failed sales attempts
Is process taint real?
Regulatory warnings
Weakness in compliance?
Reserve changes
Is the target using these to “smooth” earnings?
MIDDLE MARKET M&A KEY AREAS OF DUE DILIGENCE
Due Diligence Red Flags
25
APPENDIX A: KEY M&A MATERIALS
Appendix A: Key M&A Materials
Section 1 Middle Market M&A Update
Section 2 Middle Market M&A 101
Section 3 Middle Market M&A Key Areas of Due Diligence
Appendix A - C
26
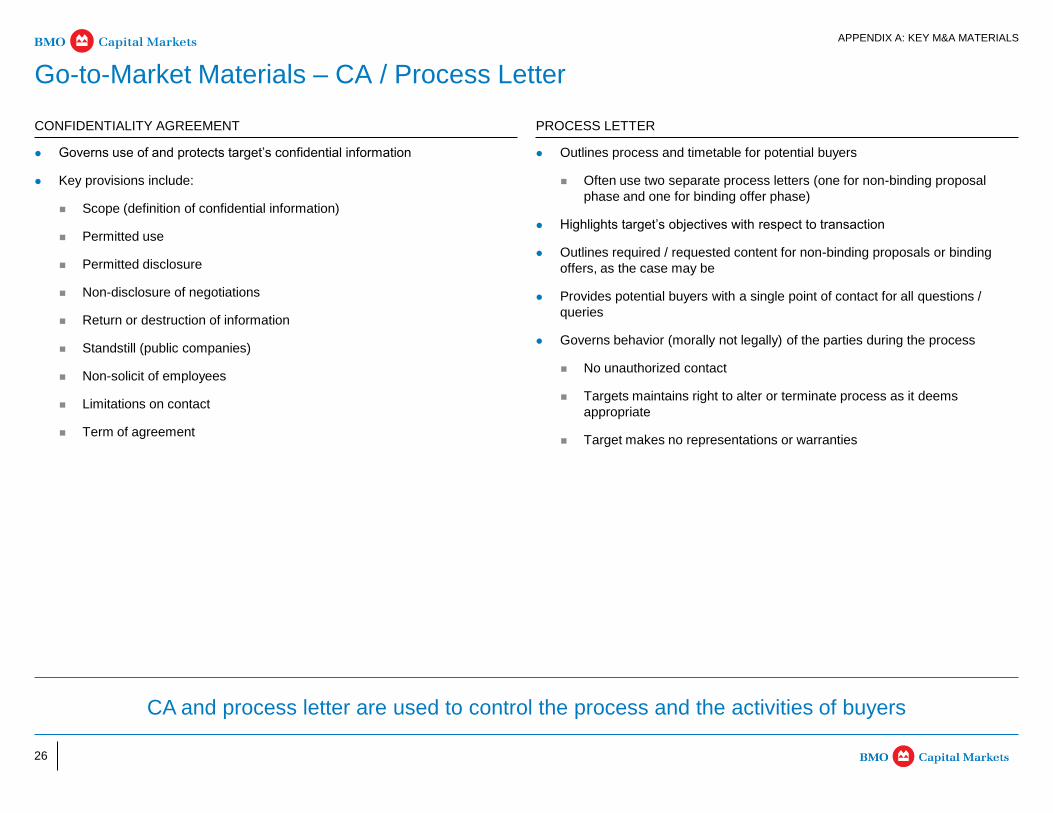
Governs use of and protects target’s confidential information
Key provisions include:
Scope (definition of confidential information)
Permitted use
Permitted disclosure
Non-disclosure of negotiations
Return or destruction of information
Standstill (public companies)
Non-solicit of employees
Limitations on contact
Term of agreement
Outlines process and timetable for potential buyers
Often use two separate process letters (one for non-binding proposal
phase and one for binding offer phase)
Highlights target’s objectives with respect to transaction
Outlines required / requested content for non-binding proposals or binding
offers, as the case may be
Provides potential buyers with a single point of contact for all questions /
queries
Governs behavior (morally not legally) of the parties during the process
No unauthorized contact
Targets maintains right to alter or terminate process as it deems
appropriate
Target makes no representations or warranties
APPENDIX A: KEY M&A MATERIALS
Go-to-Market Materials – CA / Process Letter
CA and process letter are used to control the process and the activities of buyers
CONFIDENTIALITY AGREEMENT PROCESS LETTER

27
1. Executive Summary
2. Investment Considerations
3. Industry Overview
Segment Overview
Market Share and Position
Competition
4. Company Overview
History
Strategy
Products and Services
Customers and Suppliers
Management and Employees
5. Operations Overview
Manufacturing
Distribution
Sales and Marketing
Information Systems
Legal and Environmental
6. Financial Information
Historical Financial Results and MD&A
Projected Financial Results and MD&A
Appendix
Audited Financial Statements
Recent Press Releases
Product Brochures
CIM is drafted, in large part, by investment bankers with input from
management based on:
Public filings, company brochures, confidential information (limited), etc.
Written in “third person, plain text” style
Word document
Concepts should be crisp, concise and sales oriented – opportunity to
highlight “upside”
Management presentation condenses key messages of CIM into 1-hour
“highlight reel”
Presentation rehearsals to refine management presentation delivery critical
Presenters often need coaching
APPENDIX A: KEY M&A MATERIALS
Go-to-Market Materials – CIM / Management Presentation
CIM and management presentation are key ‘sales documents’
ILLUSTRATIVE TABLE OF CONTENTS PROCESS DESCRIPTION
28
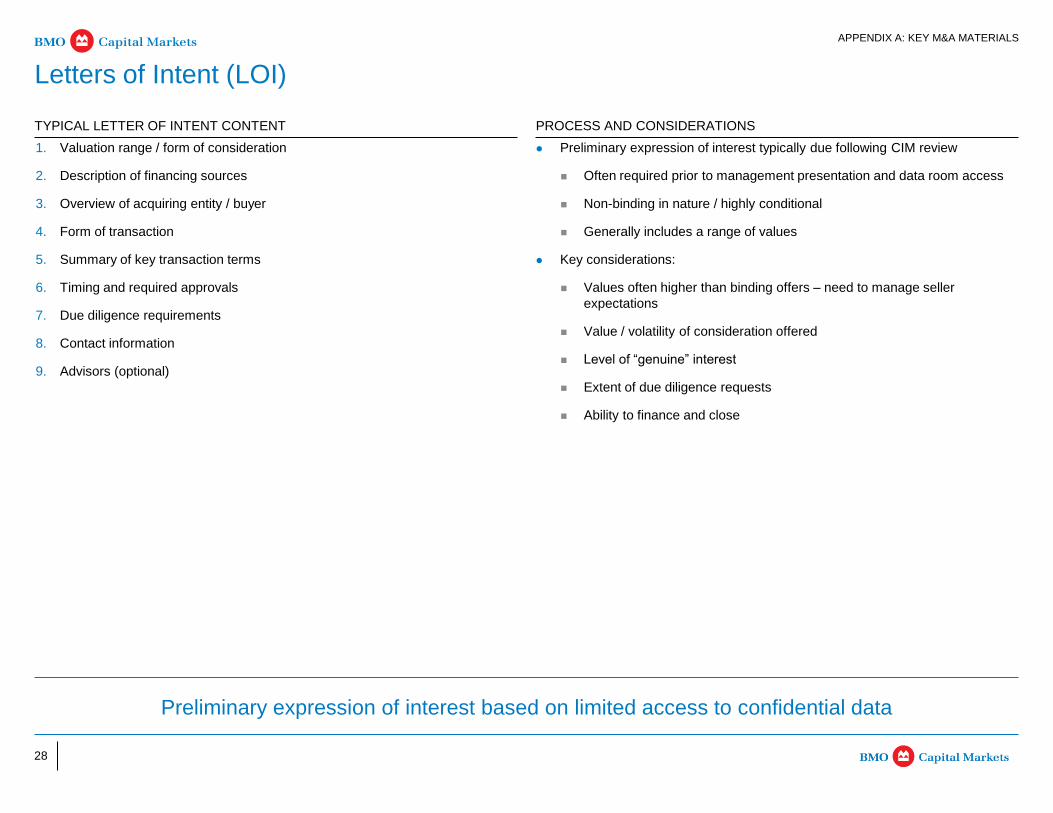
1. Valuation range / form of consideration
2. Description of financing sources
3. Overview of acquiring entity / buyer
4. Form of transaction
5. Summary of key transaction terms
6. Timing and required approvals
7. Due diligence requirements
8. Contact information
9. Advisors (optional)
Preliminary expression of interest typically due following CIM review
Often required prior to management presentation and data room access
Non-binding in nature / highly conditional
Generally includes a range of values
Key considerations:
Values often higher than binding offers – need to manage seller
expectations
Value / volatility of consideration offered
Level of “genuine” interest
Extent of due diligence requests
Ability to finance and close
APPENDIX A: KEY M&A MATERIALS
Letters of Intent (LOI)
Preliminary expression of interest based on limited access to confidential data
TYPICAL LETTER OF INTENT CONTENT PROCESS AND CONSIDERATIONS
29
APPENDIX A: KEY M&A MATERIALS
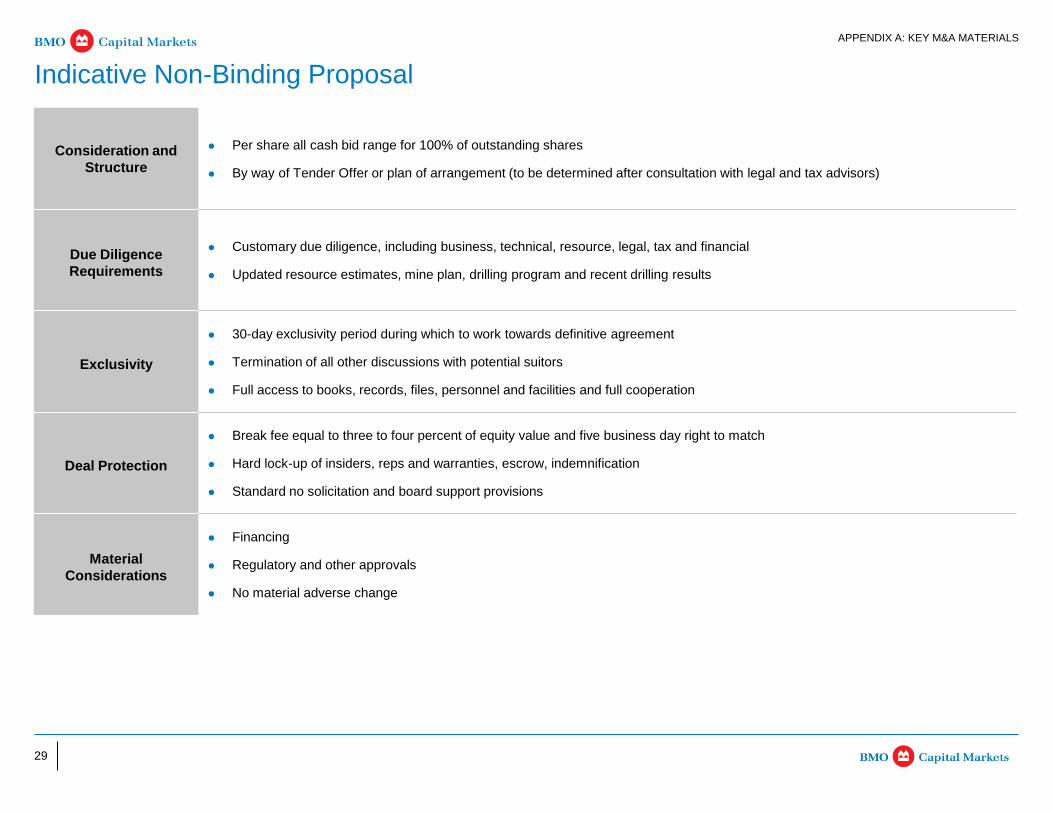
Indicative Non-Binding Proposal
Consideration and
Structure
Per share all cash bid range for 100% of outstanding shares
By way of Tender Offer or plan of arrangement (to be determined after consultation with legal and tax advisors)
Due Diligence
Requirements
Customary due diligence, including business, technical, resource, legal, tax and financial
Updated resource estimates, mine plan, drilling program and recent drilling results
Exclusivity
30-day exclusivity period during which to work towards definitive agreement
Termination of all other discussions with potential suitors
Full access to books, records, files, personnel and facilities and full cooperation
Deal Protection
Break fee equal to three to four percent of equity value and five business day right to match
Hard lock-up of insiders, reps and warranties, escrow, indemnification
Standard no solicitation and board support provisions
Material
Considerations
Financing
Regulatory and other approvals
No material adverse change
30
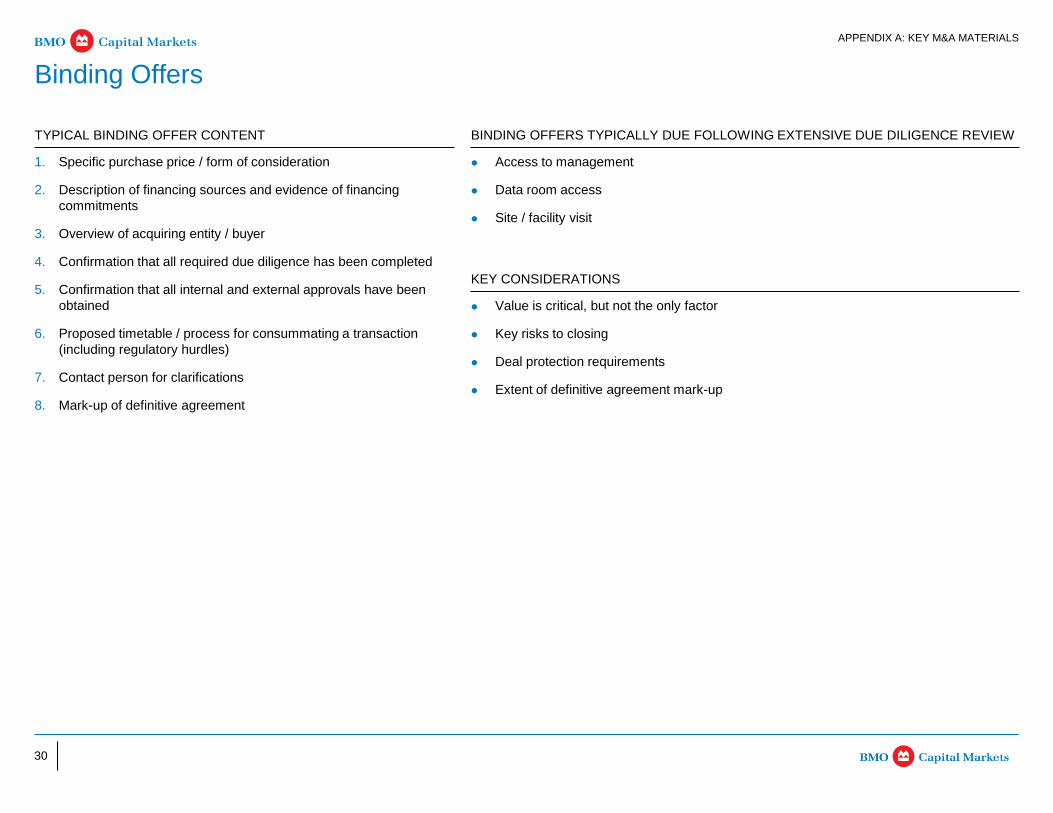
1. Specific purchase price / form of consideration
2. Description of financing sources and evidence of financing
commitments
3. Overview of acquiring entity / buyer
4. Confirmation that all required due diligence has been completed
5. Confirmation that all internal and external approvals have been
obtained
6. Proposed timetable / process for consummating a transaction
(including regulatory hurdles)
7. Contact person for clarifications
8. Mark-up of definitive agreement
Access to management
Data room access
Site / facility visit
APPENDIX A: KEY M&A MATERIALS
Binding Offers
TYPICAL BINDING OFFER CONTENT BINDING OFFERS TYPICALLY DUE FOLLOWING EXTENSIVE DUE DILIGENCE REVIEW
Value is critical, but not the only factor
Key risks to closing
Deal protection requirements
Extent of definitive agreement mark-up
KEY CONSIDERATIONS

31
APPENDIX B: SAMPLE DUE DILIGENCE LIST
Appendix B: Sample Due Diligence List
Section 1 Middle Market M&A Update
Section 2 Middle Market M&A 101
Section 3 Middle Market M&A Key Areas of Due Diligence
Appendix A - C

32
Corporate / ownership structure
List of all directors, officer and managers
List of material subsidiaries and affiliates
Board / investor presentations
Corporate brochures and other marketing materials
Copies of all prior valuations and appraisals
Independent industry reports or studies by outside consultants
Minute books for all investor, board and committee meetings
Current list of investors
Schedule of fully diluted shares / partnership units outstanding (including
expiration and exercise price of all options and warrants)
Shareholder / partnership agreement(s)
Audited financial statements for last five years (including copies of all audit
letters)
Quarterly financial statements for last three years
Five-year business plan (including detailed management forecast / budget)
Capital spending plan (identifying minimum sustaining and other capital
expenditures with associated benefits)
Fixed asset schedule (including historical capital spending and depreciation)
Intangible asset schedule
Historical working capital schedule (including monthly break-down of working
capital for last three years)
Monthly financial reporting package for last five years
Detailed cost of sales breakdown
Details regarding all contingent liabilities
Summary of current federal and state tax position (including current tax basis
and net operating loss carry forwards)
Income tax returns for company and all material subsidiaries for last three
years
Accounting policies manual
Historical sales breakdown by top 10 customers for last five years
Historical pricing by product / service
APPENDIX B: SAMPLE DUE DILIGENCE LIST
Sample Due Diligence Check List
GENERAL FINANCIAL

33
Photographs and facility descriptions
Site maps / surveys
Layouts and configurations
Capacity utilization
Copies of all titles
List of all charges and liens
Copies of all lease agreements and amendments
Description of recent capital improvements
List of major suppliers
Copies of all material supplier contracts
Overview of information technology systems
Software and hardware licensing agreements
IT service agreements
Description of sales and marketing plan / strategy
Physical site tours
Legal agreements (including letters of credit
outstanding)
Closing books for all financings and material
transactions
Insurance policies, coverage and claims history
Summary of existing, pending or threatened
litigation, arbitration or investigations
Copies of all regulatory opinions
Licenses, permits, consents and authorizations
required to operate
Any correspondence with regulatory bodies
Copies of all non-disclosure / non-compete
agreements
Copies of all trademarks, trademark applications,
copyrights and registrations
Copies of all other material contracts
APPENDIX B: SAMPLE DUE DILIGENCE LIST
Sample Due Diligence Check List (cont’d)
FACILITIES / OPERATIONAL HUMAN RESOURCES LEGAL AND OTHER
Organizational chart showing reporting lines
Curriculum vitae for all senior management
personnel and executive officers
Copies of all employment contracts
Summary of employees (including location,
average length of employment, average age and
functional area)
Human resources manuals and brochures
Description of compensation framework and
bonus plans
Description of benefits and pension plans
Description of profit sharing plans
Form of outside consultant service agreement

34
APPENDIX C: DISCLAIMER
Appendix C: Disclaimer
Section 1 Middle Market M&A Update
Section 2 Middle Market M&A 101
Section 3 Middle Market M&A Key Areas of Due Diligence
Appendix A - C
35
APPENDIX C: DISCLAIMER
These materials are confidential and proprietary to, and may not be reproduced, disseminated or referred to, in whole or in part without the prior consent of BMO Capital
Markets (“BMO”). These materials have been prepared exclusively for the BMO client or potential client to which such materials are delivered and may not be used for
any purpose other than as authorized in writing by BMO. BMO assumes no responsibility for verification of the information in these materials, and no representation or
warranty is made as to the accuracy or completeness of such information. BMO assumes no obligation to correct or update these materials. These materials do not
contain all information that may be required to evaluate, and do not constitute a recommendation with respect to, any transaction or matter. Any recipient of these
materials should conduct its own independent analysis of the matters referred to herein.
BMO Capital Markets is a trade name used by BMO Financial Group for the wholesale banking businesses of Bank of Montreal, BMO Harris Bank N.A. (member FDIC),
Bank of Montreal Ireland p.l.c., and Bank of Montreal (China) Co. Ltd and the institutional broker dealer businesses of BMO Capital Markets Corp. (Member SIPC) and
BMO Capital Markets GKST Inc. (Member SIPC) in the U.S., BMO Nesbitt Burns Inc. (Member Canadian Investor Protection Fund) in Canada and Asia, BMO Capital
Markets Limited (authorized and regulated by the Financial Conduct Authority) in Europe and Australia and BMO Advisors Private Limited in India. “BMO Capital
Markets” is a trademark of Bank of Montreal, used under license. "BMO (M-Bar roundel symbol)" is a registered trademark of Bank of Montreal, used under license.
BMO does not provide tax or legal advice. Any discussion of tax matters in these materials (i) is not intended to be used, and cannot be used or relied upon, for the
purposes of avoiding any tax penalties and (ii) may have been written in connection with the “promotion or marketing” of the transaction or matter described herein.
Accordingly, the recipient should seek advice based on its particular circumstances from an independent tax advisor.
Disclaimer
All values in this document are in US$ unless otherwise specified