middle k.isl well (-'.valuation review
TRANSCRIPT

Middle K.isl Well (-'.valuation Review 11
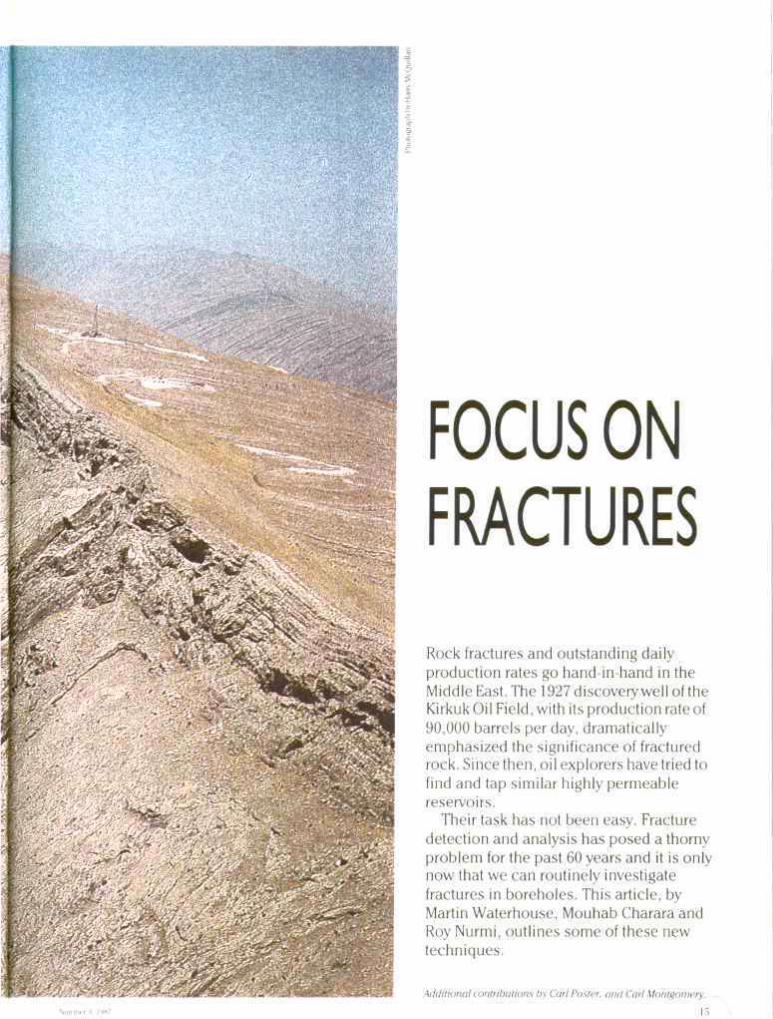
FOCUS ON FRACTURES
Rock fractures and outstanding daily production rates go hand-in-hand in the Middle East. The 1927 discovery well of the Kirkuk Oil Field, with its production rate of 90,000 barrels per day, dramatically emphasized the significance of fractured rock. Since then, oil explorers have tried to find and tap similar highly permeable reservoirs.
Their task has not been easy. Fracture detection and analysis has posed a thorny problem for the past 60 years and it is only now that we can routinely investigate fractures in boreholes. This article, by Martin Waterhouse, Mouhab Charara and Roy Nurmi, outlines some of these new techniques.
Additional contributions by Carl Poster, and Carl Montgomery.
15 Number H 1W7
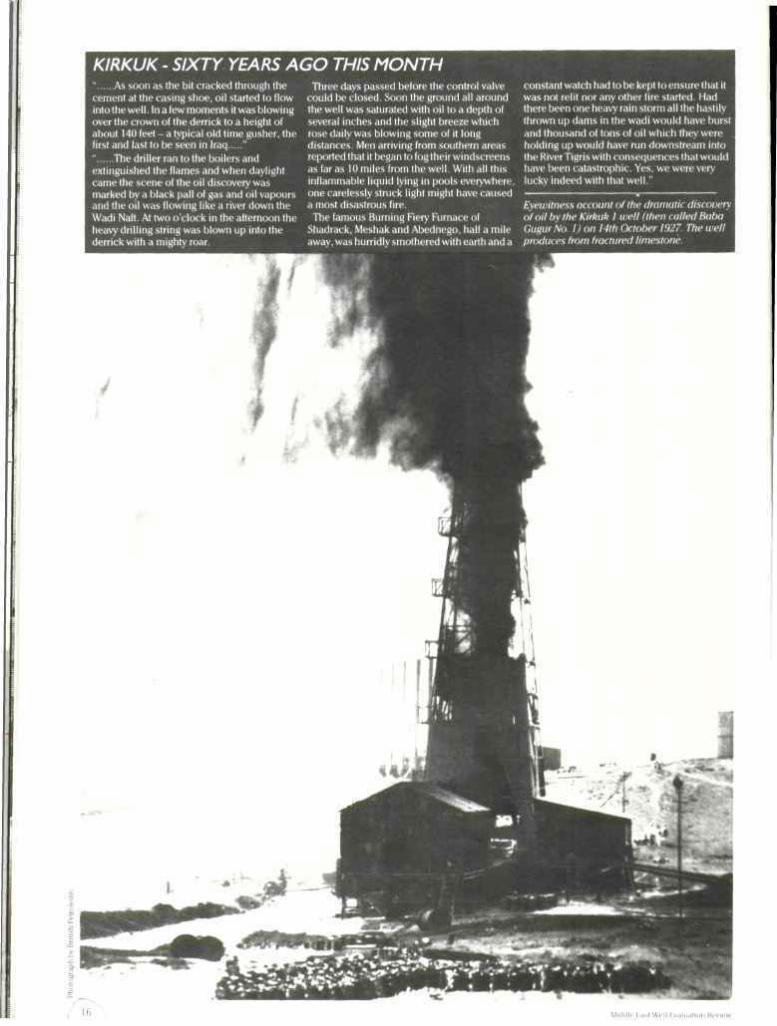
KIRKUK - SIXTY YEARS AGO THIS MONTH " As soon as the bit cracked through the cement at the casing shoe, oil started to flow into the well. In a few moments it was blowing over the crown of the derrick to a height of about 140 feet - a typical old time gusher, the first and last to be seen in Iraq "
" The driller ran to the boilers and extinguished the flames and when daylight came the scene of the oil discovery was marked by a black pall of gas and oil vapours and the oil was flowing like a river down the Wadi Naft. At two o'clock in the afternoon the heavy drill ing string was blown up into the derrick with a mighty roar.
Three days passed before the control valve could be closed. Soon the ground all around the well was saturated with oil to a depth of several inches and the slight breeze which rose daily was blowing some of it long distances. Men arriving from southern areas reported that it began to fog their windscreens as far as 10 miles from the well . With all this inflammable liquid lying in pools everywhere, one carelessly struck light might have caused a most disastrous fire.
The famous Burning Fiery Furnace of Shadrack, Meshak and Abednego, half a mile away, was hurridlv smothered with earth and a
constant watch had to be kept to ensure that it was not relit nor any other fire started. Had there been one heavy rain storm all the hastily thrown up dams in the wadi would have burst and thousand of tons of oil which they were holding up would have run downstream into the River Tigris with consequences that would have been catastrophic. Yes, we were very lucky indeed with that wel l . "
Eyewitness account of the dramatic discovery of oil by the Kirkuk I well (then called Baba Gugur No. lion 14th October 1927. The uell produces from fractured limestone.
l a , j - g
( 16 Middle East Well Evaluation Review
T his well-documented oil discovery in the Kirkuk Field highlights the importance of fractures to production rates. But a large
number of the Middle East's prolific oil fields owe their fame to fractures which have formed the permeable highways through the reservoir along which oil can rapidly migrate. If the fractures were not present, many of these well-known oil fields would not be viable.
As early as 1908, workers in the Masjid-i-Suliman Field suspected that fractures were responsible for a major proportion of the reservoir's permeability. This was the first major oil field to be exploited in the Middle East but since then, numerous important fields have been located and many of these contain a variety of fracture types.
The type and distribution of fractures depends on the geological setting, the rock's material properties and the kinds of stresses to which it has been subjected. It is difficult to provide a comprehensive summary of fracture charac
teristics in the region, but they can be categorised according to the subsurface and plate tectonic movements which resulted in the formation of fractures. Fractures in the Middle East can be grouped into three main types:
1) Fractures in orogenic fold belts
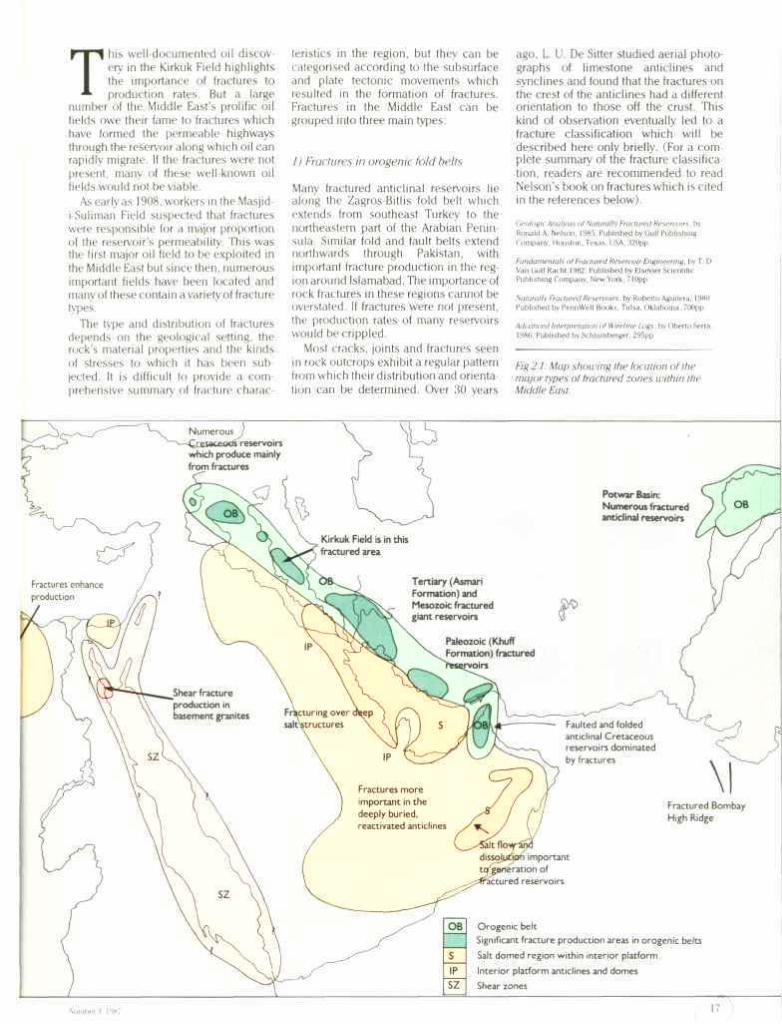
Many fractured anticlinal reservoirs lie along the Zagros-Bitlis fold belt which extends from southeast Turkey to the northeastern part of the Arabian Peninsula. Similar fold and fault belts extend northwards through Pakistan, with important fracture production in the region around Islamabad. The importance of rock fractures in these regions cannot be overstated. If fractures were not present, the production rates of many reservoirs would be crippled.
Most cracks, joints and fractures seen in rock outcrops exhibit a regular pattern from which their distribution and orientation can be determined. Over 30 years
ago, L. U. De Sitter studied aerial photographs of limestone anticlines and synclines and found that the fractures on the crest of the anticlines had a different orientation to those off the crust. This kind of observation eventually led to a fracture classification which will be described here only briefly. (For a complete summary of the fracture classification, readers are recommended to read Nelson's book on fractures which is cited in the references below).
Geologic Analysis of Naturally Fractured Reservoirs, by Ronald A. Nelson, 1985 Published by Gulf Publishing Company, Houston. Texas. USA. 320pp
Fundamentals of Fractured Reservoir Engineering, by T. D Van Golf Rachl, 1982 Published by Elsevier Scientific Publishing Company. New York, 710pp.
Naturally Fractured Reservoirs, by Roberto Aguilera. 1980 Published by PennWell Books, Tulsa, Oklahoma, 700pp.
Advanced Interpretation of Wireline Logs, by Oberto Serra, 1986 Published bySchlumberger, 295pp.
Fig 2.1: Map showing the location of the major types of fractured zones within the Middle East.
Number:!. 1987 17
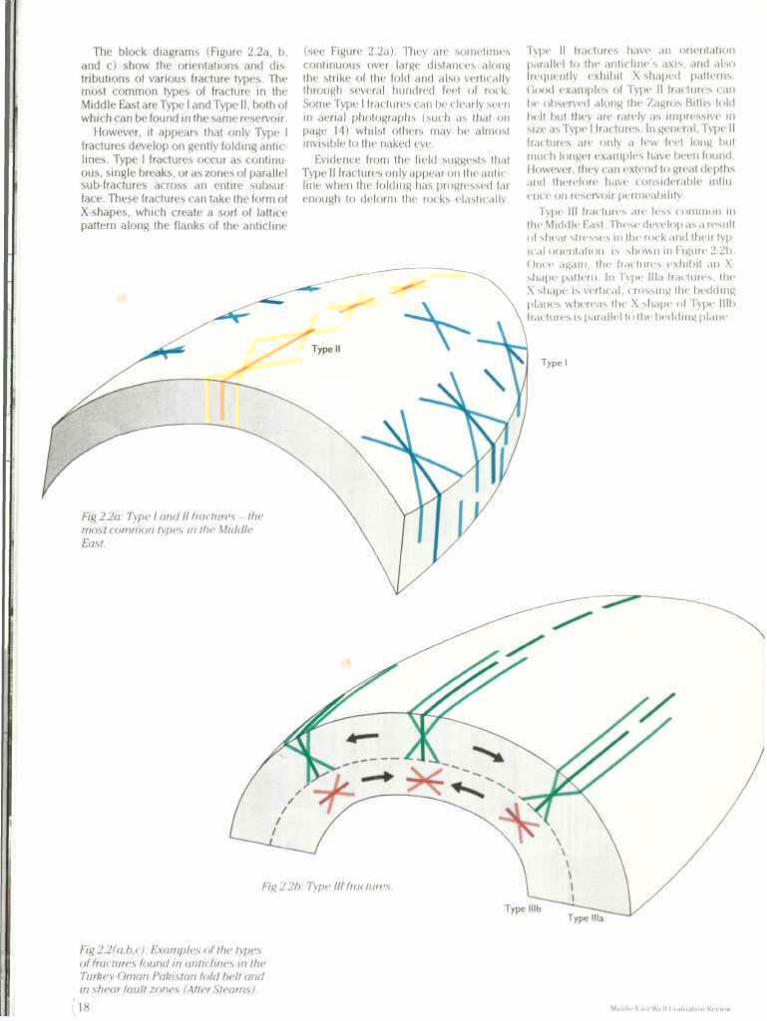
The block diagrams (Figure 2.2a, b, and c) show the orientations and distributions of various fracture types. The most common types of fracture in the Middle East are Type I and Type II, both of which can be found in the same reservoir.
However, it appears that only Type I fractures develop on gently folding anticlines. Type I fractures occur as continuous, single breaks, or as zones of parallel sub-fractures across an entire subsurface. These fractures can take the form of X-shapes, which create a sort of lattice pattern along the flanks of the anticline
(see Figure 2.2a). They are sometimes continuous over large distances along the strike of the fold and also vertically through several hundred feet of rock. Some Type I fractures can be clearly seen in aerial photographs (such as that on page 14) whilst others may be almost invisible to the naked eye.
Evidence from the field suggests that Type II fractures only appear on the anticline when the folding has progressed far enough to deform the rocks elastically.
Type II fractures have an orientation parallel to the anticline's axis, and also frequently exhibit X-shaped patterns. Good examples of Type II fractures can be observed along the Zagros-Bitlis fold belt but they are rarely as impressive in size as Type I fractures. In general, Type II fractures are only a few feet long but much longer examples have been found. However, they can extend to great depths and therefore have considerable influence on reservoir permeability.
Type III fractures are less common in the Middle East. These develop as a result of shear stresses in the rock and their typical orientation is shown in Figure 2.2b. Once again, the fractures exhibit an X shape pattern. In Type Ilia fractures, the X shape is vertical, crossing the bedding planes whereas the X shape of Type 11 It > fractures is parallel to the bedding plane.
Type I
Fig 2.2a: Type I and II fractures - the most common types in the Middle East.
Fig 2.2b: Type 111 fractures
Type lllb Type
Fig 2.2(a,b,c): Examples of the types of fractures found in anticlines in the Turkey Oman Pakistan fold belt and in shear fault zones (After Stearns).
> Mldcllr KaM Well l.v.ilii.ition Kcvn

2) Fault'related fractures
Fractures can be produced in shear fault zones of which the best examples in the Middle East can be found in the granite basement rock of Egypt's Gulf of Suez Zeit Bay and Shoab Ali fields. Major shear fault zones also occur between Turkey and Pakistan. These kinds of fractures develop the same orientation as the fault and so it is a relatively simple task to predict the direction of fluid communication within the reservoir.
Minor displacement is commonly seen in shear fractures associated with normal faulting. The resulting rock permeability and porosity depend on the planarity of the crack and the rock rigidity. Rigid rock, which often has little porosity prior to rupture, may have relatively higher permeability after fracture than more porous, plastic rock.
Wrench faults usually result in the development of tension gashes which are oriented at a high angle to the fault plane strike.
3) Salt domes and vertical uplifts
In the interior Arabian Platform, numerous anticlinal reservoirs have been created by vertical uplift. In addition, salt domes along the northern edge of the platform have caused uplift and fracturing. Although these features frequently contain fractures, they may have only a minor effect on the reservoir's overall permeability. However, in the deep Khuff and pre-Khuff formations, fracture permeability is extremely important. Fractures are also significant in the anticlinal fields of Egypt's Western Desert, in particular the El Alamein Field.
|
A MAZE OF FRACTURES: A dramatic orthogonal north-south, east-west, fracture system above the nothern portion of the supergiant G ha war Field in Saudi Arabia, being examined by Martin Waterhouse. These exposed fractures have been enlarged by surface water action.
Fig 2.2c: Fault related fractures
Number H, 1!W 19
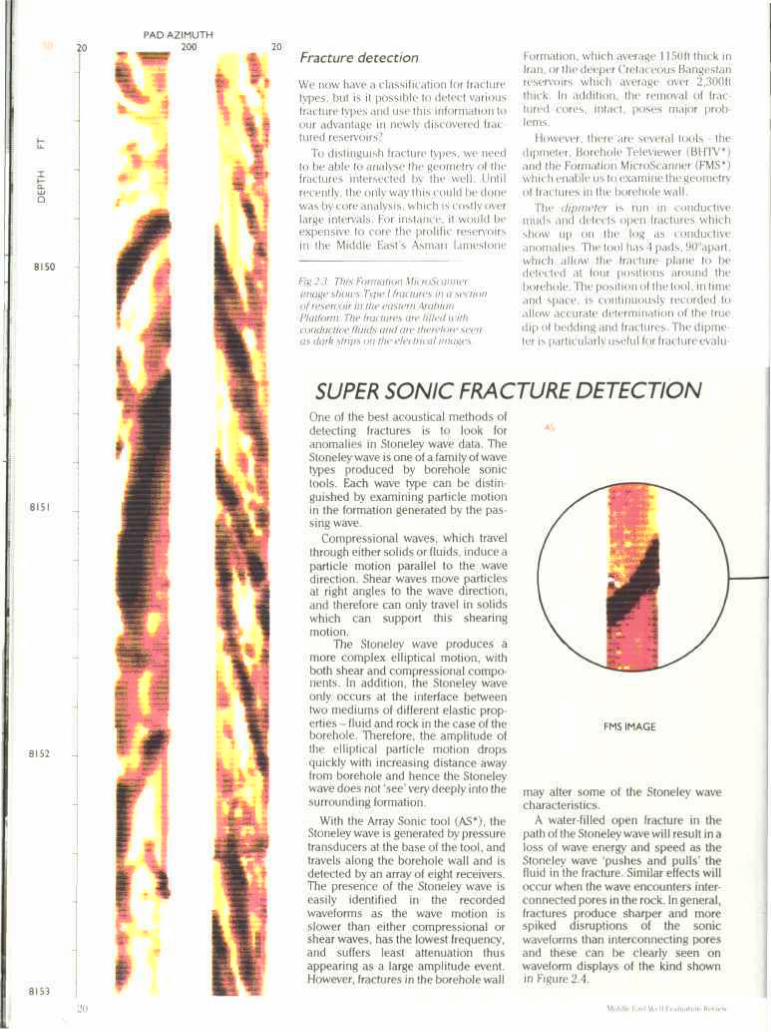
Fracture detection
We now have a classification for fracture types, but is it possible to detect various fracture types and use this information to our advantage in newly discovered fractured reservoirs?
To distinguish fracture types, we need to be able to analyse the geometry of the fractures intersected by the well. Until recently, the only way this could be done was by core analysis, which is costly over large intervals. For instance, it would be expensive to core the prolific reservoirs in the Middle East's Asmari Limestone
Fig 2.3: This Formation MicroScanner image shows Type 1 fractures in a section of reservoir in the eastern Arabian Platform. The fractures are filled u uth conductive fluids and are therefore seen as dark strips on the electrical images.
Formation, which average 1150ft thick in Iran, or the deeper Cretaceous Bangestan reservoirs which average over 2,300ft thick. In addition, the removal of fractured cores, intact, poses major problems.
However, there are several tools - the dipmeter, Borehole Televiewer (BHTV*) and the Formation MicroScanner (FMS*) which enable us to examine the geometry of fractures in the borehole wall.
The dipmeter is run in conductive muds and detects open fractures which show up on the log as conductive anomalies. The tool has 4 pads, 90°apart, which allow the fracture plane to be detected at four positions around the borehole. The position of the tool, in time and space, is continuously recorded to allow accurate determination of the true dip of bedding and fractures. The dipmeter is particularly useful for fracture evalu-
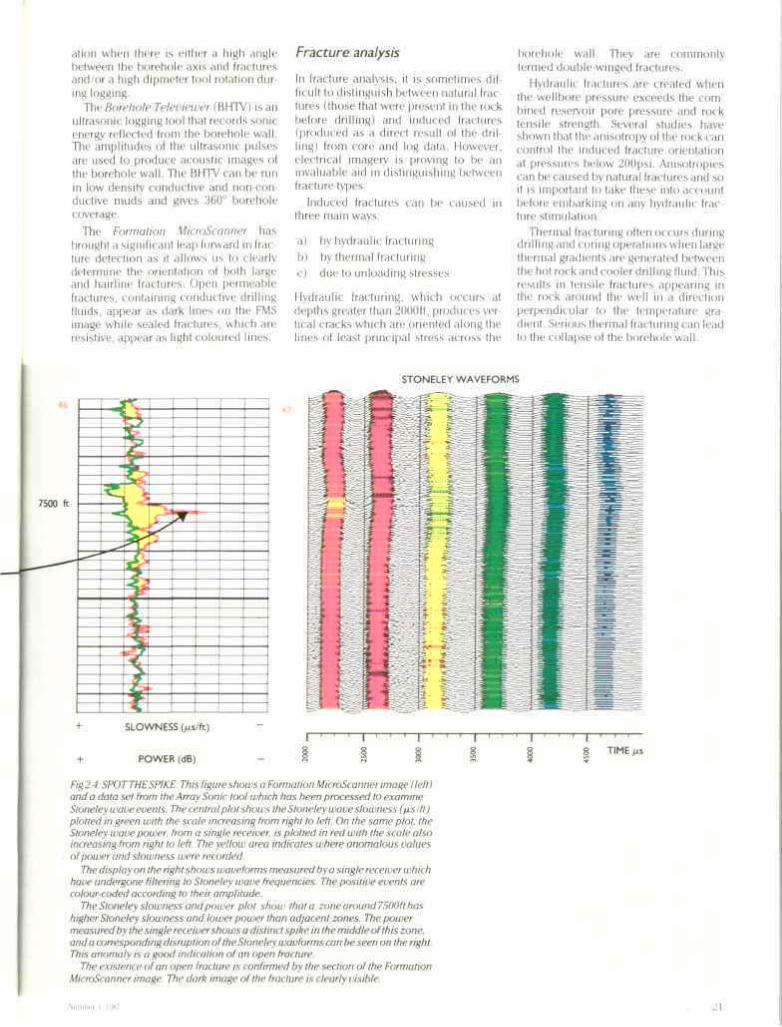
SUPER SONIC FRACTURE DETECTION One of the best acoustical methods of detecting fractures is to look for anomalies in Stoneley wave data. The Stoneley wave is one of a family of wave types produced by borehole sonic tools. Each wave type can be distinguished by examining particle motion in the formation generated by the passing wave.
Compressional waves, which travel through either solids or fluids, induce a particle motion parallel to the wave direction. Shear waves move particles at right angles to the wave direction, and therefore can only travel in solids which can support this shearing motion.
The Stoneley wave produces a more complex elliptical motion, with both shear and compressional components. In addition, the Stoneley wave only occurs at the interface between two mediums of different elastic properties - fluid and rock in the case of the borehole. Therefore, the amplitude of the elliptical particle motion drops quickly with increasing distance away from borehole and hence the Stoneley wave does not 'see' very deeply into the surrounding formation.
With the Array Sonic tool (AS*), the Stoneley wave is generated by pressure transducers at the base of the tool, and travels along the borehole wall and is detected by an array of eight receivers. The presence of the Stoneley wave is easily identified in the recorded waveforms as the wave motion is slower than either compressional or shear waves, has the lowest frequency, and suffers least attenuation thus appearing as a large amplitude event. However, fractures in the borehole wall
45
FMS IMAGE
may alter some of the Stoneley wave characteristics.
A water-filled open fracture in the path of the Stoneley wave will result in a loss of wave energy and speed as the Stoneley wave 'pushes and pulls' the fluid in the fracture. Similar effects will occur when the wave encounters interconnected pores in the rock. In general, fractures produce sharper and more spiked disruptions of the sonic waveforms than interconnecting pores and these can be clearly seen on waveform displays of the kind shown in Figure 2.4.
U i d i l l i ' K.ist W r l l K v . t l i M t H i n Rev i 20
ation when there is either a high angle between the borehole axis and fractures and/or a high dipmeter tool rotation during logging.
The Borehole Televiewer (BHTV) is an ultrasonic logging tool that records sonic energy reflected from the borehole wall. The amplitudes of the ultrasonic pulses are used to produce acoustic images of the borehole wall. The BHTV can be run in low density conductive and non-con ductive muds and gives 360° borehole coverage.
The Formation MicroScanner has brought a significant leap forward in fracture detection as it allows us to clearly determine the orientation of both large and hairline fractures. Open permeable fractures, containing conductive drilling fluids, appear as dark lines on the FMS image while sealed fractures, which are resistive, appear as light coloured lines.
Fracture analysis
In fracture analysis, it is sometimes difficult to distinguish between natural fractures (those that were present in the rock before drilling) and induced fractures (produced as a direct result of the drilling) from core and log data. However, electrical imagery is proving to be an invaluable aid in distinguishing between fracture types.
Induced fractures can be caused in three main ways.
a) by hydraulic fracturing b) by thermal fracturing c) due to unloading stresses
Hydraulic fracturing, which occurs at depths greater than 2000ft, produces vertical cracks which are oriented along the lines of least principal stress across the
borehole wall. They are commonly termed double winged fractures.
Hydraulic fractures are created when the wellbore pressure exceeds the com bined reservoir pore pressure and rock tensile strength. Several studies have shown that the anisotropy of the rock can control the induced fracture orientation at pressures below 200psi. Anisotropics can be caused by natural fractures and so it is important to take these into account before embarking on any hydraulic fracture stimulation.
Thermal fracturing often occurs during drilling and coring operations when large thermal gradients are generated between the hot rock and cooler drilling fluid. This results in tensile fractures appearing in the rock around the well in a direction perpendicular to the temperature gradient. Serious thermal fracturing can lead to the collapse of the borehole wall.
STONELEY WAVEFORMS
46
7500 ft
I "1 S i i i I !
ZJ I I SL '
LTOH u - y i
Cr'
M I • & \
x. ; H^r | \ l f\ Jjf-
Tr\ i *ii i
l I
. |
I |
I
I
+ SLOWNESS (/xs/ft)
+ POWER (dB)
Fig2.4: SPOTTHESPIKE: This figure shows a Formation MicroScanner image (left) and a data set from the Array Sonic tool which has been processed to examine Stoneley wave events. The central plot shows the Stoneley wave slowness (^slft) plotted in green with the scale increasing from right to left. On the same plot, the Stoneley wave power, from a single receiver, is plotted in red with the scale also increasing from right to left. The yellow area indicates where anomalous values of power and slowness were recorded.
The display on the right shows waveforms measured by a single receiver which have undergone filtering to Stoneley wave frequencies. The positive events are colour-coded according to their amplitude.
The Stoneley slowness and power plot show that a zone around 7500ft has higher Stoneley slowness and lower power than adjacent zones. The power measured by the single receiver shows a distinct spike in the middle of this zone, and a corresponding disruption of the Stoneley wavforms can be seen on the right. This anomaly is a good indication of an open fracture.
The existence of an open fracture is confirmed by the section of the Formation MicroScanner image. The dark image of the fracture is clearly visible.
Number H. l!W7 21
FRACTURES: THE KEY TO TURKEY'S OIL
Fig 2.5: Induced fractures often bisect the borehole vertically (as the diagram on the left indicates) and therefore appear as vertk al lines on the FMS images. Secondary fractures sometimes branch out of the main fracture (centre). The plane of the induced vertical fracture can also have an irregular shape (right).
(EYTOTURKEY'SOIL
Unloading fractures occur as a result of the reduction in overburden pressure and are found near the surface of unloading. They propagate in a direction perpen dicular to the unloading direction and can be easily identified in the wellbore or in cores.
Numerous unloading fractures occur in cores as a result of the core sample being removed from subsurface stresses. However, the same kinds of fractures do not form in the borehole wall and care must be taken when comparing FMS images with cores. Figure 2.5 summarises how induced fractures ma> appear on images.
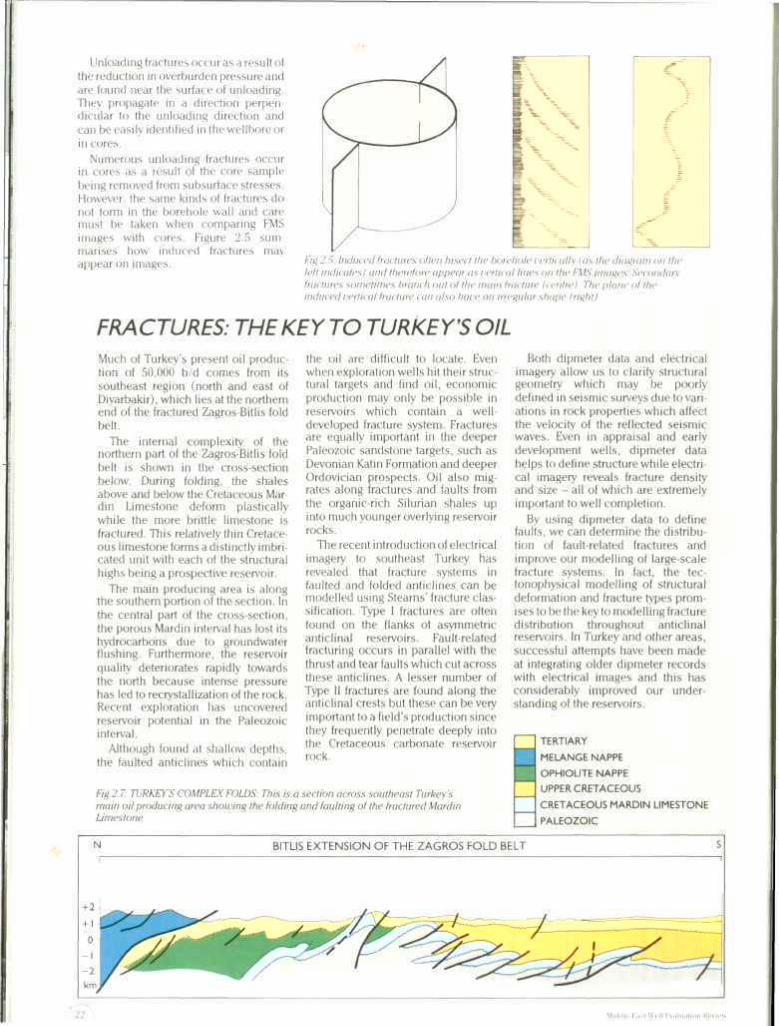
Much of Turkey's present oil production of 50,000 b/d comes from its southeast region (north and east of Diyarbakir), which lies at the northern end of the fractured Zagros-Bitlis fold belt.
The internal complexity of the northern part of the Zagros-Bitlis fold belt is shown in the cross-section below. During folding, the shales above and below the Cretaceous Mar-din Limestone deform plastically while the more brittle limestone is fractured. This relatively thin Cretaceous limestone forms a distinctly imbricated unit with each of the structural highs being a prospective reservoir.
The main producing area is along the southern portion of the section. In the central part of the cross-section, the porous Mardin interval has lost its hydrocarbons due to groundwater flushing. Furthermore, the reservoir quality deteriorates rapidly towards the north because intense pressure has led to recrystallization of the rock. Recent exploration has uncovered reservoir potential in the Paleozoic interval.
Although found at shallow depths, the faulted anticlines which contain
the oil are difficult to locate. Even when exploration wells hit their structural targets and find oil, economic production may only be possible in reservoirs which contain a well-developed fracture system. Fractures are equally important in the deeper Paleozoic sandstone targets, such as Devonian Katin Formation and deeper Ordovician prospects. Oil also migrates along fractures and faults from the organic-rich Silurian shales up into much younger overlying reservoir rocks.
The recent introduction of electrical imagery to southeast Turkey has revealed that fracture systems in faulted and folded anticlines can be modelled using Stearns' fracture classification. Type 1 fractures are often found on the flanks ot asymmetric anticlinal reservoirs. Fault-related fracturing occurs in parallel with the thrust and tear faults which cut across these anticlines. A lesser number of Type II fractures are found along the anticlinal crests but these can be very important to a field's production since they frequently penetrate deeply into the Cretaceous carbonate reservoir rock.
Both dipmeter data and electrical imagery allow us to clarify structural geometry which may be poorly defined in seismic surveys due to variations in rock properties which affect the velocity of the reflected seismic waves. Even in appraisal and early development wells, dipmeter data helps to define structure while electrical imagery reveals fracture density and size - all of which are extremely important to well completion.
By using dipmeter data to define faults, we can determine the distribution of fault-related fractures and improve our modelling of large-scale fracture systems. In fact, the tec-tonophysical modelling of structural deformation and fracture types promises to be the key to modelling fracture distribution throughout anticlinal reservoirs. In Turkey and other areas, successful attempts have been made at integrating older dipmeter records with electrical images and this has considerably improved our understanding of the reservoirs.
B TERTIARY
MELANGE NAPPE
OPHIOLITE NAPPE
_ UPPER CRETACEOUS
_ CRETACEOUS MARDIN LIMESTONE
PALEOZOIC
Fig 2.7: TURKEY'S COMPLEX FOLDS: This is a section across southeast Turkey's main oil producing area showing the folding and faulting of the fractured Mardin Limestone.
N BITLIS EXTENSION OF THE ZAGROS FOLD BELT S
Untitle K,isl Wr l lKvaluatmn Kt-vu-w 22
Geometrical anal/sis of fractures
Comprehensive analysis of a fractured reservoir involves the evaluation of the fracture frequency, distribution, length, width, morphology and orientation. The frequency, distribution and length of fractures can be easily evaluated by applying statistical approaches to information drawn from both acoustic and electrical images. The fracture morphology (whether the fractures are open, partially open or sealed) can also be seen on borehole images although the FMS is much more sensitive to such features.
Fracture width is more difficult to quantitatively evaluate and, at present, it is only possible to make general distinctions between relative sizes of fractures. However, hair-line fractures can be detected by the FMS when there is a large resistivity contrast between the fracture and surrounding rock. Calibration of FMS images with cores from a particular formation may result in a more quantitative evaluation of fracture width.
Fracture geometry evaluation tech
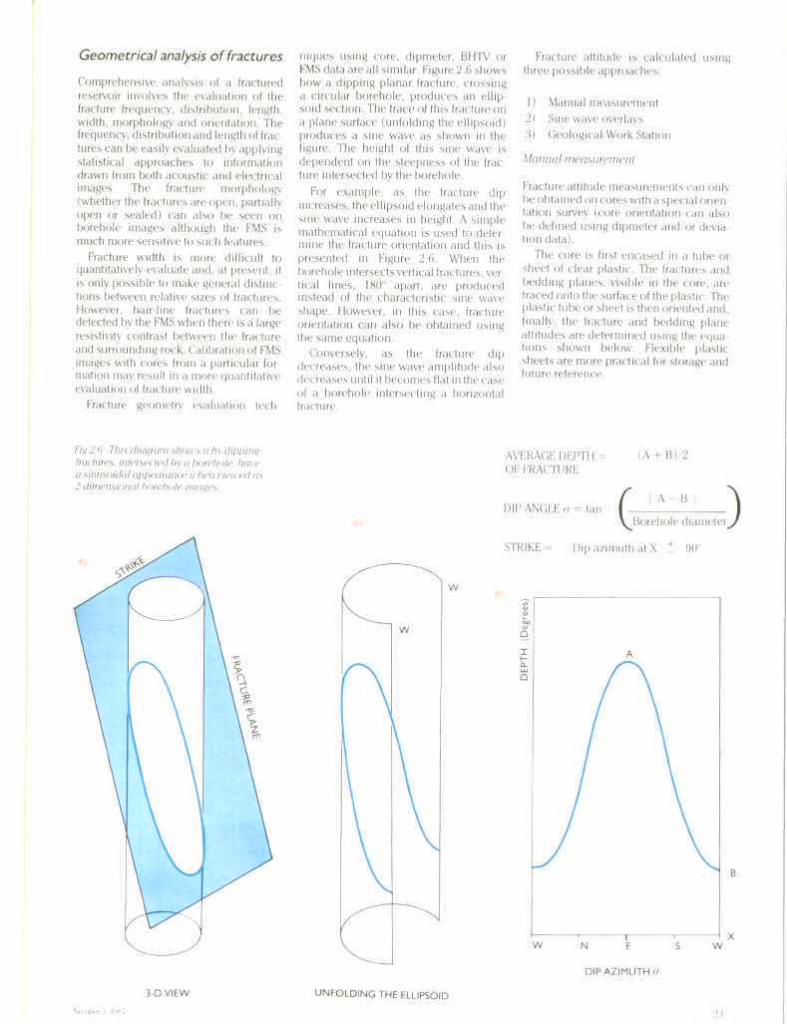
niques using core, dipmeter, BHTV or FMS data are all similar. Figure 2.6 shows how a dipping planar fracture, crossing a circular borehole, produces an ellipsoid section. The trace of this fracture on a plane surface (unfolding the ellipsoid) produces a sine wave as shown in the figure. The height of this sine wave is dependent on the steepness of the frac ture intersected by the borehole.
For example, as the fracture dip increases, the ellipsoid elongates and the sine wave increases in height. A simple mathematical equation is used to determine the fracture orientation and this is presented in Figure 2.6. When the borehole intersects vertical fractures, vertical lines, 180° apart, are produced instead of the characteristic sine wave shape. However, in this case, fracture orientation can also be obtained using the same equation.
Conversely, as the fracture dip decreases, the sine wave amplitude also decreases until it becomes flat in the case of a borehole intersecting a horizontal fracture.
Fracture attitude is calculated using three possible approaches:
1) Manual measurement 2) Sine wave overlays 3) Geological Work Station
Manual measurement
Fracture attitude measurements can only be obtained on cores with a special orientation survey (core orientation can also be defined using dipmeter and/or deviation data).
The core is first encased in a tube or sheet of clear plastic. The fractures and bedding planes, visible in the core, are traced onto the surface of the plastic. The plastic tube or sheet is then oriented and, finally, the fracture and bedding plane attitudes are determined using the equations shown below. Flexible plastic sheets are more practical for storage and future reference.
Fig 2.6: This diagram shows wh\ dipping fractures, intersected by a borehole, have a sinusoidal appearance when viewed as 2dimensional borehole images.
AVFRAGE DEPTH OF FRACTURE
(A + B)/2
DIP ANGLE a = tan
STRIKE =
V Borehole diameter^/ Borehole diameter
Dip azimuth at X ± 90°
N E S
DIP AZIMUTH 0
w
3-D VIEW UNFOLDING THE ELLIPSOID
N i i N i h e r S . lil.ST : • : • !

The geometrical analysis of fractures using dipmeter data follows a similar procedure. An open, dipping fracture, appears as a conductive anomaly on the micro-resistivity curves. If these anomalies are connected, they form a sine wave which can be used to determine fracture orientation. Care must be taken in analysing deviated well data as the angle of deviation (borehole drift) needs to be removed in order to obtain true dip. The FMS and BHTV are particularly useful as they provide continuous images which make it easy to distinguish between different fracture sets.
Sine wave overlay technique
This is another manual technique for determination of fracture dip and strike but instead of using equations in the analysis, the process is simplified by applying sine wave overlays. These are transparent sheets of plastic upon which are drawn calibrated sine waves. The plastic overlay sheet is placed around the core or on top of the images (see photo graph) and the sine wave which best fits the fracture pattern is chosen. The dip magnitude and fracture orientation are then easily obtained from the calibrated sine wave. As the calibrated sine waves are constructed assuming planar fractures and perfectly cylindrical boreholes, slight adjustment is needed if the fractures are not perfectly planar. In addition, the computed dip needs to be corrected for borehole drift.
Geological Work Station
This is the most recent technique applied to fracture analysis and probably gives the most accurate results. The Geological Work Station comprises a computer and tailor-made interactive software with which it is possible to map and interpret the borehole trace of any feature. The Geological Work Station can be used to analyse features such as fractures from open-hole logs, dipmeter data and FMS images. The Work Station software automatically computes a true fracture dip after first accounting for tool and borehole geometry and deviation.
A further advantage of the Geological Work Station is its so-called Expert System Programming Technique which acts as a kind of artificial intelligence, guiding the user on how best to interpret geological structures. Geological Work Station analysis has increased the speed at which fractures can be interpreted and, for the first time, has made routine analysis possible
The program logic of the Geological Work Station has similarities with the sine wave overlay technique in that it assumes the events, including fractures, are planar. The Work Station user first loads the borehole data and scrolls
through it until a fracture is displayed on the terminal screen. The computer software can then be used to enhance the data and an appropriate vertical exaggeration can be made. The user marks the fracture trace on the images by using a screen cursor (mouse).
Figure 2.8 shows a dip computation on FMS images of a layered carbonate sequence in the Middle East. Two fractures can be seen between 2517.5ft and 2518.0ft and the thin grey layers corres pond to argillaceous limestone. The dip of the upper fracture could not be calculated because it was only observed by one pad. The fracture should be detected on two pads for a precise geometrical analysis, which is the reason why more than one run is usually carried out in fractured formations.
Using the Geological Work Station, the dip of the fractures and argillaceous layers were calculated. The user simply marks the thin layers and fractures by using the cursor. The Geological Work Station then generates a best fit plane to
the marked events and computes their true dips. The computed dips are displayed at the point where the fracture and bedding plane intersect the borehole axis. In the second approach, the Geological Work Station generates several possible planes which fit the events and the user chooses the best fit curve.
24 Middle Kast Well (-'.valuation Review
6.00 16.00 0 10 20 30 40 50 6070890 700
2517
2518
2519
2520
2521
2522
6 . 0 0 1 6 . 0 0 C2.002
6 . 0 0 1 6 . 0 0 C I . 0 0 2
2517
2518
2519
2520
2521
2522
MSD-4.0x2 .0 90 700
%r - N r *
v m
s. * „ '•.^....*»":!lSf
ra*^
9MiMM:!:\::i
i iWl ' iH^
0 0.20.00 (1(234 56.901 M327
rimniiiiii^i:::i::|IM|a
if'
"£*»»£*:;,;.
imtfc _ •••mtftffll
«MWMMMMAJI
'"- 18
0. 00 20.00
D-4.0X2I 2512
2514
2516
2518
2520
2522
2524
2526
2528
2530
2532
2534
2536
2538
2540
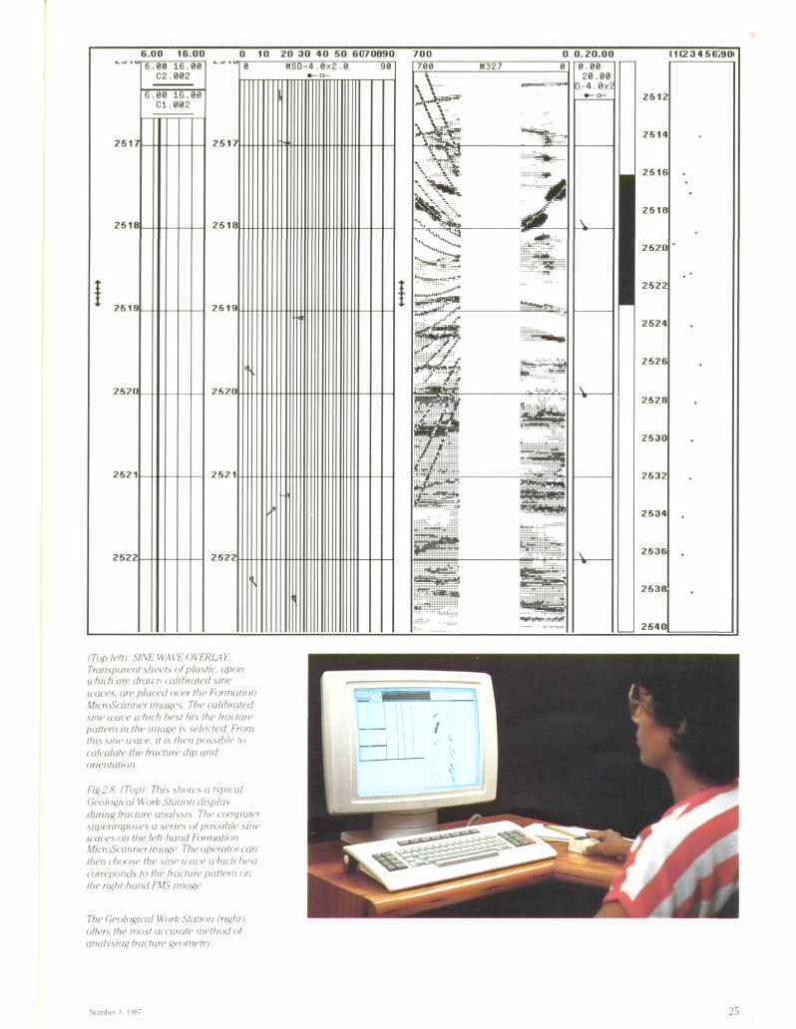
(Top left): SINE WAVE OVERLAY: Transparent sheets of plastic, upon which are drawn calibrated sine waves, are placed over the Formation MicroScanner images. The calibrated sine wave which best fits the fracture pattern in the image is selected. From this sine wave, it is then possible to calculate the fracture dip and orientation.
Fig 2.8: (Top): This shows a typical Geological Work Station display during fracture analysis. The computer superimposes a series of possible sine waves on the left-hand Formation MicroScanner image. The operator can then choose the sine wave which best correponds to the fracture pattern on the right-hand FMS image.
The Geological Work Station (right), offers the most accurate method of analysing fracture geometry.
Number 3, 1987 2.r»

Depth GR/ Borehole Volume
SDT Data Formation Analysis by Volume
8600
8640
Gemma Pay
CVC?
W Anhvdrlt« I tm«i tone Dolomllo Poro«(ty
BIT SIZE —T
Hydrooarbon Wator
lOO % O
FMS Fractures
No. Of Frec1ure«/Ft O TOT
FRACTURE WIDTH
r~w'<Jth~i B S M H
B - Breccia S - Significant M - Medium H - Hairline
S
Fig. 2.9: A FRACTURE SUMMARY: A combination of a fracture summary log (right hand column) and otfier logging information helps us to improve our understanding of the origin and significance of fractures. The fracture summary indicates the number of fractures per two-foot interval and their relative width as revealed by the electrical imagery.
As the fracture summary is used in designing the completion program for a well, it is often combined with a GLOBAL * display - a computer analysis of lithology, porosity, and fluid content. In this log, the fracture summary and GLOBAL are combined with the Gamma Ray curve for correlation and a plot of the borehole geometry, which is showing a good, circular borehole over this interval. In addition, we have combined a display of the Stoneley wave data of this fractured Cretaceous source rock zone.
21 i Mi.Mir K,isl Well Kv.iln in KI-VICV
What use is fracture data?
Borehole images now allow the density and width of fractures to be determined within the borehole and this kind of information is currently being summarized in fracture logs of the type described in Figure 2.9. But what use are such fracture summaries?
Fracture logs are of great significance in well completion where it is essential to know the fracture system, fracture spacing and orientation.
The electrical images also provide information on the reservoir and other geological properties that control the character and distribution of fractures, such as shale beds.
Fractures and the future
As confidence in fracture detection and analysis grows in the petroleum industry, more emphasis is being placed on the modelling of fracture distribution within a reservoir. Such information is proving to be a valuable guide to the positioning, testing and completion of new wells.
Even now, some wells are being deviated at an angle which causes the borehole to intersect the greatest number of fractures and so enhance production.
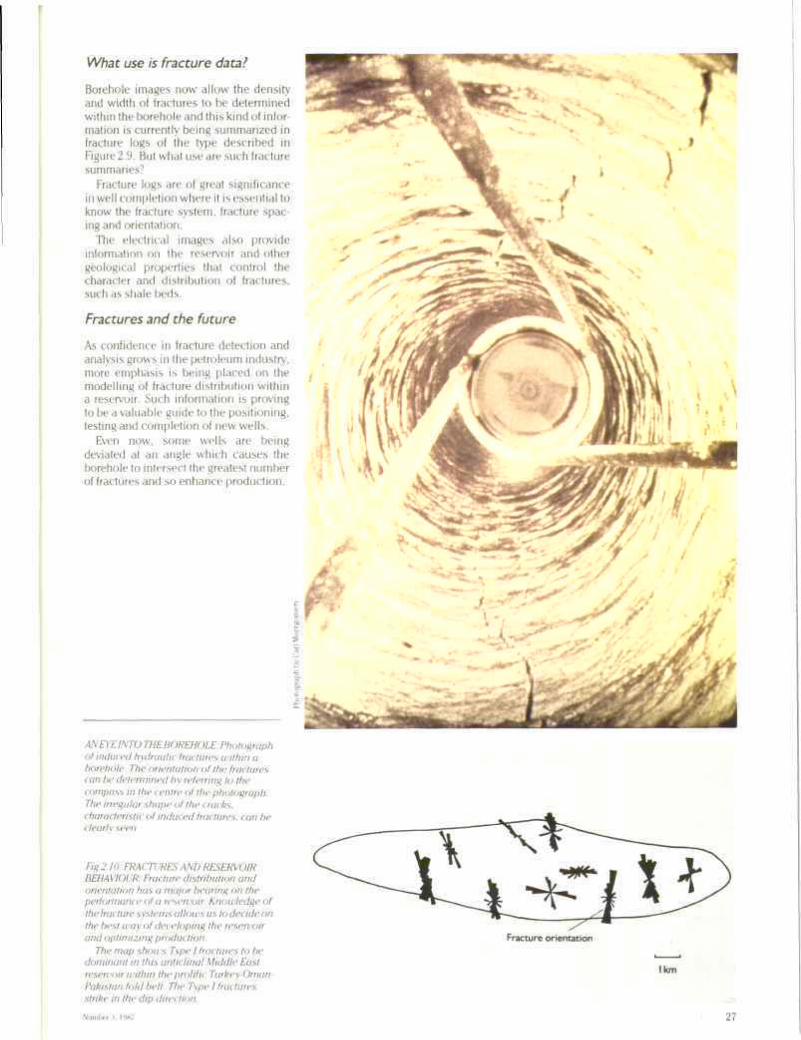
AN EYE INTO THE BOREHOLE: Photograph of induced hydraulic fractures within a borehole. The orientation of the fractures can be determined by referring to the compass in the centre of the photograph. The irregular shape of the cracks, characteristic of induced fractures, can be clearly seen.
Fig 2.10: FRACTURES AND RESERVOIR BEHAVIOUR: Fracture distribution and orientation has a major bearing on the performance of a reservoir. Knowledge of the fracture systems allows us to decide on the best way of developing the reservoir and optimizing production.
The map shows Type I fractures to be dominant in this anticlinal Middle East reservoir within the prolific Turkey-Oman-Pakistan fold belt. The Type I fractures strike in the dip direction.
Number:*. 1987
Fracture orientation
I km
27