middle class in brazil and the current economic and ... · middle class in brazil and the current...
TRANSCRIPT
Middle class in Brazil and the current economic and political crisis
Preliminary version
Alexis Saludjian, Eduardo Costa Pinto
GAMA - IE/UFRJ
This article deals with the theme of the New Middle Class (NMC) and of the growth regime in
Brazil since 2003. The "New Medium Class" resulting from income redistribution and cash transfer
program (Bolsa Familia) since 2003, would represent, according to some economists, more than
half of the Brazilian population (in 2010). This NMC, some economists argue, would enable to
define a new regime of growth and a new development model. We will present the methodology
and analytical framework that define the New Middle Class in Brazil and we will highlight some
theoretical and statistical limitations of such a point of view. To understand the growth regime in
Brazil, it is indeed necessary to integrate the productive dimension to the vision of the NCM. The
specificity of Brazil's economic and political history, its present status within the new international
division of labour and the financialization of its economy are factors that are worth being taken into
consideration to better understand the economic difficulties and the recent political tensions in
Brazil.
1. Brazil, a middle-class country?
Among the factors responsible to poverty reduction and to the decline on inequalities in income
distribution, the evolution of the employment is worth analysing1.
1.1. Employment (volume, delivery), minimum wage, Gini coefficient
A. Employment
The first element that has to be taken into consideration to understand the debate on the new
middle class is the evolution of employment in Brazil since 2003.
1 “Until the beginning of the 2000s, Brazil was one of the most unequal countries in the
world, displaying a considerably high incidence of poverty: in 2001, the country’s Gini index was
0.60, while 59 million Brazilians were affected by poverty and 25.5 million people lived in
conditions of extreme poverty. During the 2000s, social indicators showed significant improvement,
and by the end of the decade, a remarkable shift in poverty and income inequality was seen. In
2012, 30.4 million Brazilians were considered poor while extreme poverty touched 10.1 million
individuals, and the Gini index decreased to 0.532. The reduction in poverty as well as the
improvement on income distribution—both unparalleled in Brazilian history—are attributable to a
number of events such as the several social policies adopted in the period, and the growth
experienced by the Brazilian economy during the first decade of the 21st century. “NOPOOR
project, (Castilho, Saludjian, 2016). http://www.nopoor.eu/download/file/fid/1027

Figure 1: Evolution of the unemployment rate by “social class”
The formal employment rate has also increased since 2004.
Figure 2: % of employments in the formal sector in relation to total employment (with labour
rights guaranteed by Law and employment with labour rights guaranteed by Law, capitalists,
military forces, public servants and self- employed contributing to the retirement by distribution)
seasonally adjusted
One of the main reasons to elucidate the reason why the evolution of employment (especially
formal, but not exclusively) has been so important is the evolution of the minimum wage (MW)2.
Figure 3 - Evolution of the real minimum wage - 1995/2014
Source: (Saboia, Hallak, 2016)
Obs: Average values of the year, deflated by INPC / IBGE. Constant values of July 2015.
2 See Saboia/ Hallak, 2016. http://www.nopoor.eu/download/file/fid/1017

Source: Ipeadata / IPEA
B. Income distribution.
The reduction of income inequality in Brazil since 2000 (ie before the inauguration of President
Lula in 2003) was hailed around the world, as shown in the graph below.
Figure 4:
Source: (Castilho, Saludjian, 2016) based on IPEA (PNAD/IBGE)
Moreover, as the graph below shows (Saboia, Hallak, 2016), the increase of income
associated to pensions, cash transfers (such as the BPC, Benefício of Prestação Continuada),
but especially the improvement of income from work, are all factors that explain the
improvement of income distribution in Brazil since 2004. Figure 5:
Source: Saboia, Hallak, 2016.
Notes: from to bottom: Retirement, pensions, BPC, wages, aggregated result, transfers
All these elements have led economists specialized in the distribution of income and in an
approach of social strata from income (M. Neri, 2010) to discuss the emergence of a "new middle
class" (class C) determined by the level of income per month. The emergence of this discussion is
associated to the period before the end of the second term of President Lula (2008-2010).
According to these studies, almost half of Brazilians belong to this new middle class. The
following paragraphs outlines some points of this discussion.
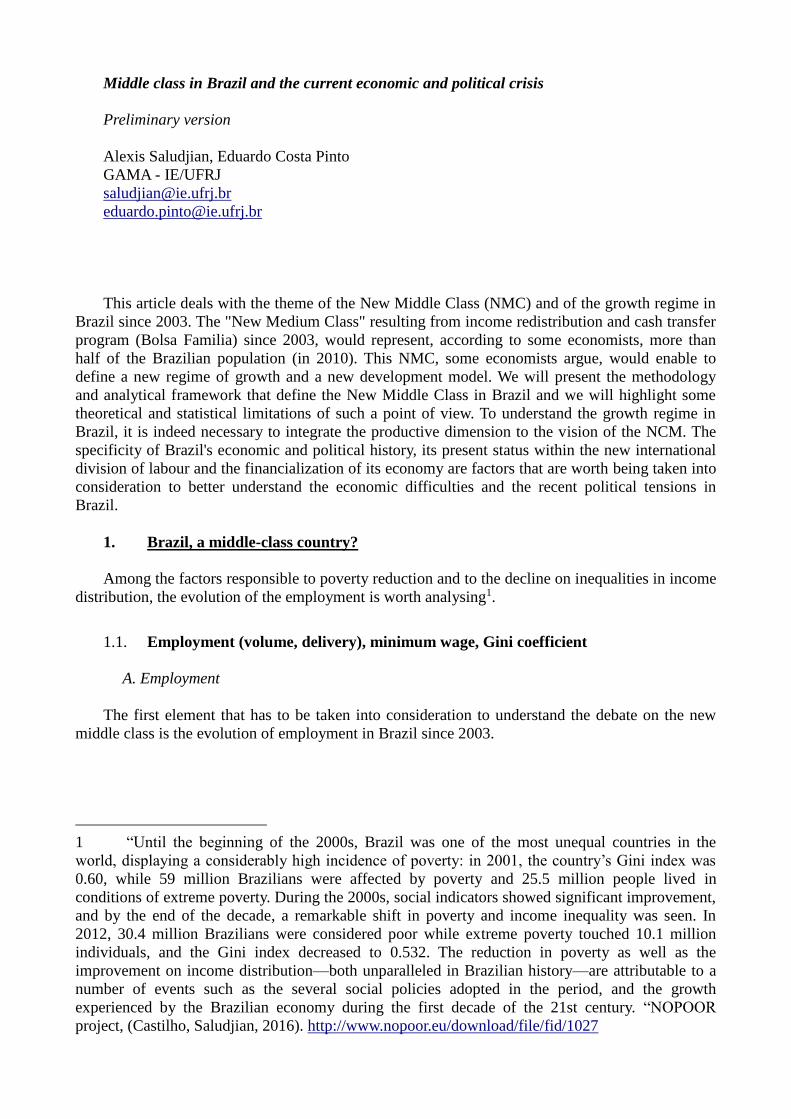
C. "New middle class"
Figure 6:
Thresholds in order to classify households into different “social classes” depending on
their average monthly wage (in R$ in Nov. 2015)
Source: Bradesco, 2016.
Obs: Monthly household wage (as in Nov. 2015)
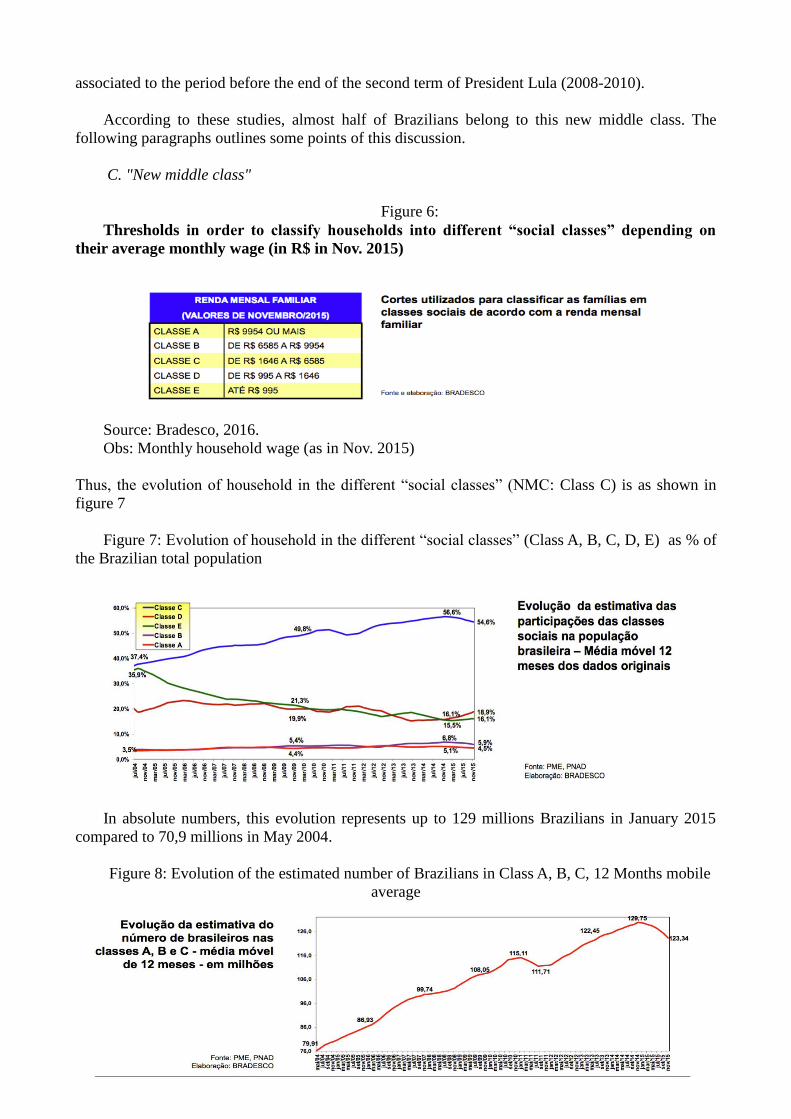
Thus, the evolution of household in the different “social classes” (NMC: Class C) is as shown in
figure 7
Figure 7: Evolution of household in the different “social classes” (Class A, B, C, D, E) as % of
the Brazilian total population
In absolute numbers, this evolution represents up to 129 millions Brazilians in January 2015
compared to 70,9 millions in May 2004.
Figure 8: Evolution of the estimated number of Brazilians in Class A, B, C, 12 Months mobile
average

D. Wages:
It is appropriate to adopt a cautious attitude with this definition of "new middle class". As
many economists (Salama, 2013 or Pochmann, 2014) note, the classification of "middle class" can
not be reduced to the simple ability to consume (see section 2 of this article). Indeed, according to
selected criteria (strict thresholds or not) the vision of this "new middle class" changes radically
(Salama, 2013).
Even the valuation of the minimum wage, that has an important impact through the labour
market, can be relativized. Indeed, the DIEESE research group (Departamento de Estatística e
Estudos Instersindical Socioeconômicos, linked with trade unions) defines the minimum wage from
changes in the cost of buying a basket of basic foods3. The official Minimum Wage is decreed by
the State to ensure constitutionally the expenses of a worker and his family in terms of food,
housing, health, education, clothing, hygiene, transportation, leisure and retirement .It is adjusted by
Decree to compensate, at least under the governments of the Workers Party, inflation (see the work
of J. Saboia). Comparing the official Minimum Wage and the Minimum Wage calculated by the
DIEESE, We would find in March 2016 the first as R$ 880.00 against by R$ 3,726.00 by the second
or a ratio of 1 to 4. (See graphs below)
Figure 9: Difference between the official minimum wage and the minimum wage calculated by the
DIEESE
Source: Gomes, 2016, DIEESE.
Figure 10: Monthly difference between Official minimum wage and the minimum wage
calculated by DIEESE
Source: Gomes, 2016, DIEESE.
3 http://www.dieese.org.br/analisecestabasica/salarioMinimo.html

Figure 11: Distribution of the population aged 15 or older by the pay range.
Source: Gomes, 2016
This point is important because more than half of the population over 15 years in Brazil
receives up to two minimum wages, or R $ 1,720.00 per month (see Gomes, 2016 based on figures
from the PNAD ).
Figure 11: Monthly difference between Official Minimum wage and the DIEESE Minimum
Wage
Source: Gomes, 2016, DIEESE.
This worrying panorama, despite the appreciation since 2003, is leading some economists to
discuss the persistence of a larger exploitation in less developed countries, and to mobilize the
debate about the over- exploitation of the labour force ( Luce, 2013).
These impressive evolutions had a great political impact for the 2010 Elections won by
President Dilma Rousseff (after two terms - 4 years each from January 1st until December 31st of
President Lula in 2003-2006 and 2007-2010).
The concept of New Middle Class has been widely discussed in Brazil and internationally,
however, the “new middle class concept” is also worth criticizing.
2. Debate on NMC in Brazil:
First, we present some critical arguments of the concept of "new middle class" mostly in

reference to the discussion, already old, of the middle class in developed countries (2.1). We will
analyse in the last sub-section whether the "new middle class" in Brazil managed to boost its
growth regime and whether this development model proved to be steady, fair and effective over the
period.
2.1. 'New middle class', financialized accumulation regime and the new International
Labour Division The discussion on growth or development models dates back to the pioneers of development as
W. Rostow in the immediate post World War II. Countries should expand themselves by following a
number of development stages (five in his book of 1950) to achieve mass consumption of the
middle classes and social well-being. This vision of "gradualism" was widely distributed to
developing countries (during decolonization post 1945) but also to countries in search of a
politically stable and economically legitimizing development policy. Few countries or economies
have actually followed these steps but the idea of a development allowing the majority of the
population to have access to mass consumer goods and social welfare has greatly influenced the
minds of decision makers and political economists (mainly orthodox but not exclusively). The
developed capitalist countries experienced a prosperous period (1945-1970) during which the wage
growth rate exceeded the growth in labour productivity and was named as the golden age of
capitalism perpetrators of post- Keynesians ("30 Glorious Years" in the words of J. Fourastié).
These middle classes in skilled jobs related to productivity growth and industrialization could count
on a welfare state which was often related to a series of quality public services (health, pensions,
education, infrastructure, transportation, innovation, etc ...).
In developing countries, especially in countries that have promoted industrialization (for import
substitution as in the case of some Latin American countries like Brazil, Argentina or Mexico in
particular under the intellectual sponsorship of the ECLAC), a middle class (medium - high) has
actually emerged. This middle class was reduced to a small parcel of the population, containing in
particular public officials (including military). The vast majority of the population continued to live
in underdevelopment (although we can not discuss here this particular point): the economy was
dualistic and could be characterized by strong social and structural heterogeneity (Saludjian, 2010) .
Public services benefited primarily to the Medium- High class while the vast majority of the
population survived in poverty, without access to employment, and did not have basic public
services (Pochmann, 2014) and (Salama, 2013).
The debt crisis of the 1980s and the neoliberal structural adjustment policies4 have generated a
new round of poverty and destruction of essential public services (Salama, Valier, 1994). The
legitimacy of neoliberal policies has faltered throughout Latin America in the early 2000s and there
has been a new political cycle called "progressive" in much of Latin America1 (Argentina, Brazil,
Venezuela, Chile, Uruguay, Paraguay, Ecuador, Bolivia). Lula's ascension in Brazil is part of this
cycle.
The new international division of labour, the China's economic boom (first partner of Brazil
and many other countries of the region since the mid-2000s), and the super-cycle commodities via
Chinese demand, (see figure below) all of them went hand in hand with focalised and conditional
social policies, cash transfers, a revaluation of the minimum wage, establishing a pension plan /
pension for poor farmers (see Lavinas).
Figure 12:
4 To be more exact, neoliberalism has developed since the 1960s, 1970s in Latin America with the policies of military
governments in Brazil and especially with Chilean dictator Pinochet and the Chicago boys, and Argentina from
1976. See Carcanholo 2010.

Source: BBVA, 2015.
These social policies have been developed for a modest cost; The Bolsa Familia is about 1% of
GDP against nearly 10% of the cost to pay the debt service and interest payments. It is also
important to consider the specialization in the global economy by reprimarisation and insertion in
less dynamic sectors of global value chains. Another point of interest is to observe the de-
industrialization of the Brazilian economy (Salama, 2016).
The charts below give an idea of the extent of de-industrialization.
Figure 13 : Transformation industry production by technological intensity and trade balance
of each segment 1995- 2013
Apud Salama ,2016
Figure 14 : Evolution of industrial production, 2002 = 100, 2002 to January 2016

Source : Carta IEDI, n°722, 2016, àfrom the IBGE monthly survey, seasonally adjusted (Apud Salama, 2016)
Figure15: value composition (VA) at current prices, according to macro sectors (in%)
note: agricultural/ industry/services Source Squeff, 2013
Figure 16: Composition of employed persons, according to macro sectors (in%)
Source : Squeff, 2013 Note: agriculture/industry/ services
Productivity has not experienced a very positive development in the years 2000. IPEA-the
ECLAC study indicates stagnation and inability to replicate the transformation that took place in

1950-1960.
The great transformation takes place in the years 1950-1970 with a skyrocketing average
productivity levels of labour in all sectors, except agriculture. The 1980-1990 years of crisis had a
very negative impact on the average productivity when compared to the 1970s. Since 2000, the
agriculture (agro-business because of the reprimarisation of the economy) and services sectors (
whose jobs are low-skilled in majority, see Squeff, 2013) increased their productivity pulling up the
average total productivity.
Figure 17: Evolution of average labour productivity, according to macro sectors (in thousand
constant R$ in 2000)
Source: Squeff, 2013.
Note: agriculture/industry/ services/total
In the industrial sector, productivity has been stable since 1998 before starting to fall slightly
from 2007 (deindustrialization).
The following chart compares the ratio between the average labour productivity for each
macro-sector, and the average labour productivity of total employment.
Figure 18 : Ratio of the average labour productivity of the macro sector and the average labour
productivity of total employment

Source: Squeff, 2013
The drop is dramatic for the services sector.
The industrial sector is experiencing a drop until 1990 and then a slight improvement (because
of downsizing and plant closures, see J. Katz ECLAC, 2001). Since then, the ratio of industrial
productivity on the average total productivity stagnated until 2004 before dropping (the last year of
the study is 2009). There is a safe bet that the crisis since then did not improve the situation, but the
contrary.
Figure 19: Evolution of average labour productivity, according to productivity levels (quartiles)
(in thousand constant R$ in 2000)
Source: Squeff, 2013
Figure 20: Composition of jobs according to productivity levels (quartiles) (in%)
Source: Squeff, 2013
The growth regime in Brazil during the 2000s can therefore be characterized by
deindustrialization and stagnating productivity gains. These macro-structural phenomena are
combined in the case of Brazil with a partial reduction of inequalities (income only), a valuation of
the minimum wage in the formal sector (although as discussed the minimum wage is largely under
estimated), cash transfers, pensions for the poorest.
The conclusion is that we are far from the structure related to the emergence of the middle class
during the Golden era boom in developed countries (industrialization, productivity gains,
qualification).
Export growth has not led a virtuous effect on employment in terms of volume in Brazil

(around 10% of the direct and indirect employment) or quality (Castilho, Saludjian, 2016)) unlike
the countries of Asia. (Salama, 2012: early industrialization in Asia and deindustrialization in Latin
America).
When one observes the investment growth rate and knowing that the rate of the Gross Fixed
Capital Formation (GFCF) as a proportion of GDP has reached around 20% of GDP during one or
two years before falling to 16 or 17% today, we also understand the magnitude of the crisis in
Brazil5 :
Table 2: Growth rate of investment in%
3° trim. 2008 3° trim.2009 3°trim.2010 4°trim.2012 1°trim.2014 4°trim.2015
14.4 -4.1 19.5 0.8 6.1 -14.1
Source IBGE Note: Accumulated over 4 quarters percent, seasonally adjusted One of the characteristics of Latin American economies is structurally and historically high
inflation (phenomenon studied an original way by the authors of ECLAC in the 1950s, see the
discussion of inertial inflation). The graph below shows that if the period of the Real Plan (1994)
experienced a low inflation level, there is a clear rise tendency since 2014, 2015.
Figure 21 : inflation, stock prices and administered prices
Apud, Salama 2016.
Used sometimes to justify also historically and structurally high interest rates (mainly the rate
benchmark interest of the Central Bank - SELIC), the fight against inflation justified the adoption of
monetary policy since 1994 based on an inflation target (inflation targeting) controlled by the very
high interest rates and handling two other orthodox macroeconomic policies elements: flexible
exchange rate (to adjust the external accounts) and an increasing primary surplus (to contain public
debt).
The level of the base rate (SELIC) made Brazil a financialized economy (Salama, Chesnais and
chart below).
Figura 22:
5 See Costa Pinto E. et alii for a detailed study of the Political Economy with the Wokers Party Presidencial period
(from 2002 on).
http://www.ie.ufrj.br/images/pesquisa/publicacoes/discussao/2016/TD_IE_004_2016_COSTA_PINTO_et_al.pdf

This financialization of the Brazilian economy has a major impact on debt service spendings
that reached in 2016 nearly 10% of GDP! This represents nearly 45% of the budget of the Brazilian
Federal State (even if part of it is swapped by the Treasure for Bonds). See the chart below of the
Audit of Debt
Figure 23: Distribution of the budget of the federal state in 2014
Source : Senado Federal- sistema Siga Brasil, elabouraçao : Cidada da divida, M.L. Fattorrelli et R.Avila
In the budget of the federal state in 2014, only 3.75% are for education, and 3.98% for health
comparing to nearly half for the payment of debt service.
This last point brings us to discuss in the next section of the welfare state in the Periphery
Liberal Model (PLM) (see Filgueiras, et alii).
2.2 Welfare state in Brazil
Another major difference between the case of the middle class in developed countries and
developing countries is the availability of essential public services in developing countries and
specifically in Latin America and Brazil. The State proposed and built imperfect and fragmentary
public services for a population reduced to medium-high classes (from industrialization and civil
servants) (See César Giraldo, Salama 2010 and 2012 on the State). This traditional middle class
(high segment) was not dependent on public essential services as the misnamed current "new
middle class" . Now that population (NMC) has acquired a purchasing power (without going into
the details on what kind of consumption), it has a fundamental need for basic public services:

education, health, transport and health infrastructure. All these services have historically failed to
attend the needs of the population in a satisfactory way in Brazil and in many other Latin American
countries.
The crisis of 1980/1990 and neoliberal policies used to privatize the public services have
been terrible for all those yet critical sectors. The privatization of these utilities yet (to "reduce state
spending and ensure " macroeconomic stability " via orthodox monetary policies) have made these
services unaffordable for this part (NMC) of the population. They are able to consume (and have a
job in low qualified jobs), none the less they remain confined to a level of lower middle class
curling with poverty (defined by the government in monetary terms only). These services are also
about to be unaffordable for traditional high Medium-class that is also affected by inflation and by
the austerity policies. These elements can explain their growing exasperation.
IN 2014, nearly 9% of the Brazilian population did not study for at least one year and almost 30%
less than 5 years and over 50% less 8 years. The situation has certainly improved since 2003 but
still very slowly.
Figure 24: 10 years old or older % of the total population, by number of years of study
Even though we remain critical vis-à-vis this classification, the figures for 2014 show that
nearly 95% of individuals in classes D and E (up to R$ 1,646.00 nearly two official Minimums
Salaries) attended up until the middle school level (education to 6 years and it is compulsory up to
16 years). Still 48% of the E and D classes did not finished primary school in 2014.
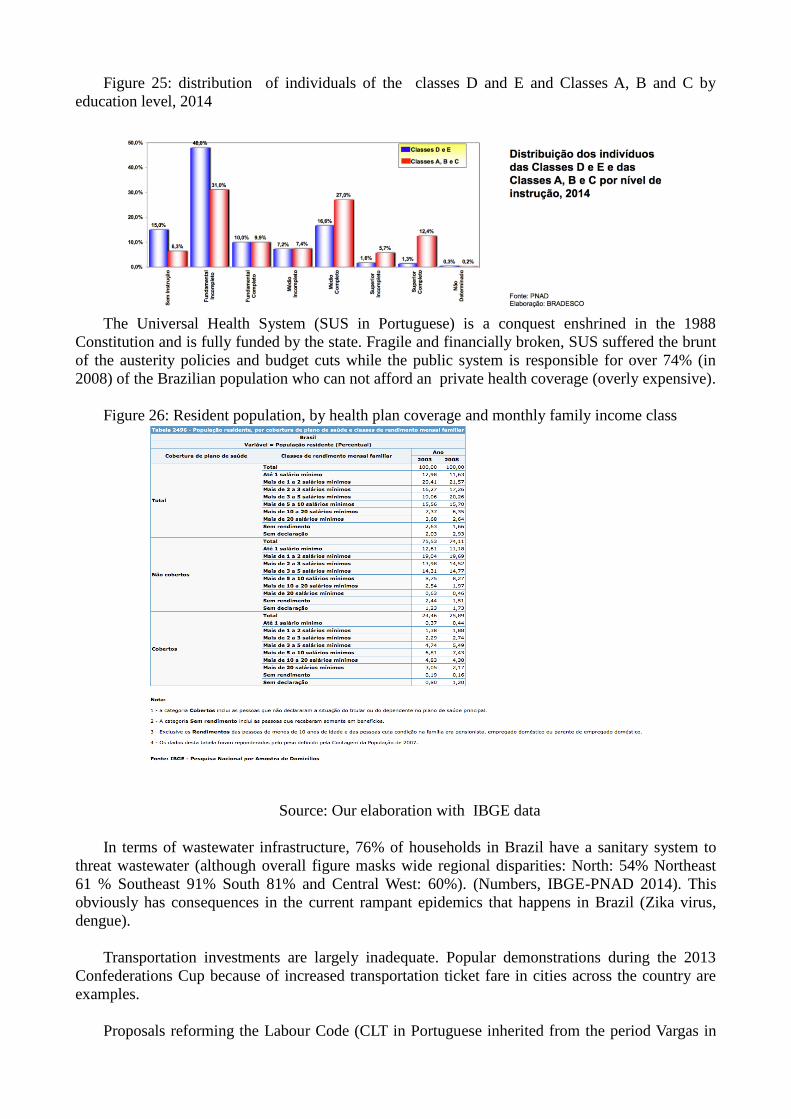
Figure 25: distribution of individuals of the classes D and E and Classes A, B and C by
education level, 2014
The Universal Health System (SUS in Portuguese) is a conquest enshrined in the 1988
Constitution and is fully funded by the state. Fragile and financially broken, SUS suffered the brunt
of the austerity policies and budget cuts while the public system is responsible for over 74% (in
2008) of the Brazilian population who can not afford an private health coverage (overly expensive).
Figure 26: Resident population, by health plan coverage and monthly family income class
Source: Our elaboration with IBGE data
In terms of wastewater infrastructure, 76% of households in Brazil have a sanitary system to
threat wastewater (although overall figure masks wide regional disparities: North: 54% Northeast
61 % Southeast 91% South 81% and Central West: 60%). (Numbers, IBGE-PNAD 2014). This
obviously has consequences in the current rampant epidemics that happens in Brazil (Zika virus,
dengue).
Transportation investments are largely inadequate. Popular demonstrations during the 2013
Confederations Cup because of increased transportation ticket fare in cities across the country are
examples.
Proposals reforming the Labour Code (CLT in Portuguese inherited from the period Vargas in

the 1940s) threaten acquired rights (unemployment benefits, risk benefits, etc.) and the PAYG
pension system has been reformed in favour of funded pension (at the beginning of the first term of
President Lula) satisfying the interests of the omnipresent and omnipotent finance sector.
3. Conclusion:
It appears from the considerations presented above that the introduction the "new middle class"
as a case study for a stable and just development model is largely insufficient.
This is to better qualify the debate despite his passionate nature since 2013 (during the
Confederation Cup).
Industrialization policies must go hand in hand with economic policies oriented towards quality
employment and stable: the antithesis of the current finance-growth regime.
Contrary to liberal austerity policies applied today in Brazil but also in Europe, progressive and
homogenizing reforms are more than ever necessary and urgent in the political as well as in the
fiscal fields.
We must salute policies that enabled a substantial portion of the population to get out of
poverty but a development model must be judged on its ability to maintain this population away of
poverty, and more, to ensure quality improvement perennial and stable life for future generations.
References
Auditoria da dívida cidadã, 2016, Gastos com a Dívida Pública em 2014 superaram 45% do
Orçamento Federal Executado, http://www.auditoriacidada.org.br/e-por-direitos-auditoria-da-
divida-ja-confira-o-grafico-do-orcamento-de-2012/
Bradesco, 2016, Movimento recente de retorno para as Classes D e E parece ser conjuntural ,
Destaque Depec - Bradesco , Ano XIII - Numero 133 - 13 de janeiro de 2016
Carcanholo, M. D. Neoconservado- rismo com roupagem alternativa: a Nova Cepal dentro do
Consenso de Washing- ton. In: CASTELO, R. (Org.). Encruzilha- das da America Latina no Seculo
XXI. Rio de Janeiro: Pao e Rosas, 2010.
Castilho M; A. Saludjian, 2016. The changing trade specialization and poverty in Brazil,
http://www.nopoor.eu/download/file/fid/1027
Casanova C., le Xia , Romina Ferreira (2015) Measuring Latin America’s export dependency
on China, BBVA Research Working paper, Agosto. https://www.bbvaresearch.com/wp-
content/uploads/2015/08/15-26_Working-Paper_China-and-Latin-America2.pdf
Costa Pinto E. 2016, Guedes Pinto, J.-P; Baruco G., A. Saludjian; P. Balanco, C. Schonerwald;
I. Nogueira. A economia politica dos governos Dilma: acumulacao, bloco no poder e crise. TD
IE/UFRJ 04/2016.
http://www.ie.ufrj.br/images/pesquisa/publicacoes/discussao/2016/TD_IE_004_2016_COSTA_
PINTO_et_al.pdf
DIEESE, http://www.dieese.org.br/analisecestabasica/salarioMinimo.html
DIEESE, http://www.dieese.org.br/analisecestabasica/2016/201602cestabasica.pdf
Filgueiras L ; B. Pinheiro ; C. Philigret ; P. Balanco, Modelo liberal-periférico e bloco de poder:
política e dinâmica macroeconômica nos governos Lula, in Os anos Lula: contribuição para

um balanço crítico 2003-2010. 2010.
Fritz, B. (Org.) ; Lavinas, Lena (Org.) . A Moment of Equality of Latin America? Challenges
for Redistribution. 1. ed. Burlington: Ashgate Publishing Group, 2015. v. 1. 284 pages
Gomes H., 2016. Salário Mínimo no Brasil, http://www.heldergomes.com.br/salario-minimo-
no-brasil/#sthash.dRKeLCnY.dpuf)
Hermann J.; D. Gentil, 2015, Macroeconomic contraints and Limits on Social Spending: An
Analysis of the Period 2003-2012 in Brazil, in FRITZ, B. (Org.) ; LAVINAS, Lena (Org.), 2015.
IBGE, PNAD (saneamento)
KATZ J. [2001] Structural reforms, productivity and technological change in Latin America,
Libros de la CEPAL n° 64, Santiago du Chili.
Luce M, . Brasil: nova classe média ou novas formas de superexploração da classe
trabalhadora?. Trab. educ. saúde [online]. 2013, vol.11, n.1, pp.169-190. ISSN 1981-7746.
Neri M. 2010. A Nova Classe Média, O lado brilhante dos probres. FGV/CPS. Rio de Janeiro.
Pochmann, Márcio. Nova classe média? São Paulo: Boitempo, 2012.
Pochmann M. O mito da grande classe média: capitalismo e estrutura social. São Paulo:
Boitempo Editorial, 2014, 148p.
Saboia J; J. Hallak 2016, http://www.nopoor.eu/download/file/fid/1017
Salama 2013 « Les classes moyennes peuvent-elles dynamiser la croissance du PIB dans les
économies émergentes latino-américaines et asiatiques », Tiers Monde n°219,141-158, Translated
into Portugues, Estudos Avançados en 2014, n°28, 7-22.
Salama P. 2016 , Une crise structurelle au Brésil, Mimeo.
Salama P. 2012, Les économies émergentes latino-américaines, entre cigales et fourmis, édition
Armand Colin, collection U.
Salama P. 2014. Des pays toujours émergents ? édition La Documentation française.
Saludjian, A. (2014) Integração Sul-Americana: Um Balanço Crítico. Argumentum (Vitória), v.
6, p. 76-102. http://periodicos.ufes.br/argumentum/article/view/8199
Saludjian, A. Estrategias de desenvol- vimento e insercao da America Latina na economia
mundial: os estruturalistas e neoestruturalistas da Cepal: uma aborda- gem critica. In: CASTELO,
R. (Org.). En- cruzilhadas da America Latina no Seculo XXI. Rio de Janeiro: Pao e Rosas, 2010.
Squeff Gabriel Coelho A Heterogeneidade estrutural no Brasil de 1950 a 2009/Gabriel Coelho
Squeff / Mauro Oddo Nogueira. Brasilia, DF: CEPAL. Escritorio no Brasil/IPEA, 2013. (Textos
para Discussao CEPAL-IPEA, 51):
http://www.ipea.gov.br/portal/images/stories/PDFs/TDs_Ipea_Cepal/tdcepal_051.pdf
