mid-year budget and performance assessment mfma section …james.wilmans.co.za/no.pdf · mid-year...
TRANSCRIPT

Mid-year budget and performance assessment report – 2017
Page 1 of 55
1
NONGOMA MUNICIPALITY
MID-YEAR BUDGET AND PERFORMANCE ASSESSMENT
MFMA SECTION 72 REPORT
2017 FINANCIAL YEAR

Mid-year budget and performance assessment report – 2017
Page 2 of 55
2
TABLE OF CONTENTS
Item Description Page No.
1 Report of the Mayor 3-4
2 Summary of the Potential Impact of the National and Provincial Adjustments Budgets
3
3 Determination of the necessity of an Adjustments Budget 4
IN YEAR STATEMENT TABLES (Annexure 1) 5
C1 Table C1 Monthly Budget Statement Summary 6
C2 Table C2 Monthly Budget Statement – Financial Performance
(revenue and expenditure by standard classification)
7
C3 Table C3 Monthly Budget Statement – Financial Performance
(revenue and expenditure by municipal vote)
8
C4 Table C4 Monthly Budget Statement – Financial Performance
(revenue and expenditure)
9-10
C5 Table C5 Monthly Budget Statement – Capital Expenditure
(municipal vote, standard classification and funding)
11-12
C6 Table C6 Monthly Budget Statement – Financial Position 13-16
C7 Table C7 Monthly Budget Statement – Cash Flow 17-19
SUPPORTING DOCUMENTATION (Annexure 2)
SC1 – SC13 Table SC1 – SC13 Supporting Documents 20-32
Free Basic Electricity 33
SCM implementation - six months report 34
QUALITY CERTIFICATION 55
Mid-year budget and performance assessment report – 2017
Page 3 of 55
3
REPORT OF THE MAYOR
In my capacity as the Mayor, it is an honour to present this Mid-Year Budget and Performance Assessment for the six months ended 31 December 2016. First and foremost let me take this opportunity to thank the community of Nongoma Municipality for the unstinting support they have given to the Councillors and Administration of our municipality under different political and economic situations.
Purpose
The purpose of this report is to comply with Sections 72 (1) (a) and 52 (d) of the Municipal Finance Management Act (MFMA) and the requirements as promulgated in the Government Gazette No. 32141 of 17 April 2009 regarding Municipal Budget and Reporting Regulations, which requires that specific financial particulars be reported on and in the formats prescribed. Therefore this report is presented to the Council to obtain approval for adjustments to the approved 2015/2016 Medium Term and Expenditure Framework (MTREF) in terms of the MFMA.
Background
In terms of Section 72(1)(a) and 52(d) of the Local Government Municipal Finance Management Act, 2003 (Act 56 of 2003) (hereinafter referred to as the MFMA), the Accounting Officer of a municipality must by 25 January of each year assess the performance of the municipality during the first half of the financial year. A report on such assessment must then be submitted to the Mayor, Provincial Treasury and National Treasury each year in terms of Section 72(1)(b) of the Act.
Section 52 (d) of the Municipal Finance Management Act (MFMA) states that:
“The Mayor of a municipality must within 30 days of the end of each quarter, submit a report to Council on the implementation of the budget and the financial state of the municipality”. Section 54 of the Municipal Finance Management Act (MFMA) says one the Mayor has considered the report he must submit the report to Council by the 31 January of each year.
The mid-year reports and supporting tables of Nongoma Municipality prepared in accordance with the Municipal Budget and Reporting Regulations are attached as Annexures 1 and 2.
Impact of the National and Provincial Adjustments Budgets
Regulation 23 of the Municipal Budget and Reporting Regulations provides, inter alia for the following:
“An adjustment budget may be tabled in the Municipal Council at any time after the Mid-year Budget and Performance Assessment has been tabled in the Council but not later than 28 February of each year”.
Furthermore, except under certain circumstances only one adjustment budget may be tabled in the Municipal Council during a financial year.
Accordingly a report on adjustments to the budget will be submitted for consideration by Council at its meeting to be held on or before 28 February 2015.
Due to the 2016-17 Adjusted Estimates of National Expenditure and its proposed adjustments to the allocations made to the Provinces, the municipality anticipates a similar effect on its budget taking also into account adjustments due to unforeseen circumstances as well as virements and shifting of funds amongst votes.

Mid-year budget and performance assessment report – 2017
Page 4 of 55
4
There are hence no changes to the annual budget arising from the National and Provincial Adjusted Estimates to be made according to the gazettes.
The table below reflects the conditional and unconditional grant allocations according to the gazettes:
NATIONAL GRANTS:
Details Estimate Adjustment Revised Estimate Estimate
Equitable share 121 046 000 - 121 046 000 128 549 000 134 781 000
National Conditional Grants:
Integrated National Electricity Programme 14 000 000 - 14 000 000 12 000 000 15 000 000
Municipal Infrastructure Grant 30 417 000 - 30 417 000 32 567 000 34 276 000
Local Gov & Fin Mang Grant 1 825 000 - 1 825 000 1 900 000 2 155 000
EPWP Grant 1 102 000 - 1 102 000 - -
47 344 000 - 47 344 000 46 467 000 51 431 000
PROVINCIAL GRANTS:
Provincial Conditional Grants:
Community Library Services (Arts and Culture) 179 000 - 179 000 188 000 197 000
Provincialisation of Libraries (Arts and Culture) 559 000 - 559 000 583 000 613 000
Total Provincial Grants 738 000 - 738 000 771 000 810 000
ZULULAND DISTRICT MUNICIPALITY
Tourism Grant 50 000 - 50 000 50 000
TOTAL GRANTS 169 178 000 - 169 128 000 175 837 000 187 072 000
Recommendation by the Mayor
• THAT this report which is submitted in compliance with Section 72 (1) (a) and 52 (d) of the MFMA and in terms of Government Gazette 32141 dated 17 April 2009, relating to the “Local Government: Municipal Finance Management Act, Municipal Budget and Reporting Regulations”, and the financial results and supporting documentation (Schedule C) as at 31 December 2016 be considered by the Council.
• THAT in the light of the financial assessment and forecasting of figures on the annual budget based on the first six months of the financial year an adjustment budget for the 2016/2017financial year is required.
I place on record my appreciation to all Councillors, Senior Management, the entire staff of the municipality and all stakeholders in the community of Nongoma for their tireless dedication, co-operation and participation in the programmes of the municipality.
Their contributions will always be cherished.
I thank you
His Worship, the Mayor
Cllr SC Mataba

Mid-year budget and performance assessment report – 2017
Page 5 of 55
5
ANNEXURE 1
IN-YEAR STATEMENT SCHEDULES

Mid-year budget and performance assessment report – 2017
Page 6 of 55
6
Table C1 – Budget Statement reflects the summary of all monthly budget statements for the period under review.
KZN265 Nongoma - Table C1 Monthly Budget Statement Summary - Mid-Year Assessment2015/16Audited
OutcomeOriginal Budget
Adjusted Budget
Monthly actual
YearTD actual
YearTD budget
YTD variance
YTD variance
Full Year Forecast
R thousands %Financial Performance
Property rates 20 351 23 749 – 1 025 15 753 15 907 (154) -1% 23 749 Serv ice charges 1 685 1 790 – 144 863 895 (32) -4% 1 790 Inv estment rev enue 1 814 1 720 – 151 885 860 24 3% 1 720 Transfers recognised - operational 176 812 124 761 – 40 977 93 854 93 854 – 124 761 Other ow n rev enue 1 739 1 529 – 107 694 765 (70) -9% 1 529
Total Revenue (excluding capital transfers and contributions)
202 402 153 549 – 42 404 112 049 112 281 (232) -0% 153 549
Employ ee costs 67 668 65 755 – 5 233 35 814 32 878 2 937 9% 65 755 Remuneration of Councillors 12 495 12 716 – 1 045 6 202 6 358 (155) -2% 12 716 Depreciation & asset impairment 10 396 10 151 – 846 5 075 5 075 (0) -0% 10 151 Finance charges 129 482 – 0 2 241 (239) -99% 482 Materials and bulk purchases – – – – – – – – Transfers and grants 876 217 – 162 1 054 109 945 870% 217 Other ex penditure 52 202 58 578 – 7 342 32 932 29 289 3 643 12% 58 578
Total Expenditure 143 765 147 898 – 14 629 81 079 73 949 7 130 10% 147 898 Surplus/(Deficit) 58 636 5 651 – 27 776 30 970 38 332 (7 362) -19% 5 651
Transfers recognised - capital – 44 417 – 9 122 37 488 22 209 15 279 69% 44 417 Contributions & Contributed assets – – – – – – – –
Surplus/(Deficit) after capital transfers & contributions
58 636 50 068 – 36 898 68 457 60 540 7 917 13% 50 068
Share of surplus/ (deficit) of associate – – – – – – – – Surplus/ (Deficit) for the year 58 636 50 068 – 36 898 68 457 60 540 7 917 13% 50 068
Capital expenditure & funds sourcesCapital expenditure 52 438 54 167 – 8 268 32 321 27 084 5 238 19% –
Capital transfers recognised 47 016 44 417 – 7 767 29 850 22 209 7 641 34% – Public contributions & donations – – – – – – – – Borrow ing – 5 950 – – – 2 975 (2 975) -100% – Internally generated funds 5 422 3 800 – 502 2 471 1 900 571 30% –
Total sources of capital funds 52 438 54 167 – 8 268 32 321 27 084 5 238 19% –
Financial positionTotal current assets 32 994 40 766 – 64 625 40 766 Total non current assets 296 858 348 332 – 326 774 348 332 Total current liabilities 16 209 17 368 – 15 954 17 368 Total non current liabilities 9 385 10 578 – 9 385 10 578
Community wealth/Equity 304 258 361 151 – 366 059 361 151
Cash flowsNet cash from (used) operating 41 214 53 711 – 44 272 67 075 77 172 10 097 13% 53 711 Net cash from (used) inv esting 50 010 (53 845) – (9 631) (32 567) (26 761) 5 806 -22% 322 Net cash from (used) financing (100 357) 4 426 – – (54) 5 188 5 242 101% 5 950
Cash/cash equivalents at the month/year end 6 545 15 775 – – 40 963 67 082 26 119 39% 66 492
Debtors & creditors analysis 0-30 Days 31-60 Days 61-90 Days 91-120 Days 121-150 Dys 151-180 Dys181 Dys-
1 YrOver 1Yr Total
Debtors Age AnalysisTotal By Income Source (1 053) (13) (3 184) 919 629 9 678 699 31 814 39 489 Creditors Age AnalysisTotal Creditors 7 352 (30) (1) – – – – 2 145 9 467
DescriptionBudget Year 2016/17

Mid-year budget and performance assessment report – 2017
Page 7 of 55
7
Table C2 – is the monthly budget statement which indicates financial performance by standard classification for the period under review.
2015/16 Budget Year 2016/17Audited
OutcomeOriginal Budget
Adjusted Budget
Monthly actual
YearTD actual
YearTD budget
YTD variance YTD varianceFull Year Forecast
R thousands 1 %
Revenue - Standard
Governance and administration 150 089 148 702 – 42 010 129 852 109 858 19 994 18% 148 702
Budget and treasury office 150 006 148 617 – 41 552 129 395 109 823 19 572 18% 148 617
Corporate serv ices 83 85 – 457 457 35 422 1189% 85
Community and public safety 912 1 127 – 38 989 563 425 75% 1 127
Community and social serv ices 912 873 – 30 791 437 355 81% 873
Public safety – 254 – 9 197 127 70 55% 254
Economic and environmental services 49 655 46 297 – 9 334 17 832 23 149 (5 317) -23% 46 297
Planning and development 48 990 45 582 – 9 247 17 438 22 791 (5 353) -23% 45 582
Road transport 665 715 – 88 394 358 36 10% 715
Trading services 1 685 1 790 – 144 863 895 (32) -4% 1 790
Waste management 1 685 1 790 – 144 863 895 (32) -4% 1 790
Other 4 60 50 – – – 25 (25) -100% 50
Total Revenue - Standard 2 202 402 197 966 – 51 526 149 536 134 490 15 046 11% 197 966
Expenditure - Standard
Governance and administration 83 752 82 876 – 8 961 45 944 41 438 4 506 11% 82 876
Ex ecutiv e and council 28 652 33 090 – 2 994 16 326 16 545 (219) -1% 33 090
Budget and treasury office 31 386 32 097 – 3 857 17 712 16 049 1 663 10% 32 097
Corporate serv ices 23 714 17 689 – 2 109 11 906 8 845 3 062 35% 17 689
Community and public safety 23 722 26 074 – 2 661 15 764 13 037 2 727 21% 26 074
Community and social serv ices 16 174 18 109 – 1 885 11 614 9 054 2 560 28% 18 109
Public safety 7 547 7 965 – 775 4 150 3 983 167 4% 7 965
Economic and environmental services 25 400 26 957 – 2 156 13 241 13 479 (238) -2% 26 957
Planning and development 18 115 18 588 – 2 013 12 270 9 294 2 976 32% 18 588
Road transport 7 286 8 370 – 142 971 4 185 (3 214) -77% 8 370
Trading services 10 063 11 286 – 825 5 652 5 643 9 0% 11 286
Waste management 10 063 11 286 – 825 5 652 5 643 9 0% 11 286
Other 828 704 – 27 478 352 126 36% 704
Total Expenditure - Standard 3 143 765 147 898 – 14 629 81 079 73 949 7 130 10% 147 898
Surplus/ (Deficit) for the year 58 636 50 068 – 36 898 68 457 60 541 7 915 13% 50 068
RefDescription
KZN265 Nongoma - Table C2 Monthly Budget Statement - Financial Performance (standard classification) - Mid-Year Assessment

Mid-year budget and performance assessment report – 2017
Page 8 of 55
8
Table C3 – Budget Statement reflects the financial performance by municipal vote for the first six months of 2016/17 financial year.
Vote Description 2015/16Audited
OutcomeOriginal Budget
Adjusted Budget
Monthly actual
YearTD actual
YearTD budget
YTD variance YTD varianceFull Year Forecast
R thousands %
Revenue by Vote 1
Vote 2 - Vote 2 - Financial Serv ices 150 006 148 617 – 41 552 129 395 109 815 19 580 17.8% 148 617
Vote 3 - Vote 3 - Corporate Serv ices 83 85 – 457 457 43 415 974.2% 85
Vote 4 - Vote 4 - Community Serv ices 912 873 – 30 791 437 355 81.3% 65
Vote 5 - Vote 5 - Planning and Economic Dev elopment 35 63 – 1 11 32 (21) -65.2% 63
Vote 6 - VOTE 6 Technical serv ices 48 955 45 519 – 9 245 17 427 22 760 (5 332) -23.4% 45 519
Vote 7 - Vote 7 - Safety and Security 665 969 – 96 591 484 106 22.0% 969
Vote 8 - Vote 8 - Solid Waste Management 1 685 1 790 – 144 863 895 (32) -3.5% 1 790
Vote 9 - Vote 9 - Tourism and Sports 60 50 – – – 25 (25) -100.0% 50
Total Revenue by Vote 2 202 402 197 966 – 51 526 149 536 134 490 15 047 11.2% 197 158
Expenditure by Vote 1
Vote 1 - Vote 1 - Gov ernance and Administration 28 652 33 090 – 2 994 16 326 16 545 (219) -1.3% 33 090
Vote 2 - Vote 2 - Financial Serv ices 31 386 32 097 – 3 857 17 712 16 049 1 663 10.4% 32 097
Vote 3 - Vote 3 - Corporate Serv ices 23 714 17 689 – 2 109 11 906 8 845 3 062 34.6% 17 689
Vote 4 - Vote 4 - Community Serv ices 16 174 18 109 – 1 885 11 614 9 054 2 560 28.3% 18 109
Vote 5 - Vote 5 - Planning and Economic Dev elopment 9 733 9 919 – 491 3 452 4 959 (1 507) -30.4% 9 919
Vote 6 - VOTE 6 Technical serv ices 13 911 14 671 – 1 522 8 818 7 335 1 483 20.2% 14 671
Vote 7 - Vote 7 - Safety and Security 9 304 10 333 – 918 5 121 5 167 (46) -0.9% 10 333
Vote 8 - Vote 8 - Solid Waste Management 10 063 11 286 – 825 5 652 5 643 9 0.2% 11 286
Vote 9 - Vote 9 - Tourism and Sports 828 704 – 27 478 352 126 35.7% 704
Total Expenditure by Vote 2 143 765 147 898 – 14 629 81 079 73 949 7 130 9.6% 147 898
Surplus/ (Deficit) for the year 2 58 636 50 068 – 36 898 68 457 60 540 7 916 13.1% 49 260
KZN265 Nongoma - Table C3 Monthly Budget Statement - Financial Performance (revenue and expenditure by municipal vote) - Mid-Year Assessment
Ref
Budget Year 2016/17

Mid-year budget and performance assessment report – 2017
Page 9 of 55
9
Table SC4 – Budget statement indicates the revenue and expenditure performance against an approved budget as at 31 December 2016
2015/16Audited
OutcomeOriginal Budget
Adjusted Budget
Monthly actual
YearTD actual
YearTD budget
YTD variance YTD variance Full Year Forecast
R thousands %
Revenue By Source
Property rates 18 230 20 939 – 812 14 502 14 502 – 20 939
Property rates - penalties & collection charges 2 121 2 810 – 213 1 251 1 405 (154) -11% 2 810
Serv ice charges - refuse rev enue 1 685 1 790 – 144 863 895 (32) -4% 1 790
Rental of facilities and equipment 60 122 – 2 48 61 (13) -22% 122
Interest earned - ex ternal inv estments 1 814 1 720 – 151 885 860 24 3% 1 720
Fines 281 282 – 9 104 141 (36) -26% 282
Licences and permits 668 715 – 88 394 358 37 10% 715
Transfers recognised - operational 176 812 124 761 – 40 977 93 854 93 854 – 124 761
Other rev enue 730 410 – 8 148 205 (57) -28% 410 Total Revenue (excluding capital transfers and contributions)
202 402 153 549 – 42 404 112 049 112 281 (232) 0% 153 549
Expenditure By Type
Employ ee related costs 67 668 65 755 – 5 233 35 814 32 878 2 937 9% 65 755
Remuneration of councillors 12 495 12 716 – 1 045 6 202 6 358 (155) -2% 12 716
Debt impairment 1 807 1 760 – 147 880 880 – 1 760
Depreciation & asset impairment 10 396 10 151 – 846 5 075 5 075 (0) 0% 10 151
Finance charges 129 482 – 0 2 241 (239) -99% 482
Contracted serv ices 15 819 17 795 – 2 518 13 768 8 897 4 870 55% 17 795
Transfers and grants 876 217 – 162 1 054 109 945 870% 217
Other ex penditure 34 364 39 023 – 4 677 18 284 19 511 (1 228) -6% 39 023
Loss on disposal of PPE 211 – – – – – – 0% –
Total Expenditure 143 765 147 898 – 14 629 81 079 73 949 7 130 10% 147 898
Surplus/(Deficit) 58 636 5 651 – 27 776 30 970 38 332 (7 362) (0) 5 651
Transfers recognised - capital – 44 417 – 9 122 37 488 22 209 15 279 0 44 417
Surplus/ (Deficit) for the year 58 636 50 068 – 36 898 68 457 60 540 50 068
Description RefBudget Year 2016/17
KZN265 Nongoma - Table C4 Monthly Budget Statement - Financial Performance (revenue and expenditure) - Mid-Year Assessment
Performance results:
The overall operating results for the first six months ended 31 December 2016 indicate a surplus of R68.4 million compared to the budgeted surplus for the same period of R60.5 million. The surplus is attributable to the recognition of capital expenditure funded through conditional grant allocations. The municipality actually has earned an operating surplus of R30.9 million before recognition of capital transfers while our monthly operating results are a deficit of R36.8 million.
Income:
The total operating income for six months is R112.0 million compared to budgeted income of R112.3 million. The revenue from property rates is R14.5 million compared to the budget of R14.5 million.
It should then be noted that if the national and provincial transfers are excluded, the municipality has received own revenue amounting to R18.2 million compared to R18.5 million per annual budget.
The capital transfers recognised amounted to R37.4 million versus the budget of R22.2 million.
Operating Expenditure:

Mid-year budget and performance assessment report – 2017
Page 10 of 55
10
Total operating expenditure for the period amounts to R81.1 million compared to budget of R73.9 million, reflecting an overall budget under-spending of 10%.
The expenditure of employee related costs for six months is R35.8 million whilst the budget is R32.8 million, resulting in a salary budget overspending of 9%. The percentage expenditure on employee salaries and allowances in relation to total operating expenditure is 44.2% which is above the norm of 35% set by National Treasury and SALGA.
The expenditure on councillors’ remuneration for six months is R6.2 million compared to budgeted amount of R6.3, reflecting a budget saving of 2%. An application was submitted to the MEC for the approval of the Upper Limits for the 2016-17, The MEC is still processing the application for allowances increase in terms of the resolution taken by council. Once response received and the back pays paid to relevant councillors, the budget saving will square up to annual budget provision made.
Finance charges reflect budget saving of 99% which is due to the fact that the vehicle and plant proposed to be purchased through finance instalment sale agreement were purchased by cash. Then this requires capital budget revision.
Contracted Services reflects over-spending of 55% while other expenditures are under-spent by 26%.
Other expenditure under-spent by 6%.This is due to the fact programmes like LED, public participation etc are earmarked to be implemented during the third and fourth quarters.
05000000
10000000150000002000000025000000300000003500000040000000
Employeerelated costs
Financecosts
Otherexpenditure
BudgetActuals

Mid-year budget and performance assessment report – 2017
Page 11 of 55
11
Table SC5 – Budget statement shows the progress made in the implementation of municipal capital budget as at 31December 2015.
2015/16 Budget Year 2016/17Audited
OutcomeOriginal Budget
Adjusted Budget
Monthly actual
YearTD actual
YearTD budget
YTD variance YTD varianceFull Year Forecast
R thousands 1 %
Multi-Year expenditure appropriation 2
Vote 5 - Vote 5 - Planning and Economic Dev elopment 48 487 47 117 – 7 767 30 707 23 559 7 148 30% –
Total Capital Multi-year expenditure 4,7 48 487 47 117 – 7 767 30 707 23 559 7 148 30% –
Single Year expenditure appropriation 2
Vote 1 - Vote 1 - Gov ernance and Administration – 76 – – – 38 (38) -100% –
Vote 2 - Vote 2 - Financial Serv ices – 72 – – 37 36 1 2% –
Vote 3 - Vote 3 - Corporate Serv ices 315 1 337 – – 13 669 (656) -98% –
Vote 4 - Vote 4 - Community Serv ices – 2 955 – 502 1 390 1 478 (88) -6% –
Vote 5 - Vote 5 - Planning and Economic Dev elopment 190 620 – – 169 310 (141) -45% –
Vote 6 - VOTE 6 Technical serv ices – – – – – – – –
Vote 7 - Vote 7 - Safety and Security – 300 – – 5 150 (145) -97% –
Vote 8 - Vote 8 - Solid Waste Management 3 447 1 690 – – – 845 (845) -100% –
Total Capital single-year expenditure 4 3 951 7 050 – 502 1 614 3 525 (1 911) -54% –
Total Capital Expenditure 52 438 54 167 – 8 268 32 321 27 084 5 238 19% –
Capital Expenditure - Standard Classification
Governance and administration 315 1 485 – – 50 743 (693) -93% –
Ex ecutiv e and council – 76 – – 38 (38) -100%
Budget and treasury office – 72 – 37 36 1 2%
Corporate serv ices 315 1 337 – 13 669 (656) -98%
Community and public safety – 3 255 – 502 1 395 1 628 (233) -14% –
Community and social serv ices – 2 955 502 1 390 1 478 (88) -6%
Public safety – 300 – 5 150 (145) -97%
Economic and environmental services 48 677 47 737 – 7 767 30 877 23 869 7 008 29% –
Planning and dev elopment 48 677 47 737 7 767 30 877 23 869 7 008 29%
Trading services 3 447 1 690 – – – 845 (845) -100% –
Waste management 3 447 1 690 – – 845 (845) -100%
Total Capital Expenditure - Standard Classification 3 52 438 54 167 – 8 268 32 321 27 084 5 238 19% –
Funded by:
National Gov ernment 47 016 44 417 7 767 29 850 22 209 7 641 34%
Borrowing 6 5 950 2 975 (2 975) -100%
Internally generated funds 5 422 3 800 502 2 471 1 900 571 30%
Total Capital Funding 52 438 54 167 – 8 268 32 321 27 084 5 238 19% –
KZN265 Nongoma - Table C5 Monthly Budget Statement - Capital Expenditure (municipal vote, standard classification and funding) - Mid-Year Assessment
Vote Description Ref

Mid-year budget and performance assessment report – 2017
Page 12 of 55
12
Capital Expenditure:
The capital expenditure as at the end of December 2016 is R32.2 million which is 60% of the annual budgeted amount.
Electrification project expenditure pattern are promising as R8.1 million has been capitalized so far. Expenditure on this project will need to be improved to avoid increased unspent conditional grants at year end.
It is pleasing to note that the expenditure on MIG projects progress as planned. The capital expenditure on MIG projects at 31 December 2016 is R24.6 million representing 80% of the budgeted amount.

Mid-year budget and performance assessment report – 2017
Page 13 of 55
13
Table SC6 – Budget statement indicates the financial position of the municipality as at December 2016
2015/16 Budget Year 2016/17Audited
OutcomeOriginal Budget
Adjusted Budget
YearTD actualFull Year Forecast
R thousands 1
ASSETS
Current assets
Cash Note 1 4 509 796 11 852 525 - 15 429 048 11 852 525
Call inv estment deposits Note 1 2 035 992 3 922 625 - 25 534 514 3 922 625
Consumer debtors 21 858 157 24 177 057 - 20 928 975 24 177 057
Other debtors 4 590 054 814 063 - 2 732 702 814 063
Total current assets 32 993 999 40 766 270 - 64 625 239 40 766 270
Non current assets
Property , plant and equipment Note 2 296 400 411 347 946 315 - 326 479 149 347 946 315
Intangible assets Note 2 457 540 385 327 - 294 525 385 327
Total non current assets 296 857 951 348 331 642 - 326 773 674 348 331 642
TOTAL ASSETS 329 851 950 389 097 912 - 391 398 913 389 097 912
LIABILITIES
Current liabilities
Borrow ing Note 3 53 918 2 133 548 - - 2 133 548
Consumer deposits 34 032 - - 33 232 -
Trade and other pay ables Note 4 14 806 459 15 126 811 - 9 466 978 15 126 811
Unspent conditional grants Note 5 200 700 - - 5 340 651
Prov isions 1 113 456 107 971 - 1 113 456 107 971
Total current liabilities 16 208 565 17 368 330 - 15 954 317 17 368 330
Non current liabilities
Borrow ing - 3 012 520 - - 3 012 520
Prov isions 9 385 332 7 565 677 - 9 385 332 7 565 677
Total non current liabilities 9 385 332 10 578 197 - 9 385 332 10 578 197
TOTAL LIABILITIES 25 593 897 27 946 527 - 25 339 649 27 946 527
NET ASSETS 2 304 258 053 361 151 385 - 366 059 264 361 151 385
COMMUNITY WEALTH/EQUITY
Accumulated Surplus/(Deficit) 304 258 053 361 151 385 - 366 059 264 361 151 385
TOTAL COMMUNITY WEALTH/EQUITY 2 304 258 053 361 151 385 - 366 059 264 361 151 385
KZN265 Nongoma - Table C6 Monthly Budget Statement - Financial Position - Mid-Year Assessment
Description Ref
Notes to the financial statements:
The supporting notes to the statement of financial position are as detailed below:

Mid-year budget and performance assessment report – 2017
Page 14 of 55
1. Cash and cash equivalents
1.1 Cash available for operations
BANK ACCOUNT DETAILS October November December Cash on hand - petty cash - - - Cash on hand -Cashiers - - - FNB - 53153278884 - Cheque Account 5 571 169 1 011 198 14 148 605 FNB- 62203761962- licensing cheque 1 177 198 1 222 426 1 280 443
6 748 366 2 233 624 15 429 048
1.2 Short-term investments
BANK ACCOUNT DETAILS October November December FNB-62202226751 MIG account 382 166 383 563 4 791 868 FNB-61315000549 ( NDPG) Account 1 084 1 084 1 085 FNB-74427065468 (Seven days notice) 1 851 990 1 862 843 1 873 408 FNB-62370639373 (INEP) Account 1 261 809 743 021 279 992 FNB62373063222- ( SALARIES) Account 5 221 996 60 725 18 076 364 FNB-62370638573- (FMG, MSIG, EPWP etc.) 507 238 509 624 511 796
9 226 283 3 560 862 25 534 514
15 974 649 5 794 486 40 963 563

Mid-year budget and performance assessment report – 2017
Page 15 of 55
2. Property, plant and equipment
HISTORICAL COST ACCUMULATED DEPRECIATION IMPAIRMENTS/ REVALUATIONS CARRING VALUE
Opening BalanceAdditions to date
Additions this month Disposal
Closing Balance
Depreciation Prior year
Depreciation Current year
Depreciation Current month
Closing Balance
Impairment Prior years
Impairment Current year Book Value
Land & Buildings 99 470 499 - - - 99 470 499 37 344 633 1 732 196 - 39 076 829 60 393 670 Infrastructure 107 081 322 - - - 107 081 322 19 293 828 2 039 684 - 21 333 512 85 747 810 Other prperty, plant and equipment 15 546 907 1 611 560 - - 17 158 467 9 093 261 1 326 637 - 10 419 898 6 738 569 Leased assets 866 024 - - 866 024 732 884 2 811 - 735 695 130 329 Assets under construction 150 938 568 33 005 449 - - 183 944 017 10 475 246 - 10 475 246 173 468 771
Sub-totals for the year 373 903 320 34 617 009 - - 408 520 329 76 939 852 5 101 328 - 82 041 180 - - 326 479 149
Opening BalanceAdditions to date
Additions this month Disposal
Closing Balance
Depreciation Prior year
Depreciation Current year
Depreciation Current month
Closing Balance
Impairment Prior years
Impairment Current year Book Value
Intangible assets 1 384 536 - - - 1 384 536 921 418 168 593 - 1 090 011 - - 294 525 Sub-total for the year 1 384 536 - - - 1 384 536 921 418 168 593 - 1 090 011 - - 294 525
Totals for the year 375 287 856 34 617 009 - - 409 904 865 77 861 270 5 269 921 - 83 131 191 - - 326 773 674

Mid-year budget and performance assessment report – 2017
Page 16 of 55
16
3. Loans
Bank Description of
Loan Loan Amount Interest Rate
Loan commencement Date
Redemption Date
Balance at 1 July 2016
Received During
the period
Less: repayments
Balance at reporting
date
FNB Vehicle - Isuzu 1 320 000.12 8.00% 2011/08/16 2016/08/30 53 918.00 - 53 918.00 -
Short-term portion 53 918.00 - 53 918.00 - Long-term portion - - - -
53 918.00 - 53 918.00 -
PAYMENTS BREAKDOWN First quarter October November December January February March April May June
53 918.00 - - - - - - - - -
Total todate 53 918.00
SCHEDULE OF LOANS
4. Trade and other payables:
OPENING BALANCES CLOSING BALANCES AT REPORTING DATE ACCOUNT NO. DETAILS 01 July 2016 October 2016 November 2016 December 20169000/9000 Trade payables - Creditors age analysis 2 260 985.05 248 912.72 336 833.09 1 216 343.22 9000/9001 Trade payables - Accruals 2 324 455.12 - - - 9000/9002 Sundry creditors - Eskom Liabili ty P/Y 2 177 158.00 1 727 158.77 1 727 158.77 1 727 158.77 9000/9002 Sundry creditors - Land sales P/Y 417 966.00 417 966.60 417 966.60 417 966.60 9000/9004 Income received in advance - Hall revenue 10 747.38 1 252.62 9000/9030 Sundry creditors - Thi rd parties 1 652 816.12 - - - 9050/9051 Deposit received - Hall rentals 34 032.00 33 612.20 34 212.20 33 232.20 7200/7266 Unallocated receipts 374 634.20 - - - 9200/9202 Current provisions - Acc Cleared - - - - 9200/9204 Accrued leave payments 5 866 778.00 6 256 040.81 5 966 523.00 6 104 256.63
Total trade and other payables 15 119 571.87 8 683 691.10 8 482 693.66 9 500 210.04 Per audited AFS 2015
5. Unspent conditional grants:
Figures in Rands 2017 2016
Note 13 Unspent conditional grants and receipts Unspent conditionla grants and receipts comprises of: 2017 2016Finance management grants 704 238 - Municipal systems improvement grant - - Tourism grant 40 000 40 000 Expanded public works programme 205 900 174 400 Sportfields maintenance grant - - Cathseta 6 300 6 300 Municipal Infrastructure grant 4 384 213 - Integrated national electrification - - Neighbourhood development partnerships grant - - Institutional grants - Total unspent 5 340 651 220 700

Mid-year budget and performance assessment report – 2017
Page 17 of 55
17
3.7 Table SC7 – Budget statement shows the cash flow situation of the municipality at the end of the reporting period.
2015/16 Budget Year 2016/17Audited
OutcomeOriginal Budget
Adjusted Budget
Monthly actual
YearTD actual
YearTD budget
YTD variance YTD varianceFull Year Forecast
R thousands 1 %
CASH FLOW FROM OPERATING ACTIVITIES
Receipts
Property rates, penalties & collection charges 12 424 16 624 2 235 9 431 8 312 1 119 13% 16 624
Serv ice charges 1 685 895 62 336 447 (111) -25% 895
Other rev enue 1 202 1 281 62 1 301 641 660 103% 1 281
Gov ernment - operating 113 969 124 761 40 349 93 380 93 380 – 124 761
Gov ernment - capital 47 505 44 417 14 417 41 417 41 417 – 44 417
Interest 1 814 1 720 146 960 860 100 12% 1 720
Payments
Suppliers and employ ees (137 256) (135 289) (12 999) (79 749) (67 644) 12 104 -18% (135 289)
Finance charges (129) (482) – (1) (241) (240) 100% (482)
Transfers and Grants – (217) – – – – (217)
NET CASH FROM/(USED) OPERATING ACTIVITIES 41 214 53 711 – 44 272 67 075 77 172 10 097 13% 53 711
CASH FLOWS FROM INVESTING ACTIVITIES
Receipts
Proceeds on disposal of PPE 49 517 –
Decrease (increase) other non-current receiv ables 493 322 – 8 504 322 8 182 2538% 322
Payments
Capital assets (54 167) (9 631) (41 071) (27 084) 13 988 -52%
NET CASH FROM/(USED) INVESTING ACTIVITIES 50 010 (53 845) – (9 631) (32 567) (26 761) 5 806 -22% 322
CASH FLOWS FROM FINANCING ACTIVITIES
Receipts
Borrow ing long term/refinancing 5 950 – – 5 950 (5 950) -100% 5 950
Payments
Repay ment of borrow ing (100 357) (1 524) – (54) (762) (708) 93%
NET CASH FROM/(USED) FINANCING ACTIVITIES (100 357) 4 426 – – (54) 5 188 5 242 101% 5 950
NET INCREASE/ (DECREASE) IN CASH HELD (9 133) 4 292 – 34 642 34 454 55 599 59 983
Cash/cash equiv alents at beginning: 15 678 11 483 6 509 11 483 6 509
Cash/cash equiv alents at month/y ear end: 6 545 15 775 – 40 963 67 082 66 492
KZN265 Nongoma - Table C7 Monthly Budget Statement - Cash Flow - Mid-Year Assessment
Description Ref
Note:
1. The above cash flow statement has been explained in details in a separate item.

Mid-year budget and performance assessment report – 2017
Page 18 of 55
3.7.1 Cash collection rate
3.7.1.1 Analysis of cash collected versus revenue billed.
Months Property rates Refuse removal Office rental - IEC Billboards TotalsBills Collection Bills Collection Bills Collection Bills Collection Bills Collection
- - June - July 2016 10 060 644.75 614 636.42 165 249.84 54 873.20 1 300.00 1 300.00 1 402.20 - 10 228 596.79 670 809.62 July - August 2016 851 837.88 548 002.48 163 840.80 41 851.90 1 300.00 1 300.00 1 402.20 1 322.40 1 018 380.88 592 476.78 August - September 2016 860 666.02 630 990.00 163 840.80 30 469.64 1 300.00 - 1 402.20 - 1 027 209.02 661 459.64 September - October 2016 812 296.22 4 299 957.47 163 840.80 75 754.33 1 300.00 - 1 402.20 - 978 839.22 4 375 711.80 October - November 2016 812 296.22 1 102 787.53 163 840.80 70 614.60 1 300.00 - 1 402.20 - 978 839.22 1 173 402.13 November - December 2016 812 296.22 2 234 585.50 163 840.80 62 384.48 1 300.00 1 300.00 1 402.20 - 978 839.22 2 298 269.98
14 210 037.31 9 430 959.40 984 453.84 335 948.15 7 800.00 3 900.00 8 413.20 1 322.40 15 210 704.35 9 772 129.95
Collection rate 66% 34% 50% 16% 64% Collection challenges are as follows:
Rental agreement between the municipality and IEC for rental for occupation of municipal space signed. Refuse removal in areas outside the town land scheme. Non - payment culture by the residents within townland.

Mid-year budget and performance assessment report – 2017
Page 19 of 55
3.7.2 Cash backing of conditional grant allocations:
3.7.2.1 The table below shows the cash available to cash back unspent conditional grants.
Grant allocations Unspent grant allocation Total Cash backing particularsBalance 1 July Set off Eqsh Received Spending Unspent Bank account no. Type Cash available
Capital grants allocationsMunicipal Infrastructure grant - - 30 417 000 -26 032 787 4 384 213 62 202 226 751 Cheque acc 4 791 868 Neighbourhood Dev. Partnership - - - - - 61 315 000 549 Call Account 1 085 Integrated Nat. Electrification Prog. - - 11 000 000 -11 000 000 - 62 370 639 373 Call Account 279 992 Sub-total 41 417 000 -37 032 787 4 384 213 5 072 946 Operational grant allocationFinance management grant - - 1 825 000 -1 120 763 704 238 62 370 638 573 Call Account 261 596 Municipal systems Improvement - - - - - 62 370 638 573 Call Account - Expanded Public works programme 174 400 - 771 000 -739 500 205 900 62 370 638 573 Call Account 203 900 Library provincialisation - - - - - 62 370 638 573 Call Account - Tourism 40 000 - - - 40 000 62 370 638 573 Call Account 40 000 Cyber cadet - - - - - 62 370 638 573 Call Account - Sport facilities mantainance - - - - - 62 370 638 573 Call Account - CATHSSETA 6 300 - - - 6 300 62 370 638 573 Call Account 6 300 Sub-total 220 700 2 596 000 -1 860 263 956 438 511 796
220 700 44 013 000 -38 893 049 5 340 651 5 584 742

Mid-year budget and performance assessment report – 2017
Page 20 of 55
ANNEXURE 2 (Supporting Documentations)
Table SC1 – Supporting schedule gives explanations for all material variances on reports below.
Variance Reasons for material deviations Remedial or corrective steps/remarks
R thousands
1 Revenue
Rental of facilities -22% Decreased demand for facility usage Proper management of bookings by Social Serv ices
Penalty & collection chagres -11% Dicreased % of interest raised prime plus 2
Fines -26% Fines not issued as ex pected Close monitoring of traffice officers by Social serv ices
Other rev enue -28% Plans, subdision rev enue no recognised
2 Expenditure
Finance charges -99% Ov er-budgeting - v ehicle bought by cash To be corrected during budget rev ision
Employ ee related costs 9% Underbudgeting To be prov ided for in the rev ision budget
Contracted serv ices 55% Increase in security serv ices costs - additional resources Improv e spending on R&M
Transfers and grants 870% Underbudgeting To be corrected during budget rev ision
3 Capital expenditure
Capital transfers ex penditure 34% Improv ed spending on capital grants allocations
Internally generarated funding spend 30% v ehicles puchases by cash
4 Financial Position
No material v ariances
5 Cash Flow
Property rates 13% Public Works bills settled
Serv ice charges -25% Cultur of non-pay ment by residents
Suppliers and Employ ees 18% Increase in security serv ices costs - additional resources To correct ov er-ex penditure during budget rev ision
Finance charges -99% Ov er-budgeting - v ehicle bought by cash To correct under-ex penditure during budget rev ision
KZN265 Nongoma - Supporting Table SC1 Material variance explanations - Mid-Year Assessment
Ref Description
Mid-year budget and performance assessment report – 2017
Page 21 of 55
21
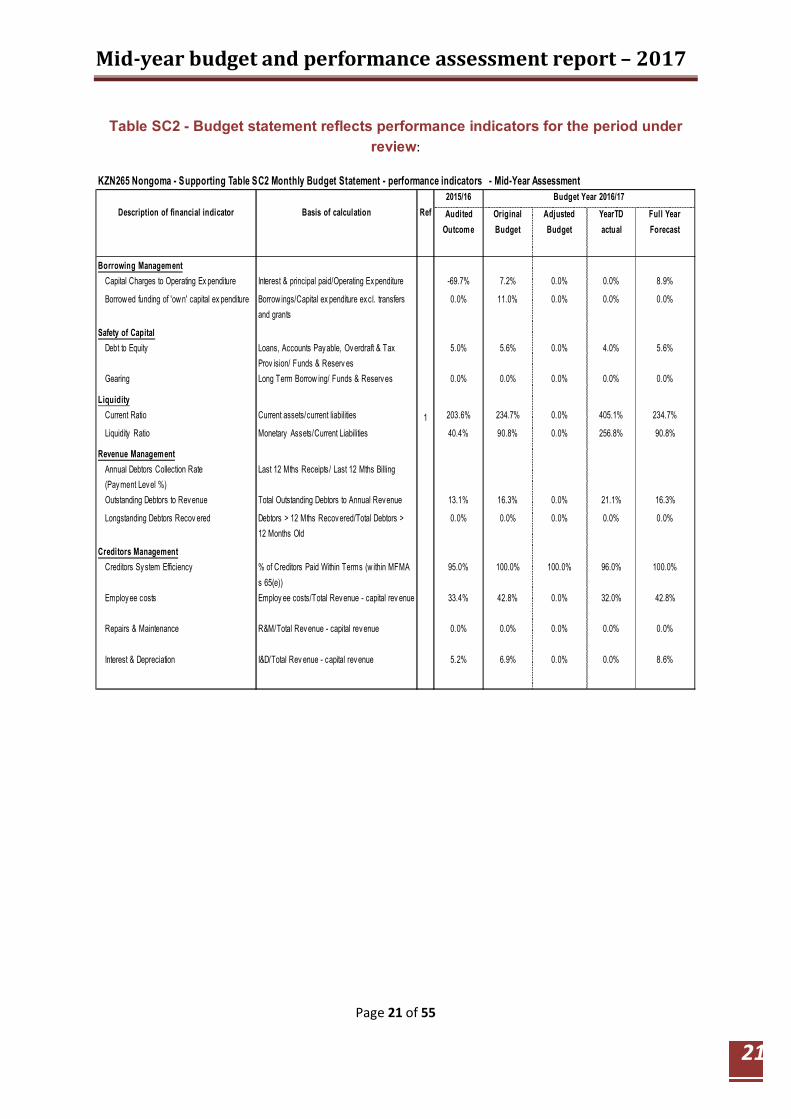
Table SC2 - Budget statement reflects performance indicators for the period under review:
2015/16 Budget Year 2016/17Audited
OutcomeOriginal Budget
Adjusted Budget
YearTD actual
Full Year Forecast
Borrowing ManagementCapital Charges to Operating Ex penditure Interest & principal paid/Operating Ex penditure -69.7% 7.2% 0.0% 0.0% 8.9%
Borrow ed funding of 'ow n' capital ex penditure Borrow ings/Capital ex penditure excl. transfers and grants
0.0% 11.0% 0.0% 0.0% 0.0%
Safety of CapitalDebt to Equity Loans, Accounts Payable, Ov erdraft & Tax
Prov ision/ Funds & Reserv es5.0% 5.6% 0.0% 4.0% 5.6%
Gearing Long Term Borrow ing/ Funds & Reserv es 0.0% 0.0% 0.0% 0.0% 0.0%
LiquidityCurrent Ratio Current assets/current liabilities 1 203.6% 234.7% 0.0% 405.1% 234.7%
Liquidity Ratio Monetary Assets/Current Liabilities 40.4% 90.8% 0.0% 256.8% 90.8%
Revenue ManagementAnnual Debtors Collection Rate (Payment Level %)
Last 12 Mths Receipts/ Last 12 Mths Billing
Outstanding Debtors to Revenue Total Outstanding Debtors to Annual Revenue 13.1% 16.3% 0.0% 21.1% 16.3%
Longstanding Debtors Recov ered Debtors > 12 Mths Recovered/Total Debtors > 12 Months Old
0.0% 0.0% 0.0% 0.0% 0.0%
Creditors ManagementCreditors Sy stem Efficiency % of Creditors Paid Within Terms (w ithin MFMA
s 65(e))95.0% 100.0% 100.0% 96.0% 100.0%
Employee costs Employ ee costs/Total Revenue - capital rev enue 33.4% 42.8% 0.0% 32.0% 42.8%
Repairs & Maintenance R&M/Total Revenue - capital rev enue 0.0% 0.0% 0.0% 0.0% 0.0%
Interest & Depreciation I&D/Total Rev enue - capital revenue 5.2% 6.9% 0.0% 0.0% 8.6%
Description of financial indicator Basis of calculation Ref
KZN265 Nongoma - Supporting Table SC2 Monthly Budget Statement - performance indicators - Mid-Year Assessment

Mid-year budget and performance assessment report – 2017
Page 22 of 55
Table SC3 – Budget statement indicates the total debt owed by clients for municipal services.
Description
R thousands
NT Code 0-30 Days 31-60 Days 61-90 Days 91-120 Days 121-150 Dys 151-180 Dys 181 Dys-1 Yr Over 1Yr TotalTotal over 90 days
Actual Bad Debts Written Off against Debtors
Impairment - Bad Debts i.t.o Council Policy
Debtors Age Analysis By Income Source
Receiv ables from Non-ex change Transactions - Property Rates 1400 (1 366) (344) (3 503) 552 300 9 421 475 12 763 18 299 23 511
Receiv ables from Ex change Transactions - Waste Management 1600 98 102 88 132 121 112 111 8 680 9 443 9 155
Receiv ables from Ex change Transactions - Property Rental Debtors 1700 1 1 3 3 0 1 3 147 160 154
Interest on Arrear Debtor Accounts 1810 213 227 227 233 207 143 111 9 933 11 295 10 627
Other 1900 – – – – – – – 292 292 292
Total By Income Source 2000 (1 053) (13) (3 184) 919 629 9 678 699 31 814 39 489 43 739 – –
2015/16 - totals only – –
Debtors Age Analysis By Customer Group
Organs of State 2200 (1 478) (183) (3 408) 525 132 8 993 67 14 304 18 951 24 021
Commercial 2300 (542) (793) (342) (576) (502) (546) (292) (11 587) (15 181) (13 504)
Households 2400 974 969 969 974 1 008 1 005 935 39 771 46 605 43 692
Other 2500 (7) (7) (404) (4) (9) 226 (10) (10 673) (10 887) (10 470)
Total By Customer Group 2600 (1 053) (13) (3 184) 919 629 9 678 699 31 814 39 489 43 739 – –
KZN265 Nongoma - Supporting Table SC3 Monthly Budget Statement - aged debtors - Mid-Year AssessmentBudget Year 2016/17
Note:
The total amount outstanding for debtors at the end of December 2016 is R39.4 million broken down as per above.
Other strategies:
• Statement of accounts are internally generated and distributed. • Accounts are hand delivered to businesses around town

Mid-year budget and performance assessment report – 2017
Page 23 of 55
23
Table SC4 – budget statement indicates the total amount owed to service providers, third parties and other creditors as at 31 December 2016
Budget Year 2016/17
R thousands
Creditors Age Analysis By Customer Type
Bulk Electricity 100 – – – – – – – 1 727 1 727 2 177
Bulk Water 200 – – – – – – – – – –
PAYE deductions 300 – – – – – – – – – –
VAT (output less input) 400 – – – – – – – – – –
Pensions / Retirement deductions 500 – – – – – – – – – –
Loan repayments 600 – – – – – – – – – –
Trade Creditors 700 1 246 (30) (1) – – – – – 1 216 4 585
Auditor General 800 – – – – – – – – – –
Other 900 6 106 – – – – – – 418 6 523 8 323
Total By Customer Type 1000 7 352 (30) (1) – – – – 2 145 9 467 15 086
Prior year totals for chart (same period)
KZN265 Nongoma - Supporting Table SC4 Monthly Budget Statement - aged creditors - Mid-Year Assessment
181 Days -1 Year
Over 1Year
Total61 - 90 Days
91 - 120 Days
121 - 150 Days
151 - 180 Days
DescriptionNT Code 0 -
30 Days31 -
60 Days
Notes:
The total amount owed to creditors equals to R9.4 million at reporting period.
The R1.7 million is owed to Eskom, however there is agreement to pay R150 000 thousand monthly in order reduce the debt. The other R0.418 million and R6.1 millions relates to provision for land sales advance payments and leave respectively.
The creditors’ age analysis breaks down the outstanding amount in terms of their aging as follows:
• Arc Electricals – Current – R1 246 436.02

Mid-year budget and performance assessment report – 2017
Page 24 of 55
24
Table SC5 shown below is the budget statement indicating the schedule of investments or the investment portfolio of Nongoma municipality as at 31 December 2016.
Investments by maturityName of institution & investment ID
Period of Investment
R thousands Yrs/Months
Municipality
First National Bank - 61315000549 – Call Account – 0 2.2% 1 1 1
First National Bank - 62373063222 – Money Markert – 16 3.4% 1 072 15 155 32 225
First National Bank - 62370638573 – Money Markert – 5 3.4% 510 505 512
First National Bank - 62370639373 – Money Markert – – 3.4% 743 259 280
First National Bank - 74427065468 – 7 Day s Notice – 10 1.1% 1 863 1 842 1 873
First National Bank - 62202226751 – Cheque acc – 5 2.0% 384 923 4 792
First National Bank - 62203761962 Licencing – 4 1.1% 1 222 1 101 1 280
Municipality sub-total 40 5 794 19 785 40 964
TOTAL INVESTMENTS AND INTEREST 2 40 5 794 19 785 40 964
KZN265 Nongoma - Supporting Table SC5 Monthly Budget Statement - investment portfolio - Mid-Year Assessment
RefType of
InvestmentExpiry date
of investment
Market value at end of the
month
Accrued interest for the month
Yield for the month 1
(%)
Market value at beginning of the month
Change in market value
Note:
Total investments and other bank accounts at December 2016 stand at R34.9 million and the return on investment differ as per type of investment.
The above investment and other bank accounts were opened to ensure that each and every funding for grant funded projects is monitored properly and any unspent grants at the end of the financial year are cash-backed.
Mid-year budget and performance assessment report – 2017
Page 25 of 55
25
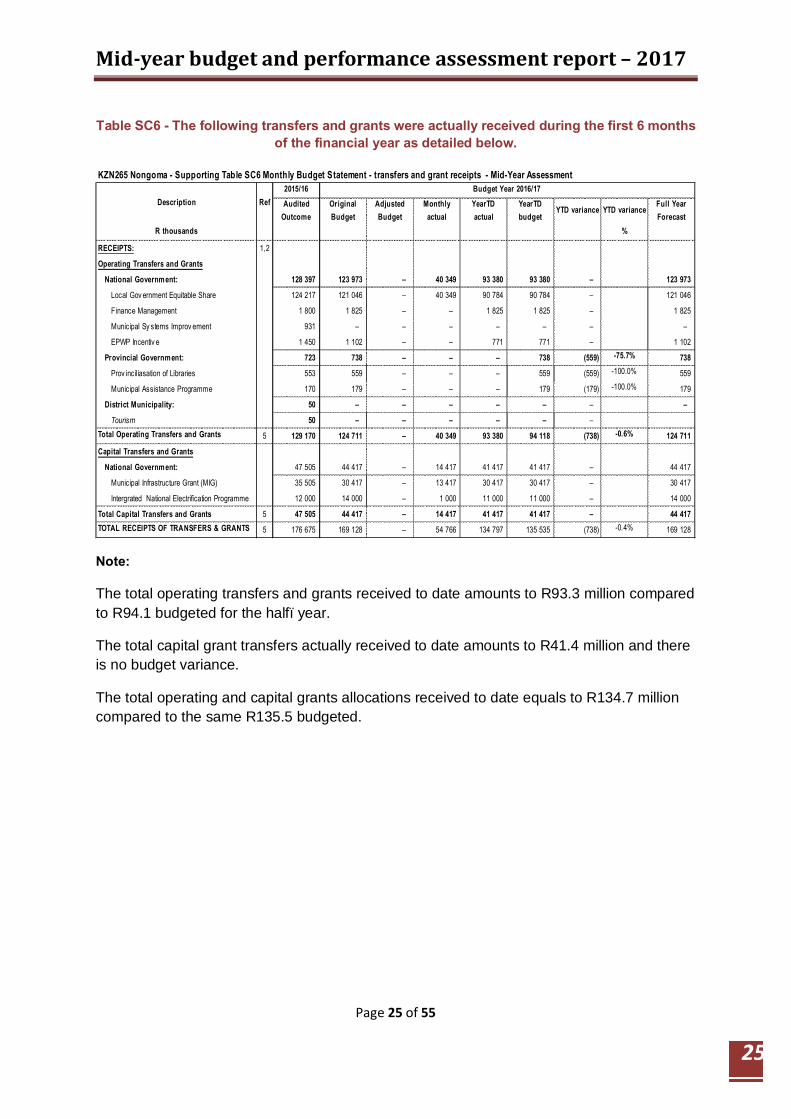
Table SC6 - The following transfers and grants were actually received during the first 6 months of the financial year as detailed below.
2015/16 Budget Year 2016/17Audited
OutcomeOriginal Budget
Adjusted Budget
Monthly actual
YearTD actual
YearTD budget
YTD variance YTD variance Full Year Forecast
R thousands %
RECEIPTS: 1,2
Operating Transfers and Grants
National Government: 128 397 123 973 – 40 349 93 380 93 380 – 123 973
Local Gov ernment Equitable Share 124 217 121 046 – 40 349 90 784 90 784 – 121 046
Finance Management 1 800 1 825 – – 1 825 1 825 – 1 825
Municipal Sy stems Improv ement 931 – – – – – – –
EPWP Incentiv e 1 450 1 102 – – 771 771 – 1 102
Provincial Government: 723 738 – – – 738 (559) -75.7% 738
Prov inciliasation of Libraries 553 559 – – – 559 (559) -100.0% 559
Municipal Assistance Programme 170 179 – – – 179 (179) -100.0% 179
District Municipality: 50 – – – – – – –
Tourism 50 – – – – – – Total Operating Transfers and Grants 5 129 170 124 711 – 40 349 93 380 94 118 (738) -0.6% 124 711
Capital Transfers and Grants
National Government: 47 505 44 417 – 14 417 41 417 41 417 – 44 417
Municipal Infrastructure Grant (MIG) 35 505 30 417 – 13 417 30 417 30 417 – 30 417
Intergrated National Electrification Programme 12 000 14 000 – 1 000 11 000 11 000 – 14 000
Total Capital Transfers and Grants 5 47 505 44 417 – 14 417 41 417 41 417 – 44 417 TOTAL RECEIPTS OF TRANSFERS & GRANTS 5 176 675 169 128 – 54 766 134 797 135 535 (738) -0.4% 169 128
Description Ref
KZN265 Nongoma - Supporting Table SC6 Monthly Budget Statement - transfers and grant receipts - Mid-Year Assessment
Note:
The total operating transfers and grants received to date amounts to R93.3 million compared to R94.1 budgeted for the half–year.
The total capital grant transfers actually received to date amounts to R41.4 million and there is no budget variance.
The total operating and capital grants allocations received to date equals to R134.7 million compared to the same R135.5 budgeted.

Mid-year budget and performance assessment report – 2017
Page 26 of 55
26
Table SC7 (1) – budget statement indicates expenditure on transfers and grants received in the last six months.
2015/16 Budget Year 2016/17Audited
OutcomeOriginal Budget
Adjusted Budget
Monthly actual
YearTD actual
YearTD budget
YTD variance YTD varianceFull Year Forecast
R thousands %
EXPENDITURE
Operating expenditure of Transfers and Grants
National Government: 128 397 123 973 – 12 999 57 446 61 987 (4 541) -7.3% –
Local Gov ernment Equitable Share 124 217 121 046 12 858 55 586 60 523 (4 937) -8.2% 121 046
Finance Management 1 800 1 825 18 1 121 913 208 22.8% 1 825
Municipal Sy stems Improv ement 931 – – – – – –
EPWP Incentiv e 1 450 1 102 123 740 551 189 34.2% 1 102
Provincial Government: 850 738 – 18 687 649 39 5.9% 738
Prov inciliasation of Libraries 553 559 – 559 559 – 559
Community Library Serv ices 170 179 18 128 90 39 43.1% 179
Sport Fields Maintanance 127 – – –
District Municipality: 60 – – – – – – –
Tourism 60 – Total operating expenditure of Transfers and Grants: 129 307 124 711 – 13 017 58 133 62 635 (4 502) -7.2% –
Capital expenditure of Transfers and Grants
National Government: 47 505 44 417 – 9 122 37 488 22 074 15 414 69.8% 44 417
Municipal Infrastructure Grant (MIG) 35 505 30 417 6 408 26 033 15 074 10 959 72.7% 30 417
Intergrated National Electrification Programme 12 000 14 000 2 714 11 455 7 000 4 455 63.6% 14 000
Total capital expenditure of Transfers and Grants 47 505 44 417 – 9 122 37 488 22 074 15 414 69.8% 44 417
TOTAL EXPENDITURE OF TRANSFERS AND GRANTS 176 812 168 858 – 22 139 95 621 84 709 10 912 12.9% 168 858
Description Ref
KZN265 Nongoma - Supporting Table SC7(1) Monthly Budget Statement - transfers and grant expenditure - Mid-Year Assessment
Note:
Total grant spent is R95.6 million compared to R84.7 million budgeted.
Equitable share spent amounts to R55.5 million leaving the balance of R35.2 million.
Table SC7 (1) – Supporting schedule reflects expenditure approved rollovers.
The council to note that there were No approved rollovers for unspent conditional grants allocations. Hence nothing disclosed.

Mid-year budget and performance assessment report – 2017
Page 27 of 55
27
Table SC8 – budget statement indicates the employee related expenditure incurred by the municipality since the beginning of current financial year.
2015/16 Budget Year 2016/17Audited
OutcomeOriginal Budget
Adjusted Budget
Monthly actual
YearTD actual
YearTD budget
YTD variance YTD varianceFull Year Forecast
R thousands %
1 A B C D
Councillors (Political Office Bearers plus Other)
Basic Salaries and Wages 6 848 7 416 – 627 3 711 3 708 3 0% 7 416
Pension and UIF Contributions 1 027 1 047 – 88 517 524 (7) -1% 1 047
Medical Aid Contributions 221 229 – 6 44 115 (71) -62% 229
Motor Vehicle Allow ance 2 690 2 860 – 239 1 415 1 430 (15) -1% 2 860
Cellphone Allow ance 1 026 975 – 73 435 488 (53) -11% 975
Other benefits and allow ances 682 187 – 13 75 94 (19) -20% 187
Sub Total - Councillors 12 495 12 716 – 1 045 6 196 6 358 (162) -3% –
% increase 4 1.8%
Senior Managers of the Municipality 3
Basic Salaries and Wages 3 896 5 086 – 258 1 422 2 543 (1 121) -44% 5 086
Pension and UIF Contributions 156 11 – 1 4 5 (1) -25% 11
Medical Aid Contributions – 99 – 5 27 50 (22) -45% 99
Performance Bonus 500 – – – – – – –
Motor Vehicle Allow ance 1 333 1 198 – 93 517 599 (82) -14% 1 198
Cellphone Allow ance 304 358 – 21 114 179 (65) -36% 358
Other benefits and allow ances 308 0 – 105 121 0 121 55563% 0
Pay ments in lieu of leav e 85 – – – – – – –
Sub Total - Senior Managers of Municipality 6 580 6 752 – 483 2 206 3 376 (1 170) -35% –
% increase 4 2.6%
Other Municipal Staff
Basic Salaries and Wages 28 887 39 002 – 3 281 4 676 19 501 (14 825) -76% 39 002
Pension and UIF Contributions 9 390 9 880 – 786 5 124 4 940 184 4% 9 880
Medical Aid Contributions 1 838 1 948 – 192 1 166 974 192 20% 1 948
Ov ertime 2 566 2 373 – 48 819 1 187 (367) -31% 2 373
Performance Bonus 2 644 3 242 – 9 3 198 1 621 1 577 97% 3 242
Motor Vehicle Allow ance 358 852 – 142 961 426 535 126% 852
Cellphone Allow ance 420 – – – – – – –
Housing Allow ances 62 67 – 3 24 34 (10) -29% 67
Other benefits and allow ances 632 1 639 – 290 1 650 819 272.68 831 101% 1 639
Pay ments in lieu of leav e 1 795 – – – – – – –
Sub Total - Other Municipal Staff 48 593 59 003 – 4 750 17 618 29 502 (11 884) -40% –
% increase 4 21.4%
Total Parent Municipality 67 668 78 471 – 6 278 26 020 39 235 (13 216) -34% – 16.0%
TOTAL SALARY, ALLOWANCES & BENEFITS 67 668 78 471 – 6 278 26 020 39 235 (13 216) -34% –
% increase 4 16.0%
TOTAL MANAGERS AND STAFF 55 173 65 755 – 5 233 19 824 32 878 (13 054) -40% –
Summary of Employee and Councillor remuneration Ref
KZN265 Nongoma - Supporting Table SC8 Monthly Budget Statement - councillor and staff benefits - Mid-Year Assessment

Mid-year budget and performance assessment report – 2017
Page 28 of 55
Table SC9 – budget statement indicates the actual and revised cash receipts as at the end of the reporting period.
KZN265 Nongoma - Supporting Table SC9 Monthly Budget Statement - actuals and revised targets for cash receipts - Mid-Year Assessment
July August Sept October Nov Dec January Feb March April May June
R thousands 1 Outcome Outcome Outcome Outcome Outcome Outcome Budget Budget Budget Budget Budget Budget
Cash Receipts By Source
Property rates 615 548 631 4 300 1 103 2 235 1 221 1 221 1 221 1 221 1 221 (881) 14 657 15 537 16 469
Property rates - penalties & collection charges – – – – – – 164 164 164 164 164 1 148 1 967 2 085 2 210
Serv ice charges - refuse 55 42 30 76 71 62 75 75 75 75 75 186 895 950 1 006
Rental of facilities and equipment 4 11 4 6 2 – 7 7 7 7 7 21 86 91 96
Interest earned - ex ternal inv estments 176 183 181 119 74 146 143 143 143 143 143 124 1 720 1 827 1 935
Fines 2 1 2 1 0 3 6 6 6 6 6 33 70 75 79
Licences and permits 57 55 91 72 41 58 60 60 60 60 60 42 715 760 804
Transfer receipts - operating 50 435 2 101 – – 495 40 349 276 20 349 10 757 124 761 131 270 137 796
Other rev enue 58 145 64 64 111 528 34 34 34 34 34 (730) 410 436 461
Cash Receipts by Source 51 401 3 085 1 004 4 639 1 897 43 381 1 710 1 985 22 059 1 710 1 710 10 700 145 282 153 030 160 857
Other Cash Flows by Source –
Transfer receipts - capital 21 000 2 000 1 000 1 000 2 000 14 417 – – 14 806 – – (11 806) 44 417 44 567 49 276
Borrow ing long term/refinancing – – – – – – 496 496 496 496 496 3 471 5 950 – –
Receipt of non-current debtors 3 585 – – – 4 920 – – – – – – (8 504)
Receipt of non-current receiv ables – – – – – – 27 27 27 27 27 188 322 1 816 1 810
Total Cash Receipts by Source 75 986 5 085 2 004 5 639 8 817 57 798 2 233 2 508 37 387 2 233 2 233 (5 951) 195 971 199 413 211 943
Cash Payments by Type –
Employ ee related costs 6 550 5 526 5 561 3 233 11 056 5 243 5 480 5 480 5 480 5 480 5 480 1 189 65 755 70 725 74 003
Remuneration of councillors 972 1 045 1 045 1 045 1 045 1 045 1 060 1 060 1 060 1 060 1 060 1 221 12 716 13 478 14 287
Interest paid 0 0 – 0 – – 40 40 40 40 40 280 482 391 292
Contracted serv ices 1 266 1 580 1 562 1 753 1 067 1 384 1 483 1 483 1 483 1 483 1 483 1 768 17 795 18 620 19 465
Grants and subsidies paid - other municipalities – – – – 5 – 5 5 5 5 5 30 60
Grants and subsidies paid - other – – – – 13 – 13 13 13 13 13 79 157 167 177
General ex penses 4 481 5 017 4 526 4 735 3 686 5 327 3 252 3 252 3 252 3 252 3 252 (5 008) 39 023 41 442 43 885
Cash Payments by Type 13 269 13 168 12 694 10 767 16 871 12 999 11 332 11 332 11 332 11 332 11 332 (441) 135 988 144 823 152 111
Other Cash Flows/Payments by Type
Capital assets 12 544 5 740 7 018 3 995 2 144 9 631 4 514 4 514 4 514 4 514 4 514 (9 474) 54 167 49 667 50 776
Repayment of borrow ing 27 27 – – – – 127 127 127 127 127 835 1 524 1 473 1 473
Total Cash Payments by Type 25 839 18 935 19 712 14 761 19 015 22 629 15 973 15 973 15 973 15 973 15 973 (9 080) 191 679 195 964 204 360 NET INCREASE/(DECREASE) IN CASH HELD 50 147 (13 850) (17 708) (9 123) (10 198) 35 169 (13 741) (13 465) 21 414 (13 741) (13 741) 3 129 4 292 3 449 7 583
Cash/cash equiv alents at the month/y ear beginning: 6 509 56 655 42 805 25 097 15 975 5 776 40 945 27 205 13 740 35 154 21 413 7 672 6 509 10 801 14 250
Cash/cash equiv alents at the month/y ear end: 56 655 42 805 25 097 15 975 5 776 40 945 27 205 13 740 35 154 21 413 7 672 10 801 10 801 14 250 21 833
Budget Year +1 2017/18
Budget Year +2 2018/19
DescriptionBudget Year
2016/17
RefBudget Year 2016/17
2016/17 Medium Term Revenue & Expenditure Framework
Notes:
The total cash and cash equivalents at the end of December 2016 amounts to R40.9million which is the total cash available in all municipal bank accounts.

Mid-year budget and performance assessment report – 2017
Page 29 of 55
Table SC12 – Budget statement indicates the capital expenditure trends as at the end of the reporting period.
2015/16
Audited Outcome
Original Budget
Adjusted Budget
Monthly actual
YearTD actual
YearTD budget
YTD variance YTD variance% spend of
Original Budget
R thousands %
Monthly expenditure performance trend
July 4 370 4 514 9 813 9 813 4 514 (5 299) -117.4% 18%
August 4 370 4 514 5 319 15 132 9 028 (6 104) -67.6% 28%
September 4 370 4 514 6 813 21 944 13 542 (8 403) -62.0% 41%
October 4 370 4 514 3 578 25 522 18 056 (7 466) -41.4% 47%
Nov ember 4 370 4 514 2 109 27 631 22 570 (5 061) -22.4% 51%
December 4 370 4 514 8 268 35 899 27 083 (8 815) -32.5% 66%
January 4 370 4 514 31 597 –
February 4 370 4 514 36 111 –
March 4 370 4 514 40 625 –
April 4 370 4 514 45 139 –
May 4 370 4 514 49 653 –
June 4 370 4 514 54 167 –
Total Capital expenditure 52 438 54 167 – 35 899
Month
KZN265 Nongoma - Supporting Table SC12 Monthly Budget Statement - capital expenditure trend - Mid-Year AssessmentBudget Year 2016/17

Mid-year budget and performance assessment report – 2017
Page 30 of 55
Table SC13 (a) – budget statement indicates capital expenditure by assets class.
2015/16 Budget Year 2016/17Audited
OutcomeOriginal Budget
Adjusted Budget
Monthly actual
YearTD actual
YearTD budget
YTD variance YTD varianceFull Year Forecast
R thousands 1 %
Capital expenditure on new assets by Asset Class/Sub-class
Infrastructure 48 487 46 617 – 7 767 33 472 23 309 (10 164) -43.6% 46 617
Infrastructure - Road transport 36 487 32 617 – 5 386 25 382 16 309 (9 074) -55.6% 32 617
Roads, Pavements & Bridges 36 487 32 617 – 5 386 25 382 16 309 (9 074) -55.6% 32 617
Infrastructure - Electricity 12 000 14 000 – 2 380 8 090 7 000 (1 090) -15.6% 14 000
Transmission & Reticulation 12 000 14 000 2 380 8 090 7 000 (1 090) -15.6% 14 000
Community 402 200 – 282 522 100 (422) -421.6% 200
Other 402 200 282 522 100 (422) -421.6% 200
Other assets 3 550 7 350 – 220 1 902 3 675 1 773 48.3% 7 350
General v ehicles 2 580 5 950 – 1 380 2 975 1 595 53.6% 5 950
Plant & equipment 315 650 220 225 325 100 30.7% 650
Computers - hardw are/equipment 190 243 – 61 122 61 49.8% 243
Furniture and other office equipment 465 507 – 236 254 18 7.1% 507
Total Capital Expenditure on new assets 1 52 438 54 167 47 016 8 268 35 896 27 084 (8 812) -32.5% 54 167
Description Ref
KZN265 Nongoma - Supporting Table SC13a Monthly Budget Statement - capital expenditure on new assets by asset class - Mid-Year Assessment
Mid-year budget and performance assessment report – 2017
Page 31 of 55
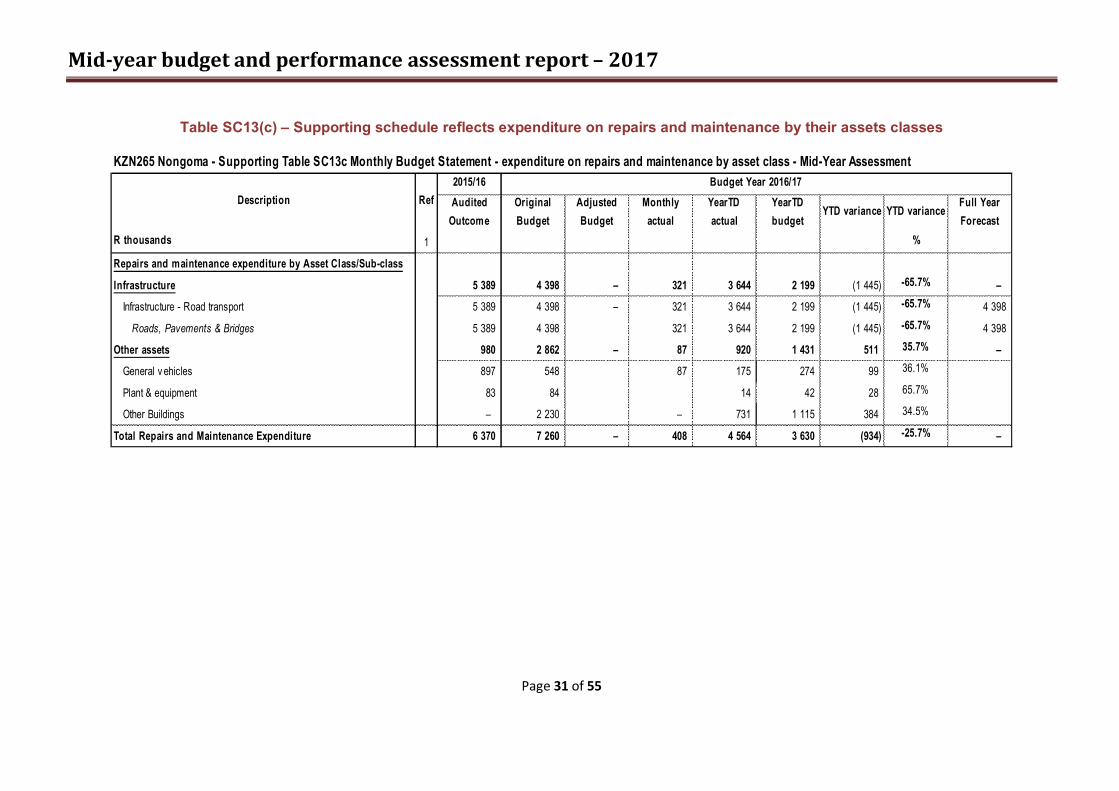
Table SC13(c) – Supporting schedule reflects expenditure on repairs and maintenance by their assets classes
2015/16 Budget Year 2016/17Audited
OutcomeOriginal Budget
Adjusted Budget
Monthly actual
YearTD actual
YearTD budget
YTD variance YTD varianceFull Year Forecast
R thousands 1 %
Repairs and maintenance expenditure by Asset Class/Sub-class
Infrastructure 5 389 4 398 – 321 3 644 2 199 (1 445) -65.7% –
Infrastructure - Road transport 5 389 4 398 – 321 3 644 2 199 (1 445) -65.7% 4 398
Roads, Pavements & Bridges 5 389 4 398 321 3 644 2 199 (1 445) -65.7% 4 398
Other assets 980 2 862 – 87 920 1 431 511 35.7% –
General v ehicles 897 548 87 175 274 99 36.1%
Plant & equipment 83 84 14 42 28 65.7%
Other Buildings – 2 230 – 731 1 115 384 34.5%
Total Repairs and Maintenance Expenditure 6 370 7 260 – 408 4 564 3 630 (934) -25.7% –
KZN265 Nongoma - Supporting Table SC13c Monthly Budget Statement - expenditure on repairs and maintenance by asset class - Mid-Year Assessment
Description Ref

Mid-year budget and performance assessment report – 2017
Page 32 of 55
Table SC13 (d) – Supporting schedule reflects expenditure on depreciation and asset impairment by assets classes.
2015/16 Budget Year 2016/17Audited
OutcomeOriginal Budget
Adjusted Budget
Monthly actual
YearTD actual
YearTD budget
YTD variance YTD varianceFull Year Forecast
R thousands 1 %
Depreciation by Asset Class/Sub-class
Infrastructure 9 066 9 963 – 846 5 075 4 982 (94) -1.9% –
Infrastructure - Road transport 9 066 9 963 – 846 5 075 4 982 (94) -1.9% –
Roads, Pavements & Bridges 9 066 9 963 846 5 075 4 982 (94) -1.9% 9 963
Other assets 1 330 187 – – – 94 94 100.0% –
General v ehicles –
Specialised vehicles – – – – – – – –
Plant & equipment 1 330 187 94 94 100.0% 187
Computers - hardw are/equipment –
Furniture and other office equipment –
Total Depreciation 10 396 10 151 – 846 5 075 5 075 0 0.0% –
KZN265 Nongoma - Supporting Table SC13d Monthly Budget Statement - depreciation by asset class - Mid-Year Assessment
Description Ref

Mid-year budget and performance assessment report – 2017
Page 33 of 55
Free Basic Electricity
The table below reflects the expenditure on free basic electricity and the number of indigent people receiving the free service. Not all indigent are currently receiving free basic electricity. An indigent register need to be finalized. The expected consumption is likely to increase once all indigent people have been registered with Eskom.
MONTH CUSTOMER NUMBER KWH/UNITS CONSUMED PER HOUSEHOLD COST/KWV(EXCL VAT COSTSJuly 2016 3466 50 KWH 0.96 153 097.98 August 2016 3451 50 KWH 0.96 166 870.59 September 2016 3474 50 KWH 0.96 166 148.42 October 2016 3443 50 KWH 0.96 167 255.75 November 2016 3365 50 KWH 0.96 165 763.27 December 2016 3478 50 KWH 0.96 162 007.93
Total 981 143.94
• The total expenditure on free basic electricity to date amounts to R981 143.94

Mid-year budget and performance assessment report – 2017
Page 34 of 55
34
SCM MID-YEAR REPORT
IMPLEMENTATION OF THE
SUPPLY CHAIN MANAGEMENT POLICY
OF
NONGOMA LOCAL MUNICIPALITY
(AS PER SECTION 6 (3) (4) OF THE MUNICIPAL SCM
REGULATION

Mid-year budget and performance assessment report – 2017
Page 35 of 55
35
1. INTRODUCTION
The Council delegated powers and duties to discharge responsibilities conferred on the Accounting Officer in terms of Chapter 8 or 10 of the Municipal Finance Management Act and the Supply Chain Management Policy in order to maximize administrative and operational implementation, enforce reasonable cost effective majors for the prevention of Fraud and corruption (irregularities) during the implementation of the Supply Chain Management Policy. In terms of section 71(1) of the Municipal Finance Management Act, the accounting officer must not later than ten (10) working days after the end of each month submit to the Mayor and the Provincial Treasury a report on Supply Chain Management in the prescribed format.
1. Accounting officer may sub-delegate powers and duties in terms of Section 79 or 106 of the Municipal Finance Management Act.
2. The Powers to make a final award of the bid are the responsibility of the Accounting Officer or a person acting on his behalf
3. Accounting Officer must submit a report on the implementation of the Supply Chain Management Policy to Council within thirty (30) days of each financial year end.
4. SCM regulations 6 (3) states that the accounting Officer must submit a report on the implementation of the Supply Chain Management Policy to the Mayor within ten (10) days of each month.
5. The accounting officer must immediately report problems on the implementation of the policy to Council.

Mid-year budget and performance assessment report – 2017
Page 36 of 55
36
2. SCM POLICY AND PROCEDURES 2.1 The accounting officer/Municipal Manager must review the
implementation of the policy, consider and submit proposals to Council. The policy must comply with the regulations; amendments must be uniform in supply chain management practices, procedures and promote accessibility and transparency. It is the Accounting Officer’s responsibility to implement the Supply Chain Management Policy.
2.2 DELEGATIONS
2.2.1 Accounting officer may sub-delegate powers and duties in terms of Section 79 or 106 of the Municipal Finance Management Act.
2.2.2 The Powers to make a final award of the bid are the responsibility of the Accounting Officer or a person acting on his behalf.
2.2.3 Accounting Officer must submit a report on the implementation of the Supply Chain Management Policy to Council within thirty (30) days of each financial year end.
2.2.4 SCM regulations 6 (3) states that the accounting Officer must submit a report on the implementation of the Supply Chain Management Policy to the Mayor within ten (10) days of each month.
2.2.5 The accounting officer must immediately report problems on the implementation of the policy to Council.
3. FUNCTION OF SCM UNIT
3.1.1 Municipal SCM Policy has been fully aligned with the new PPPFA
Regulations of 2011 and has been approved by Council on the 8th June 2012.
3.1.2 Municipal SCM Delegations are in place and have been approved by the Municipal Manager.
3.1.3 The financial disclosure form has been given to all bid committee members, SCM Practitioners and role players to declare their interest
Mid-year budget and performance assessment report – 2017
Page 37 of 55
37
3.1 DECLARATION OF INTEREST It be noted that none of the officials involved in the supply chain management processes has declared any interest on bids awarded in the above reporting period.
3.2 ADEQUACY OF PERSONNEL WITHIN SCM For the supply chain management unit to be fully functional, we require (1) SCM Accountant has been appointed on the 1st December 2014, one (1) SCM Practitioners has been appointed in 8th November 2013 and an Intern and the SCM Practitioner was appointed on the 4th January 2016.
4. FUNCTIONING OF BID COMMITTES
4.1 All bid committees are functional, as the accounting office has appointed all committee members to serve in various committees, namely the Bid Specification Committee, Bid Evaluation Committee and the Bid Adjudication Committee.
4.2 The Bid committees meet on a regular basis, or when there is a need for that specific committee to have a seating.
4.3 Bid Specification and Evaluation Committee members sign their declaration form at every seating.

Mid-year budget and performance assessment report – 2017
Page 38 of 55
38
5. SECTION 114 DEVIATIONS
Section 114 of the MFMA permits the Accounting Officer to approve a tender “other than the one recommended through normal procurement processes”. The Accounting Officer is required to report such a deviation to the Auditor-General, the Provincial Treasury, and the National Treasury, stating the reasons that necessitated such a decision. If such expenditure is not defined as “unauthorised expenditure” then it is “irregular Expenditure”. In the course of implementing the SCM policy of the Municipality, following MFMA Section 114 deviations were authorised by the Accounting Officer. There were no Section 114 Deviations (authorised by the Accounting Officer) for the mid-year term ending 31st December 2016.
DESCRIPTION
BID/QUOTE No.
DATE OF AWARD
BID/QUOTATION AWARDED TO
CONTRACT AMOUNT
REASON FOR DEVIATION
NOTIFICATIONS
A-G
NAT. TREASURY
PROV.
TREASURY
1.
2.
3.

Mid-year budget and performance assessment report – 2017
Page 39 of 55
6. REGULATION 36 DEVIATIONS Regulations 36 of the Municipal SCM regulations of 2005 permits the Accounting Officer to “dispense with the official procurement processes established by the policy and to procure any required goods or services through any convenient process”. This would typically include urgent and emergency cases, single source goods, and any other cases where it is impractical to follow SCM process. In the event of such a decision, the accounting officer is required to report this to the next Council Meeting The following deviations took place during past six month ending 31st December 2016
DESCRIPTION OF ITEM PROCURED
DEPARTMENT DATE OF AWARD
AWARDED TO CONTRACT AMOUNT
REASON FO DEVIATION
Qualification in terms SCM S36
1. The Municipal grader, Mitsubishi Grade Master M/G530-NND 957 was due for 6 000 hours service
Corporate Services
14/07/2016 Golden Touch Trading 20 CC
R46 996.50 The service was undertaken and further strip and quote was done
S36(v)
Impractical or impossible to follow official procurement
2. Advertisement in government gazette
Finance 15/07/2016 Government Printing Works
R3 000.00 Sole supplier for such aspects
S36(ii)
Sole supplier
3. Flight booking for SALGA convening of a special national members assembly for Mayor and bodyguards, Speaker, MM and CFO
Finance 26/07/2016 Harvey World Travel R21 750.00 There are the only travel agent that managed to get flight seats on the requested dates
S36( I )
Emergency

Mid-year budget and performance assessment report – 2017
Page 40 of 55
4. The Municipal vehicle Toyota Fortuner 3.0D4D was taken to dealer garage in Pongola for repairs and maintenance
Corporate Services
11/08/2016 Pongola Toyota R24 326.28
The dealer garage and had to do strip and quote.
S36(ii)
Sole supplier
5. The Municipal vehicle Toyota land Cruiser VX (Prado) KZ 265-ZN was taken to dealer garage for repairs
Corporate Services
17/08/2016 Pongola Toyota R1 889.63 The supplier is the dealer garage and the right rear wheel pressure sensor had to be urgently replaced.
S36(ii)
Sole supplier
6. Registration for ISOCARP Conference for 2 delegates from planning department
Planning 30/08/2016 International Society of City and Regional Planners
R5 000.00 This is the council for planner’s profession.
S36(ii)
Sole supplier
7. MFMP programme continuation for Mr I. R Barnes
Corporate Services
09/09/2016 SUMMAT R13 110.00
For curriculum administration purpose the official is recommended to continue with the service provider to enable him to obtain the 5 unit standards for the completion of the full programme as a minimum competency
S36(v)
Impractical or impossible to follow official procurement
processes
8. MFMP programme continuation for Mr M.E
Corporate Services
20/09/2016 KYM Consulting R29 440.00 For curriculum administration purpose
S36(v)
Impractical or

Mid-year budget and performance assessment report – 2017
Page 41 of 55
Sithole
the official is recommended to continue with the service provider to enable him to obtain the 16 unit standards for the completion of the full programme as a minimum competency
impossible to follow official procurement
processes
9. Gazetting of the outdoor Advertising By law and Nongoma municipality SPLUMA Powers of delegation
Planning 20/09/2016 Government Gazette R103 000.83 Only available supplier who offers such services
S36(ii)
Sole supplier
10. Graduation Gowns for Inauguration Ceremony
Corporate Services
01/10/2016 Academic Apparel Industries CC
R16 176.60 The gowns were not in the initial plan of goods to be procured for the event, on the eve of the event it was realized that it is very critical for the councillors to use them.
S36(v)
Impractical or impossible to follow official procurement
processes
11. Accommodation for workshop of municipal councillors on Rules and Standing Orders.
Office of the Mayor
07/10/2016 Garden Court Ulundi R333 696.40 The service provider is the only one which can accommodate large mass of people.
S36(ii)
Sole supplier

Mid-year budget and performance assessment report – 2017
Page 42 of 55
12. Quarry( grovel) for the access road during the inauguration ceremony
Technical Services
10/10/2016 Sinethemba Africa Contractors
R12 600.00 The inclement weather caused the access road to be inaccessible as a result of mud on the road and there was an urgent need for the quarry to make the road suitable for vehicles to access the venue
S36(i)
Emergency
13. Catering for the inauguration of new council
Office of the Mayor
14/10/2016 Baphelele Catering PTY Ltd
R17 600.00 An urgent need for extra catering was needed during the inauguration as the number of people escalated beyond the number provided for
S36(i)
Emergency
14. The Municipal Truck Isuzu FTR 850 –NND 4384 damaged the steel wire rope and it was unable to collect waste in town
Corporate Services
15/10/2016 Scaw Metal Group R1 036.50 Since it was an emergency this service provider had to purchase the steel wire rope.
S36(i)
Emergency
15. Municipal Grade Master-Mitsubishi M/G 530-NND 957 was taken in for repairs and maintenance
Corporate Services
15/10/2016 Golden Touch Trading 20 CC
R117 414.30 repairs made exceeded threshold of R 30000 -strip and quote was undertaken
S36(i)
Emergency
16. Payment for Outstanding fees for the training of Mr P
Corporate Services
24/10/2016 Department of Community Safety
R22 343.40 Due to outstanding fees the college could not
S36(ii)

Mid-year budget and performance assessment report – 2017
Page 43 of 55
Zulu at Boukenhoutkloof Traffic College
Gauteng Provincial Government SA
issue a certificate for Mr Zulu since he was their student and they were the only training facility
Sole supplier
17. Accommodation for Strategic Planning session for officials and councillors
Office of the MM
26/10/2016 Cathedral Peak Hotel R269 023.50 The service provider was the only one that could host the municipality proposed dates.
S36(ii)
Sole supplier
18. The Municipal Vehicle Isuzu FTR 850 damaged the main radiator/ engine hose and the gear was not selecting gears properly
Corporate Services
26/10/2016 Golden Touch Trading 20 CC
R14 284.20 The service provider had to undertake a strip and quote.
S36(i)
Emergency
19. The Municipal vehicle Toyota Prado Kz 265-ZN was sent to dealer garage for 80 000km service
Corporate services
27/10/2016 Pongola Toyota R2 454.32 Upon the service it was discovered that the brake pads were required- replaced
S36(ii)
Sole supplier
20. Gazetting of the Nongoma Municipality Out-Door Advertising By Law
Planning 07/11/2016 Government Printing Works
R87 000.70 Only supplier who provides such services
S36(ii)
Sole supplier
21. Workshop on advanced protocol and events management for 3 officials
Corporate 10/11/2016 HTI Solutions R11 966.58 The training is classified as a national conference for protocol coordinators in public sector including municipal council and
S36(ii)
Sole supplier

Mid-year budget and performance assessment report – 2017
Page 44 of 55
this service provider is the only one who offers this type of capacity building
22. Payment for damages on Mr MM Zulu for the BMW X1 Registration Number-NUR 64253
Social services 21/11/2016 SMG Umhlanga Pty limited
R21 622.53 Mr Zulu’s car was damaged by ABSA link Road of which is the responsibility of the municipality to maintain it, so to prevent legal charges, assessment was done on the car and the lowest quote was taken to fix the damage.
S36(v)
Impractical or impossible to follow official procurement
processes
23. The Municipal trailer NND 4067 that is used to collect waste around Nongoma Town damaged the lift cylinders
Corporate services
22/11/2016 Golden Touch Trading 20 CC
R16 934.70 Since it was an emergency , a call out was made to the appointed service provider to do strip and quote and repairs for the cylinder
S36(i)
Emergency
24. The Municipal trailer NND 4067 that is used to collect waste around Nongoma Town damaged the lift
Corporate services
22/11/2016 Golden Touch Trading 20 CC
R49 818.00 Since it was an emergency , a call out was made to the appointed service provider to do strip and
S36(i)
Emergency

Mid-year budget and performance assessment report – 2017
Page 45 of 55
cylinders quote and repairs and it also supplied the municipality with two cylinders
25. Registration fees for SALGA National Members Assembly
Office of the MM
22/11/2016 SALGA R56 000.00 The Nongoma Municipality is an affiliate of SALGA, it is therefore requested that the accounting officer approves the payment for the registration fee for 7 delegates
S36(v)
Impractical or impossible to follow official procurement
processes
26. Accommodation for Councillors and Amakhosi who were nominated to attend Sector Based Councillor Orientation Programme at Umhlathuze Auditorium, Richards Bay
Office of the Mayor
23/11/2016 Premier Hotel The Richards
R59 290.00 Due to the nature of service(accommodation) which cost more than R30 000 it was impractical to follow scm processes
S36(v)
Impractical or impossible to follow official procurement
processes
27. Flights for SALGA National Members Assembly
Office of the Mayor
25/11/2016 Harvey World Travel R12 861.66 All municipalities were expected to participate and due to the emergency it was impossible to get 3 quotations
S36(i)
Emergency

Mid-year budget and performance assessment report – 2017
Page 46 of 55
28. The municipal vehicle –Landini 8865 (NND 4067) was taken in for repairs because the slasher was damaged
Corporate Services
02/12/2016 Tractor & Implement R7 020-69 The slasher was damaged and there was nothing to cut the grass. And it was supposed to be repaired and it was impossible to follow scm processes.
S36(v)
Impractical or impossible to follow official procurement
processes
29. Hiring of a backup vehicle for the office of the honourable Mayor
Corporate Services
02/12/2016 Avis van Rental R36 769.32 Additional costs over and above quoted amount.
S36(v)
Impractical or impossible to follow official procurement
processes
30. The Municipal Vehicle Isuzu FTR 850 – NND 4384 needs 6 tyres.
Corporate Services
06/12/2016 Supa quick R41 261.62 The cost were more than R30 000 threshold.
S36(i)
Emergency
31. Hiring of 8 Ton truck from Van rental to be utilized for waste collection.
Corporate Services
06/12/2016 Avis Van Rental R 29 850.03 The truck was needed urgently for the collection of waste.
S36(i)
Emergency
32. Donation to the Royal King’s event
Office of the MM
13/12/2016 Nogabisela Construction
R22 500.00 His Majesty, the king of the Zulu nation was celebrating 45 years on the throne and the municipality donated with 2 cows – urgently
S36(v)
Impractical or impossible to follow official procurement

Mid-year budget and performance assessment report – 2017
Page 47 of 55
required
processes
33. Transportation to the Royal King’s event
Office of the MM
13/12/2016 Ulundi Bus Services R5 000.00 His Majesty, the king of the Zulu nation was celebrating 45 years on the throne and the municipality provided a bus to transport izinduna – urgently required
S36(v)
Impractical or impossible to follow official procurement
processes
34. Transportation of 100 participants to Abaqulusi/Mondlo during the Provincial Commemoration of World Aids Day
Office of the MM
13/12/2016 Halala Ncwane Transport
R15 000.00 Emergency supply of transportation of participant to Provincial Commemoration of World Aids Day.
S36(i)
Emergency
35. Transportation to different wards for the election of ward committees
Office of the Mayor
13/12/2016 Nongoma Taxi Owners Association
R166 500.00 Since Nongoma has only one taxi association and it was impossible to follow scm processes
S36(v)
Impractical or impossible to follow official procurement
processes

Mid-year budget and performance assessment report – 2017
Page 48 of 55
36. The Municipal Vehicle Chevloret Aveo 1.6L- NND 4403 was taken to dealer garage for 230 000 kilometre service
Corporate Services
20/12/2016 Provincial Motors R49 768.88 Upon the service it was discovered they discovered that there are extras that needs urgent attention.
S36(ii)
Sole supplier
37. Year –end Function for municipality’s officials and councillors
Corporate Services
20/12/2016 Thokazi Royal Lodge R247 000-00 The appointed service provider was the only available venue big enough to accommodate all officials and councillors as the others had declined because they didn’t have the capacity for such huge numbers.
S36(ii)
Sole supplier
7. REPORTS ON UNATHORISED; IRREGULAR; FRUITLESS & WASTEFUL EXPENDITURE Section 32 (4) of the MFMA requires that the Municipal Manager “PROMPTLY” inform the Mayor, the MEC for Local Government, and the Auditor-General of any unauthorised, irregular, and fruitless and wasteful expenditure that the municipality has incurred. Only Council can deal with these matters in the manner prescribed. There was one report for the mid-year term ending 31st December 2016
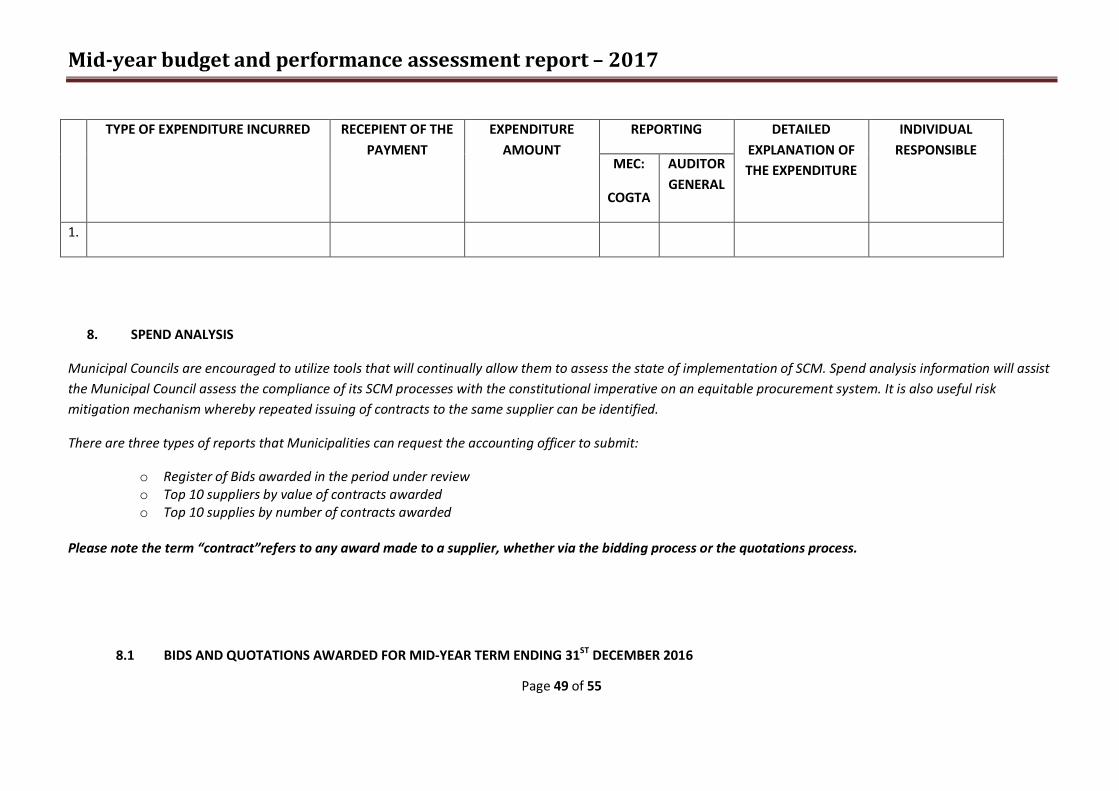
Mid-year budget and performance assessment report – 2017
Page 49 of 55
TYPE OF EXPENDITURE INCURRED RECEPIENT OF THE PAYMENT
EXPENDITURE AMOUNT
REPORTING DETAILED EXPLANATION OF THE EXPENDITURE
INDIVIDUAL RESPONSIBLE
MEC:
COGTA
AUDITOR GENERAL
1.
8. SPEND ANALYSIS
Municipal Councils are encouraged to utilize tools that will continually allow them to assess the state of implementation of SCM. Spend analysis information will assist the Municipal Council assess the compliance of its SCM processes with the constitutional imperative on an equitable procurement system. It is also useful risk mitigation mechanism whereby repeated issuing of contracts to the same supplier can be identified.
There are three types of reports that Municipalities can request the accounting officer to submit:
o Register of Bids awarded in the period under review o Top 10 suppliers by value of contracts awarded o Top 10 supplies by number of contracts awarded
Please note the term “contract”refers to any award made to a supplier, whether via the bidding process or the quotations process.
8.1 BIDS AND QUOTATIONS AWARDED FOR MID-YEAR TERM ENDING 31ST DECEMBER 2016

Mid-year budget and performance assessment report – 2017
Page 50 of 55
SERVICE PROVIDER DATE OF AWARD DESCRIPTION OF
GOODS/SERVICE BBBEE
CONTRIBUTION LEVEL
CONTRACT AMOUNT
1 Tongaat Asphalt JV Thulile Trading 20/07/2016 Construction of Kwa-Musi Sport field
Level 3 R3 399 280.50
2 Mazibuye Trading Enterprise 20/07/2016 Supply and delivery of cleaning material for 36 months
Level 3 R2 648 249.26
3 Nhlangulela Construction and Projects
20/07/2016 Construction of Mphuphusi Sport field ( Ward 5)
Level 1 R3 025 811.71
4 Bargain Uniforms 21/07/2016 Supply and delivery of soccer and basketball jerseys for district mayoral cup 2016
Level 1 R121 125.00
5 Bargain Uniforms 21/07/2016 Supply and delivery of jerseys and balls for local mayoral cup 2016
Level 1 R138 738.00
6 KDM Sports 21/07/2016 Supply and delivery of zipped tracksuits, caps, back packs & T-shirts for district mayoral cup 2016
Level 3 R285 324.90
7 AmaJobe Transport Services Pty Ltd
21/07/2016 Provision of 2 Taxis & 4 Buses for district mayoral cup 2016
Level 1 R66 000.00
8 AmaJobe Transport Services Pty Ltd
21/07/2016 Provision of 84 Taxis for Local Mayoral Cup
Level 1 R119 400.00
9 D-Kane Trading and Projects Primary Co-Op LTD
21/07/2016 Supply and delivery of 1500 T-shirts for local mayoral cup
Level 1 R54 750.00
10 Musa’s Son Trading Enterprise Pty Ltd
22/08/2016 Construction of Kwa-Nene Gravel Road (Ward 4)
Level 1 R2 966 261.76

Mid-year budget and performance assessment report – 2017
Page 51 of 55
11 Isivuno Auctioneers and Brokers Pty Ltd
23/08/2016 Disposal of Nongoma local Municipality Assets
Level 1 10% of total sale
12 AmaJobe transport services Pty Ltd 07/09/2016 Supply of transport for royal reed dance 2016
Level 3 R90 000.00
13 Ingabadi Research Pty Ltd 07/09/2016 Welcoming event of heritage month
Level 1 R383 000.00
14 Umqondo Consultancy 27/09/2016 Provision of municipal Finance Management Programme
Level 1 R270 000.00
15 Surecase Entertainment 27/09/2016 Provision of programming and entertainment for the council inauguration
Level 3 R119 500.00
16 Mphathekahle Construction CC 27/09/2016 Supply of transport for council inauguration
Level 1 R58 800.00
17 Ingabadi Research Pty Ltd 27/10/2016 Facilitation For The Municipal Strategic Planning Session in Preparation for the IDP 2017-2022
Level 1 R160 000.00
18 Masga and Son General Trading 19/12/2016 Supply of Transport for HIV/AIDS and Disabilities Campaign
Level 1 R105 000.00
19 NZMA Trading and projects 19/12/2016 Supply of 2500 seater frame tent for HIV/AIDS and Disabilities Campaign
Level 1 R85 000.00
20 Amanguni production Services 19/12/2016 Programming and entertainment for HIV/AIDS and Disabilities Campaign
Level 3 R92 910.00
21 PGA Consulting 19/12/2016 Buxedene Area Development plan and the whole of ward 8
Level 1 R174 164.00
22 Tshalanang Construction and 19/12/2016 Supply and delivery of Level 1 R187 000.00

Mid-year budget and performance assessment report – 2017
Page 52 of 55
general Services CC protective clothing for pound rangers, disaster and peace officers
23 Interserve training Solutions Pty Ltd
19/12/2016 Training of the 210 municipal ward committee members
Level 1 R296 200.00
24 CA General Supplies and Services Pty Ltd
19/12/2016 Supply and delivery of calendars, diaries, business cards and file folders
Level 1 R179 011.00
8.2 TOP 10 SUPPLIERS BY VALUE OF CONTRACTS (BIDS AND QUOTATIONS)
SERVICE PROVIDER AGGREGRATE VALUE OF CONTRACTS
BBBEE CONTRIBUTING LEVEL
1 Tongaat Asphalt JV Thulile Trading R3 399 280.50 Level 3
2 Nhlangulela Construction and Projects R3 025 811.71 Level 1
3 Musa’s Son Trading Enterprise Pty Ltd R2 966 261.76 Level 1
4 Mazibuye Trading Enterprise R2 648 249.26 Level 3
5 Ingabadi Research Pty Ltd R383 000.00 Level 1
6 Interserve training Solutions Pty Ltd R296 200.00 Level 1
7 KDM Sports R285 324.90 Level 3

Mid-year budget and performance assessment report – 2017
Page 53 of 55
8 Umqondo Consultancy R270 000.00 Level 1
9 Tshalanang Construction and general Services CC R187 000.00 Level 1
10 CA General Supplies and Services Pty Ltd R179 011.00 Level 1
8.3 TOP 10 SUPPLIERS BY NUMBER OF CONTRACTS AWARDED
Contractors that were awarded more than once for the mid-year term ending 31ST DECEMBER 2016
SERVICE PROVIDER MUMBER OF CONTRACTS AWARDED
BBBEEE CONTRIBUTION LEVEL
1 Bargain Uniforms 2 Level 1
2 Ingabadi Research Pty Ltd 2 Level 1
3 AmaJobe transport services Pty Ltd 3 Level 3

Mid-year budget and performance assessment report – 2017
Page 54 of 55
9. SCM COMPLAINTS RECEIVED IN SCM
There was a complaint that was brought into the attention of SCM UNIT for the mid-year term ending 31st December 2016.
DATE COMPLAINT RECEIVED
NAME OF COMPLAINANT
BID/QUOTATION DESCRIPTION AND
REFERENCE
SUMMARY OF COMPLAINANT OUTCOME OF THE PROCES AND DATE OF
FINALISATION
12/07/2016 Dinani Trading Enterprise
NLMMIG 015/2015/16 Bidder not satisfied with the reason of why they were not awarded the tender
Finalized, The award was correctly done.

Mid-year budget and performance assessment report – 2017
Page 55 of 55
55
QUALITY CERTIFICATION I, Mr. BE Ntanzi , Municipal Manager of Nongoma Municipality, hereby certify that the Mid-year Budget and Performance Assessment for the six months ended 31 December 2016 has been prepared in accordance with the Municipal Finance Management Act and Regulations made under the Act.
__________________________________
Mr. BE Ntanzi
MUNICIPAL MANAGER
DATE: