mid- to late-holocene australian-indonesian summer monsoon variability · mid- to late-holocene...
TRANSCRIPT

lable at ScienceDirect
Quaternary Science Reviews 93 (2014) 142e154
Contents lists avai
Quaternary Science Reviews
journal homepage: www.elsevier .com/locate/quascirev
Mid- to Late-Holocene AustralianeIndonesian summer monsoonvariability
Stephan Steinke a,*, Mahyar Mohtadi a, Matthias Prange a, Vidya Varma a,1,Daniela Pittauerova b, Helmut W. Fischer b
aMARUM eCenter for Marine Environmental Sciences and Department of Geosciences, University of Bremen, 28359 Bremen, GermanybBremen State Radioactivity Measurements Laboratory, Institute of Environmental Physics (IUP), University of Bremen, 28359 Bremen, Germany
a r t i c l e i n f o
Article history:Received 10 December 2013Received in revised form31 March 2014Accepted 4 April 2014Available online 4 May 2014
Keywords:AustralianeIndonesian summer monsoonHoloceneOrbital forcingSolar forcingGrand solar minimum
* Corresponding author.E-mail address: [email protected] (S. Steink
1 Now at the Department of Meteorology, StocStockholm, Sweden.
http://dx.doi.org/10.1016/j.quascirev.2014.04.0060277-3791/� 2014 Elsevier Ltd. All rights reserved.
a b s t r a c t
The AustralianeIndonesian monsoon has a governing influence on the agricultural practices and liveli-hood in the highly populated islands of Indonesia. However, little is known about the factors that haveinfluenced past monsoon activity in southern Indonesia. Here, we present aw6000 years high-resolutionrecord of Australian-Indonesian summer monsoon (AISM) rainfall variations based on bulk sedimentelement analysis in a sediment archive retrieved offshore northwest Sumba Island (Indonesia). The re-cord suggests lower riverine detrital supply and hence weaker AISM rainfall between 6000 yr BP andw3000 yr BP compared to the Late Holocene. We find a distinct shift in terrigenous sediment supply ataround 2800 yr BP indicating a reorganization of the AISM from a drier Mid Holocene to a wetter LateHolocene in southern Indonesia. The abrupt increase in rainfall at around 2800 yr BP coincides with agrand solar minimum. An increase in southern Indonesian rainfall in response to a solar minimum isconsistent with climate model simulations that provide a possible explanation of the underlyingmechanism responsible for the monsoonal shift. We conclude that variations in solar activity play asignificant role in monsoonal rainfall variability at multi-decadal and longer timescales. The combinedeffect of orbital and solar forcing explains important details in the temporal evolution of AISM rainfallduring the last 6000 years. By contrast, we find neither evidence for volcanic forcing of AISM variabilitynor for a control by long-term variations in the El Niño-Southern Oscillation (ENSO).
� 2014 Elsevier Ltd. All rights reserved.
1. Introduction
The Asian and Australasian monsoons affect roughly half theworld’s population, which largely depends on the monsoonalclimate for their food and livelihood (Webster et al., 1998;Christensen et al., 2007). Despite the importance to so many, themonsoon is difficult to predict and model, making its futuredevelopment in a changing global climate uncertain (Webster et al.,1998). Hence, it is vital to reconstruct monsoon variations beyondthe instrumental record in order to improve our understanding ofthe mechanisms that may act on monsoonal rainfall variability.Most proxy evidence on multi-decadal to multi-millennial scalechanges in monsoonal rainfall intensity during the Holocene hasbeen deduced from continental and marine archives located in the
e).kholm University, SE-10691
Indian and East Asian monsoon domains. These studies on the In-dian (Fleitmann et al., 2003; Gupta et al., 2005) and the East Asian(Wang et al., 2005; Zhang et al., 2008) summer monsoon rainfallindicate a strong response to orbital and solar forcing during theHolocene. In contrast to its Northern Hemisphere counterparts,very little is known about the development of the Australian-Indonesian summer monsoon (AISM) rainfall during the Holocene.
With respect to the AISM rainfall during the Holocene, Austra-lian proxy records suggest wetter conditions during the Early andMid Holocene compared to present (Nott and Price, 1994; Mageeet al., 2004) which has been explained by a Northern Hemisphereinsolation control (Magee et al., 2004; Miller et al., 2005), aresponse to regional sea-surface temperatures (Liu et al., 2003) orhuman-induced changes in vegetation cover during the Late Ho-locene (Miller et al., 2005). In contrast, two recent studies fromsouthern Indonesia indicate reduced rainfall during the Mid Ho-locene compared to the Late Holocene (Griffiths et al., 2009;Mohtadi et al., 2011), highlighting the complex and contrastingpatterns of AISM development in southern Indonesia and northern

S. Steinke et al. / Quaternary Science Reviews 93 (2014) 142e154 143
Australia. Another study relates the changes in AISM rainfall duringthe past two millennia to shifts in the mean position of the Inter-Tropical Convergence Zone (ITCZ) forced by variations in North-ern Hemisphere climate mean state (Tierney et al., 2010). A recentstudy from the Australian tropics suggests that El Niño-SouthernOscillation (ENSO) may have played a dominant role in drivingAISM variability since the middle Holocene (Denniston et al., 2013).Taken together, mechanisms that influence the AISM during theHolocene are far from being understood because of the limitednumber of AISM records and the strong disagreement on the natureand causes of rainfall changes in the existing AISM records.
Here, we present a w6000 years high-resolution record ofsouthern Indonesian rainfall based on bulk sediment elementanalysis in a sediment archive retrieved offshore northwest SumbaIsland (Indonesia). This new record allows us to study the history ofmonsoonal rainfall in southern Indonesia at multi-decadal tomulti-millennial time scales, and to explore the role of various potentialforcing mechanisms in driving AISM rainfall through the Holocene.
2. Modern climate
At present, south and central Indonesia from south Sumatra toTimor Island, parts of Kalimantan, Sulawesi, and Irian Jaya as well asthe northern portions of Australia experience a monsoonal climate,
Fig. 1. (a) Precipitation and 850-hPa wind climatologies (1981e2010) for the austral summeGlobal Prediction Climatology Project (GPCP) version 2.2 for precipitation (Adler et al., 2003Indonesian summer monsoon (AISM) variability discussed in the text are also indicated: (a(Mohtadi et al., 2011); (c) Lake Lading leaf wax dD record (Konecky et al., 2013); (d) Liangcord (Denniston et al., 2013). (f) Indicates the position of sediment trap JAM off south Java ((114.5e119.2�E; 9.15e8.15�S) and Sumba (118.5e120.5�E; 10.15e9.15�S) derived from the TPrecipitation Climatology Centre (GPCC; Deutscher Wetterdienst; http://dwd.de) precipitat
with themajority of the annual rainfall occurring in austral summer(DecembereMarch) when the northwest monsoon carries humidair and heavy rainfall as the ITCZ-related rainbelt migrates south-ward (Fig. 1a). During austral winter (JuneeSeptember), thesoutheast monsoonwinds are relatively cool and dry while the ITCZis located over mainland Asia. The annual rainfall in the study areais highest during the summer wet season (w6.5 mm/day;DecembereMarch) and negligible during the winter dry season(w0.3 mm/day; JuneeSeptember; Fig. 1b). On interannual time-scales, rainfall in southern Indonesia is highly sensitive to ENSO(e.g. Webster et al., 1998; Aldrian and Susanto, 2003) with El Niñoevents typically resulting in reduced rainfall and subsequentdrought while increased rainfall and severe floods are associatedwith La Niña events over much of central and southern Indonesia.
3. Strategy and proxy variables used for rainfallreconstruction
We use the logarithmic ratio between titanium (Ti) and calcium(Ca) as a proxy for riverine terrestrial input as in Mohtadi et al.(2011). The linkage between riverine detrital input and AISMrainfall has been demonstrated previously for the study area byRixen et al. (2006). The supply of terrigenous material as monitoredby the ratio between the lithogenic particles and calcium carbonate
r season (DecembereFebruary) in the AsianeAustralian monsoon region. Data sets are) and NCEP/NCAR reanalysis for wind (Kalnay et al., 1996). Other records of Australiane) Ti/Ca ratios in core GeoB10065-7 (this study), (b) Ti/Ca ratios in core GeoB10053-7Luar stalagmite d18O record (Griffiths et al., 2010); (e) Kimberley stalagmite d18O re-
Rixen et al. (2006)); (b) Monthly average rainfall between 1998 and 2010 for Sumbawaropical Rainfall Measuring Mission (TRMM; http://trmm.gsfc.nasa.gov) and the Globalion 0.25� dataset interpolatd via http://climexp.knmi.nl.

Table 1MUC-A GeoB10065-9 chronology.
Depthcm
Corrected depthcm
ActivityBq∙kg�1
Uncert.Bq∙kg�1
CF-CS model CRS model
Calendar yr (AD) Sed. ratecm∙yr�1
Calendar yr(AD)
Sed. ratecm∙yr�1
3.5e11.5a 5.5e13.5a
12.5 14.5 1094 92 2009 � 7 0.27 � 0.02 2004 � 6 0.27 � 0.0313.5 15.5 859 73 2005 � 7 0.27 � 0.02 2000 � 6 0.31 � 0.0314.5 16.5 841 72 2001 � 6 0.27 � 0.02 1996 � 6 0.28 � 0.0315.5 17.5 719 63 1997 � 6 0.27 � 0.02 1992 � 6 0.30 � 0.0316.5 18.5 535 50 1994 � 6 0.27 � 0.02 1989 � 6 0.36 � 0.0417.5 19.5 546 51 1990 � 6 0.27 � 0.02 1986 � 6 0.32 � 0.0418.5 20.5 572 52 1986 � 6 0.27 � 0.02 1983 � 6 0.27 � 0.0419.5 21.5 540 49 1982 � 6 0.27 � 0.02 1979 � 6 0.26 � 0.0420.5 22.5 539 53 1978 � 5 0.27 � 0.02 1975 � 6 0.23 � 0.0421.5 23.5 401 38 1974 � 5 0.27 � 0.02 1970 � 7 0.26 � 0.0422.5 24.5 342 35 1970 � 5 0.27 � 0.02 1966 � 7 0.27 � 0.0523.5 25.5 226 30 1966 � 5 0.27 � 0.02 1962 � 8 0.36 � 0.0824.5 26.5 201 24 1962 � 5 0.27 � 0.02 1959 � 8 0.37 � 0.0825.5. 27.5 182 21 1958 � 5 0.27 � 0.02 1956 � 8 0.38 � 0.0826.5 28.5 200 23 1954 � 5 0.27 � 0.02 1953 � 9 0.31 � 0.0827.5 29.5 202 29 1950 � 5 0.27 � 0.02 1950 � 10 0.28 � 0.0828.5 30.5 162 20 1946 � 5 0.27 � 0.02 1946 � 10 0.31 � 0.0929.5 31.5 199 25 1942 � 5 0.27 � 0.02 1943 � 11 0.23 � 0.08
Extrapolation to GC 10065-7:1 1984 � 6 0.27 � 0.0215 1928 � 5 0.27 � 0.0236 1845 � 9 0.27 � 0.02
a The 210Pbxs data of MUC-A and MUC-B reveal the existence of a 10-cm thick sequence of repeated young sediment above 14 cm corrected depth. This can likely beattributed to small-scale deformation and/or sliding processes due to seismic activity that can often occur in an earthquake prone region like Indonesia.
S. Steinke et al. / Quaternary Science Reviews 93 (2014) 142e154144
in a sediment trap off South Java (JAM; see Fig. 1a for location)shows pronounced seasonal variations with higher terrestrialsupply during the austral summer monsoon season (Rixen et al.,2006). Furthermore, river discharge, for example in eastern Javais highest during the summer monsoon season and only minorduring the winter season (Jennerjahn et al., 2004). The distinctseasonality of precipitation, river discharge, and lithogenic fluxes inthe water column suggests that the terrigenous fraction of thesediments off South Java is coupled to onshore precipitation duringthe austral summer monsoon season. By analogy, we assume thesame monsoonal variations in precipitation and terrestrial supplyin our study area in the eastern Lombok Basin northwest off SumbaIsland. Thus, downcore variations in the logarithmic ratio betweenTi and Ca are interpreted as a measure of past changes in summermonsoon rainfall. The use of the Ti/Ca ratio as a measure forriverine terrestrial input is further justified by the fact that varia-tions in the Ti/Ca ratio determined by X-ray fluorescence and in thelithogenic/CaCO3 ratio from the bulk sediment analysis in coreGeoB10053-7 off South Java show a strong correlation over the last22,000 years (Mohtadi et al., 2011).
4. Material and methods
4.1. Core GeoB10065-7
Sediment core GeoB10065-7 (9�13.390S; 118�53.580E; 1296 mwater depth; core length 9.75 m) was recovered from the easternLombok Basin e northwest off Sumba Island and southeast offSumbawa Island (Indonesia), during the RV SONNE SO-184“PABESIA” expedition in 2005 (Fig. 1a). Sedimentological descrip-tion of the core revealed dark olive grey to olive grey nannofossil/diatom-bearing clay (Hebbeln et al., 2006). A turbidite layer hasbeen identified between 37 and 40 cm depth in the core. Agecontrol for gravity core GeoB10065-7 is based on excess 210Pb, ananthropogenic fallout radionuclide 241Am and Accelerator Mass
Spectrometry (AMS) radiocarbon dates. Two parallel multi-coresGeoB10065-9 (9�13.410S; 118�53.550E; 1284 m water depth, corelength 0.6 m) were also 210Pb dated in order to better constrain theage chronology of the upper 15 cm of gravity core GeoB10065-7which is also based on 210Pb dating (see below).
4.2. 210Pb dating
210Pb dating was used to establish the age model for the top15 cm for gravity core GeoB10065-7 (Table 1). The freeze-driedsediment samples were analyzed by low-level gamma spectros-copy (analyzed at the Bremen State Radioactivity MeasurementsLaboratory, Institute of Environmental Physics, University of Bre-men). A coaxial HPGe detector Canberra Industries (50% relativeefficiency) housed in a 10 cm Pb shielding with Cu, Cd and plasticlining operated under Genie 2000 software was used. The effi-ciencies have been calculated using LabSOCS� (LaboratorySOurceless Calibration System), Genie 2000 software calibrationtool. For determination of excess-210Pb activity (210Pbxs), 210Pb(supported) activity was subtracted from the 210Pb (total) signal.Supported 210Pb was derived from the concentration of 226Rameasured via its daughter products 214Pb and 214Bi. Additionally,the artificial isotopes 137Cs and 241Am were analyzed. All data arerelated to sample dry mass.
4.3. Radiocarbon dating
Due to the lack of sufficient specimens for mono-specific plank-tonic foraminifera samples, Accelerator Mass Spectrometry (AMS)14C-datings were performed onmixed samples (9e20mg) of mixedlayer and thermoclinedwellingplanktonic foraminifera (analyzedattheNational Ocean Sciences AcceleratorMass Spectrometry Facility,Woods Hole, USA and the Keck Carbon Cycle Accelerator MassSpectrometry Laboratory, University of California, Irvine, USA;Table 2). Radiocarbon dateswere converted to 2s calendar ageswith

Table 2AMS-14C ages and cal. ages of core GeoB10065-7.
Lab. code Sample depth(cm)
Foraminifera species 14C age(yr BP)
Cal. age BP 2s cal. age rangec
(Relative area underprobability distribution)
NOSAMS-OS-64679a 8 Mixed planktonic foraminifera 415 � 30 d d
NOSAMS-OS-81188a 27 Mixed planktonic foraminifera 690 � 25 90 0e153 (0.817)157e228 (0.183)
UCIAMS-89139b 36 G. ruber þ G. sacculifer 630 � 20 120e 0e30 (0.078)40e236 (0.887)
UCIAMS-84721b 41 Mixed planktonic foraminifera 755 � 20 170 0e24 (0.043)48e270 (0.957)
NOSAMS-OS-73005a 53 Mixed planktonic foraminifera 970 � 75 390 238e531 (1.0)NOSAMS-OS-81189a 77 Mixed planktonic foraminifera 890 � 30 320 152e158 (0.004)
227e453 (0.996)NOSAMS-OS-64680a 103 Mixed planktonic foraminifera 935 � 30 360 271e460 (1.0)NOSAMS-OS-81229a 127 Mixed planktonic foraminifera 1050 � 25 460 335e345 (0.012)
355e532 (0.988)NOSAMS-OS-72100a 158 Mixed planktonic foraminifera 1340 � 30 680 565e580 (0.015)
590e776 (0.985)NOSAMS-OS-81230a 182 Mixed planktonic foraminifera 1410 � 25 730 651e854 (1.0)NOSAMS-OS-64681a 213 Mixed planktonic foraminifera 1530 � 35 850 727e957 (1.0)NOSAMS-OS-81232a 232 Mixed planktonic foraminifera 1650 � 25 980 885e1109 (1.0)NOSAMS-OS-72101a 263 Mixed planktonic foraminifera 1800 � 30 1140 1020e1257 (1.0)NOSAMS-OS-81231a 284 Mixed planktonic foraminifera 1900 � 25 1240 1136e1331 (1.0)NOSAMS-OS-64750a 308 Mixed planktonic foraminifera 1960 � 35 1290 1179e1394 (1.0)NOSAMS-OS-81233a 334 Mixed planktonic foraminifera 2140 � 30 1470 1343e1598 (1.0)NOSAMS-OS-72102a 358 Mixed planktonic foraminifera 2280 � 30 1630 1515e1773 (1.0)NOSAMS-OS-81234a 377 Mixed planktonic foraminifera 2400 � 30 1770 1627e1895 (1.0)NOSAMS-OS-64751a 403 Mixed planktonic foraminifera 2460 � 35 1840 1705e1976 (1.0)NOSAMS-OS-81235a 429 Mixed planktonic foraminifera 2550 � 30 1950 1824e2089 (1.0)NOSAMS-OS-72103a 453 Mixed planktonic foraminifera 2800 � 40 2250 2098e2387 (1.0)NOSAMS-OS-81327a 479 Mixed planktonic foraminifera 2840 � 35 2300 2143e2449 (1.0)NOSAMS-OS-64752a 503 Mixed planktonic foraminifera 2760 � 30 2210 2081e2328 (1.0)NOSAMS-OS-81328a 527 Mixed planktonic foraminifera 3020 � 25 2550 2380e2694 (1.0)NOSAMS-OS-64767a 553 Mixed planktonic foraminifera 3030 � 25 2560 2395e2703 (1.0)NOSAMS-OS-81329a 579 Mixed planktonic foraminifera 3280 � 25 2830 2734e2947 (1.0)NOSAMS-OS-64768a 608 Mixed planktonic foraminifera 3350 � 25 2910 2777e3048 (1.0)NOSAMS-OS-81330a 635 Mixed planktonic foraminifera 3430 � 25 3020 2870e3157 (1.0)NOSAMS-OS-72104a 658 Mixed planktonic foraminifera 3600 � 25 3250 3109e3366 (1.0)NOSAMS-OS-81331a 679 Mixed planktonic foraminifera 3820 � 30 3500 3370e3621 (1.0)NOSAMS-OS-64769a 698 Mixed planktonic foraminifera 3750 � 25 3420 3313e3550 (1.0)NOSAMS-OS-81332a 722 Mixed planktonic foraminifera 3970 � 30 3680 3551e3826 (1.0)NOSAMS-OS-72105a 748 Mixed planktonic foraminifera 4150 � 35 3920 3759e4079 (1.0)NOSAMS-OS-81333a 772 Mixed planktonic foraminifera 4280 � 30 4090 3926e4246 (1.0)NOSAMS-OS-64770a 798 Mixed planktonic foraminifera 4340 � 30 4180 4010e4024 (0.001)
4026e4350 (0.989)NOSAMS-OS-81334a 819 Mixed planktonic foraminifera 4610 � 30 4540 4401e4718 (0.992)
4755e4763 (0.008)NOSAMS-OS-72106a 838 Mixed planktonic foraminifera 4810 � 35 4810 4633e4949 (1.0)NOSAMS-OS-81335a 859 Mixed planktonic foraminifera 4900 � 30 4910 4801e5045 (1.0)NOSAMS-OS-64771a 878 Mixed planktonic foraminifera 5020 � 30 5090 4913e5261 (1.0)NOSAMS-OS-81336a 899 Mixed planktonic foraminifera 5190 � 30 5320 5135e5155 (0.010)
5189e5462 (0.990)NOSAMS-OS-72107a 918 Mixed planktonic foraminifera 5450 � 35 5590 5468e5705 (1.0)NOSAMS-OS-64772a 968 Mixed planktonic foraminifera 5770 � 30 5940 5795e5796 (0.001)
5808e5812 (0.002)5818e6105 (0.097)
a Measured at the National Ocean Sciences Accelerator Mass Spectrometry Facility, Woods Hole, United States of America.b Measured at the Keck Carbon Cycle Accelerator Mass Spectrometry Facility, Earth System Science Department, University of California, Irvine, United States of America.c 2s enclosing 95.4% of probability distribution.d Invalid age for the marine13.14c calibration curve.e A regional reservoir correction (DR) of þ130 � 35 years have been applied (Southon et al., 2013).
S. Steinke et al. / Quaternary Science Reviews 93 (2014) 142e154 145
the CALIB 7.0 software using the MARINE13 calibration dataset(Reimer et al., 2013) with a reservoir correction of 405 years plus anadditional 220 � 40 years (DR) to account for older radiocarbonintroduced into the surface water by upwelling and for differencesbetween surface and thermocline dwelling foraminiferawhenusingmixed planktonic foraminifera (Southon et al., 2013). The radio-carbon age at 36 cm only consisting of mixed layer dwelling plank-tonic foraminfera G. ruber and G. sacculifer was converted to 2s
calendaragesbyusing theMARINE13calibrationdataset andameanglobal reservoir correction of 405 years plus an additional 130 � 35years (DR; Southon et al., 2013).
A continuous depth-age model was built with a Bayesianapproach using the Bacon software (Blaauw and Christen, 2011).This method divides a core into sections and models the accumu-lation rate for each of these sections. In the following text, all agesrefer to calibrated (cal.) years BP.

S. Steinke et al. / Quaternary Science Reviews 93 (2014) 142e154146
4.4. Bulk sediment element analysis
We determined the bulk sedimentary element composition ofcore GeoB10065-7 by X-Ray Fluorescence (XRF). XRF Core Scannerdatawere collected every 2 cm down-core using a generator settingof 20 kV, 0.087 mA and a sampling time of 20 s directly at the splitcore surface of the archive half with XRF Core Scanner I at MARUM,University of Bremen. The split core surface was covered with apolypropylene foil to avoid contamination of the XRFmeasurementunit and desiccation of the sediment. The here reported data havebeen acquired by XRF Core Scanner I at MARUM using a KEVEX PsiPeltier Cooled Silicon Detector and a KEVEX X-ray Tube 52500008-02 with the target material molybdenum (Mo).
5. Results
5.1. Age control
The three individual depth profiles of radionuclides of the twomulti-cores at station GeoB10065-9 (henceforth MUC-A, and MUC-B) and the gravity core at station GeoB10065-7 were depth alignedbased on minimizing the sum of squared residuals (Fig. 2;Pittauerova et al., 2009). It was estimated that MUC-A is shifted by2 cm downwards relative to MUC-B and that there is 20 cmmissingon top of gravity core GeoB10065-7 relative to MUC-B. 137Cs valueswere mostly below the decision threshold and the activity con-centrations could only be analyzed from summed up spectra ofseveral sampling intervals. However, unusually high activities ofnuclear bomb tests derived isotope 241Am were present and thefirst appearance of 241Am in depth profiles was used as an addi-tional chronomarker (AD 1950 � 5 years) in model calculationsinstead of 137Cs.
The 210Pbxs profile between 14 and 32 cm of MUC-A showing anexponential decrease was used for chronology. The Constant Flux-Constant Sedimentation (CF-CS) model (Appleby and Oldfield,1978) was applied to the investigated profile section with anadditional time marker at 29.5 cm based on the first appearance of241Am. The Constant Rate of Supply (CRS) model (Appleby andOldfield, 1978), assuming steady flux of 210Pbxs and allowing vari-able sedimentation rates, was applied to the same dataset forcomparison. The mean sedimentation rate obtained with the CF-CSmodel is 0.27 � 0.02 cm/yr. Sedimentation rates obtained with theCRS model range between 0.23 cm/yr and 0.38 cm/yr with themean value of 0.28 cm/yr.
The calendar ages calculated from both models show verysimilar results. The age of the bottom of MUC-A (31.5 cm) wasestimated as AD 1942 � 5 (CF-CS model). Application of bothmodels shows that very recent sediments are likely to be present at14 cm depth. Within uncertainties of both age models, the calcu-lated ages correspond to AD 2009 � 7 and AD 2004 � 6 calendaryears, which are close to the day of core recovery (05.09.2005). The210Pbxs data of MUC-A and MUC-B reveal the existence of another10-cm thick sequence of repeated young sediment above 14 cm.This can likely be attributed to small-scale deformation and/orsliding processes due to seismic activity that can often occur in anearthquake prone region like Indonesia. The monotonous decreasein 210Pb activity of the upper 10 cm would imply a gentle processwithout mixing of the deformed or re-deposited sediment layer.
The age of the upper 15 cm of GC GeoB10065-7 was calculatedusing the MUC-A CF-CS model derived sedimentation rate (seeabove). The gravity core 210Pb chronology of the upper 15 cm ex-tends from AD 1984� 6 to AD 1928� 5 (Table 1). In order to extendthe chronology to deeper parts of sediment profile and estimate theage above a turbidite layer, which occurs in 37e40 cm core depth,the CF-CS model was extrapolated to the depth of 36 cm (above the
turbidite layer). This layer would represent year AD 1845 � 9. Theextrapolated ages of the CF-CS model of AD 1881 � 7 at 27 cm andAD 1845 � 9 at 36 cm are in good agreement with those obtainedfrom radiocarbon dating of 90 cal yr BP or AD 1859 (2s age range ofAD 1797 and 1950) and of 120 cal yr BP or AD 1828 (2s age range ofAD 1714 and 1910), respectively.
Age control on gravity core GeoB10065-7 below the turbiditelayer (37e40 cm depth in core) was established based on 39 AMSradiocarbon measurements (Fig. 3; Table 2). Based on our agemodel, core GeoB10065-7 covers the last w6000 years. The age-depth model using the Bayesian approach (Blaauw and Christen,2011) gives extremely high linear sedimentation rates between0.11�0.05 cm/yr and 0.35� 0.05 cm/yr which are comparablewiththose obtained from the 210Pb age models (CF-CS model,0.27 � 0.02 cm/yr; CRS model, 0.23e0.38 cm/yr; see above).
5.2. Results of bulk sediment element analysis
Fig. 4 shows the titanium (Ti), iron (Fe) and calcium (Ca) XRFintensity data of core GeoB10065-7. The intensities of the Ti arelower between w6000 yr BP and 3000 yr BP and generally higherafter w3000 BP with a period of lower Ti intensities betweenw2000 yr BP and 1000 yr BP (Fig. 4a). The intensities of theterrestrial endmember Fe show the same trend as the Ti intensities(Fig. 4b). The intensities of Fe are also presented in order todemonstrate the coherent changes in the terrestrial endmemberelements at our site over the past 6000 years. Increased intensitiesof Ti and Fe after w3000 yr BP are interpreted as increased supplyof siliciclastic material of fluvial origin. The Ca intensities reveal aninverse relationship to the Ti and Fe intensities with higher in-tensities between w6000 yr BP and 3000 yr BP and lower in-tensities after w3000 yr BP (Fig. 4c). The ln-ratio of Ti/Ca showslower values between w6000 yr BP and 3000 yr BP compared tothe last 3000 years, indicating lower riverine detrital supply andhence weaker AISM rainfall during the Mid Holocene compared tothe Late Holocene (Fig. 4d). A conspicuous shift towards higherterrestrial sediment supply and thus AISM rainfall occurred ataround 2800 yr BP that is followed by a period of increased AISMrainfall between w1700 yr BP and w2800 yr BP. The ln-ratio of Ti/Ca exhibit less riverine detrital supply from w1700 yr BP tow1200 yr BP (Fig. 4d). Thereafter, the ln-ratio of Ti/Ca exhibits asteady increase in terrestrial supply and hence AISM rainfall to thepresent after w1200 yr BP (Fig. 4d).
6. Discussion
Our AISM record bears similarities with Holocene changes inrainfall as inferred from a ln-ratio of Ti/Ca of a core located south offJava (Mohtadi et al., 2011) and a cave stalagmite stable oxygenisotope record from Flores, Indonesia (Griffiths et al., 2009, 2010),which also show a change from a drier Mid Holocene to a wetterLate Holocene (Fig. 5ced). The southern Indonesian proxy recordsfor changes in AISM rainfall show a similar overall increase in AISMrainfall until w1200 yr BP, while the development of the AISMrainfall as inferred from these records is inconsistent thereafter(Fig. 5aed). Our Ti/Ca record suggests a steady increase in AISMrainfall after w1200 yr BP, while the Flores and the record offsouthern Java suggest drier conditions (Fig. 5ced). The steady in-crease in rainfall after w1200 yr BP as inferred from our Ti/Ca re-cord is consistent with rainfall reconstructions based on dD ofterrestrial plant waxes from Lake Lading (East Java; Konecky et al.,2013, Fig. 5b). We suggest that the overall long-term trend of ourrecord with an increasing AISM rainfall over the Mid-to-Late Ho-locene resembles high-resolution Southern Hemisphere low lati-tude monsoon proxy records, e.g. from South America (van
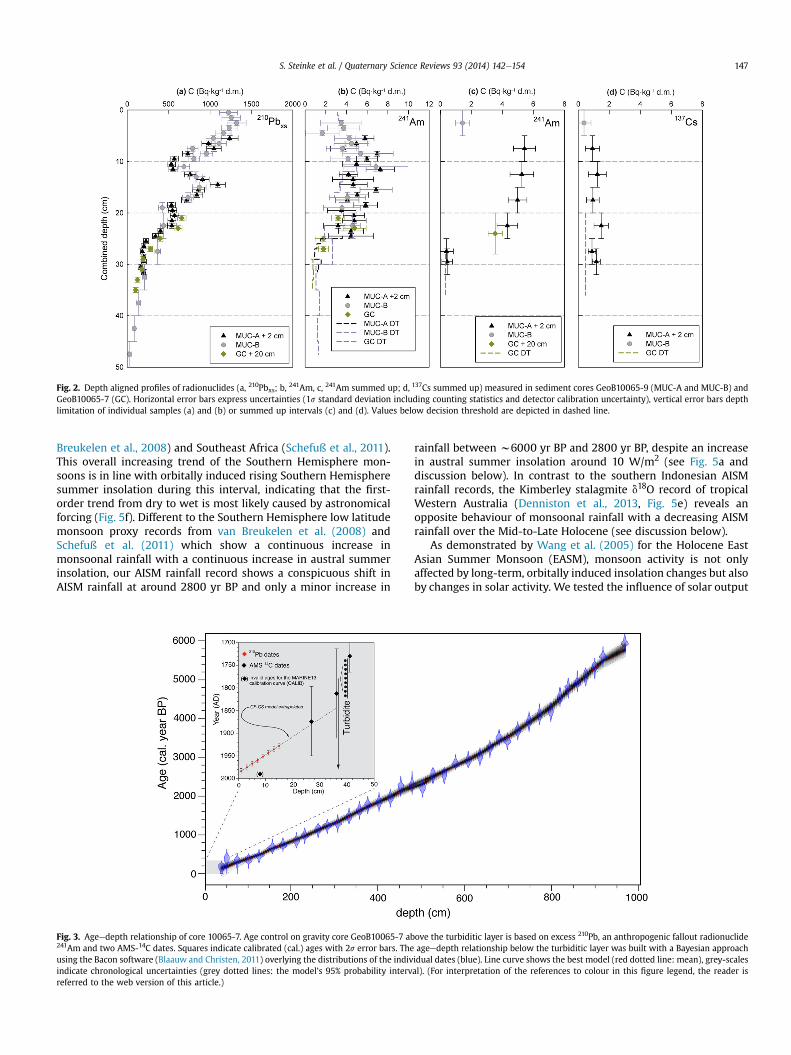
Fig. 2. Depth aligned profiles of radionuclides (a, 210Pbxs; b, 241Am, c, 241Am summed up; d, 137Cs summed up) measured in sediment cores GeoB10065-9 (MUC-A and MUC-B) andGeoB10065-7 (GC). Horizontal error bars express uncertainties (1s standard deviation including counting statistics and detector calibration uncertainty), vertical error bars depthlimitation of individual samples (a) and (b) or summed up intervals (c) and (d). Values below decision threshold are depicted in dashed line.
S. Steinke et al. / Quaternary Science Reviews 93 (2014) 142e154 147
Breukelen et al., 2008) and Southeast Africa (Schefuß et al., 2011).This overall increasing trend of the Southern Hemisphere mon-soons is in line with orbitally induced rising Southern Hemispheresummer insolation during this interval, indicating that the first-order trend from dry to wet is most likely caused by astronomicalforcing (Fig. 5f). Different to the Southern Hemisphere low latitudemonsoon proxy records from van Breukelen et al. (2008) andSchefuß et al. (2011) which show a continuous increase inmonsoonal rainfall with a continuous increase in austral summerinsolation, our AISM rainfall record shows a conspicuous shift inAISM rainfall at around 2800 yr BP and only a minor increase in
Fig. 3. Ageedepth relationship of core 10065-7. Age control on gravity core GeoB10065-7 ab241Am and two AMS-14C dates. Squares indicate calibrated (cal.) ages with 2s error bars. Theusing the Bacon software (Blaauw and Christen, 2011) overlying the distributions of the indivindicate chronological uncertainties (grey dotted lines: the model’s 95% probability intervreferred to the web version of this article.)
rainfall between w6000 yr BP and 2800 yr BP, despite an increasein austral summer insolation around 10 W/m2 (see Fig. 5a anddiscussion below). In contrast to the southern Indonesian AISMrainfall records, the Kimberley stalagmite d18O record of tropicalWestern Australia (Denniston et al., 2013, Fig. 5e) reveals anopposite behaviour of monsoonal rainfall with a decreasing AISMrainfall over the Mid-to-Late Holocene (see discussion below).
As demonstrated by Wang et al. (2005) for the Holocene EastAsian Summer Monsoon (EASM), monsoon activity is not onlyaffected by long-term, orbitally induced insolation changes but alsoby changes in solar activity. We tested the influence of solar output
ove the turbiditic layer is based on excess 210Pb, an anthropogenic fallout radionuclideageedepth relationship below the turbiditic layer was built with a Bayesian approachidual dates (blue). Line curve shows the best model (red dotted line: mean), grey-scalesal). (For interpretation of the references to colour in this figure legend, the reader is

Fig. 4. (a) Titanium (Ti), (b) iron (Fe) and, (c) calcium (Ca) intensity XRF logs in counts per second (cps) of core GeoB10065-7. (d) ln-ratio of Ti/Ca of core GeoB10065-7.
S. Steinke et al. / Quaternary Science Reviews 93 (2014) 142e154148
variations on the AISM in an attempt to assess solar activity beingimportant in controlling AISM variability during the Holocene. Forthat reason, we compared our Ti/Ca record to the sunspot numberrecord of Solanki et al. (2004), a proxy for solar activity (Fig. 6b).Visually, changes in our Ti/Ca record resemble the long-term trendin solar activity with periods of weaker AISM rainfall broadly cor-responding to higher solar activity (6000e3000 yr BP), while astrengthened AISM is associated with an overall long-termdecrease in solar activity (after 2800 yr BP; Fig. 6aeb). In addi-tion, we find a link between changes in AISM rainfall and solaractivity with certain solar minima corresponding to stronger
southern Indonesian rainfall, in particular at around 2800 years BP(see Fig. 6aeb). The correlation between the unsmoothed Ti/Ca andsolar activity records is relatively low (r ¼ �0.319) but statisticallysignificant for the past 6000 years (p < 0.05) when taking serialcorrelation into account (Mudelsee, 2003). The statistical signifi-cance of the correlation indicates that some of the variability in theAISM rainfall can be attributed to changes in solar activity (Fig. 6c).Our results suggest that solar forcing plays a role in driving AISMrainfall variability during the past 6000 years, even though thevariance in our Ti/Ca record that can be explained by changes in thesolar output is small.

Fig. 5. Proxy records for monsoonal rainfall changes in southern Indonesia and northern Australia. (a) ln-ratio of Ti/Ca in core GeoB10065-7; (b) Lake Lading (East Java) leaf wax dDrecord (Konecky et al., 2013); (c) ln-ratio of Ti/Ca in core GeoB10053-7 off southern Java (Mohtadi et al., 2011); (d) Liang Luar (Flores) d18O record (Griffiths et al., 2010); (e) EasternKimberley d18O record, tropical Western Australia (Denniston et al., 2013) and (f) Southern Hemisphere (austral) summer insolation (20�S; DJF; Laskar et al., 2004). Site locations aregiven in Fig. 1.
S. Steinke et al. / Quaternary Science Reviews 93 (2014) 142e154 149
The most conspicuous shift in terrigenous sediment supply andthus AISM rainfall occurred at around 2800 yr BP, coinciding withone of the strongest grand solar minima of the Holocene (see alsoabove; Solanki et al., 2004; Usoskin et al., 2007). As lower solar
radiative forcing is usually associated with less surface oceanevaporation and, consequently, reduced monsoonal rainfall intropical regions (Meehl et al., 2003), our finding of enhancedrainfall over southern Indonesia during times of reduced solar

Fig. 6. Changes in AISM rainfall and solar activity. (a) Ti/Ca ratios in core GeoB10065-7; (b) 10-year averaged reconstructed sunspot number (Solanki et al., 2004); (c) 10-yearaveraged ln-ratios of Ti/Ca (black) and sunspot numbers (red). 95% confidence intervals (in brackets) for the Pearson correlation coefficient (r) were calculated using a non-parametric bootstrap method, where autocorrelation has been taken into account (Mudelsee, 2003). 21-point running means shown in bold (aeb) to illustrate the long-termtrends in ln-ratios of Ti/Ca and sunspot numbers. (For interpretation of the references to colour in this figure legend, the reader is referred to the web version of this article.)
S. Steinke et al. / Quaternary Science Reviews 93 (2014) 142e154150
activity, in particular the 2800 yr BP grand solar minimum, seemscounterintuitive. Moreover, according to the theoretical mecha-nism of a Pacific Ocean “dynamical thermostat” (Clement et al.,1996; Mann et al., 2005; Marchitto et al., 2010), solar minimashould favour El Niño-like conditions and hence drier climate overIndonesia. To find a possible mechanism that could reconcilereduced solar activity with enhanced southern Indonesian summerrainfall, we analyzed the output from an idealized solar sensitivityexperiment (Varma et al., 2011) using the coupled climate modelCCSM3 (Collins et al., 2006). In this experiment, solar forcing issimply implemented through a change in total solar irradiance (TSI)with no wavelength-dependence and mostly affects the climatesystem through shortwave absorption by the surface. The TSI has
been reduced by 2 Wm�2 (corresponding to 0.15%) for a period of70 years to capture the multi-decadal timescale of typical solargrand minima (Usoskin et al., 2007). In order to enhance statisticalsignificance of the model results, the TSI sensitivity experimentconsists of three ensemble members. The resolution of the atmo-spheric model component is given by T31 (3.75� transform grid)with 26 layers in the vertical (Yeager et al., 2006) and preindustrialboundary conditions were applied (Otto-Bliesner et al., 2006). For adetailed description of the experimental design, the reader isreferred to Varma et al. (2011).
In themodel experiment, reduced solar forcing causes an overallsurface cooling, which is usually less pronounced over the oceanthan over land due to greater thermal inertia and the regulating

Fig. 7. Climatic response to a multi-decadal (70 years) reduction in total solar irradiance by 2 Wm�2 in a coupled climate model (CCSM3). Shown are austral summer (DecembereFebruary) anomalies (low minus high solar irradiance) in the model ensemble mean averaged over the entire 70-year interval of the solar forcing experiment for (a) 850 hPageopotential height and 850 hPa wind, (b) surface temperature, (c) vertical velocity at 500 hPa, and (d) precipitation. Stippling in b-d indicates significance of the anomaly at the0.05 level.
S. Steinke et al. / Quaternary Science Reviews 93 (2014) 142e154 151
effect of evaporative heat fluxes on sea surface temperature (Meehlet al., 2003). The resulting reduction in sensible heating of air overland and in the land-sea thermal contrast in combination with adecrease in surface ocean evaporation lowers the monsoonalmoisture influx to northern Australia and precipitation there. Theresulting decrease in latent heat release from precipitation furtherleads to a substantial weakening of the Australian monsoon troughand slowing of the associated winds (Fig. 7a) and upward motion ofair (Webster et al., 1998; Meehl et al., 2003, Fig. 7c). Consequently,even less moisture is advected towards northern Australia creatinga positive feedback (Levermann et al., 2009). Reduced evapo-transpiration from the drier land surface and less cloudiness (notshown) eventually cause a net surface warming over northernAustralia (Fig. 7b). In the northern part of the large-scale australsummer Asian-Australian monsoon system, strong cooling overcloud-free India is associated with enhanced subsidence (Fig. 7c),accelerating the curved low-level circulation from India towardsIndonesia via the western Indian Ocean (Fig. 7a). Between theAustralian and Indian anomalies of downward vertical motion(Fig. 7c), anomalous low-level wind convergence (Fig. 7a) andascent (Fig. 7c) takes place, leading to higher rainfall over southernIndonesia and the south-equatorial eastern Indian Ocean inresponse to a solar minimum (Fig. 7d). The associated release oflatent heat acts as a positive feedback on the wind circulationanomaly (Gill, 1980). The simulated fractional change in precipita-tion over this area is roughly 5e10%, which is of the same order ofmagnitude as the projected austral summer rainfall increase acrosssouthern Indonesia until the end of the 21st century as derivedfrom a multi-model average forced by rising greenhouse gas con-centrations (Christensen et al., 2007). This quantitative comparison,
however, must be takenwith care and can only provide a very crudeestimate of the solar impact. First, the true magnitude of past TSIvariations may differ from the TSI reduction applied in the CCSM3sensitivity experiment. Even though a TSI reduction of 2 Wm�2 isconsistent with physics-based estimates of the extremest solarvariations during the Late Holocene according to Steinhilber et al.(2009), it can be considered a relatively strong forcing which hasbeen chosen to enhance the detectability of the climatic response inthe model. We acknowledge that there are substantial un-certainties in the estimates of the magnitude of past TSI variability(Lockwood, 2011; Judge et al., 2012). Secondly, the CCSM3 simu-lations do not include potential amplifying mechanisms of solarforcing associated with charged particle effects or changes instratospheric ozone due to solar ultraviolet variability (cf. Grayet al., 2010). In summary, while lacking “topedown processes”(e.g. Meehl et al., 2009), the idealized CCSM3 solar sensitivityexperiment provides a physically-consistent mechanism whichmay explain the counterintuitive proxy-derived result of enhancedAISM rainfall in southern Indonesia in response to reduced solaroutput. The model highlights the importance of feedbacks associ-ated with moisture fluxes and latent heat release in the monsoonalsystem. In particular, the suggested mechanism of solar-forcedvariations in AISM rainfall is independent from ENSO conditionsin the equatorial Pacific (cf. Marchitto et al., 2010; see discussionbelow).
There are two remarkable features associated with the sug-gested mechanism of solar-forced variations on AISM rainfall. First,the 2800 yr BP solar minimum is associated with an outstandingshift in our AISM rainfall record, whereas other grand solar mimimaare less pronounced in the Ti/Ca record, e.g. the minimum around

Fig. 8. Proxy records for rainfall variability in southern Indonesia and the eastern equatorial Pacific (EEP): (a) ln-ratios of Ti/Ca in core GeoB10065-7 (this study), (b) red colorintensity (proxy for terrestrial runoff) in Laguna Pallcacocha in Ecuador and El Niño events per 100 yr in red (Moy et al., 2002), and (c) percent sand in El Junco Lake in the GalapagosIslands indicative of ENSO frequency (Conroy et al., 2008). (For interpretation of the references to colour in this figure legend, the reader is referred to the web version of this article.)
S. Steinke et al. / Quaternary Science Reviews 93 (2014) 142e154152
5200 yr BP (Fig. 6c). Second, our AISM record indicates that thestrengthening of the southern Indonesian rainfall during the2800 yr BP grand solar minimum represents a distinct shift towardsoverall wetter conditions thereafter (Fig. 5a).
Why the 2800 years BP event stands out so drastically in ourmonsoon record as well as in other records (see below), cancurrently not be answered conclusively. We suggest that in contrastto other solar minima, the 2800 yr BP minimum lasted longer thanmost other solar minima. This might have resulted in a strongereffect on the climate system, and also facilitates the detection inproxy records. Either way, there is clear evidence that the 2800 yrBP solar minimum affected climate conditions over much of theplanet, including shifts of the Southern Westerlies (van Geel et al.,2000), the establishment of modern wind regimes in northernAfrica (Kröpelin et al., 2008), and shifts in atmospheric circulationover Europe (Martin-Puertas et al., 2012). Moreover, the DonggeCave EASM record displays a decrease in rainfall around 2800 yearsBP but no change during other big events in solar output between4000 years BP and 6000 years BP (Wang et al., 2005).
In order to explain the generally higher rainfall levels after the2800yr BP event we suggest that the combined effect of orbital andsolar forcing is responsible for the long-term temporal behaviour of
AISM rainfall over southern Indonesia as well as northern Australia.Despite an increase in austral summer insolation around 10 W/m2
between 6000 yr BP and 3000 yr BP, only a minor increase in AISMrainfall occurred betweenw6000 yr BP and 2800 yr BP. We suggestthat a long-term upward trend in solar output between 6000 yr BPand w4000 yr BP (Fig. 6b) counteracts increasing orbital forcingsuch that the long-term trend in the Ti/Ca record is minor (Fig. 6a).After the 2800 yr BP event, enhanced orbital forcing keeps rainfallat a generally higher level than during the drier Mid Holocene. Afterw1200 yr BP decreasing solar activity causes rainfall to increasefurther for about 1000 years (Fig. 5a). The steady increase in rainfallafter w1200 yr BP is consistent with rainfall reconstructions basedon dD of terrestrial plant waxes from Lake Lading (East Java;Konecky et al., 2013, Fig. 5b).
As over the entire period solar activity explains only a small butstatistically significant fraction of the monsoonal rainfall varia-tions, internal climate variability and/or volcanic forcing involvingclimatic teleconnections may probably explain another portion ofthe high frequency variations over the entire Ti/Ca record. How-ever, there is no evidence of any substantial volcanic forcingduring the 2800 yr BP event (Zielinski et al., 1997). In modernclimatology, rainfall in Indonesia is highly sensitive to ENSO

S. Steinke et al. / Quaternary Science Reviews 93 (2014) 142e154 153
variability with El Niño events typically resulting in reducedrainfall and subsequent drought (Aldrian and Susanto, 2003). Toassess whether changes in the background state of the tropicalPacific, so-called “El Niñoelike” or “La Niñaelike” conditions, havecontributed to the Holocene AISM rainfall variability, we compareour ln-ratio Ti/Ca record with lake sedimentary records fromLaguna Pallchachoca in Ecuador (Moy et al., 2002) and the El JuncoCrater Lake in the Galapagos Islands (Conroy et al., 2008) whichrepresent local rainfall intensity and, hence, are indicative of pastEl Niño events (Fig. 8). It is expected that more frequent and/orintense El Niño events have resulted in reduced rainfall and sub-sequent drought in the AISM region and, consequently, lessriverine terrestrial supply to our site. Comparison of our Ti/Carecord with the lake sedimentary records from Ecuador (Moyet al., 2002) and the Galapagos Islands (Conroy et al., 2008)shows no correlation [r ¼ �0.089 with 95% confidence interval(�0.296; 0.134)] and a high covariance [r ¼ 0.481 with 95% con-fidence interval (0.237; 0.605)], respectively. However, despite thehigh covariance, comparison of our Ti/Ca record with the El JuncoCrater Lake in the Galapagos Islands (Conroy et al., 2008) revealsthat periods of more frequent and/or intense El Niño events afterw3000 yr BP (Conroy et al., 2008) are associated with increasedterrigenous supply and thus enhanced AISM rainfall (Fig. 8).However, since El Niño events cause reduced rainfall and subse-quent drought in the AISM region, the positive correlation be-tween El Niño events and southern Indonesian rainfall, inparticular after w3000 yr BP, does not imply a causal relationship,but perhaps a common forcing. Moreover, with no clear evidenceof El Niño events covarying with La Niña events on that timescales, which typically result in increased rainfall over central andsouthern Indonesia and northern Australia (Aldrian and Susanto,2003), we cannot attribute higher supply of terrigenous materialand changes in AISM rainfall to more La Niña events afterw3000 yr BP. Based on a stalagmite record from tropical Australiahowever, it was argued that more stronger El Niño events mayhave played a dominant role in driving AISM variability since atleast the middle Holocene (Denniston et al., 2013). We emphasizethat rainfall variability in tropical northern Australia is not only inconflict with our Ti/Ca record for changes in AISM rainfall vari-ability but also with the Ti/Ca record off south Java (Mohtadi et al.,2011) and the Flores cave stalagmite record (Griffiths et al., 2009,2010).
Our model simulation which reveals a distinct contrast inrainfall over southern Indonesia and northern Australia duringsolar minima (Fig. 7d) may also help to reconcile this apparentcontradiction between the northern Australian and southernIndonesian records of AISM variability since the middle Holocene(w4000e3000 yr BP). The increased AISM rainfall between e.g.w1500 yr BP and 2800 yr BP as inferred from our Ti/Ca record isconsistent with higher precipitation as recorded in the Flores sta-lagmite stable oxygen isotope record (Griffiths et al., 2009, 2010),while northern Australia shows a trend of decreasing rainfall dur-ing that time period (Denniston et al., 2013; see also above). It wasargued that more stronger El Niño events may have played adominant role in this reduction of northern Australian precipitation(Denniston et al., 2013). However, this scenario is in conflict withthe modern climatology in the region as El Niño events are alsotypically associated with reduced rainfall and subsequent droughtin central and southern Indonesia (e.g. Aldrian and Susanto, 2003;see discussion below). Thus, we hypothesize that after the 2800 yrBP event a general decrease in solar activity favoured an increase inrainfall in southern Indonesiawhile northern Australia experienceda reduction in rainfall. In order to better assess the role of ENSO onrainfall over the Maritime Continent on longer timescales other,annually resolved and thus more ENSO-sensitive archives such as
varves, tree rings or corals are required. Such archives will helpquantifying the extent of ENSO impact on rainfall in time and spacebut not yet available from the Maritime Continent.
7. Conclusions
In the light of our new record and previously published datafrom the Northern Hemisphere Indian and East Asian monsoon(Fleitmann et al., 2003; Gupta et al., 2005;Wang et al., 2005; Zhanget al., 2008), a picture emerges suggesting that the Asian-Australianmonsoon system as a whole is responding to variations in the solaroutput. The combined effect of orbital and solar forcing explainsimportant details in the temporal behaviour of AISM rainfall oversouthern Indonesia during the last 6000 years. The comparisonwith El Niño proxy records suggests that El Niño did not exert asignificant control on AISM rainfall variability at multi-decadal tomulti-millennial timescales over the last 6000 years. In addition,the contrasting patterns in rainfall variability over southernIndonesia and northern Australia require further investigations.
Acknowledgements
S. Steinke and M. Mohtadi acknowledge financial support fromthe Deutsche Forschungsgemeinschaft (DFG grants STE1044/4-1and HE3412/15-1) and the German Bundesministerium für Bildungund Forschung (BMBF grant PABESIA). We thank J. Southon and D.Oppo for valuable comments on the age model and on an earlierdraft of the manuscript, U. Röhl and V. Lukies for technical support,and K. B. Olafsdottir for statistical analyses. This research used dataacquired at the XRF Core Scanner Lab at the MARUM e Center forMarine Environmental Sciences, University of Bremen, Germany.We thank three anonymous reviewers for their constructive criti-cisms that have helped to improve the manuscript.
References
Adler, R.F., 13 others, 2003. The version-2 Global Precipitation Climatology Project(GPCP) monthly precipitation analysis (1979-present). J. Hydrometeorol. 4,1147e1167. http://dx.doi.org/10.1175/1525-7541(2003)004<1147:TVGPCP>2.0.CO;2.
Aldrian, E., Susanto, R., 2003. Identification of three dominant rainfall regionswithin Indonesia and their relationship to sea surface temperature. Int. J. Clim.23, 1435e1452.
Appleby, P.G., Oldfield, F., 1978. The calculation of lead-210 dates assuming a con-stant rate of supply of unsupported 210Pb to the sediment. Catena 5, 1e8.
Blaauw, M., Christen, J.A., 2011. Flexible paleoclimate ageedepth models using anautoregressive gamma process. Bayesian Anal. 6 (3), 457e474. http://dx.doi.org/10.1214/11-BA618.
Christensen, J.H., 16 others, 2007. Regional Climate Projections. In: Solomon, S., 7others (Eds.), Climate Change 2007. The Physical Science Basis. Contribution ofWorking Group I to the Fourth Assessment Report of the IntergovernmentalPanel on Climate Change. Cambridge University Press, Cambridge, UnitedKingdom and New York, NY, USA, pp. 848e940.
Clement, A.C., Seager, R., Cane, M.A., Zebiak, S.E., 1996. An ocean dynamical ther-mostat. J. Clim. 9, 2190e2196 doi:10.1175/15200442(1996)009<2190:AODT<2.0.CO;2.
Collins, W.D., 14 others, 2006. The community climate system model version 3(CCSM3). J. Clim. 19, 2122e2143. http://dx.doi.org/10.1175/JCLI3761.1.
Conroy, J.L., Overpeck, J.T., Cole, J.E., Shanahan, T.M., Steinitz-Kannan, M., 2008.Holocene changes in eastern tropical Pacific climate inferred from Galapagoslake sediment record. Quat. Sci. Rev. 27, 1166e1180.
Denniston, 13 others, 2013. A stalagmite record of Holocene IndonesianeAustraliansummer monsoon variability from the Australian tropics. Quat. Sci. Rev. 78,155e178.
Fleitmann, D., Burns, S.J., Mudelsee, M., Neff, U., Kramers, J., Mangini, A., Matter, A.,2003. Holocene forcing of the Indian monsoon recorded in a stalagmite fromSouthern Oman. Science 300, 1737e1739. http://dx.doi.org/10.1126/science.1083130.
Gill, A.E., 1980. Some simple solutions for heat-induced tropical circulation. Q. J. Roy.Meteor. Soc. 106, 447e462.
Gray, L.J., Beer, J., Geller, M., Haigh, J.D., Lockwood, M., Matthes, K., Cubasch, U.,Fleitmann, D., Harrison, G., Hood, L., Luterbacher, J., Meehl, G.A., Shindell, D., vanGeel, B., White, W., 2010. Solar influences on climate. Rev. Geophys. 48. http://dx.doi.org/10.1029/2009RG000282.

S. Steinke et al. / Quaternary Science Reviews 93 (2014) 142e154154
Griffiths, M.L., 12 others, 2009. Increasing AustralianeIndonesian monsoon rainfalllinked to early Holocene sea-level rise. Nat. Geosci. 2, 636e639. http://dx.doi.org/10.1038/NGEO605.
Griffiths, M.L., 10 others, 2010. Evidence for Holocene changes in AustralianeIndonesian monsoon rainfall from stalagmite trace element and stable isotoperatios. Earth Planet. Sci. Lett. 292, 27e38. http://dx.doi.org/10.1016/j.epsl.2010.01.002.
Gupta, A.K., Das, M., Anderson, D.M., 2005. Solar influence on the Indian summermonsoon during the Holocene. Geophys. Res. Lett. 32, L17703. http://dx.doi.org/10.1029/2005GL022685.
Hebbeln, D., Jennerjahn, T., Mohtadi, et al., 2006. Report and preliminary results ofRV SONNE cruise So-184, Pabesia, Durban (South Africa) e Cilacap (Indonesia)-Darwin (Australia), July 8th e September 13th, 2005. Berichte, FachbereichGeowissenschaften, Universität Bremen, No. 246, Bremen, 142 pp.
Jennerjahn, T.C., Ittekkot, V., Klöpper, S., Adi, S., Nugroho, S.P., Sudiana, N.,Yusmal, A., Prihartanto, Gaye-Haake, B., 2004. Biogeochemistry of a tropicalriver affected by human activities in its catchment: Brantas River estuary andcoastal waters of Madura Strait, Java, Indonesia. Est. Coast. Shelf Sci. 60, 503e514. http://dx.doi.org/10.1016/j.ecss.2004.02.008.
Judge, P.G., Lockwood, G.W., Radick, R.R., Henry, G.W., Shapiro, A.I., Schmutz, W.,Lindsey, C., 2012. Confronting a solar irradiance reconstruction with solar andstellar data (Research Note). Astron. Astrophys. 44. http://dx.doi.org/10.1051/0004-6361/201218903.
Kalnay, E., 21 other, 1996. The NCEP/NCAR 40-year reanalysis project. B. Am.Meteorol. Soc. 77, 437e470.
Konecky, B.L., Russell, J.M., Rodysill, J.R., Vuille, M., Bijaksana, S., Huang, Y., 2013.Intensification of southwestern Indonesian rainfall over the past millennium.Geophys. Res. Lett. 40. http://dx.doi.org/10.1029/2012GL054331.
Kröpelin, S., 14 others, 2008. Climate-driven ecosystem succession in the Sahara:the past 6000 years. Science 320, 765e768. http://dx.doi.org/10.1126/science.1154913.
Laskar, J., Robutel, P., Joutel, F., Gastineau, M., Correia, A.C.M., Levard, B., 2004.A long-term numerical solution for the insolation quantities of the Earth.Astron. Astrophys. 428, 261e285.
Levermann, A., Schewe, J., Petoukhov, V., Held, H., 2009. Basic mechanism for abruptmonsoon transitions. Proc. Natl. Acad. Sci. U. S. A. 106, 20572e20577. http://dx.doi.org/10.1073/pnas.0901414106.
Liu, Z., Otto-Bliesner, B., Kutzbach, J., Li, L., Shields, C., 2003. Coupled climatesimulation of the evolution of global monsoons in the Holocene. J. Clim. 16,2472e2490.
Lockwood, M., 2011. Shining a light on solar impacts. Nat. Clim. Change 1, 98e99.http://dx.doi.org/10.1038/nclimate1096.
Magee, J.W., Miller, G.H., Spooner, N.A., Questiaux, D., 2004. Continuous 150 k.y.monsoon record from Lake Eyre, Australia: insolation-forcing implications andunexpected Holocene failure. Geology 32, 885e888. http://dx.doi.org/10.1130/G20672.1.
Mann, M.E., Cane, M.A., Zebiak, S.E., Clement, A., 2005. Volcanic and solar forcing ofthe tropical Pacific over the past 1000 years. J. Clim. 18, 447e456.
Marchitto, T.M., Muscheler, R., Ortiz, J.D., Carriquiry, J.D., van Geen, A., 2010.Dynamical response of the tropical Pacific Ocean to solar forcing during theearly Holocene. Science 330, 1378e1381. http://dx.doi.org/10.1126/science.1194887.
Martin-Puertas, C., Matthes, K., Brauer, A., Muscheler, R., Hansen, F., Petrick, C.,Aldahan, A., Possnert, G., van Geel, B., 2012. Regional atmospheric circulationshifts induced by a grand solar minimum. Nat. Geosci. 5, 397e401. http://dx.doi.org/10.1038/NGEO1460.
Meehl, G.A., Washington, W.M., Wigley, T.M.L., Arblaster, J.M., Dai, A., 2003. Solarand greenhouse gas forcing and climate response in the twentieth century.J. Clim. 16, 426e444 doi:10.1175/1520-0442(2003)016<0426:SAGG-FA>2.0.CO;2. doi:10.1038/NGEO1460.
Meehl, G.A., Arblaster, J.M., Matthes, K., Sassi, F., van Loon, H., 2009. Amplifying thePacific climate system response to a small 11-year solar cycle forcing. Science325, 1114e1118. http://dx.doi.org/10.1126/science.1172872.
Miller, G., Mangan, J., Pollard, D., Thompson, S., Felzer, B., Magee, J., 2005. Sensitivityof the Australian Monsoon to insolation and vegetation: implications for humanimpact on continental moisture balance. Geology 33, 65e68. http://dx.doi.org/10.1130/G21033.1.
Mohtadi, M., Oppo, D.W., Steinke, S., Stuut, J.-B.W., De Pol-Holz, R., Hebbeln, D.,Lückge, A., 2011. Glacial to Holocene swings of the AustralianeIndonesianmonsoon. Nat. Geosci. 4, 540e544. http://dx.doi.org/10.1038/NGEO1209.
Moy, C.M., Seltzer, G.O., Rodbell, D.T., Anderson, D.M., 2002. Variability of El Nino/Southern oscillation activity at millennial timescales during Holocene epoch.Nature 420, 162e165.
Mudelsee, M., 2003. Estimating Pearson’s correlation coefficient with bootstrapconfidence interval from serially dependent time series.Math. Geol. 35, 651e665.
Nott, J., Price, D., 1994. Plunge pools and paleoprecipitation. Geology 22, 1047e1050doi:10.1130/0091-7613(1994)022<1047:PPAP>2.3.CO;2.
Otto-Bliesner, B.L., Thomas, R., Brady, E.C., Ammannm, C., Kothavala, Z., Clauzet, G.,2006. Climate sensitivity of moderate- and low-resolution versions of CCSM3 topreindustrial forcings. J. Clim. 19, 2567e2583. http://dx.doi.org/10.1175/JCLI3754.1.
Pittauerova, D., Fischer, H.W., Mulitza, S., 2009. Using 210Pb and 137Cs record formatching sediment cores. In: International Topical Conference on Polonium andRadioactive Lead Isotopes, Seville, Spain.
Reimer, P.J., et al., 2013. INTCAL13 and MARINE13 radiocarbon age calibrationcurves, 0e50,000 years cal BP. Radiocarbon 55, 1869e1887 http://dx.doi.org/10.2458/azu_js_rc.55.16947.
Rixen, T., Ittekot, V., Herunadi, B., Wetzel, P., Maier-Reimer, E., Gaye-Haake, B., 2006.ENSO-driven carbon see saw in the Indo-Pacific. Geophys. Res. Lett. 33, L07606.http://dx.doi.org/10.1029/2005GL024965.
Schefuß, E., Kuhlmann, H., Mollenhauer, G., Prange, M., Pätzold, J., 2011. Forcing ofwet phases in southeast Africa over the past 17,000 years. Nature 480, 509e512.http://dx.doi.org/10.1038/nature10685.
Solanki, S.K., Usoskin, I.G., Kromer, B., Schüssler, M., Beer, J., 2004. Unusual activityof the Sun during recent decades compared to the previous 11,000 years. Nature431, 1084e1087. http://dx.doi.org/10.1038/nature02995.
Southon, J., Mohtadi, M., De Pol-Holz, R., 2013. Planktonic foram dates from theIndonesian arc: marine 14C reservoir ages and a mythical AD 535 eruption ofKrakatau. Radiocarbon 55, 1164e1172.
Steinhilber, F., Beer, J., Fröhlich, C., 2009. Total solar irradiance during the Holocene.Geophys. Res. Lett. 36, L19704. http://dx.doi.org/10.1029/2009GL040142.
Tierney, J.E., Oppo, D.W., Rosenthal, Y., Russell, J.M., Linsley, B.K., 2010. Coordinatedhydrological regimes in the Indo-Pacific region during the past two millennia.Paleoceanography 25. http://dx.doi.org/10.1029/2009PA001871.
Usoskin, I.G., Solanki, S.K., Kovaltsov, G.A., 2007. Grand minima and maxima of solaractivity: new observational constraints. Astron. Astrophys. 471, 301e309. http://dx.doi.org/10.1051/0004-6361:20077704.
van Breukelen, M.R., Vonhof, H.B., Hellstrom, J.C., Wester, W.C.G., Kroon, D., 2008.Fossil dripwater in stalagmites reveals Holocene temperature and rainfallvariation in Amazonia. Earth Planet. Sci. Lett. 275, 54e60. http://dx.doi.org/10.1016/j.epsl.2008.07.060.
van Geel, B., Heusser, C.J., Renssen, H., Schuurmans, J.E., 2000. Climatic change inChile at around 2700 BP and global evidence for solar forcing: a hypothesis.Holocene 10, 659e664. http://dx.doi.org/10.1191/09596830094908.
Varma, V., Prange, M., Lamy, F., Merkel, U., Schulz, M., 2011. Solar-forced shifts of theSouthern HemisphereWesterlies during the Holocene. Clim. Past. 7, 339e347.http://dx.doi.org/10.5194/cp-7-339-2011.
Wang, Y., Cheng, H., Edwards, R.L., He, Y., Kong, X., An, Z., Wu, J., Kelly, M.J.,Dykoski, C.A., Li, X., 2005. The Holocene Asian Monsoon: links to solar changesand North Atlantic climate. Science 308, 854e857.
Webster, P.J., Magaña, V.O., Palmer, T.N., Shukla, J., Tomas, R.A., Yanai, M.,Yasunari, T., 1998. Monsoons: processes, predictability, and the prospects forprediction. J. Geophys. Res. 103, 14451e14510.
Yeager, S.G., Shields, C.A., Large, W.G., Hack, J.J., 2006. The low-resolution CCSM3.J. Clim. 19, 2545e2566.
Zhang, P., 16 others, 2008. A test of climate, sun, and culture relationships from an1810-year Chinese cave record. Science 322, 940e942. http://dx.doi.org/10.1126/science.1163965.
Zielinski, G.A., Mayewski, P.A., Meeker, L.D., Grönvold, K., Germani, M.S.,Whitlow, S., Twickler, M.S., Taylor, K., 1997. Volcanic aerosol records andtephrochronology of the Summit, Greenland, ice cores. J. Geophys. Res. 102,26625e26640.