mid-infraredastronomywith the e-elt:performance of metis · metis is the mid-infrared e-elt imager...
TRANSCRIPT

arX
iv:1
006.
4669
v1 [
astr
o-ph
.IM
] 2
4 Ju
n 20
10
Mid-infrared astronomy with the E-ELT: Performance of
METIS
S. Kendrewa, L. Jolissainta, B. Brandla, R. Lenzenb, E. Pantinc, A. Glassed, J. Blommaerte, L.
Venemaf, R. Siebenmorgeng, F. Molsterh
aLeiden Observatory, University of Leiden, PO Box 9513, 2300 RA Leiden, Netherlands;b Max Planck Institute for Astronomy, Konigstuhl 17, 69117 Heidelberg, Germany;
cCEA Saclay, Gif-sur-Yvette, 91191 cedex, France;dUK Astronomy Technology Centre, Royal Observatory of Edinburgh, Blackford Hill,
Edingburgh EH9 3HJ, United Kingdom;eKatholieke Universiteit Leuven, Institute of Astronomy, Celestijnenlaan 200D Bus 2401, 3001
Leuven, Belgium;fAstron, Oude Hoogeveensedijk 4, 7991 PD Dwingeloo, Netherlands;
gESO, Karl SchwarzschildStrasse 2, 85748 Garching, Germany.hNOVA,PO Box 9513, 2300 RA Leiden, Netherlands.
ABSTRACT
We present results of performance modelling for METIS, the Mid-infrared European Extremely Large TelescopeImager and Spectrograph. Designed by a consortium of NOVA (Netherlands), UK Astronomy Technology Centre(UK), MPIA Heidelberg (Germany), CEA Saclay (France) and KU Leuven (Belgium), METIS will cover theatmospheric windows in L, M and N-band and will offer imaging, medium-resolution slit spectroscopy (R∼1000-3000) and high-resolution integral field spectroscopy (R∼100,000). Our model uses a detailed set of inputparameters for site characteristics and atmospheric profiles, optical design, thermal background and the mostup-to-date IR detector specifications. We show that METIS will bring an orders-of-magnitude level improvementin sensitivity and resolution over current ground-based IR facilities, bringing mid-IR sensitivities to the micro-Jansky regime. As the only proposed E-ELT instrument to cover this entire spectral region, and the only mid-IRhigh-resolution integral field unit planned on the ground or in space, METIS will open up a huge discovery spacein IR astronomy in the next decade.
Keywords: extremely large telescopes, infrared astronomy, infrared instrumentation, imaging, spectroscopy,simulation
1. METIS: AN OVERVIEW
METIS is the Mid-infrared E-ELT Imager and Spectrograph proposed for the 42-m European Extremely LargeTelescope (E-ELT), which is expected to start operations in 2018 at Cerro Armazones (Chile). A Phase Astudy was carried out by a consortium of NOVA (comprising Leiden Observatory and Astron; Netherlands), theMax Planck Institute for Astronomy (MPIA; Germany), UK Astronomy Technology Centre (UKATC; UK), KULeuven (Belgium) and CEA Saclay (France), in 2008-2009. Of the eight instruments under consideration for thePhase A stage, METIS is the only to cover the mid-infrared wavelength regime longward of 3 µm.
METIS is a multi-mode instrument covering the wavelength range of 3 to 14 µm, offering imaging, coronagra-phy, medium-resolution slit spectroscopy and high-resolution integral field spectroscopy. An overall descriptionof the instrument and its science goals are given by Brandl et al1 in these proceedings (2010; paper [7735-86]).In addition, Lenzen et al2 (2010; paper [7735-283]) show the instrument concept and trade-off solutions; Kroeset al3 (2010; paper [7735-200]) describe the optomechanical design concept, including the cryogenic scheme; and
Send correspondence to S. Kendrew, email: [email protected]; B. Brandl, email: [email protected]
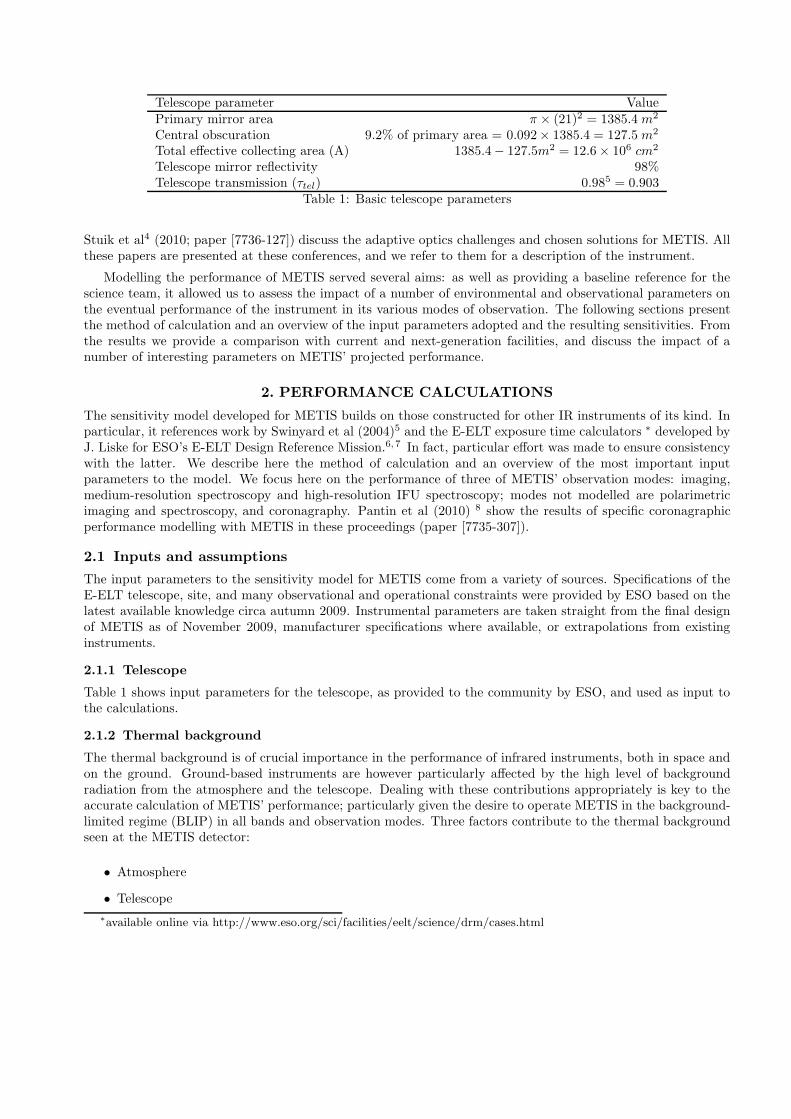
Telescope parameter ValuePrimary mirror area π × (21)2 = 1385.4 m2
Central obscuration 9.2% of primary area = 0.092× 1385.4 = 127.5 m2
Total effective collecting area (A) 1385.4− 127.5m2 = 12.6× 106 cm2
Telescope mirror reflectivity 98%Telescope transmission (τtel) 0.985 = 0.903
Table 1: Basic telescope parameters
Stuik et al4 (2010; paper [7736-127]) discuss the adaptive optics challenges and chosen solutions for METIS. Allthese papers are presented at these conferences, and we refer to them for a description of the instrument.
Modelling the performance of METIS served several aims: as well as providing a baseline reference for thescience team, it allowed us to assess the impact of a number of environmental and observational parameters onthe eventual performance of the instrument in its various modes of observation. The following sections presentthe method of calculation and an overview of the input parameters adopted and the resulting sensitivities. Fromthe results we provide a comparison with current and next-generation facilities, and discuss the impact of anumber of interesting parameters on METIS’ projected performance.
2. PERFORMANCE CALCULATIONS
The sensitivity model developed for METIS builds on those constructed for other IR instruments of its kind. Inparticular, it references work by Swinyard et al (2004)5 and the E-ELT exposure time calculators ∗ developed byJ. Liske for ESO’s E-ELT Design Reference Mission.6, 7 In fact, particular effort was made to ensure consistencywith the latter. We describe here the method of calculation and an overview of the most important inputparameters to the model. We focus here on the performance of three of METIS’ observation modes: imaging,medium-resolution spectroscopy and high-resolution IFU spectroscopy; modes not modelled are polarimetricimaging and spectroscopy, and coronagraphy. Pantin et al (2010) 8 show the results of specific coronagraphicperformance modelling with METIS in these proceedings (paper [7735-307]).
2.1 Inputs and assumptions
The input parameters to the sensitivity model for METIS come from a variety of sources. Specifications of theE-ELT telescope, site, and many observational and operational constraints were provided by ESO based on thelatest available knowledge circa autumn 2009. Instrumental parameters are taken straight from the final designof METIS as of November 2009, manufacturer specifications where available, or extrapolations from existinginstruments.
2.1.1 Telescope
Table 1 shows input parameters for the telescope, as provided to the community by ESO, and used as input tothe calculations.
2.1.2 Thermal background
The thermal background is of crucial importance in the performance of infrared instruments, both in space andon the ground. Ground-based instruments are however particularly affected by the high level of backgroundradiation from the atmosphere and the telescope. Dealing with these contributions appropriately is key to theaccurate calculation of METIS’ performance; particularly given the desire to operate METIS in the background-limited regime (BLIP) in all bands and observation modes. Three factors contribute to the thermal backgroundseen at the METIS detector:
• Atmosphere
• Telescope
∗available online via http://www.eso.org/sci/facilities/eelt/science/drm/cases.html

Site Altitude (m) Temperature (K) pwv (mm)Paranal 2600 286. 2.3High & dry 5000 270. 0.5Armazones 3064 281. 2.9
Table 2: Site characteristics used in generation of transmission and radiance profiles. Paranal and high & dryvalues from the ESO DRM; Armazones values from Schock et al (2009)9 and Otarola et al (2010).10
LM band N bandno. pixels 2k x 2k 1k x 1kpixel size (µm) 18 30dark current (e-/s) 0.5 2000read noise (e-/frame) 20 1000well depth 120,000 1.4e+7Table 3: Detector characteristics (per pixel).
• Instrument
For the instrumental background we model only the background radiation from the entrance window. Thiswindow will consist of an approximately 1.2 cm plate of ZnSe, whose emissivity rises strongly between 12 and20 µm. As the window will effectively be at ambient temperature, this can add a non-negligible backgroundcomponent in the N band. Our models show however that the contribution of the entrance window is small,thanks to transmission properties of dichroics, which filter out most radiation longward of 20 µm.
The atmosphere acts as a strong radiator at IR wavelengths; the emissivity profile depends on the verticalprofiles of temperature, pressure and molecular abundances (e.g. H2O, CO, CH4), and the telescope’s altitudeabove sea level. In these calculations we use a Paranal model atmosphere that provides an approximation forthe observational conditions at nearby Armazones. In addition, the performance of METIS was calculated fora typical 5000-m high and dry site. We do not consider any residual systematic flux from the backgroundsubtraction, only the photon noise of the background radiation itself. Table 2 shows the basic site parametersfor Paranal and the high & dry site; also included are the corresponding values for Armazones, as described bySchock et al (2009)9 and Otarola et al (2010).10
Atmospheric transmission and radiance profiles were provided to the community by ESO, these were cal-culated using the publicly available Reference Forward Model (RFM)† with the HITRAN 2004 molecular linedatabase,11 assuming a model tropical atmosphere and including the most common atmospheric molecules H2O,CO, CO2, CH4, O2, O3 and N2O. The profiles were produced with R∼ 100000, and subsequently convolvedto the appropriate resolutions for imaging and medium-resolution spectroscopy with METIS. The transmissionprofiles at the two considered sites are shown in Figure 1.
The telescope itself radiates as a grey body, at a temperature assumed equal to the ambient temperatureappropriate to the site (see Table 2). As a baseline we assumed a lower limit of 10% was assumed for the telescopeemissivity, and in section 4.2 the effect of a higher emissivity is investigated.
2.1.3 Detectors
METIS will use two different types of science detectors. The short wavelength L and M bands images andspectra will be imaged onto 2k × 2k HgCdTe detectors. The N-band modes will employ a 1k × 1k Si:AsAquarius detector. Table 3 shows the specifications for each type. Quantum efficiencies were adopted frommanufacturer specifications.
Given the well depth of the detector and the high thermal background flux from sky and telescope, particularlyfor broad-band observations, the detector integration time is calculated such that the counts do not exceed thehalf-well depth to avoid saturation or non-linearity effects. In high-resolution spectroscopy mode, where thebackground flux is heavily diluted, the integration time was calculated to ensure background noise limited,rather than read noise limited, performance.
†http://www.atm.ox.ac.uk/RFM/atm/

(a) (b)
Figure 1: Comparison of site profiles used in the calculations. (a) Transmission; (b) Radiance from telescope(dashed lines) and sky (solid lines) for Paranal (red) and a high & dry (blue) observing site.
Finally, a 20% overhead factor was applied to the total on-source integration time, such that a 1-hour exposurerepresents 0.8× 3600s = 2880s of on-source integration time. We do not take into account any extra duty cyclerelated to the chopping and nodding; essentially we assume that both the chop and nod mechanisms will keep thesource in the field. This is not always the case, therefore the duty cycle could be substantially lower in practice.
2.1.4 Adaptive optics
METIS will use adaptive optics (AO) to achieve diffraction-limited performance. The baseline mode of operationuses single-conjugate adaptive optics (SCAO), with a single natural guide star as reference source. Ensquaredenergies were calculated for METIS in SCAO mode using the analytical code PAOLA.12 The simulations assumedseeing of 0.65” at a zenith angle of 30 (giving a line-of-sight seeing of 0.71”), an outer scale of 25 m and a guidestar V-band magnitude of ≤ 10. We assume the same AO performance at the low and high sites.
A laser tomography AO facility is expected to be added to the E-ELT suite of instruments in due course afterfirst light,13 and this will help METIS reach maximal sky coverage. Using ensquared energy values producedby the LTAO unit study team, the performance of METIS in LTAO mode could also be investigated in thesecalculations.
Assuming the source photon noise is negligible sensitivity ∝ 1/ee (see equation 4 in the next section). Thisautomatically gives an estimate of the difference in sensitivity resulting from the switch to LTAO mode: thesensitivity of METIS with LTAO will be around 15-20% lower in L and M band than with SCAO, and up to40% in N band. In addition to giving a reduced in ensquared energy, the LTAO mode is also likely to be aless efficient mode of observation, i.e. with larger overheads, to the simpler SCAO configuration. Given therelatively early stage of development of the LTAO module and the lack of on-telescope experience with advancedAO architectures such as LTAO, these numbers should be considered as preliminary estimates.
2.2 Calculation method
For mid-infrared ground-based astronomy, the signal to noise (S/N) of an observation is given by:
S/N =
√frames× nobj
√
nobj + nsky + npix × (rd)2 + npix × (dark)× (DIT )(1)
where:
frames = number of frames per exposure
DIT = detector integration time per frame [s/frame]
nobj = detector counts from the object in the S/N reference area [e-/frame]
nsky = detector counts from the sky background in the S/N reference area [e-/frame]
npix = number of pixels in the S/N reference area, determined by sampling properties of the observing mode
rd = detector read noise per pixel [e-/frame]
dark = detector dark current per pixel [e-/s]
Ignoring the source photon noise (√nobj) against the strong thermal background, the sensitivity can be
calculated as the minimum detectable signal at a S/N of 10 in a 1 hour exposure:
minsig =S/N ×
√
nsky + npix × (rd)2 + npix × (dark)× (DIT )√frames
[e−] (2)
which can be converted back into flux units. We can now expand, first on some basic inputs related to thetelescope and detectors, then on the calculation of key parameters in eqns 1 and 2.
We define a factor conv, which converts the incident photon flux at the telescope to detected photo-electrons:
conv =A× τtel × τins × (dqe)× (pcg)×∆λ
Eγ
[e−/s per W/cm2/µm] (3)
where
A = photon collecting area [cm2]
τins = instrument throughput
τtel = telescope transmission
dqe = detector quantum efficiency
pcg = photo-conductive gain = 1 e− /photon
∆λ = filter width or width of resolution element [µm].
2.2.1 Counts from the astronomical source (nobj)
For an unresolved point source, the number of electron counts at the detector from the astronomical source,within the defined S/N reference area, is given by:
nobj = F ′obj × (ee)× (conv)× (DIT ) [e−/frame] (4)
where conv as defined above, and:
F ′obj = the flux from the source arriving at the telescope, given by τatm × Fobj , where τatm is the atmospheric
transmission and Fobj the source flux at the top of the atmosphere [W/cm2/µm]
ee = the encircled energy, i.e. the fraction of energy from the source radiation within the S/N reference area.This quantity is obtained from lookup tables.

Band λc (µm) ∆λ (µm)L 3.78 0.58M 4.66 0.10N 10.7 1.40
Table 4: METIS imager filter definitions for the sensitivity calculations.
2.2.2 Counts from the background (nsky)
Considering only the photon noise, the detector counts from the thermal background within the S/N referencearea per exposure can be calculated from:
nsky = Fsky × Ω× (conv)× (DIT ) [e−/frame] (5)
where:
Fsky = the flux from the thermal background [W/m2/µm/arcsec2], defined as sky emissivity ×τtel+ telescopebackground + entrance window background. The sky, telescope and window emissivity models are described insection 2.1.2.
Ω = size of the S/N reference area [arcsec2]. The S/N reference area is taken to be square in geometry, with√Ω given by the optical design of the given instrument mode.
3. PROJECTED SENSITIVITY OF METIS
The calculations outlined above were applied to METIS’ three main observation modes: imaging, medium-resolution spectroscopy and high-resolution spectroscopy. We discuss here some specifics for each of these modesand present sensitivity results. All sensitivities are calculated for unresolved point sources at a S/N of 10 in 1hour, and include the 20% overhead factor described in section 2.1.3. The following sections show calculationresults for each of METIS’ main observing modes. We do not model the performance of METIS in coronagraphicimaging mode, a dedicated paper by Pantin et al (2010; paper [7735-307])8 in these proceedings describes this inmore detail. As part of the phase-A study the option of an N-band channel to the high-resolution spectrographwas also investigated, with R∼50000. This mode was not included in the baseline design but we present herethe performance estimates for such a mode to demonstrate its scientific potential.1
3.1 Imaging
The METIS imager covers a field of view of 18”×18”, with the beam split between two modules, one coveringL and M bands, the other for N band, by a dichroic. The sampling is optimised (Nyquist sampled) at 3.5 µmand 7 µm for the short- and long-wavelength modules, respectively. This results in pixel scales of 8.6 mas/px forL/M band, and 17.2 mas/px for N band. The sensitivity was calculated over the square area encompassing thediffraction limited core of the PSF at the centre wavelength of the chosen filter - typically 3×3 or 4×4 pixels.
While the suite of METIS filters has not been definitively determined, we calculated sensitivities for typicalbroadband infrared filters, as used in today’s instruments such as ISAAC and VISIR. Filter details per band areshown in Table 4. Assuming 99% reflectivity of the internal instrument optics and typical dichroic transmissionproperties, the throughput of the imager module (including the entrance window, internal optics and DQE,excluding atmopshere and telescope) was calculated to be ∼60% in all three bands.
Results of the point source sensitivity calculations as described above are shown in Table 5, indicating asub-microJansky performance in L-band for typical observing conditions at a Paranal-like site. Performance ata high & dry site is shown for comparison.

Band λc(µm) Sensitivity, point (µJy)Low site High & dry site
L 3.78 0.6 0.4M 4.66 7.0 4.2N 10.7 27.5 23.0
Table 5: METIS imaging sensitivities for L, M and N bands at low and high sites using SCAO. The pointsensitivities were calculated for an unresolved point source observed for 1 hour to S/N of 10.
Band λmin (µm) λmax (µm) 2 px resolving powerLM 2.8 5.2 1700N 8.0 14.0 940
Table 6: Grisms for the medium-resolution spectroscopy mode for METIS.
3.2 Medium-resolution spectroscopy
The medium-resolution spectroscopy mode in METIS is achieved by inserting a slit and grism into the opticalpath of the imager. Its optical design parameters are therefore very similar to the imager mode described above.Spatial sampling properties for the medium-resolution spectroscopy mode are the same as for the imager. Theslit width is set to 2λslit/D at the shortest wavelengths in the band, i.e. λslit = 3 µm and 7 µm for LM and Nbands, respectively. We assume that the spectral resolution element is sampled by 2 pixels.
For this mode, the sensitivity was calculated over the rectangular area covered by the slit width in onedimension, and the full width at half maximum of the PSF at the chosen reference wavelength in the other.This rectangular geometry causes an overestimation of the ensquared energy of around 5-10%, and hence thesensitivity may be slightly worse than quoted by that amount.
A number of grisms are proposed for the low- and medium-resolution spectroscopy mode in METIS. Forthe sensitivity calculation we reference the two lowest-resolution grisms per band, each of which give one-shotfull-band coverage for LM and N bands, respectively. The grism details are listed in Table 6.
Typical throughputs in medium-resolution spectroscopy mode are 40-60% for L and M bands, and ∼60%in N band. The wide band coverage makes the spectrograph throughput sensitive to artefacts in the transmis-sion profile of the dichroics, which are challenging to manufacture for IR wavelengths and subject to ongoingresearch.14, 15 The profiles used in these calculations are based on current samples produced for the JWSTinstrument MIRI.
Results of the continuum and line sensitivity calculations for unresolved point sources with the medium-resolution spectrograph are shown in Table 7. Reference wavelengths were chosen in each band at the locationof interesting spectral markers from the METIS science case: the 4.05µm Brα line in L band, 4.7µm CO lines inM band, and 12.8µm [NeII] line in N band.
3.3 High-resolution integral field spectroscopy
The high-resolution spectrograph in METIS in its baseline design consists of a single channel, separate from theimager and medium-resolution spectrograph optics, covering the L and M bands. An optional N-band channelwith R∼50000 was also investigated, eventually not adopted in METIS’ baseline design. The spectrograph hasan integral field design using an image slicer to divide the field spatially. In the spatial direction, the slice width
Band λc(µm) Low site High siteCont (µJy) Line (×10−19W/m2) Cont (µJy) Line (×10−19W/m2)
L 4.05 15 0.06 10 0.04M 4.7 46 0.17 29 0.11N 12.8 507 1.26 429 1.1
Table 7: METIS medium-resolution spectroscopic sensitivities for L, M and N bands at low and high sites.Calculated for an unresolved point and line sources observed for 1 hour to S/N of 10.

Band λc(µm) Sensitivity (×10−19W/m2)Low site High & dry site
L 4.05 0.009 0.006M 4.7 0.026 0.017N 12.8 0.133 0.116
Table 8: METIS high-resolution spectroscopic line sensitivities for L, M and N bands, at low and high sites, forunresolved point sources. Calculated for an unresolved line observed for 1 hour detected at S/N of 10.
is optimised to give critical (Nyquist) sampling at λspat = 3.7 µm and 9.0 µm for LM and N bands respectively,i.e. the number of spatial pixels over which the sensitivity is calculated pixspat is given by 2× (λ/λspat).
Spectrally the resolving power is designed to be 100000, optimised at 4.7 µm for LM bands, and 50000,optimised at 12.8 µm for N band. At these locations an unresolved line will be sampled by 2.5 pixels (ananamorphism factor of 1.25 is introduced by the gratings). Although the variation of spectral sampling isaffected both by the changing resolution element and the wavelength dependence of the dispersion function, weassume 2.5 pixel spectral sampling over the whole band, i.e. pixspec = 2.5. The anamorphism essentially giveseach pixel a rectangular, rather than square, field of view. The as-designed sampling in LM band is 9.0 mas/pxspatially and 7.2 mas/px spectrally. The instantaneous wavelength coverage of the IFU spectrograph is ∼60nm. For the optional N-band channel, the as-designed pixel sampling is 22 mas/px spatially and 17.6 mas/pxspectrally, with a wavelength coverage of ∼120 nm.
The spectrograph module contains significantly more optical components than the imager and its throughputis therefore lower (25-35%).
The IFU sensitivities were calculated for unresolved lines from point sources, detected to S/N of 10 in 1 hour;results are shown in Table 8. Given the high dilution of the sky and telescope background by the gratings, therisk of saturation is much lower than for broadband observations. The detector read noise, however, is substantial(see Table 3). The detector integration times per frame (DIT ) were therefore calculated such that the noise isdominated by background noise, rather than read noise from the detector. At a Paranal-like site this requirementleads to typical integration times of ∼35s in L band, ∼10s in M band, and ∼60s in N band.
3.4 Comparison with current and future facilities
The likely sensitivities of METIS, as presented here, were compared against the performance of other facilitiesoperating in the mid-infrared wavelength range - either at present, or planned to come online in the next decade.Given the difficulties of observing in the mid-IR from the ground, a comparison with current and future space-based facilities, notably Spitzer and JWST-MIRI, is particularly interesting. The sensitivity values quoted inthis section were all scaled to the same benchmark of a detection of an unresolved point source to 10-σ in a1-hour observation, using the scaling relations resulting from equation 1. The spectroscopic sensitivities shouldbe observed with care, given the different resolving powers offered by the various instruments. The comparativeplots are shown in Figures 2 and 3, for imaging and spectroscopy, respectively.
For imaging, we compare the performance of METIS at a Paranal-like site to that of the current 8-m classinstruments VISIR16 (VLT) and Michelle17 (Gemini-N), obtained from publicly available limiting magnitudeor sensitivity values in the instrument manuals. In addition, the plot shows the performance of IRAC18 onboard the Spitzer Space Telescope for high-background observations, as given in the instrument handbook.The performance of three contemporary facilities is also plotted against METIS: the Giant Magellan Telescope’sMIISE;19 the Thirty Meter Telescope’s MIRES; and MIRI on board JWST.5 For MIRES no published sensitivitieswere found, and we adopted the METIS sensitivities at a high & dry site scaled to a 30-m aperture.
Figure 2 shows how METIS’ imaging performance is comparable though somewhat better than that of itscontemporary instruments on GMT and TMT; in certain parts of the spectrum MIRES would benefit from thehigh & dry location of the TMT. Only MIRI on JWST will substantially outperform METIS, offering continuousmid-IR wavelength coverage down to sub-microJansky levels, albeit at much lower spatial resolution. In this wayMIRI and METIS provide excellent complementarity in the parameter space they are able to explore.

For spectroscopy, METIS’ line sensitivities are compared against VISIR, Michelle, MIRES and MIRI, asabove, as well as CRIRES20 on VLT; Spitzer’s Infrared Spectrograph IRS21 and NIRSpec for JWST. Of theseinstruments, CRIRES is the most comparable to METIS in terms of wavelength coverage and spectral resolvingpower; Figure 3 shows how METIS will offer an improvement in line sensitivity of more than an order ofmagnitude. Furthermore, its IFU design will offer the only high-resolution 3D spectroscopic capability at thesewavelengths in the next decade. The N-band spectroscopic sensitivity, which is not included in the final baselinedesign, is indicated with a dashed line.
0.0001
0.001
0.01
0.1
1
10
100
1000
4 6 8 10 12 14
conti
nuum
sen
siti
vit
y (
mJy
)
wavelength (micron)
E-ELT/METIS
Michelle
VISIR
Spitzer/IRAC
JWST/MIRI
GMT/MIISE
TMT/MIRES
IMAGING
Figure 2: Imaging performance of METIS compared with a number of current and contemporary facilities.
1e-022
1e-021
1e-020
1e-019
1e-018
1e-017
1e-016
4 6 8 10 12 14
line
sensi
tivit
y (
W/m
^2)
wavelength (micron)
E-ELT/METIS
Michelle
VISIR
Spitzer/IRS
JWST/MIRI
CRIRES
TMT/MIRES
JWST/NIRSpec
SPECTROSCOPY
Figure 3: Spectroscopic performance of METIS compared with a number of current and contemporary facilities.

4. DISCUSSION
4.1 The E-ELT site
An investigation into the instrumental performance cannot be decoupled from the atmospheric conditions at thetelescope site. The atmospheric background dominates particularly the short edge of the L-band, the M-bandand the long-wavelength edge of the N-band. Lower molecular abundances will improve the transparency of thewindow and lower the atmospheric radiance (e.g. in the CO-bands around 4.7 µm, see fig. 4). In other regions,such as the short-wavelength part of the N-band, the telescope background dominates over the atmosphericradiance, and the benefit of a high site derives mainly from the lower ambient temperature.
For spectroscopy, a clear advantage is that even the strongest atmospheric absorption features are no longersaturated at very low humidity (typically above 5000m), allowing the observed spectra to be calibrated fortelluric absorption with better accuracy (for a discussion of telluric line correction for METIS, see Uttenthaleret al (2010; paper [7735-269]) in these proceedings). During periods of very low atmospheric water vapour, theusually opaque 5-8 µm range can become accessible to ground-based astronomy.
In general, the sensitivity values in Tables 5, 7 and 8 indicate an improvement in L and M band of the order of30%, and around 15% in N band at a high & dry site. These values however generally cover band centres, wherethe atmospheric windows have maximal transparency. To investigate how the performance differs in the bandedges, where atmospheric absorption is stronger, we calculate the high-resolution spectroscopic line sensitivitiesacross the entire L and M bands for the two sites (see Figure 5).
On inspection of the ratio between the sensitivities (bottom panel), we clearly see how the gain at the bandedges is indeed higher - up to almost an order of magnitude in the range 3.2-3.4 µm (L band). Beyond 5 µm inM band the gain at the high site also rises above the band average.
In April 2010, the site for the E-ELT was announced to be Cerro Armazones,22 in the Chilean Andes close tothe ESO site at Cerro Paranal. Basic site parameters, shown in Table 2, suggest that the performance of METISat Armazones will exceed that projected for Paranal. The site’s higher altitude and lower temperature will resultin a reduced thermal background and better transmission, however, the precipitable water vapour values foundby Otarola et al (2010)10 indicate a somewhat wetter atmosphere. These quoted values may rely on differentmeasurement techniques or instrumental calibrations and may not be suitable for a like-for-like comparison.
It is important to note that the relation between site characteristics and instrumental performance in thewavelength range covered by METIS goes beyond the bottom-level metrics we have described quantitativelyhere. Variability of parameters such as seeing and humidity affect the performance of the AO system, instru-mental calibration and operations, and hence the final image quality. Detailed knowledge of the atmosphere atCerro Armazones, both in basic meteorological terms (temperature, pressure, humidity) and turbulence profileover both vertical (turbulence layering and altitudes) and horizontal (outer scale) scales will be important informulating an optimal calibration and operations strategy for METIS.
4.2 Telescope emissivity
It is clear that the background from sky and telescope are an important, if not the most important, factor on theperformance of any mid-IR ground-based instrument. The emissivity of the telescope is of particular concern,as its effect is twofold:
• higher emissivity increases the thermal background seen by the detector; and
• higher emissivity implies a lower reflectivity, which leads to reduced throughput of the system.
This two-part effect of the telescope emissivity means the relationship between telescope emissivity andinstrumental performance is not straightforward, depending on the telescope site (i.e. telescope temperature),the wavelength of observations and the filter bandwidth. In terms of the formalism shown in section 2.2, theemissivity will reduce the telescope transmission (τtel) and increase telescope background contribution to nsky .
The emissivity of the telescope is dominated by the emissivity of its largest optical surface, the primarymirror. The value of this parameter will be determined by the reflectivity of the mirror coatings, which may vary
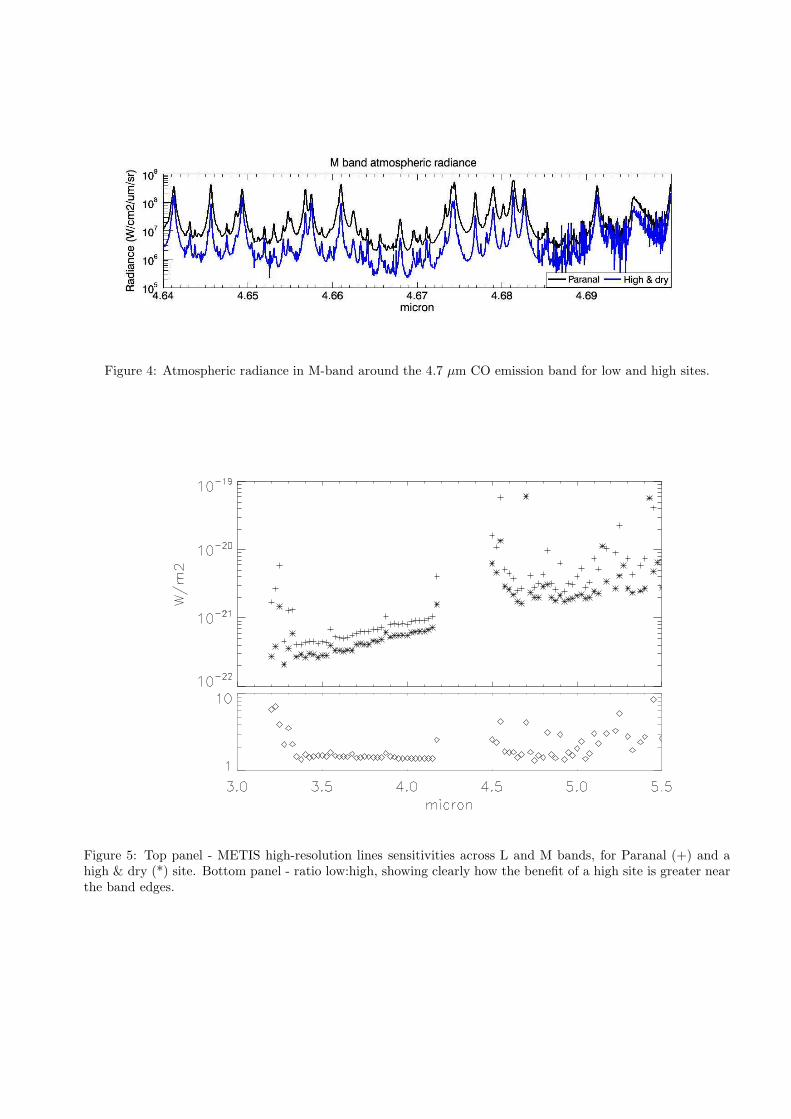
Figure 4: Atmospheric radiance in M-band around the 4.7 µm CO emission band for low and high sites.
Figure 5: Top panel - METIS high-resolution lines sensitivities across L and M bands, for Paranal (+) and ahigh & dry (*) site. Bottom panel - ratio low:high, showing clearly how the benefit of a high site is greater nearthe band edges.

substantially between the segments; gaps in between the segments, which will act as strong (near-blackbody)infrared radiators; the presence of dust; and roll-off at the segment edges from the polishing process, which willcause extra light scattering and could potentially reflect warm sources near the telescope into the beam. Inour calculations we assume the telescope radiates as a grey body at the ambient temperature of the site, i.e.irrespective of these properties, the telescope’s background flux is lower at a high & dry site. The telescopeemissivity as specified by ESO is ≤ 10%.
To test the dependence on telescope emissivity of METIS’ sensitivity, we recalculated the sensitivity fortelescope emissivity values from 10 to 30 % in imaging mode. The results, shown in Figure 6, show the following:
• The deterioration of imaging sensitivity is quite dramatic, up to a factor 2 in L and N bands and a factorof 1.6 in M band. The precise value of the loss in sensitivity depends on band, filter and telescope site,however, a high telescope emissivity of 30% will result in a loss of sensitivity of up to a factor of 1.5-2.0 atboth a high and a low site.
• The sensitivity requirements from METIS’ ambitious proposed science programme1 will be met if thetelescope emissivity remains ≤ 20% at a low site, and ≤ 25% at a high site. This is driven by the N band,where the infrared thermal background of both atmosphere and telescope is stronger than in L and Mbands for a given temperature.
Figure 6: Imaging sensitivities for METIS for telescope emissivities between 5 and 30 %, for L band, M bandand N band. The Y-axis shows the absolute sensitivity value.
5. CONCLUSIONS
The calculations presented here were carried out during the 18-month Phase A study for METIS, in 2008-2009,and hence reflect the state of the telescope and instrument design as of late 2009. Based on our current knowledgeand understanding, the sensitivity estimates convincingly demonstrate that METIS will be a formidable additionto the suite of ELT-class instruments worldwide, and moreover it is the only proposed first-light instrument onany ELT covering the full thermal and mid-IR ranges with imaging and spectroscopy. METIS will offer an orderof magnitude improvement in sensitivity over current ground-based instrument, at superior spatial resolutionaided by adaptive optics. In addition, METIS will complement very well its main space-based counterpart,MIRI on JWST, by offering high-resolution spectroscopy and a much better spatial resolution, albeit at a lowersensitivity.
By studying a number of critical aspects, we can state that achieving these sensitivities with METIS hingeson a detailed knowledge of the local atmosphere at the E-ELT site (atmospheric turbulence, thermal backgroundbehaviour), as well as an understanding of how such environmental effects are likely to influence the imagequality; this will be an important area of study for the instrument team. The telescope emissivity will also playan important role, and efforts to reduce this will be very beneficial for METIS.
The code used to carry out these calculations is publicly available for download at http://tinyurl.com/metis-sens.
REFERENCES
[1] Brandl, B. R. et al., “Instrument concept and science case for the mid-infrared E-ELT imager and spectro-graph METIS,” in [Proc. SPIE vol. 7735 ], McLean, I., Ramsay, S., and Takami, H., eds. (2010).
[2] Lenzen, R. et al., “METIS : System engineering and optical design of the mid-infrared E-ELT instrument,”in [Proc. SPIE vol. 7735 ], McLean, I. S., Ramsay, S. K., and Takami, H., eds. (2010).
[3] Kroes, G. et al., “METIS (cryogenic) optomechanical design and packaging study,” in [Proc. SPIE vol.
7735 ], McLean, I., Ramsay, S., and Takami, H., eds. (2010).
[4] Stuik, R. et al., “The METIS AO system: bringing extreme adaptive optics to the mid IR,” in [Proc. SPIEvol. 7736 ], Ellerbroek, B. L., Lloyd-Hart, M., Hubin, N., and Wizinowich, eds. (2010).
[5] Swinyard, B. M., “Sensitivity estimates for the mid-infrared instrument (MIRI) on the JWST,” in [Proc.SPIE vol. 5487 ], Mather, J., ed., 5487, 785–793 (2004).
[6] Liske, J., “E-ELT Spectroscopic ETC : Detailed Description,” (2008).
[7] Liske, J., “E-ELT Imaging ETC : Detailed Description,” (2008).
[8] Pantin, E. et al., “Direct imaging of exo-planets and zodiacal disks in the thermal regime with the E-ELT/METIS instrument,” in [Proc. SPIE vol. 7735 ], McLean, I., Ramsay, S., and Takami, H., eds. (2010).
[9] Schock, M. et al., “Thirty Meter Telescope Site Testing I: Overview,” PASP 121(878), 384–395 (2009).
[10] Otarola, A. et al., “Thirty Meter Telescope Site Testing X: Precipitable Water Vapor,” PASP 122(890),470–484 (2010).
[11] Rothman, L. et al., “The 2004 molecular spectroscopic database,” J. Quant. Spec. Rad. Trans. 96(2),139–204 (2005).
[12] Jolissaint, L., Veran, J.-P., and Conan, R., “Analytical modeling of adaptive optics: foundations of thephase spatial power spectrum approach.,” JOSA A 23(2), 382–94 (2006).
[13] Fusco, T. et al., “ATLAS: the Laser Tomographic Adaptive Optics module for the E-ELT,” in [1st AO4ELT
conference - Adaptive Optics for Extremely Large Telescopes ], Clenet, Y., Conan, J.-M., Fuscio, T., andRousset, G., eds., 02002 (2010).
[14] Hawkins, G., Sherwood, R., and Djotni, K., “Mid-infrared filters for astronomical and remote sensinginstrumentation,” in [Proc. SPIE vol. 7101 ], Kaiser, N., Lequime, M., and McLeod, H. A., eds., 44(0),710114–710114–15, SPIE (2008).
[15] Hawkins, G. and Sherwood, R., “Cooled infrared filters and dichroics for the James Webb Space TelescopeMid-Infrared Instrument.,” Applied Optics 47(13), C25–34 (2008).
[16] Lagage, P. O. et al., “Successful commissioning of VISIR: The mid-infrared VLT instrument,” The Messen-
ger 117, 12–16 (2004).
[17] Bryson, I. R., Glasse, A. C., and Atad-Ettedgui, E. I., “Michelle, mid-infrared spectrometer and imager,”in [Proc. SPIE Vol. 2198 ], Crawford, D. and Craine, E., eds., 2198, 715–724 (1994).
[18] Fazio, G. G. et al., “The Infrared Array Camera (IRAC) for the Spitzer Space Telescope,” ApJ SS 154(1),10–17 (2004).
[19] “Conceptual Design Review of GMT: MIISE (section 13.3),” (2006).
[20] Kaufl, H.-U. et al., “CRIRES: a high-resolution infrared spectrograph for the VLT,” in [Proc.SPIE vol.
5492 ], Moorwood, A. F. M., ed., 1592–1599 (2004).
[21] Houck, J. R. et al., “The Infrared Spectrograph (IRS) on the Spitzer Space Telescope,” ApJ SS 154(1),18–24 (2004).
[22] ESO, “E-ELT Site Chosen: Worlds Biggest Eye on the Sky to be Located on Armazones, Chile,” (2010).