microtensiometer technique for in situ measurement of soil matric potential and root water...
TRANSCRIPT

Plant and Soil 149: 263-273, 1993. © 1993 Kluwer Academic Publishers. Printed in the Netherlands. PLSO 9684
Microtensiometer technique for in situ measurement of soil matric potential and root water extraction from a sandy soil
DORIS VETI'ERLEIN 1, HORST MARSCHNER' and RAINER HORN 2 ~Institute of Plant Nutrition, Hohenheim University, P.O. Box 700562, D-7000 Stuttgart 70, Germany, and 2Institute of Plant Nutrition and Soil Science, Kiel University, Olshausenstr. 40, D-2300 Kiel, Germany
Received 8 July 1992. Accepted in revised form 11 December 1992
Key words: diurnal variation, microtensiometer, Pennisetum americanum, rehydration, root length, soil matric potential, soil water extraction rate, spatial variation
Abstract
The suitability of microtensiometers to measure the spatial variation of soil matric potential and its diurnal change was tested in a pot experiment with pearl millet (Pennisetum americanum [L.] Leeke) in a sandy soil as the soil dried out.
The temporal and spatial resolution of this technique allowed precise measurement of soil matric potential and thus estimation of soil water extraction from different compartments as well as from the whole rooting zone. The technique also allowed the measurement of rehydration of plants at night and root water uptake rate per unit soil volume or per unit root length. The precision of determination of root water uptake depended greatly on the accuracy of the estimate of hydraulic conductivity, which was derived from a bare soil and might be different for a cropped soil owing to aggregation induced by the root system. A linear relationship between root length and water uptake was found (r 2= 0.82), irrespective of variation in soil water content between compartments and despite the variation in root age, xylem differentiation and suberin formation expected to exist between different compartments of the rooting zone. As the experiment was carried out in a range of soil matric potentials between - 4 and -30 kPa, drought stress did not occur. Further information at lower soil matric potentials are required, to address questions such as the importance of soil resistance for water uptake, or which portion of the root system has to be stressed to induce hormonal signals to the shoot. The microtensiometer technique can be applied to soil matric potentials up to -80 kPa.
Introduct ion
The evaluation of nutrient availability for plant growth requires knowledge of soil water status. The interaction between water and nutrient availability, nutrient uptake and requirement are well established. Solubility and diffusion of nu- trients in the soil depend on soil water content (V6gh et al., 1990). Likewise root morphology (Meisner and Karnok, 1991; Pardales and Kono, 1990; Stasovski and Peterson, 1991) and dis-
tribution (Box et al., 1989; Davies et al., 1986; Turner and Begg, 1981) are influenced by changes in soil water content, as well as nutrient transport with the transpiration stream (Smith, 1991).
In principle two different approaches can be used to describe changes in soil water relations and plant water uptake quantitatively, namely modelling or the direct measurement of the components involved. A number of models are available describing the flux in the soil following

264 Vetterlein et al.
the Darcy-Richards equation combined with an extraction term accounting for root water uptake (Molz, 1981). There are different views on the portion of the root system involved in the water uptake (Gardner, 1960; Herkelrath et al., 1977; Hillel et al., 1976; Lafolie et al., 1991) or on the importance of root length distribution through- out the soil profile for water uptake from differ- ent horizons (Chopart and Vauclin, 1990; Lafolie et al., 1991; Ragab et al., 1990).
Some models require up to 35 input parame- ters (Johnson et al., 1991), but only very few of these parameters can be measured directly. In most cases little is known how these inputs change with time and how they are affected by environmental factors. In view of these difficul- ties direct measurements of the changes of soil water content throughout the profile becomes an attractive approach.
A variety of methods is available for in situ measurement of soil water content or soil matric potential. These are summarized and discussed in detail by Campbell (1988) and Wraith and Baker (1991). None of these methods can be applied universally. Their use may be limited by factors such as resolution in time or space, measurement range, precision, costs of im- plementation, especially if simultaneous mea- surements at several locations are necessary.
In the present work microtensiometers, which have been used so far only for pure soil physical measurements in non-living systems (Gunzel- mann et al., 1987), were tested for their suitabili- ty to measure in the vicinity of a living root system the diurnal changes of soil matric poten- tial. The results were interpreted in respect to internal redistribution of water and root water uptake. Furthermore a possibility is suggested for calculation of soil matric potential data obtained with the microtensiometer technique.
Materials and methods
Cultivation of plants
The soil used was a topsoil (0-30cm) of a psammentic Paleustalf from Sador6, Niger. The soil was low in organic matter (0.3%) and in
NH4F-extractable P (5.6 mgkg-1), had a pH of 4.1 (CaC12), and exchangeable cations in meq kg -1 of 0.83 K, 3.01 Ca and 1.13 Mg. The soil texture was coarse (95% sand fraction), and the water content at ~m=6.3kPa was 13.2 Vol.%.
Root boxes (40 cm height, 20 cm width, 2 cm depth) with a plexiglass front plate were used. Each box contained 2450g sieved (2mm) air dried soil (soil bulk density 1.6 g cm-3), the soil being previously treated per kg soil with 100 mg N as NHnNO 3, 50mg K as KCI and 18mg P as C a ( H P O 4 ) 2. Three seeds of pearl millet (Pen- nisetum americanum (L.) Leeke, cv. ICH 412) were planted asymmetrically in each root box 5 cm from the left side of the box (Fig. 1). After 3 d the number of seedlings was reduced to one per box. The surface of the pots was covered with a 2 cm thick layer of quartz sand to reduce evaporation. At planting the pots were watered from the top to an average water content of 17 Vol.% at which equilibrium of soil water poten- tial between the different positions (Fig. 1) was reached. No water was supplied during the experiment. Out of four root boxes only one was used for measuring change of soil matric poten-
T1 T5
T2 T6
T5 T7
T4 T8
Fig. I. Root box (40 cm height, 20 cm width, 2 cm depth) and code of the compartments, in which microtensiometers were inserted horizontally from the back in the center, 10 cm apart from each other.

tial. The remaining root boxes were used to determine daily water loss by recording their weight once a day. This is further referred to as water-balance method.
Plants were grown for 14 d under controlled climatic conditions at 29°C and 60% relative humidity day and night, 12 /12hday/n igh t light regime and 450 p~E m -2 s -~ photon flux density.
At harvest roots from each compartment were washed free from adhering soil particles and root length density was determined with the grid intersect method (Tennant, 1975).
Measurement of soil matric potential and calculation of extraction rates
Microtensiometers were constructed according to Gunzelmann et al. (1987) with slight modifica- tions. Specially manufactured P80-ceramic capil- laries (K6nigliche Porzellanmanufaktur, Berlin) with a length of 5 mm, a diameter of 1 mm and a
In situ measurement of soil matric potential 265
wall thickness of only 0.3 mm were used as ceramic cells. They were melted into a glass tube (20 mm length, 3 mm outer diameter) which was connected to a pressure transducer (16PC15GF, Honeywell Division, USA) via a plexiglass body. One microtensiometer was inserted horizontally from the back of the root boxes through drill holes (0.5 cm diameter) in the center of each of 8 compartments as indicated in Figure 1, the drill holes being sealed with Bostic-Prestik AE (Fa. Renner, 7000 Stuttgart, Germany) to avoid water loss. Soil matric potential in each compart- ment was registered every 36min throughout a 14 day period. Due to only very small changes during the first 10 days after planting (DAP), data for this period are not presented.
To obtain an estimate of changes of soil water content from the measurement of changes of soil matric potential the relationship between the two parameters (Fig. 2) was derived using equation (1) given by van Genuchten (1980).
50
, . - , 4O
0
c 30
E 0
~ 2o
o ff~ 10
1,000
o 0.1
o o
0.001
~.) 1E-05
O °
i
,J
O. 1 1 10 100 1,000 0 1 2 30 40
Soil matric potential [-kPa] Soil water content [Vol.%] Fig. 2. Relationship between soil water content, soil matric potential and hydraulic conductivity in a sandy topsoil from Sador6, Niger.

266 Vetterlein et al.
(0+ + Or) 0 = O r "{- (1 + (~*l/trn)n) m (m = 1 - l / n ) (1 )
The residual water content (Or), the saturated water content (0s) and a set of data points for soil water content (0) and soil matric potential (qtm), determined with a pressure apparatus (Klute, 1986), were taken from the work of Bley (1990), who measured these soil characteristics on core samples taken from the same field from which the soil for the present experiment was taken. Because the pore size distribution in sandy soils is mainly texture dependent refilled soil cores with the same bulk density as under in situ conditions should have identical water retention curve characteristics. Hysteresis, which was ob- served under field conditions as a result of frequent drying and rewetting (Bley, 1990) was disregarded, because only one drying cycle was monitored.
Similar, a relationship between hydraulic con- ductivity (ku) and soil matric potential (qtm) (Fig. 2) was established according to Equation (2) given by van Genuchten (1980), as it was re- quired for flux calculations.
kf*(1 - (a*~m)n-l*(1 + (O/*~Fm)n)-m) 2 k u = (1 + (a*~m)n) m/2
(m = 1 - l /n ) (2)
Two estimates were made for the relationship between k u and ~m" One derived from a satu- rated hydraulic conductivity (kf) of 237 cm d -1 determined in the field by the infiltration method of Hillel et al. (1972), the second one for a saturated hydraulic conductivity of 370 cm d -1 determined in the laboratory with a waterper- meameter (Eijkelkamp) with a constant pressure gradient (Klute, 1965).
The slope of the linear regression between soil water content and time (see Fig. 5) for each light and dark period was calculated for each com- partment, representing the soil water extraction rate (we) as suggested by Wraith and Baker (1991). Soil water extraction rate was expressed as change in volumetric water content per hour [Vol.%h-1]. As the size of the zone of sensitivity around a microtensiometer varies with soil water content, no fixed volume can be assigned as
reference for soil water extraction rate derived from tensiometer measurements.
Nevertheless, as an approximation, tensiome- ter readings are assumed to be representative for the whole compartment in which they are lo- cated (Fig. 1). The water extraction from each compartment (We) [mL 12h -1] can be calcu- lated, and by summing up values from single compartments, water extraction from the whole root box (2We) can be quantified.
Water extraction from a compartment was assumed to be the result of total net water flux in the soil (Qs) between neighbouring compart- ments and water uptake by plant roots (Qr). Therefore water uptake by plant roots can be calculated according to Equation (3):
Qr = We - Qs (3)
k'*(,Ph(Ti ) -- ,p'h(Tj))*A Qs = Dz (4)
k' u = (ku(Ti) + k.(Tj)) 2 (5)
Dz = distance between microtensiometer posi- tions A = s u r f a c e area of contact between neigh- bouring compartments qt h = soil hydraulic potential Ti, Tj = neighbouring compartments
Water uptake rate per unit root length (q) was calculated in three different ways:
q* = 2 W e / 2 RE (6)
qw e = slope of the linear regression between We and RL (7)
qor = slope of the linear regression between Q r and RL (8)
RL = root length in a compartment.
Results
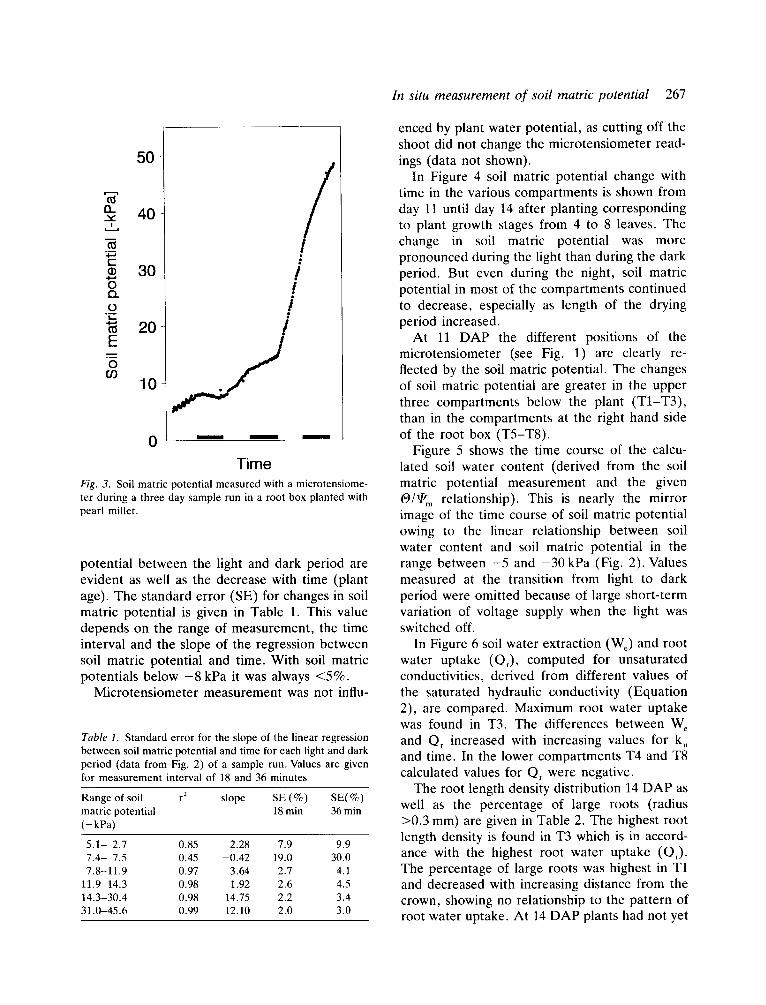
A representative example of measurement of soil matric potential with a microtensiometer during a three day period without water supply is given in Figure 3. Differences in changes of soil matric
In situ measurement of soil matric potential 267
50
t~ fl_ ,,, 4 0
t~ t"- t • 30 / o t o . •
o /
Time F/g. 3. Soil matric potential measured with a microtensiome- ter during a three day sample run in a root box planted with pearl millet.
potential between the light and dark period are evident as well as the decrease with time (plant age). The standard error (SE) for changes in soil matric potential is given in Table 1. This value depends on the range of measurement, the time interval and the slope of the regression between soil matric potential and time. With soil matric potentials below - 8 kPa it was always <5%.
Microtensiometer measurement was not inf lu-
Table 1. Standard error for the slope of the linear regression between soil matric potential and time for each light and dark period (data from Fig. 2) of a sample run. Values are given for measurement interval of 18 and 36 minutes
Range of soil r 2 slope SE (%) SE(%) matric potential 18 min 36 min ( - k P a )
5 .1- 2.7 0.85 2.28 7.9 9.9 7 .4- 7.5 0.45 -0 .42 19.0 30.0 7.8-11.9 0.97 3.64 2.7 4.1
11.9-14.3 0.98 1.92 2.6 4.5 14.3-30.4 0.98 14.75 2.2 3.4 31.0-45.6 0.99 12.10 2.0 3.0
enced by plant water potential, as cutting off the shoot did not change the microtensiometer read- ings (data not shown).
In Figure 4 soil matric potential change with time in the various compartments is shown from day 11 until day 14 after planting corresponding to plant growth stages from 4 to 8 leaves. The change in soil matric potential was more pronounced during the light than during the dark period. But even during the night, soil matric potential in most of the compartments continued to decrease, especially as length of the drying period increased.
At 11 DAP the different positions of the microtensiometer (see Fig. 1) are clearly re- flected by the soil matric potential. The changes of soil matric potential are greater in the upper three compartments below the plant (T1-T3), than in the compartments at the right hand side of the root box (T5-T8).
Figure 5 shows the time course of the calcu- lated soil water content (derived from the soil matric potential measurement and the given O / ~ m relationship). This is nearly the mirror image of the time course of soil matric potential owing to the linear relationship between soil water content and soil matric potential in the range between -5 and -30 kPa (Fig. 2). Values measured at the transition from light to dark period were omitted because of large short-term variation of voltage supply when the light was switched off.
In Figure 6 soil water extraction (We) and root water uptake (Qr), computed for unsaturated conductivities, derived from different values of the saturated hydraulic conductivity (Equation 2), are compared. Maximum root water uptake was found in T3. The differences between W e and Qr increased with increasing values for k u and time. In the lower compartments T4 and T8 calculated values for Qr were negative.
The root length density distribution 14 DAP as well as the percentage of large roots (radius >0.3 mm) are given in Table 2. The highest root length density is found in T3 which is in accord- ance with the highest root water uptake (Qr)- The percentage of large roots was highest in T1 and decreased with increasing distance from the crown, showing no relationship to the pattern of root water uptake. At 14 DAP plants had not yet

268 Vetterlein et al.
35 35
30
~' 25
20
E 15-
.~ 10-
5-
0
o
, • **** * * * * . ~ o o °~
30-
25-
'~ 20-
E '~ 15"
E 10-
5
0
I T5 T6 T7 T~ ]
m m i j
Time Time Fig. 4. Diurnal change of soil matric potential from l l - 1 4 D A P in different soil compar tments of the rooting zone of a pearl millet plant.
14 14
12
~ e
~ 6
o%0 o ~ ~ , , . * * * *o ~ o o
",,z~
m m m
.?,, [TS ; 7-T81 I A A ~ A • L_ . . . . . . . . . . . . . _ J
/ " . = h~, 'LA
_, / • ".%,~==. r h
- o ~ • • • re'A" •
E / - ,-_._ . , .
o - - - - ! - - _ " , , . - , . . ",,..~. --- ___...~ : _..,,~,,,, ..
~ ----_-",,,.,. ---- ">.
4
Time Time Fig. 5. Diurnal change of soil water content from 11-14 DAP in different soil compar tments of the rooting zone of a pearl millet plant.

In situ measurement of soil matric potential 269
25
20
15
10
5
0 t - O
o ~
O 25
ao
11 DAP
13 DAP
d 10
0 - i
(5) . . . .
T1 T2 T3 T4
r~,h r im r-Il l R
ring OI!1 r~
I I
T5 T6 T7
12 DAP [E]WelIQr(237) IIQr(370) ]
14 DAP
T8 T1 T2 T3 T4 T5 T6 T7 T8 Fig. 6. Comparison between soil water extraction (We) and root water uptake (Q,) from different compartments 11-14 DAP. Root water uptake is given for different values of saturated hydraulic conductivity.
Table 2. Root length density distribution throughout the root box 14 DAP. The percentage of roots with a radius > 0.3 mm is shown separately
Compar tment Root length % Roots with density (cm cm -3) radius > 0.3 mm
T1 2.8 19 T2 5.3 10 T3 6.7 7 T4 2.4 2 T5 0.3 2 T6 1.0 0 T7 1.0 0 T8 0.0 0
fully explored the root box and no roots were found in T8.
At 14 DAP the linear regression between root water uptake (Qr<237)) and root length (RL) was with r 2 =0.82 much closer than between soil water extraction (We) and root length (RL) with r 2 = 0.47 (Fig. 7). The Qr values of the top (T1, T5) and bottom compartments showed the largest deviation from the calculated regression line. The deviation of T1 and T5 could be explained by water loss through evaporation, which has been disregarded in the calculations.
The mean water uptake rates (q) calculated from Equations (6)-(8) are given in Table 3. Reasonable close agreement between the differ- ent ways of calculation was only found between q* and qo,(237)" Close agreement was also found between the total water extraction derived from soil matric potential measurements (EWe) and the daily water consumption determined with the water-balance method (Table 4).
Discussion
The microtensiometer method proved to be suitable for measuring soil matric potential be- tween 0 to -80kPa , which coincides with the range of soil water content relevant for plant growth (40-0.8 Vol.%) in the sandy soil used. The potential resolution in time was in the range of seconds and much higher than required. The size of the sensors would have allowed a spatial resolution of about 5 mm (diameter of the glass capillary 3 mm). A similar resolution in time as with microtensiometers can be obtained with most other methods. However, the relatively

270 Vetterlein et al.
20 20
T3
.._. 15 r 2 15 / ~ r 2
- - 1 0 E "P- ,'± T1
T~AT7 T8 _ T~ 6 ?xT4
0 / 0
LT8 &T4 = I I ] r p I I
0 300 600 900 1,200 1,500 0 300 600 900 1,200 1,500
Root length [cm] Root length [cm] Fig. 7. Linear regression between root water uptake (Q,(237)) and root length (RL) and between soil water extraction (We) and root length (RL) 14 DAP.
Table 3. Comparison between root water uptake rates during light period, obtained from equations (6)-(8)
DAP ( g L 12 h -l cm -~)
q* qw~ qor(237) qor(370) 14 11.9 6.0 13.0 17.0
Table 4. Daily water consumption (ET) measured with the water-balance method in comparison with total soil water extraction ( ~ W ) derived from the microtensiometer mea- surements
DAP (mL)
ET ~W~ .~W~(day) .~ W~(night)
11 18 20 16 4 12 27 24 19 5 13 32 32 25 7 14 54 n.d. 45 n.d.
high spatial resolution of the microtensiometers can neither be obtained with TDR-sensors and especially not with thermocouple psychrometers, which in addition, have a low accuracy in the range of - 4 to -80 kPa and which are rather sensitive to temperature changes.
The accuracy of the measurement with mi- crotensiometers (Table 1) depended on voltage
fluctuations of the power supply system which were larger during the day than at night (Fig. 3). The error induced by these fluctuations was larger at high (low values) than at low soil matric potentials (high values). Highest errors were observed at very low changes of soil matric potential with time. Errors could be reduced by shortening the interval of measurements. Tem- perature effects were excluded by maintaining the temperature constant day and night. The time required for equilibration between soil water and tensiometer was minimized due to the very small wall thickness of 0.3mm and the shape of the ceramic cells; it depended mainly on soil hydraulic conductivity.
The equilibrium of soil hydraulic potential between different positions in the root box, which was established at planting, did not change much until 11 DAP (Fig. 4) but disappeared thereafter, as soil dried out progressively until 14DAP. It could not be re-established even during the dark periods, when transpiration was close to zero. In a similar experiment under the same climatic conditions a transpiration rate of 0.1/xmol m -2 s -l at night was measured with a minicuvette system (Walz Co., D-8521 Effel-

In situ measurement of soil matric potential 271
trich, Germany). This was in agreement with Johnson et al. (1991), who predicted from their model, that the night is too short to reach equilibrium. In the high range of soil matric potential covered in the present experiment spatial variation of soil matric potential increased continuously with time, contradicting observa- tions of Wraith and Baker (1991), that water is in general preferentially taken up from the wettest soil compartments. As a consequence of increasing variation in soil water distribution (Fig. 5) increasing variation can be assumed for diffusion of nutrients (Bhadoria et al., 1991; V6gh et al., 1990) and root growth (Meisner and Karnok, 1991; Pardales and Kono, 1990; Stasov- ski and Peterson, 1991; Vartanian, 1981) and thus for nutrient uptake. The formation of such gradients of soil water distribution depends on the soil texture and is more likely to occur in a sandy soil than in a clay soil. The knowledge of these gradients in soil water distribution is im- portant for prediction of nutrient uptake from soils with high spatial variability in nutrient distribution, particularly when fertilizer has been placed (Pan and Hopkins, 1991; Simpson and Pinkerton, 1989). As roots may act as sensors for decreasing soil matric potential, producing hor- mones as a messenger to the shoot (Davies and Zhang, 1991), it is crucial to know which part of the root system is experiencing drought stress and the extent of the stress.
Some soil water extraction did occur during the dark period (Table 4), although it was much lower than during the light period. The flux at night could partly be explained by the gradients of soil matric potential between compartments created by root water uptake during the day. However, decrease of total soil water content during the dark period at very low transpiration could indicate rehydration of plant tissue as assumed in the model of Fernfindez and McCree (1991). This would also be in agreement with the observations of Huck et al. (1970), who found a diurnal variation in root diameter. Another explanation could be based on Gardner's single root model (1960). Gardner predicted water potential gradients between the bulk soil and the root surface during the light period which are balanced at night. However, in the present experiment with the lowest bulk soil matric
potential of about -30kPa , a maximum root water uptake rate of 24/zl d -1 cm -1 and an inter root distance of 4ram, no steep gradients be- tween bulk soil and root surface could be as- sumed. Thus rehydration of plants is more likely and in agreement with the observations, that plants with strong wilting symptoms in the even- ing recovered completely during the dark period without watering or change of relative humidity during the night.
If the assumptions for the calculation of root water uptake (Qr) were correct, Qr should give a closer regression with root length than soil water extraction (We). This was true for 14 DAP where root length distribution was determined (Fig. 7). With increasing spatial variability in soil matric potential the necessity to calculate Qr instead of using W e as a measure for root water uptake increased (Fig. 6). Garcia et al. (1988) did not find a single linear regression between soil water extraction and root length valid for all compart- ments, most likely because they did not take into account the water flux between compartments. The accuracy with which Q~ can be calculated depends strongly on ku, which in turn is derived from kf (see Equation (2)). Figure 6 shows that the flux was clearly overestimated using k u de- rived from kf = 370cm d i for negative values occurred in T4 and T8. Even k u derived from k e= 237cmd -~ was probably still slightly too high, but root water uptake rate per unit root length (qOr(237)) was close to the actual mean root water uptake rate (~We/~RL) (Table 3). The question remains whether hydraulic conduc- tivity measured in a bare soil can give a good estimate for a cropped soil.
Hydraulic conductivity may change with in- creasing root length density due to aggregation of the soil by the roots, microorganisms and fugal hyphae (Boyle et al., 1989; Tisdall, 1991) or changes in pore size distribution and continui- ty of pores (Whiteley, 1989).
Calculation of root water uptake rate per unit root length (q) is further complicated by the lack of knowledge about the size of the interface between soil and root which might be a function of soil water content (Herkelrath et al., 1977) or of soil bulk density (Kooistra, et al. 1992).
No matter how q is calculated it can only represent a mean uptake rate. Hydraulic conduc-

272 Vetterlein et al.
tivity of roots is known to vary with root diam- eter and age, which is reflected in differences in xylem differentiation (Huang et al., 1991; Mc- Cully and Canny, 1988) and suberin formation (Clarkson et al., 1987). For the present experi- ment a gradient in age might be assumed with increasing distance from the crown, as can be shown for root diameter (Table 2). This would contradict the linear relationship between root water uptake (Qr) and root length (RL). In the root system of the present experiment new roots were formed continuously in all compartments. The expected gradient in age might therefore have been offset by the large amount of new roots. As a consequence all parameters affecting hydraulic conductivity may vary as much within a compartment as between compartments and could thus be neglected as long as a whole root system and not only single root segments are investigated.
As the differences in root water uptake be- tween compartments could be explained solely by root length, soil water content, which varied considerably between compartments, had no influence on root water uptake rate, at least not in the range of soil water content covered in the present experiment.
A linear increase of root water uptake with increasing root length density was observed up to a root length density of 6.7 cm cm -3, a value for root length density also found in pearl millet under field conditions (Hafner et al., unpub- lished). It is likely that the relationship becomes non-linear once root length density increases further and competition for water occurs be- tween roots as was observed by Brown et al. (1987) under field conditions. Brown et al. (1987) defined a threshold value for water up- take without competition between roots of only 1 cm cm -3 for their soils. Threshold levels in- crease as unsaturated soil hydraulic conductivity decreases which may explain the high value in the present experiment. An inverse relationship between root length and root water uptake rate as was described by Bruckler et al. (1991) is difficult to explain, unless all root length den- sities were above the threshold level for their soil, or plants were compared which differed in root/shoot ratio (Eavis and Taylor, 1979).
From our results which show a close relation-
ship between root water uptake and root length density the usefulness of models which ignore root length density as an input parameter may be questioned (Chopart and Vauclin, 1990; Ehlers, 1978; Ragab et al., 1990).
Acknowledgements
This study was part of the R3S program, funded by the EEC. We thank Mr. Ernest A Kirkby for correcting the English text, and Dr. Thomas Baumgartl and Mr. Uwe Hell for their advice concerning construction of the microtensiome- ters.
References
Bhadoria P B S, Kaselowsky J, Claassen N and Jungk A 1991 Phosphate diffusion coefficients in soil as affected by bulk density and water content. Z. Pflanzenernaehr. Bodenkd. 154, 53-57.
Bley J 1990 Experimentelle und modellanalytische Unter- suchungen zum Wasser- und Nfihrstoffhaushalt von Perl- hirse (Pennisetum americanum L.) im Sfidwest-Niger. Dissertation, Institut f/Jr Bodenkunde, Universit~it Hohenheim. 132 p.
Box J E Jr, Smucker A J M and Ritchie J T 1989 Mini- rhizotron installation techniques for investigating root responses to drought and oxygen stresses. Soil Sci. Soc. Am. J. 53, 115-118.
Boyle M, Frankenberger W T Jr and Stolzy L H 1989 The influence of organic matter on soil aggregation and water infiltration. J. Prod. Agric. 2, 290-299.
Brown S C, Gregory P J and Wahbi A 1987 Root characteris- tics and water use in mediterranean environments. In Drought Tolerance in Winter Cereals. Eds. J P Srivastava, E Porceddu, E Acevedo and S Varma. pp 275-283. Wiley, Chichester, New York, Toronto.
Bruckler L, Lafolie F and Tardieu F 1991 Modeling root water potential and soil-root water transport: Field com- parisons. Soil Sci. Soc. Am. J. 55, 1213-1220.
Campbell G S 1988 Soil water potential measurement: An overview. Irrig. Sci. 9, 265-273.
Chopart J L and Vauclin M 1990 Water balance estimation model: Field test and sensitivity analysis. Soil Sci. Soc. Am. J. 54, 1377-1384.
Clarkson D T, Robards A W, Stephens J E and Stark M 1987 Suberin lamellae in the hypodermis of maize (Zea mays) roots: Development and factors affecting the permeability of hypodermal layers. Plant, Cell Environ. 10, 83-93.
Davies W J and Zhang J 1991 Root signals and the regulation of growth and development of plants in drying soil. Ann. Rev. Physiol. Plant Mol. Biol. 42, 55-76.
Davies W J, Metcalfe J, Lodge T A and da Costa A R 1986

In situ measurement o f soil matric potential 273
Plant growth substances and the regulation of growth under drought. Aust. J. Plant Physiol. 13, 105-125.
Eavis B W and Taylor H M 1979 Transpiration of soybeans as related to leaf area, root length, and soil water content. Agron. J. 71, 441-445.
Ehlers W 1978 Wassergehalts- und Wasserspannungsmes- sungen im Felde zur Bilanzierung des Bodenwasser- haushalts. Mitteilgn. Dtsch. Bodenkundl. Gesellsch. 26, 115-132.
Fernandez C J and McCree K J 1991 Simulation model for studying dynamics of water flow and water status in plants. Crop Sci. 31, 391-398.
Garcia F, Cruse R M and Blackmer A M 1988 Compaction and nitrogen placement effect on root growth, water depletion, and nitrogen uptake. Soil Sci. Soc. Am. J. 52, 792-798.
Gardner W R 1960 Dynamic aspects of water availability to plants. Soil Sci. 89, 63-73.
Genuchten M Th van 1980 A closed-form equation for predicting the hydraulic conductivity of unsaturated soils. Soil. Sci. Soc. Am. J. 44, 892-898.
Gunzelmann M, Hell U and Horn R 1987 Die Bestimmung der Wasserspannungs-/Wasserleitf~ihigkeits-Beziehung in Bodenaggregaten. Z. Pflanzenernaehr. Bodenkd. 150, 400-402.
Herkelrath W N, Miller E E and Gardner W R 1977 Water uptake by plants. II. The root contact model. Soil Sci. Soc. Am. J. 41, 1039-1043.
Hillel D, Krentos V D and Stylianou Y 1972 Procedure and test of an internal drainage method for measuring soil hydraulic characteristics in situ. Soil Sci. 114, 395-400.
Hillel D, Talpaz H and van Keulen H 1976 A macroscopic- scale model of water uptake by a nonuniform root system and of water and salt movement in the soil profile. Soil Sci. 121, 242-255.
Huang B R, Taylor H M and McMichael B L 1991 Effects of temperature on the development of metaxylem in primary wheat roots and its hydraulic consequence. Ann. Bot. 67, 163-166.
Huck M G, Klepper B and Taylor H M 1970 Diurnal variations in root diameter. Plant Physiol. 45, 529-530.
Johnson I R, Melkonian J J, Thornley H M and Riha S J 1991 A model of water flow through plants incorporating shoot/root message control of stomatal conductance. Plant, Cell Environ. 14, 531-544.
Klute A 1965 Laboratory measurement of hydraulic conduc- tivity of unsaturated soil. In Methods of Soil Analysis. Agronomy No. 9. Ed. C A Black. pp 253-261. American Society of Agronomy, Madison, WI.
Klute A 1986 Water retention. Laboratory methods. In Methods of Soil Analysis, Part 1: Physical and Miner- alogical Methods. Agronomy monograph No. 9. Ed. A Klute. pp 635-662. Am. Soc. Agron., Madison, WI.
Kooistra M J, Schoonderbeek D, Boone F R, Veen B W and
Van Noordwijk M 1992 Root-soil contact of maize, as measured by a thin section technique. II. Effects of soil compaction. Plant and Soil 139, 119-129.
Lafolie F, Bruckler L and Tardieu F 1991 Modeling root water potential and soil-root water transport. I. Model presentation. Soil Sci. Soc. Am. J. 55, 1203-1212.
McCully M E and Canny M J 1988 Pathways and processes of water and nutrient movement in roots. Plant and Soil 111, 159-170.
Meisner C A and Karnok K J 1991 Root hair occurrence and variation with environment. Agron. J. 83, 814-818.
Molz F J 1981 Models of water transport in soil-plant system: A review. Water Resources Res. 17, 1245-1260.
Pan W L and Hopkins A G 1991 Plant development and N and P use of winter barley. I. Evidence of water stress induced P deficiency in an eroded toposequence. Plant and Soil 135, 9-19.
Pardales J R Jr and Kono Y 1990 Development of sorghum root system under increasing drought stress. Jpn. J. Crop Sci. 59, 752-761.
Ragab R, Beese F and Ehlers W 1990 A soil water balance and dry matter production model. I. Soil water balance of oat. Agron. J. 82, 152-156.
Simpson J R and Pinkerton A 1989 Fluctuations in soil moisture, and plant uptake of surface applied phosphate. Fertil. Res. 20, 101-108.
Smith J A C 1991 Ion transport and the transpiration stream. Bot. Acta 104, 416-421.
Stasovski E and Peterson C A 1991 The effect of drought and subsequent rehydration on the structure and vitality of Zea mays seedling roots. Can. J. Bot. 69, 1170-1178.
Tennant D 1975 A test of a modified line intersect method of estimating root length. J. Ecol. 63, 995-1001.
Tisdall J M 1991 Fungal hyphae and structural stability of soil. Aust. J. Soil Res. 29, 729-743.
Turner N C and Begg J E 1981 Plant water relations and adapatation to stress. Plant and Soil 58, 97-131.
Vartanian N 1981 Some aspects of structural and functional modifications induced by drought in root systems. Plant and Soil 63, 83-92.
V6gh K R, Fuleky G Y and Varro T 1990 Phosphorus diffusion to barley (Hordeum vulgare) roots as influenced by moisture and phosphorus content of soils. In Plant Nutrition-Physiology and Applications. Ed. M L van Beusichem. pp 147-151. Kluwer Academic Publishers, Dordrecht, The Netherlands.
Whiteley G M 1989 The deformation of soil by penetrome- ters and root tips of Pisum sativum. Plant and Soil 117, 201-205.
Wraith J M and Baker J M 1991 High-resolution measure- ment of root water uptake using automated time-domain reltectometry. Soil. Sci. Soc. Am. J. 55, 928-932.
Section editor: B E Clothier